Thalidomide promotes degradation of SALL4, a transcription factor implicated in Duane Radial Ray syndrome
- Dana-Farber Cancer Institute, United States
- Harvard Medical School, United States
- Brigham and Women’s Hospital, United States
Figures
Figure 1 with 2 supplements
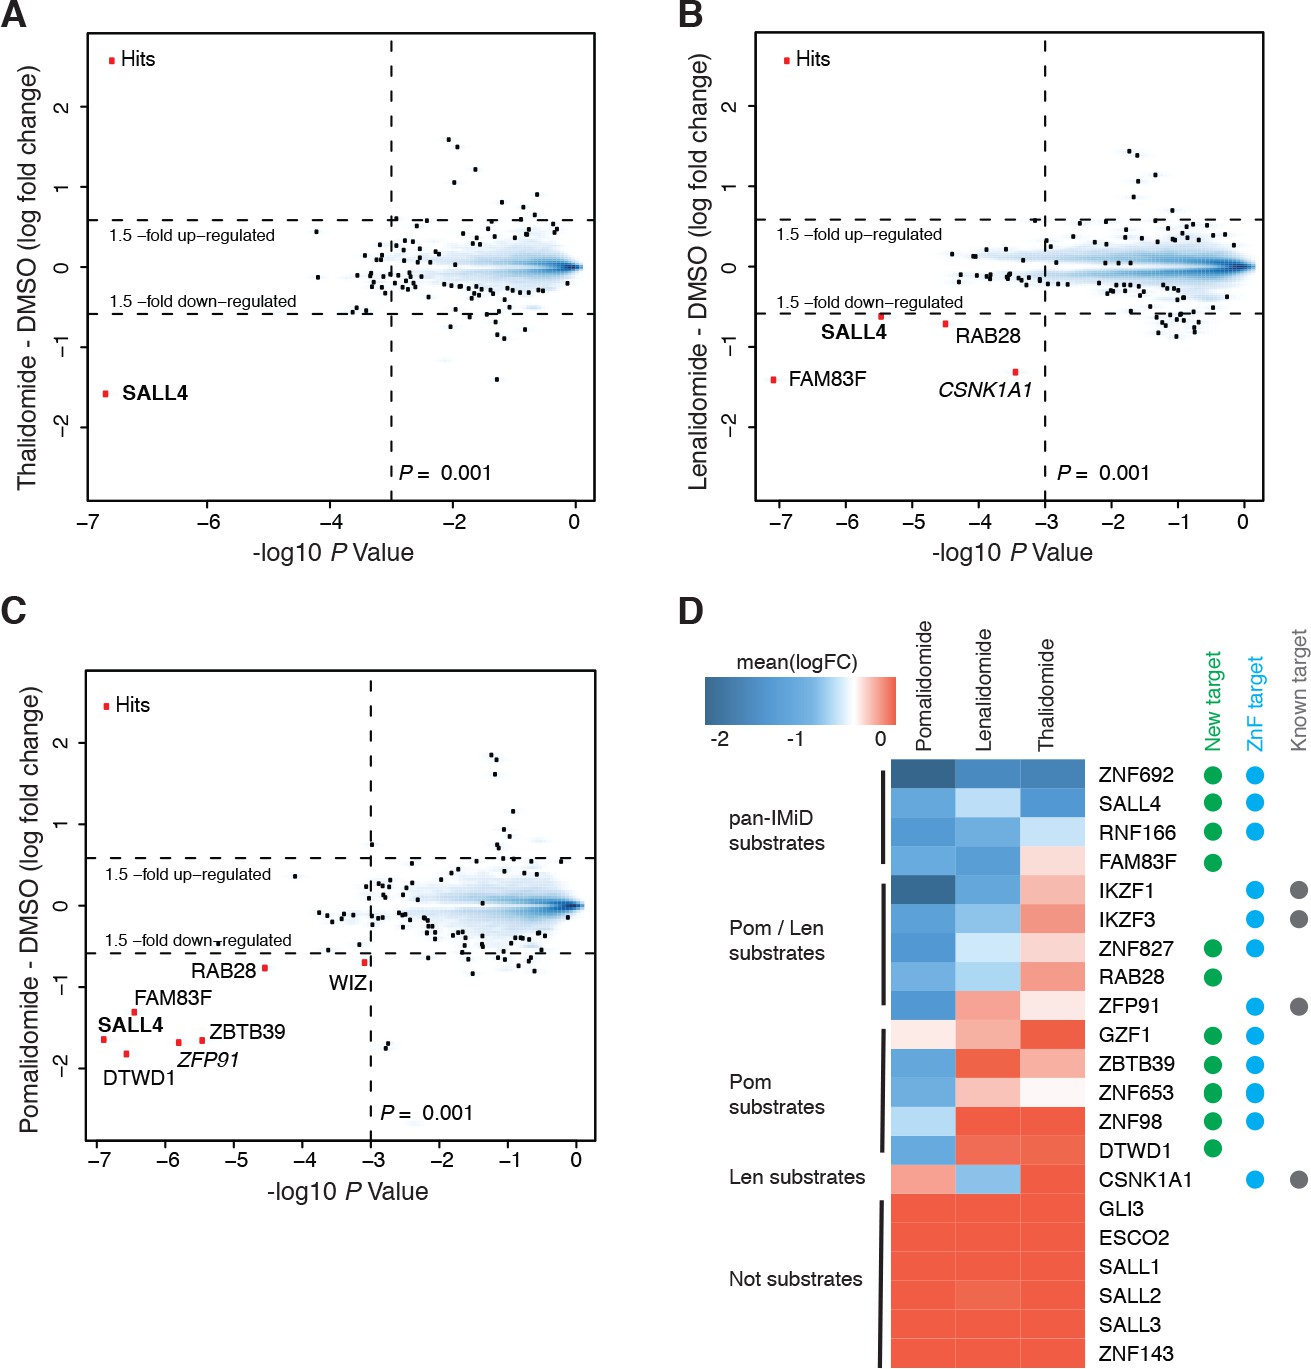
Identification of SALL4 as an IMiD-dependent CRL4CRBN substrate.
(A–C) Scatter plot depicting identification of IMiD-dependent substrate candidates. H9 human embryonic stem cells (hESC) were treated with 10 µM thalidomide (A), 5 µM lenalidomide (B), 1 µM pomalidomide (C), or DMSO control, and protein abundance was analyzed using TMT quantification mass spectrometry (see Materials and methods for details). Significant changes were assessed by a moderated t-test as implemented in the limma package (Ritchie et al., 2015), with the log2 fold change (log2 FC) shown on the y-axis, and negative log10 p values on the x-axis (two independent biological replicates for each of the IMiDs, or three independent biological replicates for DMSO). (D) Heatmap displaying the mean log2 FC of the identified IMiD-dependent targets comparing treatment with thalidomide, lenalidomide, and pomalidomide. Mean log2 FC values were derived from averaging across proteomics experiments in four different cell lines (hESC, MM1s, Kelly, SK-N-DZ). The heatmap colors are scaled with blue indicating a decrease in protein abundance (−2 log2 FC) and red indicating no change (0 log2 FC) in protein abundance. Targets newly identified in this study are marked with a green dot, ZnF containing targets with a cyan dot, and previously characterized targets with a gray dot. Substrates are grouped according to their apparent IMiD selectivity in the mass spectrometry-based proteomics. It should be noted that this does not refer to absolute selectivity but rather relative selectivity.
-
Figure 1—source data 1
Output from limma processing of hES cells thalidomide vs. DMSO mass spectrometry experiment.
- https://doi.org/10.7554/eLife.38430.006
-
Figure 1—source data 2
Output from limma processing of hES cells lenalidomide vs. DMSO mass spectrometry experiment.
- https://doi.org/10.7554/eLife.38430.007
-
Figure 1—source data 3
Output from limma processing of hES cells pomalidomide vs. DMSO mass spectrometry experiment.
- https://doi.org/10.7554/eLife.38430.008
-
Figure 1—source data 4
Output from limma processing of Kelly cells thalidomide vs. DMSO mass spectrometry experiment.
- https://doi.org/10.7554/eLife.38430.009
-
Figure 1—source data 5
Output from limma processing of Kelly cells lenalidomide vs. DMSO mass spectrometry experiment.
- https://doi.org/10.7554/eLife.38430.010
-
Figure 1—source data 6
Output from limma processing of Kelly cells pomalidomide vs. DMSO mass spectrometry experiment.
- https://doi.org/10.7554/eLife.38430.011
-
Figure 1—source data 7
Output from limma processing of MM1s cells thalidomide vs. DMSO mass spectrometry experiment.
- https://doi.org/10.7554/eLife.38430.012
-
Figure 1—source data 8
Output from limma processing of MM1s cells lenalidomide vs. DMSO mass spectrometry experiment.
- https://doi.org/10.7554/eLife.38430.013
-
Figure 1—source data 9
Output from limma processing of MM1s cells pomalidomide vs. DMSO mass spectrometry experiment.
- https://doi.org/10.7554/eLife.38430.014
-
Figure 1—source data 10
Output from limma processing of SK-N-DZ cells pomalidomide vs. DMSO mass spectrometry experiment.
- https://doi.org/10.7554/eLife.38430.015
-
Figure 1—source data 11
Output from limma processing of SK-N-DZ cells CC-220 vs. DMSO mass spectrometry experiment.
- https://doi.org/10.7554/eLife.38430.016
-
Figure 1—source data 12
Output from limma processing of SK-N-DZ cells dBET57 vs. DMSO mass spectrometry experiment.
- https://doi.org/10.7554/eLife.38430.017
-
Figure 1—source data 13
Output from limma processing of SK-N-DZ cells pomalidomide vs. DMSO mass spectrometry experiment.
- https://doi.org/10.7554/eLife.38430.018
-
Figure 1—source data 14
Output from limma processing of SK-N-DZ cells pomalidomide +MLN4924 vs. DMSO mass spectrometry experiment.
- https://doi.org/10.7554/eLife.38430.019
-
Figure 1—source data 15
Uncropped immunoblots.
Uncropped western blots with the corresponding main or supplementary figure numbers shown. GAPDH loading control is presented with each plot. Size markers (kDa) are indicated. Cyan boxes highlight the cropped segment presented in main or supplementary figures. SALL4 is expressed in two isoforms, which we observe at 150 and 100 kDa apparent molecular weights. Different cell lines appear to express different relative levels of these isoforms. Additional variance in apparent molecular weight may arise from post-translational modifications.
- https://doi.org/10.7554/eLife.38430.020
Figure 1—figure supplement 1
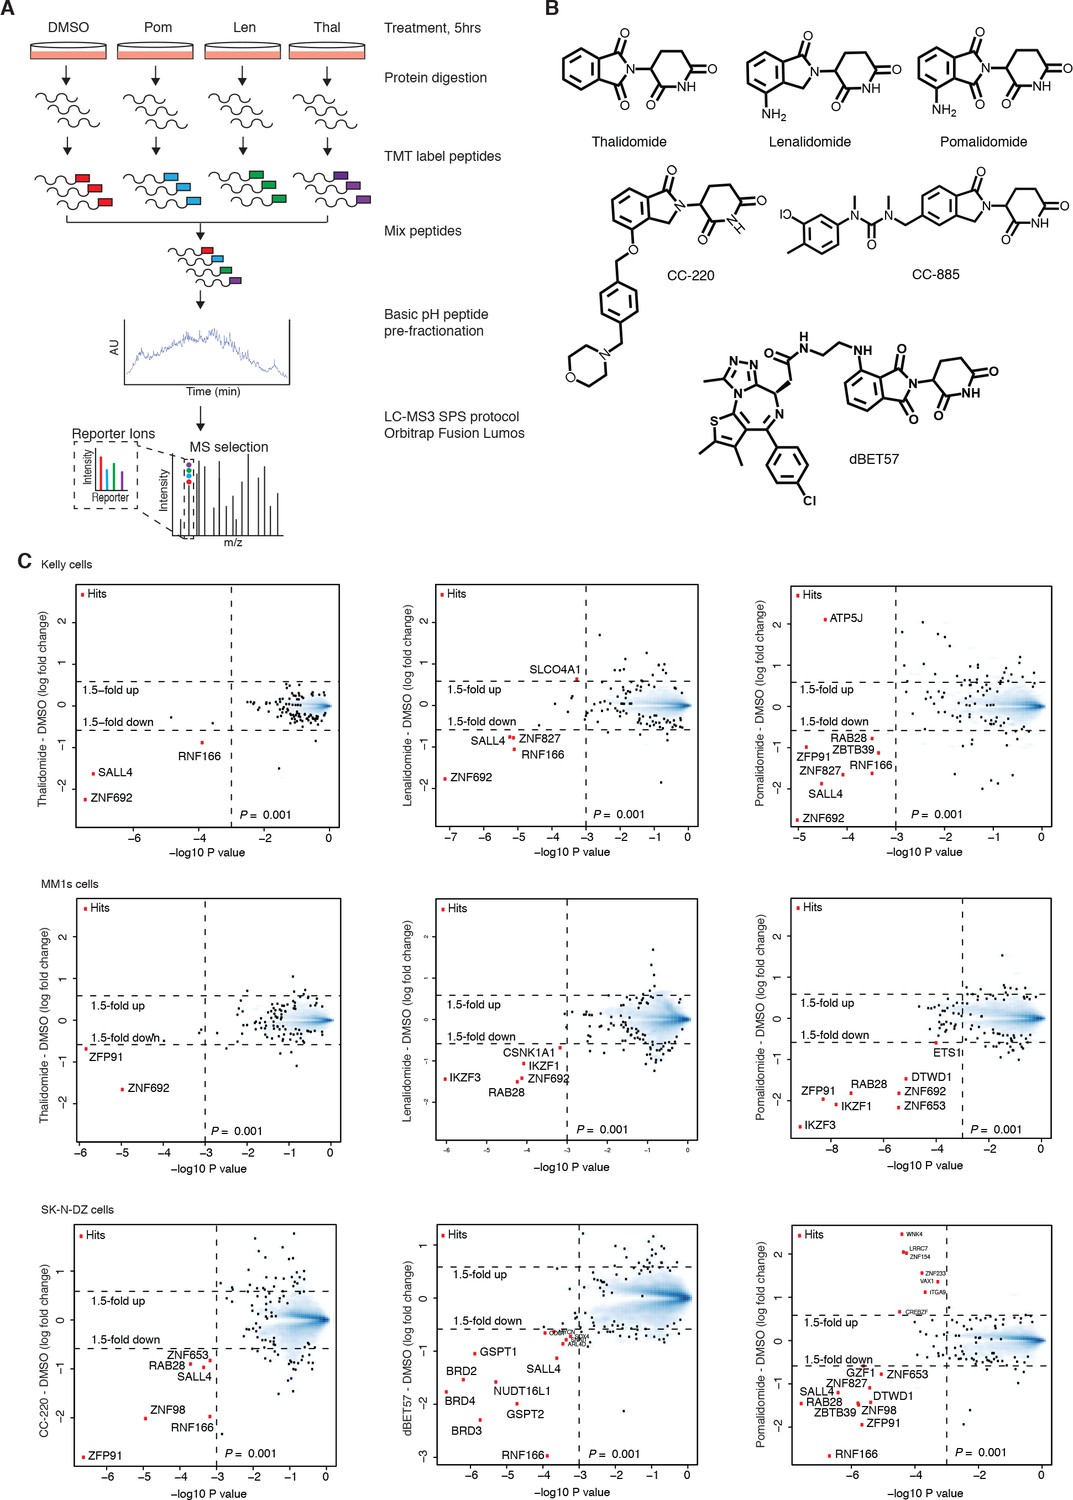
Mass spectrometry profiling of IMiDs.
(A) Schematic representation of the mass spectrometry-based proteomics workflow used for IMiD profiling (the raw output of mass spectrometry processing is provided in Figure 1—source data 1–14). (B) Chemical structures of compounds used in this study. (C) Scatter plots depicting identification of treatment-dependent substrate candidates. Kelly cells were treated with 10 µM thalidomide (3× biological replicates), 5 µM lenalidomide (3× biological replicates), 1 µM pomalidomide, or DMSO as a control (3× biological replicates) for 5 h (top row). MM1s cells were treated with 10 µM thalidomide (2× biological replicates), 5 µM lenalidomide (2× biological replicates), 1 µM pomalidomide (2× biological replicates), or DMSO as a control (3× biological replicates) for 5 h (middle row). SK-N-DZ cells were treated with 0.1 µM CC-220, 1 µM dBET57, 1 µM pomalidomide (3× biological replicates), or DMSO as a control (3× biological replicates) for 5 h (bottom row). Protein abundance from each experiment was analyzed using TMT quantification mass spectrometry (see Materials and methods for details). Significant changes were assessed by a moderated t-test as implemented in the limma package (Ritchie et al., 2015), with the log2 fold change shown on the y-axis, and negative log10p values on the x-axis (the number of replicates is indicated above). Hits that met the set significance threshold (fold-change greater 1.5 and log10 p value below 0.001) are displayed with a red point (•).
Figure 1—figure supplement 2

Extended validation of IMiD-dependent targets.
(A) Heatmap summarizing the protein abundance of IMiD-dependent targets identified from proteomics data across four different cell lines (Kelly, MM1s, hES, and SK-N-DZ cells) and five different compounds (thalidomide, lenalidomide, pomalidomide, CC-220, and dBET57). The color scale displays a 2.5-fold decrease in protein abundance in blue and no change is displayed in white. NA indicates that the protein was not identified/quantified in the experiment. (B) Mass spectrometry scatter plot validation of IMiD-dependent targets. SK-N-DZ cells were treated with 1 µM pomalidomide to induce degradation of IMiD-dependent targets (left), degradation was rescued by co-treatment with 1 µM pomalidomide +5 µM MLN4924 (right), or treated with DMSO as a control for 5 h. Protein abundance from each experiment was analyzed using TMT quantification mass spectrometry (see Materials and methods for details). Significant changes were assessed by a moderated t-test as implemented in the limma package (Ritchie et al., 2015), with the log2 FC shown on the y-axis, and -log10p values on the x-axis (for three biological replicates). Hits that met the significance threshold (fold-change greater 1.5 and log10 p value below 0.001) are displayed with a red point (•). (C) Reporter ion ratios from (B) were normalized and scaled (see Materials and methods) and are depicted as a bar graph for the IMiD-dependent targets. Co-treatment with the neddylation inhibitor MLN4924 abrogated the degradation of all IMiD-dependent targets in accordance with a Cullin-RING ligase-dependent mechanism of degradation. Data are presented as means ± s.d. (n = 3 biological replicates). (D) Western blot validation of MLN4924 rescue experiment: SK-N-DZ or Kelly cells were treated with increasing concentrations of thalidomide or DMSO as a control. Following 24 h incubation, GZF1 (left) and DTWD1 (right) as well as GAPDH protein levels were assessed by western blot analysis (one representative out of three replicates is shown). (E) Multiple sequence alignment of the CxxCG-containing zinc finger domains from each of the IMiD-dependent targets identified by mass spectrometry in this study.
Figure 2 with 1 supplement
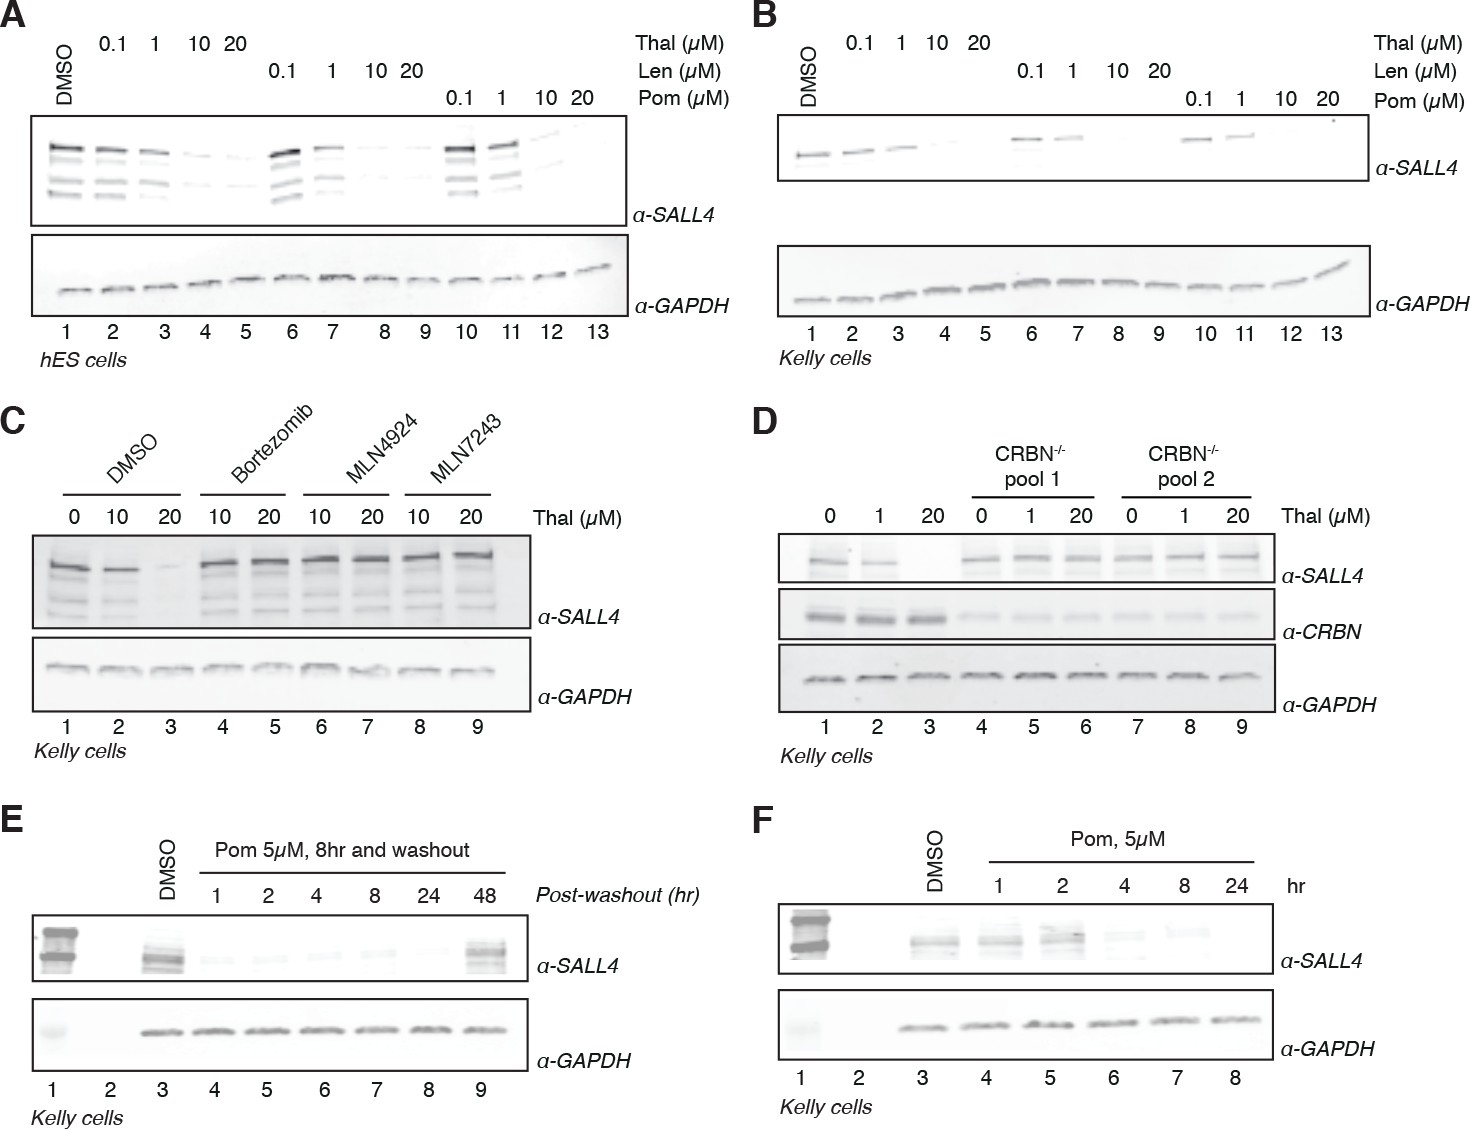
Validation of SALL4 as a bona fide IMiD-dependent CRL4CRBN substrate.
(A) H9 hESC were treated with increasing concentrations of thalidomide, lenalidomide, pomalidomide, or DMSO as a control. Following 24 h of incubation, SALL4 and GAPDH protein levels were assessed by western blot analysis. (B) As in (A), but treatment was done in Kelly cells. (C) Kelly cells were treated with increasing concentrations of thalidomide and co-treated with 5 µM bortezomib, 5 µM MLN4924, 0.5 µM MLN7243, or DMSO as a control. Following 24 h incubation, SALL4 and GAPDH protein levels were assessed by western blot analysis. (D) Parental Kelly cells or two independent pools of CRBN-/- Kelly cells were treated with increasing concentrations of thalidomide. Following 24 h incubation, SALL4, CRBN, and GAPDH protein levels were assessed by western blot analysis. (E) Kelly cells were treated with 5 µM pomalidomide or DMSO as a control for 8 h, at which point the compound was washed out. Cells were harvested at 1, 2, 4, 8, 24, and 48 h post-washout and SALL4 and GAPDH protein levels were assessed by western blot analysis. (F) Kelly cells were treated with 5 µM pomalidomide for 1, 2, 4, 8, and 24 h, or with DMSO as a control. Following time course treatment, SALL4 and GAPDH protein levels were assessed by western blot analysis. One representative experiment is shown in this figure, from three replicates for each of the western blots.
-
Figure 2—source data 1
Uncropped immunoblots.
(A−J) Uncropped western blots with the corresponding main or supplementary figure numbers shown. GAPDH loading control is presented with each plot. Size markers (kDa) are indicated. Cyan boxes highlight the cropped segment presented in main or supplementary figures. SALL4 is expressed in two isoforms, which we observe at 150 and 100 kDa apparent molecular weights. Different cell lines appear to express different relative levels of these isoforms. Additional variance in apparent molecular weight may arise from post-translational modifications.
- https://doi.org/10.7554/eLife.38430.024
Figure 2—figure supplement 1

Extended validation of SALL4.
(A) HEK293T cells were treated with increasing concentrations of thalidomide, lenalidomide, pomalidomide, or DMSO as a control. Following 24 h incubation, SALL4 and GAPDH protein levels were assessed by western blot analysis. (B) As in (A), but with H661 cells. (C) As in (A), but with SK-N-DZ cells. (D) HEK293T cells were treated with increasing concentrations of thalidomide and co-treated with 5 µM bortezomib, 5 µM MLN4924, 0.5 µM MLN7243, or DMSO as a control. Following 24 h incubation, SALL4 and GAPDH protein levels were assessed by western blot analysis. (E) As in (D), but with SK-N-DZ cells. (F) Parental HEK293T cells or two independent pools of CRBN-/- HEK293T cells were treated with increasing concentrations of thalidomide. Following 24 h incubation, SALL4, CRBN, and GAPDH protein levels were assessed by western blot analysis. (G) Kelly cells were treated with 1 µM pomalidomide or DMSO as a control for 8 h, at which point the compound was washed out. Cells were harvested at 1, 2, 4, 8, 24, and 48 h post-washout, and SALL4 and GAPDH protein levels were assessed by western blot analysis. (H) Kelly cells were treated with 1 µM pomalidomide for 1, 2, 4, 8, and 24 h, or with DMSO as a control. Following time course treatment, SALL4 and GAPDH protein levels were assessed by western blot analysis. (I) Thalidomide treatment did not influence the expression of SALL4 mRNA. hES cells treated with 10 µM thalidomide or DMSO as a control for 24 h were subjected to quantitative RT-PCR to assess the levels of total SALL4 mRNA. The mRNA levels were normalized to those of GAPDH (housekeeping gene) mRNA. The SALL4 mRNA level remained stable or increased, which is in contrast to the decrease in protein abundance observed in proteomics and western blot analysis. mRNA fold change was determined from n = 2 with three technical replicates. (J) To validate the specificity of the antibody used, we transfected Kelly or HEK293T cells with a plasmid expressing mCherry, Cas9, and one of three guide RNAs (sgRNA1, sgRNA2, sgRNA3) targeting the SALL4 gene, or a mock control. Following 48 h incubation, SALL4 and GAPDH protein levels were assessed by western blot analysis and for sgRNA1 and sgRNA2 a loss of the specific bands for SALL4 was observed in accordance with the antibody being specific for SALL4. sgRNA3 had no effect, which is likely to be because of an ineffective sgRNA. (K) To validate the specificity of the antibody used, we transfected Kelly cells with a plasmid overexpressing Flag-mmSALL4, Flag-hsSALL4, or no transfection. Following 48 h incubation, SALL4 and GAPDH protein levels were assessed by western blot analysis. One representative experiment is shown in this figure, from three replicates for each of the western blots.
Figure 3 with 1 supplement

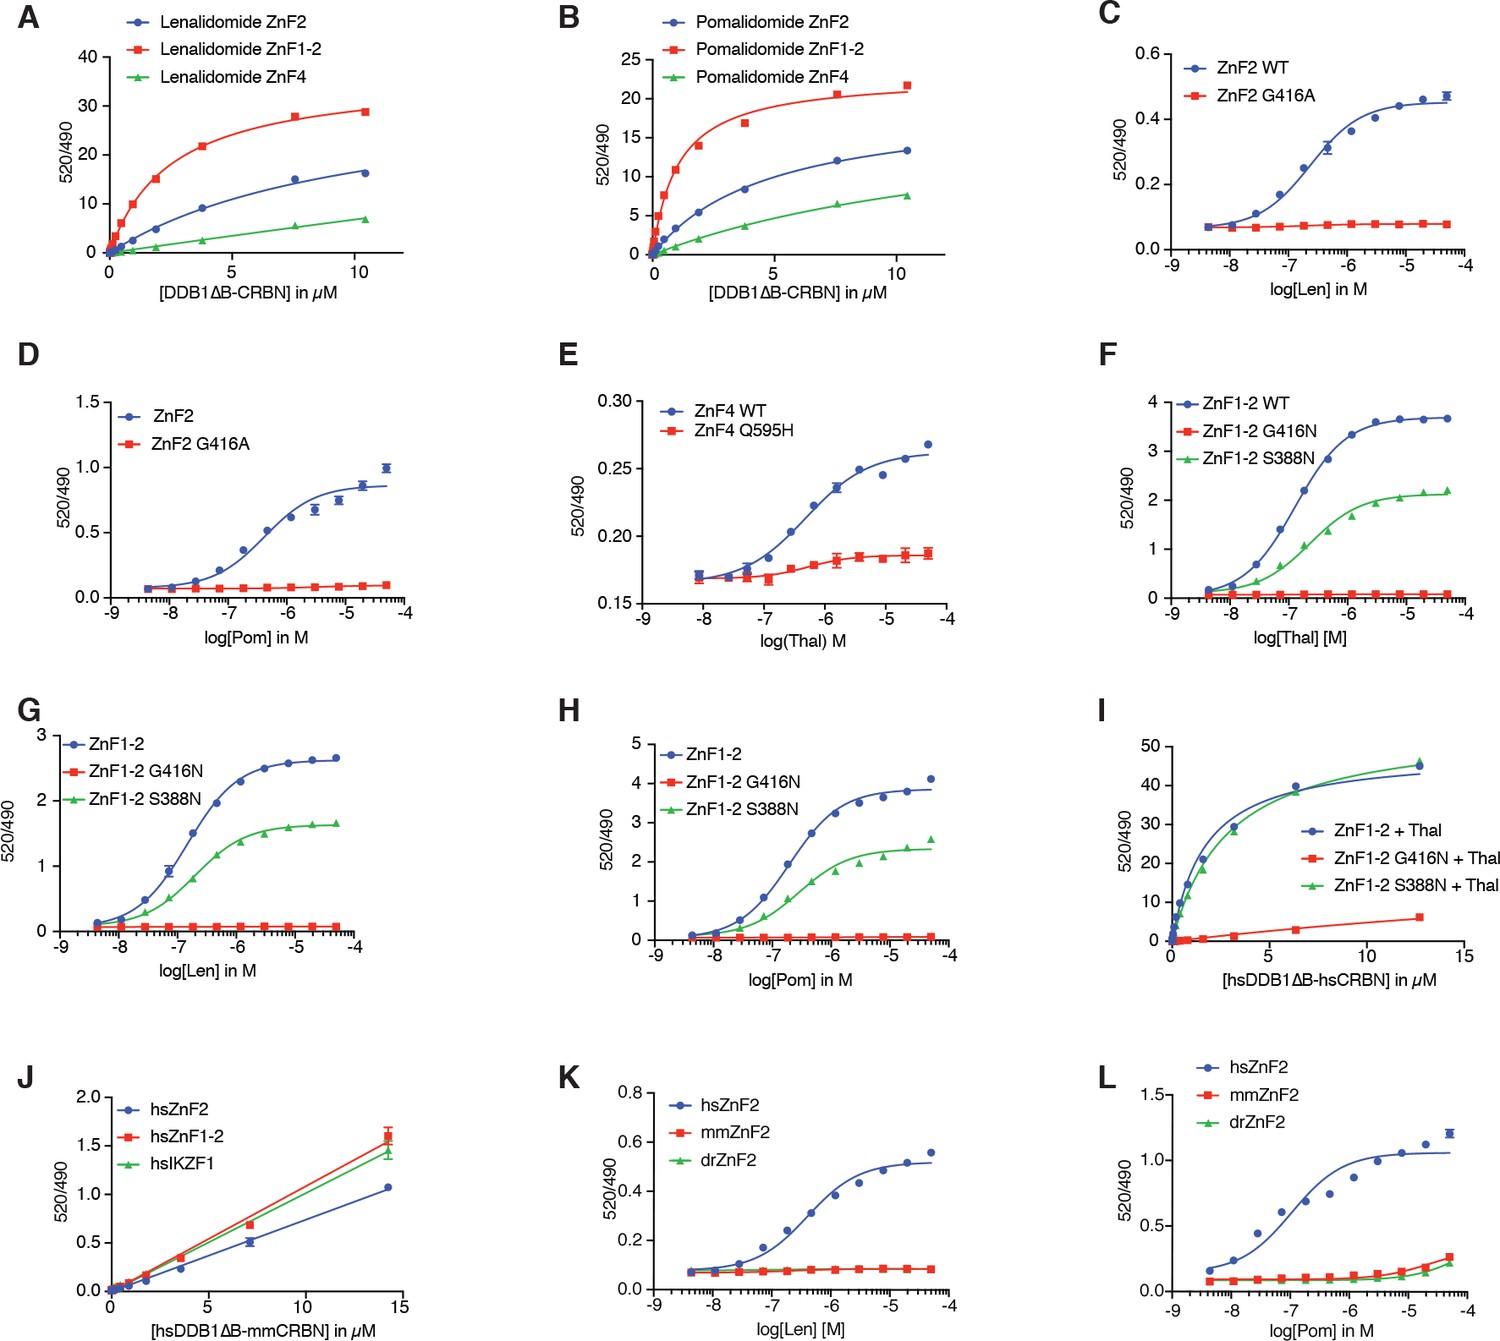
SALL4 ZnF2 is the zinc finger responsible for IMiD-dependent binding to CRL4CRBN.
(A) Multiple sequence alignment of the validated ‘degrons’ from known IMiD-dependent zinc finger substrates, along with the two candidate zinc finger degrons from SALL4. (B) TR-FRET: titration of IMiD (thalidomide, lenalidomide and pomalidomide) to DDB1∆B-CRBNSpy-BodipyFL at 200 nM, hsSALL4ZnF2 at 100 nM, and terbium-streptavidin at 4 nM. (C) As in (B), but with hsSALL4ZnF4 with DDB1∆B-CRBNSpy-BodipyFL at 1 µM. (D) TR-FRET: titration of DDB1∆B-CRBNSpy-BodipyFL to biotinylated hsSALL4ZnF2, hsSALL4ZnF1-2, or hsSALL4ZnF4 at 100 nM and terbium-streptavidin at 4 nM in the presence of 50 µM thalidomide. (E) As in (B), but with hsSALL4ZnF1-2. (F) As in (B), but with hsSALL4ZnF2 and hsSALL4ZnF2G416A mutant as thalidomide titration. (G) Kelly cells transiently transfected with Flag-hsSALL4WT, Flag-hsSALL4G600A, or hsSALL4G600N were treated with increasing concentrations of thalidomide or DMSO as a control. Following 24 h of incubation, SALL4 (α-Flag) and GAPDH protein levels were assessed by western blot analysis (one representative experiment is shown out of three replicates. (H) As in (G), but with Flag-hsSALL4WT, Flag-hsSALL4G416A, or Flag-hsSALL4G416N. (I) In vitro ubiquitination of biotinylated hsSALL4ZnF1-2 by CRL4CRBN in the presence of thalidomide (10 µM), lenalidomide (10 µM), or pomalidomide (0.1, 1 and 10 µM), or DMSO as a control.
-
Figure 3—source data 1
Uncropped immunoblots.
(A−B) Uncropped western blots with the corresponding main or supplementary figure numbers shown. GAPDH loading control is presented with each plot. Size markers (kDa) are indicated. Cyan boxes highlight the cropped segment presented in main or supplementary figures. SALL4 is expressed in two isoforms, which we observe at 150 and 100 kDa apparent molecular weights. Different cell lines appear to express different relative levels of these isoforms. Additional variance in apparent molecular weight may arise from post-translational modifications.
- https://doi.org/10.7554/eLife.38430.027
Figure 3—figure supplement 1
Biochemical characterization of SALL4 binding to CRBN.
(A) TR-FRET: titration of DDB1∆B-CRBNSpy-BodipyFL to biotinylated hsSALL4ZnF2, hsSALL4ZnF1-2, and hsSALL4ZnF4 at 100 nM and terbium-streptavidin at 4 nM in the presence of lenalidomide at 50 µM. (B) As in (A), but in the presence of pomalidomide at 50 µM. (C) TR-FRET: titration of lenalidomide to DDB1∆B-CRBNSpy-BodipyFL at 200 nM, hsSALL4ZnF2WT, hsSALL4 ZnF2G416A at 100 nM, and terbium-streptavidin at 4 nM. (D) As in (C), but titrating with pomalidomide. (E) TR-FRET: titration of thalidomide to DDB1∆B-CRBNSpy-BodipyFL at 1 µM, hsSALL4ZnF4 or hsSALL4ZnF4Q595H mutant at 100 nM, and terbium-streptavidin at 4 nM. (F) TR-FRET: titration of thalidomide to DDB1∆B-CRBNSpy-BodipyFL at 200 nM, hsSALL4ZnF1-2WT, hsSALL4ZnF1-2G416N, and hsSALL4ZnF1-2S388N at 100 nM, and terbium-streptavidin at 4 nM. (G) As in (F), but titrating with lenalidomide. (H) As in (F), but titrating with pomalidomide. (I) TR-FRET: titration of DDB1∆B-CRBNSpy-BodipyFL to biotinylated hsSALL4ZnF1-2WT, hsSALL4ZnF1-2G416N, and hsSALL4ZnF1-2S388N at 100 nM, and terbium-streptavidin at 4 nM in the presence of thalidomide at 50 µM. (J) TR-FRET: titration of DDB1∆B-mmCRBNSpy-BodipyFL to biotinylated hsSALL4ZnF2,hsSALL4ZnF1-2, and IKZF1∆ (Petzold et al., 2016) at 100 nM, and terbium-streptavidin at 4 nM in the presence of thalidomide at 50 µM. (K) TR-FRET: titration of lenalidomide to DDB1∆B-CRBNSpy-BodipyFL at 200 nM, hsSALL4ZnF2, mmSALL4 ZnF2, and drSALL4 ZnF2 at 100 nM, and terbium-streptavidin at 4 nM. (L) As in (K), but titrating pomalidomide. All TR-FRET data in this figure are presented as means ± s.d. (n = 3).
Figure 4 with 1 supplement
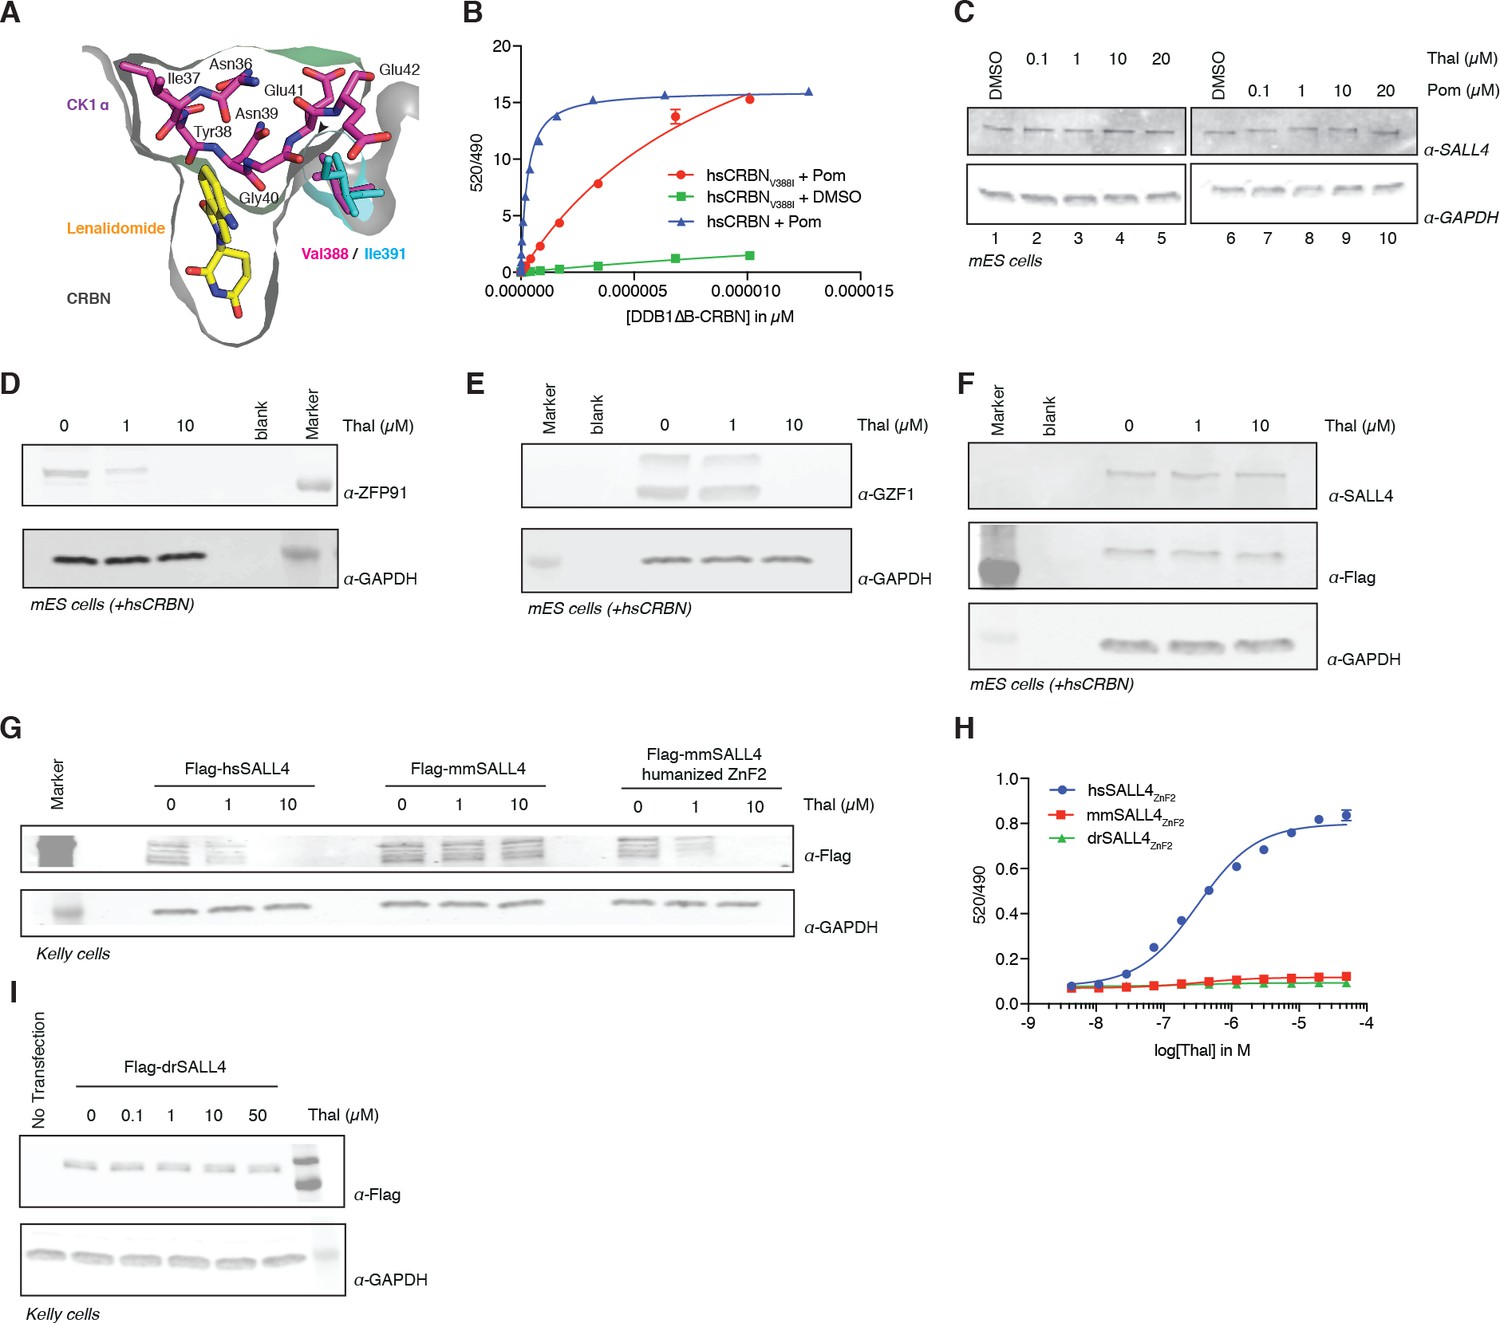
Identification of the sequence differences in the IMiD-dependent binding region of both CRBN and SALL4 in specific species.
(A) Close-up view of the beta-hairpin loop region of Ck1a (CSNK1A1) interacting with CRBN and lenalidomide (PDB: 5fqd) highlighting the additional bulkiness of the V388I mutation (PDB: 4ci1) present in mouse and rat CRBN. CSNK1A1 and lenalidomide are depicted as stick representations in magenta and yellow, respectively, the Ile391 of mouse CRBN corresponding to human Val388 is depicted as a stick representation in cyan, and CRBN is depicted as a surface representation. (B) TR-FRET: titration of DDB1∆B-hsCRBNSpy-BodipyFL, or DDB1∆B-hsCRBNV388ISpy-BodipyFL to biotinylated hsSALL4ZnF1-2 at 100 nM, and terbium-streptavidin at 4 nM in the presence of 50 µM pomalidomide or DMSO. (C) mES cells were treated with increasing concentrations of thalidomide and pomalidomide or DMSO as a control. Following 24 h of incubation, SALL4 and GAPDH protein levels were assessed by western blot analysis. (D) mES cells constitutively expressing Flag-hsCRBN were treated with increasing concentrations of thalidomide. Following 24 h of incubation, ZFP91 and GAPDH protein levels were assessed by western blot analysis. (E) As in (C), but measuring GZF1 and GAPDH protein levels. (F) As in (C), but measuring SALL4, hsCRBN (α-Flag), and GAPDH protein levels. (G) Kelly cells were transiently transfected with Flag-hsSALL4, Flag-mmSALL4, or Flag-mmSALL4 containing a humanized ZnF2 (Y415F, P418S, I419V, L430F, Q435H), and treated with increasing concentrations of thalidomide. Following 24 h of incubation, hsSALL4, mmSALL4, humanized mmSALL4 (α-Flag), and GAPDH protein levels were assessed by western blot analysis. (H) TR-FRET: titration of thalidomide to DDB1∆B-CRBNSpy-BodipyFL at 200 nM, hsSALL4ZnF2, mmSALL4ZnF2, or drSALL4ZnF2 all at 100 nM, and terbium-streptavidin at 4 nM. Data are presented as means ± s.d. (n = 3). (I) As in (G), but with Flag-drSALL4.
-
Figure 4—source data 1
Uncropped immunoblots.
(A−J) Uncropped western blots with the corresponding main or supplementary figure numbers shown. GAPDH loading control is presented with each plot. Size markers (kDa) are indicated. Cyan boxes highlight the cropped segment presented in main or supplementary figures. SALL4 is expressed in two isoforms, which we observe at 150 and 100 kDa apparent molecular weights. Different cell lines appear to express different relative levels of these isoforms. Additional variance in apparent molecular weight may arise from post-translational modifications.
- https://doi.org/10.7554/eLife.38430.030
Figure 4—figure supplement 1
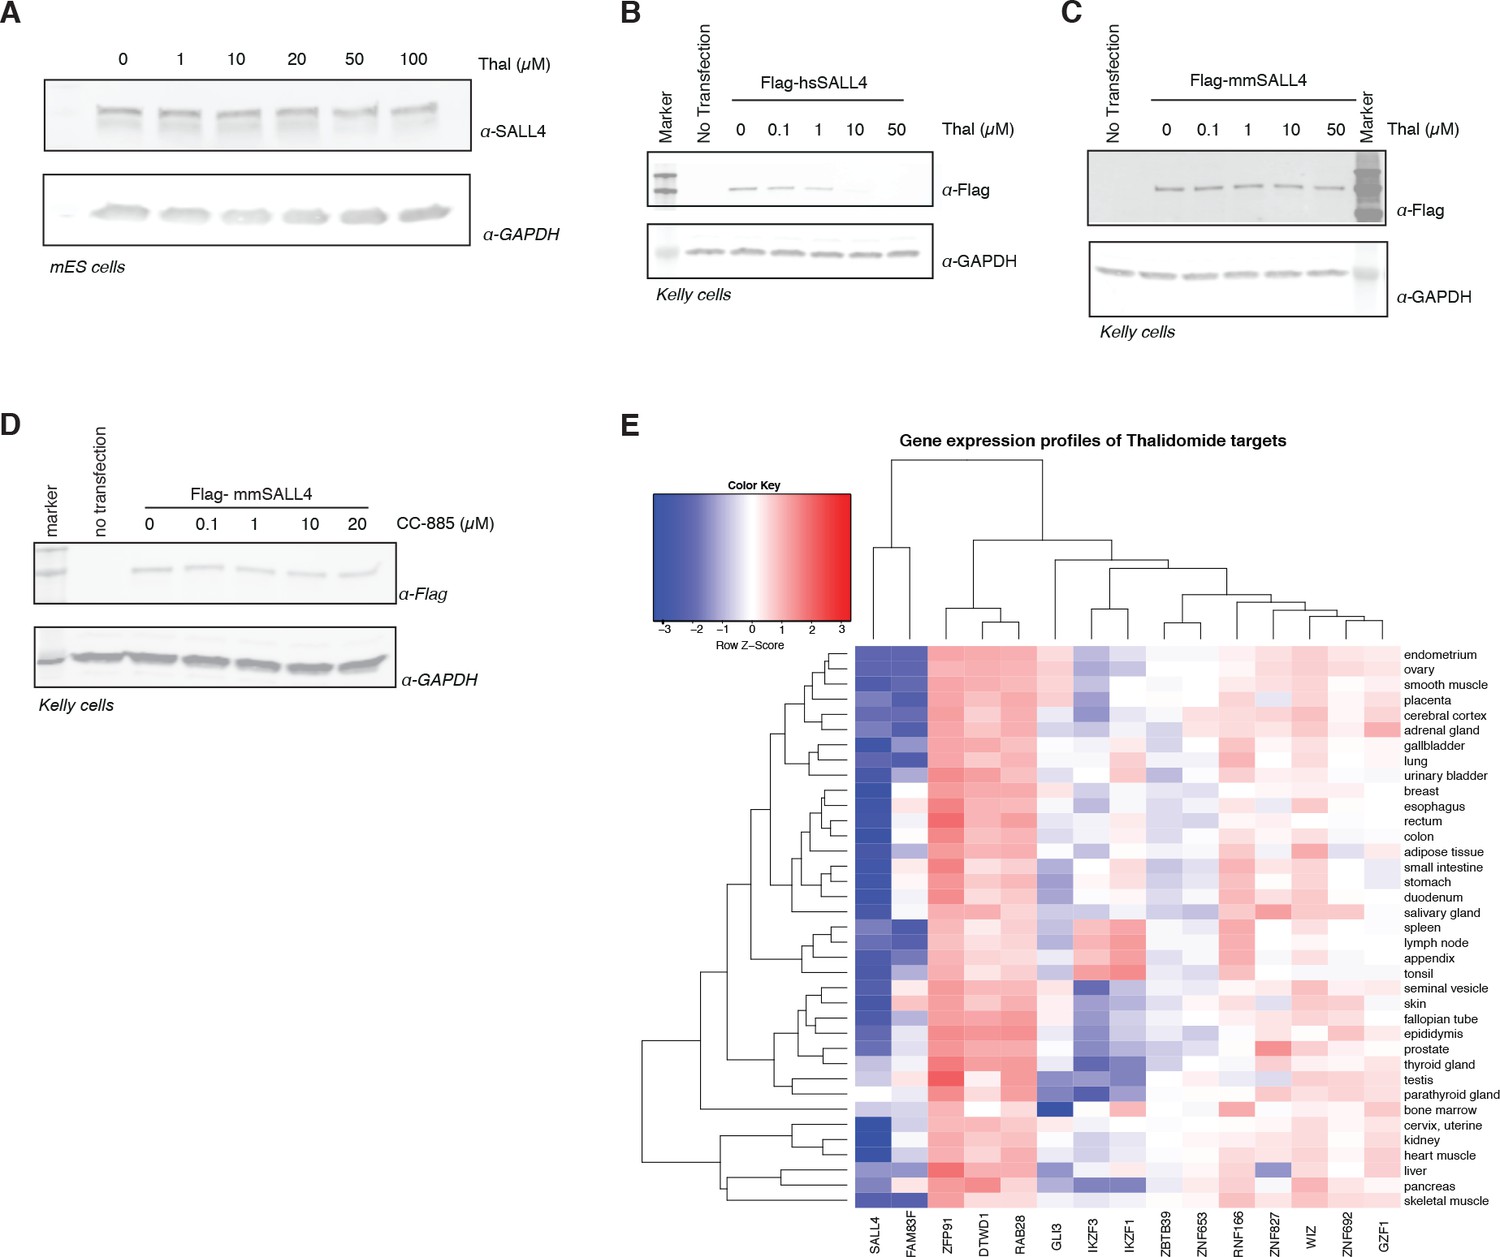
Species-specific effects.
(A) mES cells were treated with increasing doses up to 100 µM of thalidomide. Following 24 h incubation, SALL4 and GAPDH protein levels were assessed by western blot analysis. (B) Kelly cells were transiently transfected with Flag-hsSALL4 and treated with increasing concentrations of thalidomide. Following 24 h of incubation, SALL4 and GAPDH protein levels were assessed by western blot analysis. (C) As in (B), but with Flag-mmSALL4. (D) Kelly cells were transiently transfected with Flag-mmSALL4 and treated with increasing doses of CC-885, with no transfection as a negative control. Following 24 h incubation, mmSALL4 (α-Flag) protein levels were assessed by western blot analysis. One representative is shown out of three replicates for each western blot. (E) Gene expression profiles for IMiD-dependent substrates were derived from the genotype-tissue expression (GTex) dataset and are presented as a heatmap.
Figure 5
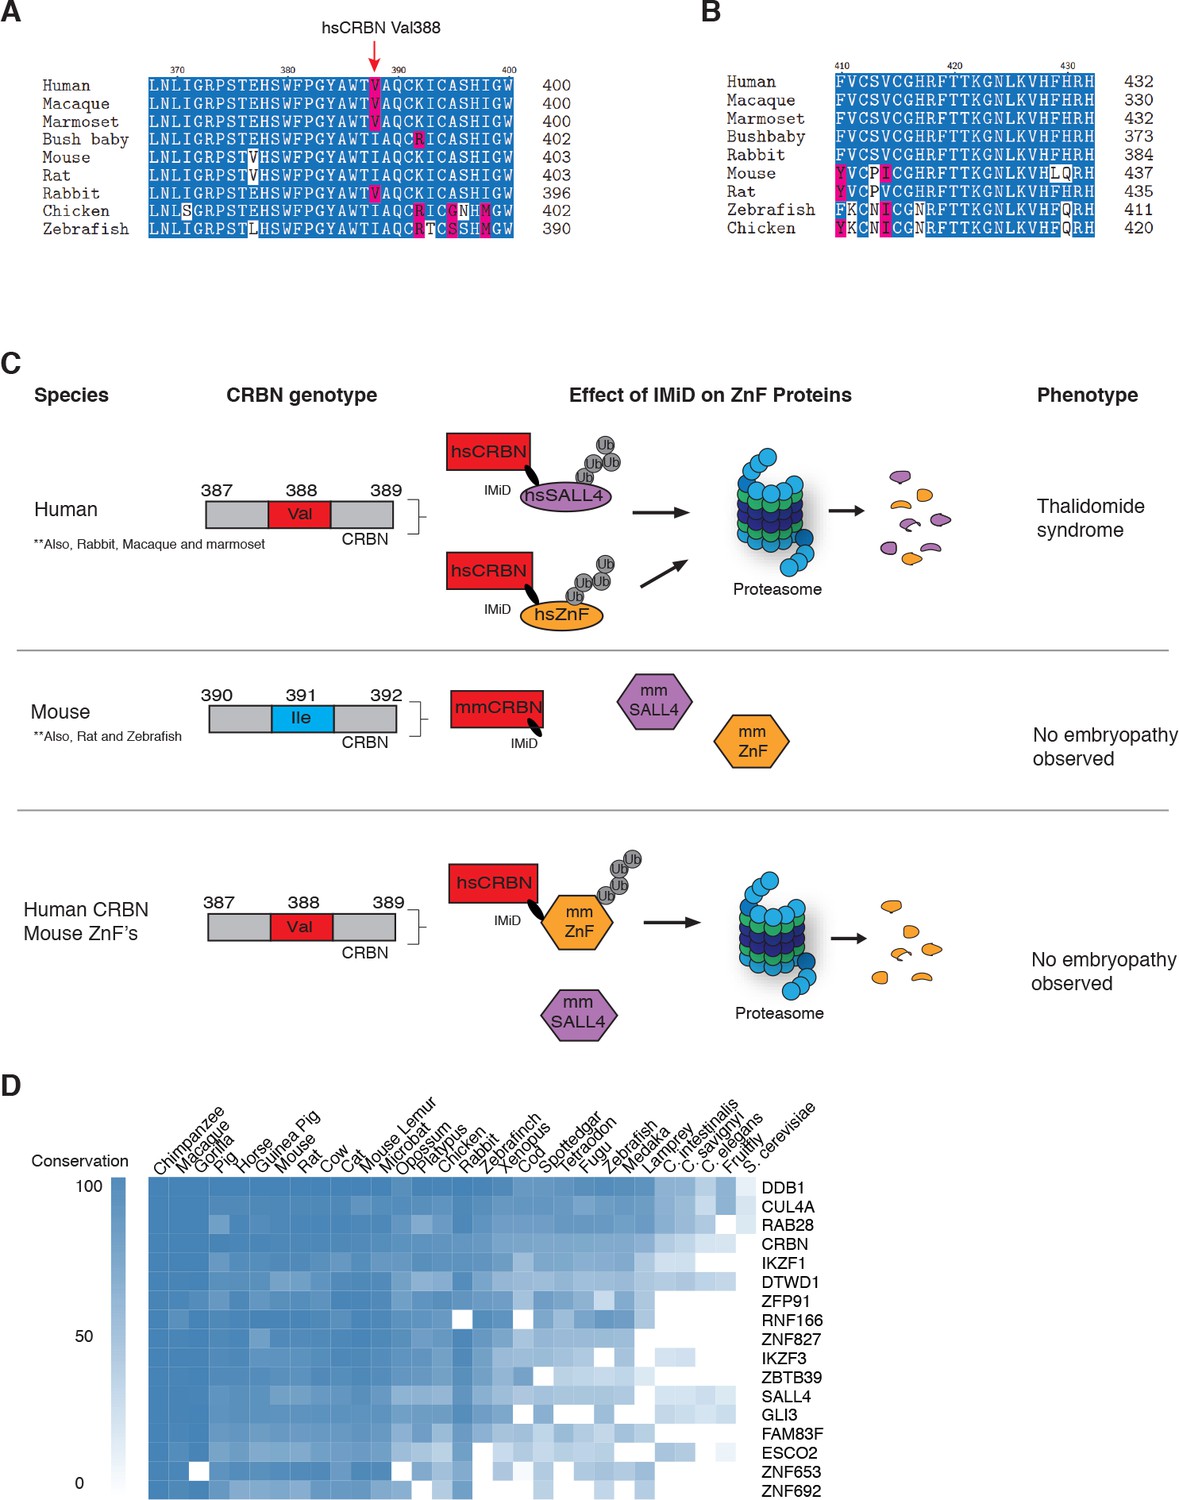
Sequence differences in the IMiD-dependent binding region of both CRBN and SALL4 interfere with ternary complex formation in specific species.
(A) A multiple sequence alignment of the region of CRBN critical for IMiD mediated ZnF binding from human, bush baby mouse, rat, macaque, marmoset, and rabbit is shown, highlighting the V388I polymorphism. (B) A multiple sequence alignment of SALL4ZnF2 from human, macaque, marmoset, bush baby, rabbit, mouse, rat, zebrafish, and chicken, highlighting the differences in sequence across species. (C) Schematic summary of species-specific effects of IMiD treatment on ZnF degradation and relationship to thalidomide syndrome phenotype. The top panel depicts sensitive species: hsCRBNV388 is capable of IMiD-dependent binding, ubiquitination, and subsequent degradation of hsSALL4 and hsZnF targets, and thalidomide embryopathy is observed. The middle panel depicts insensitive species: mmCRBNI391 is capable of binding IMiDs, but not binding mmSALL4 and mmZnF targets, and no embryopathy is observed. The bottom panel depicts humanizing CRBN as ineffective for inducing the phenotype: hsCRBNV388 is capable of IMiD-dependent ubiquitination and subsequent degradation of mmZnF proteins, but not mmSALL4, and the embryopathy is not observed. These data are consistent with a ‘double protection’ mechanism caused by mutations in both CRBN and SALL4 preventing IMiD-dependent binding and subsequent degradation in insensitive species. (D) Heatmap comparing the sequence conservation of IMiD-dependent targets across 30 different species. High conservation is displayed as blue and low conservation is displayed as white.
Tables
Table 1
Common phenotypes in thalidomide syndrome, Duane Radial Ray syndrome, and Holt-Oram syndrome.
https://doi.org/10.7554/eLife.38430.021| Thalidomide syndrome | Duane Radial Ray syndrome | Holt-Oram syndrome | |
|---|---|---|---|
| Upper limbs | |||
| Thumbs | Thumbs | Thumbs | |
| Radius | Radius | Radius | |
| Humerus | Humerus | Humerus | |
| Ulna | Ulna | Ulna | |
| Fingers | Fingers | Fingers | |
| Lower limbs | |||
| Mostly normal lower limbs | Mostly normal lower limbs | ||
| Talipes dislocation | Talipes dislocation | ||
| Hip dislocation | |||
| Shortening of long bones | |||
| Ears | |||
| Absence or abnormal pinnae | Abnormal pinnae | ||
| Deafness | Deafness | ||
| Microtia | |||
| Eyes | |||
| Colobomata | Colobomata | ||
| Microphthalmos | Microphthalmos | ||
| Abduction of the eye | Abduction of the eye | ||
| Duane anomaly | Duane anomaly | ||
| Stature | |||
| Short stature | Postnatal growth retardation | ||
| Heart | |||
| Ventricular septal defects | Ventricular septal defects | Ventricular septal defects | |
| Atrial septal defects | Atrial septal defects | Atrial septal defects |
Key resources table
| Reagent type (species) or resource | Designation | Source or reference | Identifiers | Additional information | |
|---|---|---|---|---|---|
| Gene (H. sapiens) | CRBN | Fischer et al. (2014) | Gene ID: 51185 | ||
| Gene (M. musculus) | CRBN | Dr. Ben Ebert (Brigham and Womens Hospital, Dana Farber Cancer Institute) | Gene ID: 58799 | ||
| Gene (H. sapiens) | SALL4 | IDT | Gene ID: 57167 | ||
| Gene (H. sapiens) | DDB1∆B | Petzold et al. (2016) | Gene ID: 1642 | ||
| Gene (M. musculus) | SALL4 | IDT | Gene ID: 99377 | ||
| Gene (D. rerio) | SALL4 | IDT | Gene ID: 572527 | ||
| Cell line (H. sapiens) | H9 hES cells | Dr. Wade Harper (Harvard Medical School) | RRID:CVCL_9773 | ||
| Cell line (H. sapiens) | Kelly Cells | Dr. Nathanael Gray (Dana Farber Cancer Institute, Harvard Medical School) | RRID:CVCL_2092 | ||
| Cell line (H. sapiens) | SK-N-DZ cells | ATCC | RRID:CVCL_1701; CRL-2149 | ||
| Cell line (H. sapiens) | MM1s cells | ATCC | RRID:CVCL_8792; CRL-2974 | ||
| Cell line (H. sapiens) | H661 cells | ATCC | RRID:CVCL_1577; HTB-183 | ||
| Cell line (H. sapiens) | HEK293T cells | ATCC | RRID:CVCL_0063; CRL-3216 | ||
| Cell line (M. musculus) | TC1 mESC cells | Dr. Richard Gregory (Boston Childrens Hospital, Harvard Medical School) | RRID:CVCL_M350 | ||
| Cell line (T. ni) | High Five insect cells | Thermo Fisher Scientific | RRID:CVCL_C190; B85502 | ||
| Chemical compound, drug | Thalidomide | MedChemExpress | HY-14658 | ||
| Chemical compound, drug | Lenalidomide | MedChemExpress | HY-A0003 | ||
| Chemical compound, drug | Pomalidomide | MedChemExpress | HY-10984 | ||
| Chemical compound, drug | CC-220 | MedChemExpress | HY-101291 | ||
| Chemical compound, drug | CC-885 | Cayman chemical | 19966 | ||
| Chemical compound, drug | dBET57 | Nowak et al. (2018) | |||
| Chemical compound, drug | Bortezomib | MedChemExpress | HY-10227 | ||
| Chemical compound, drug | MLN4924 | MedChemExpress | HY-70062 | ||
| Chemical compound, drug | MLN7243 | Active Biochem | A1384 | ||
| Recombinant DNA reagent | pCDH-MSCV (PGK promoter plasmid) | Dr. Ben Ebert (Brigham and Womens Hospital, Dana Farber Cancer Institute) | |||
| Recombinant DNA reagent | pNTM (CMV promoter plasmid) | Dr. Nicolas Thomä, FMI, Switzerland | |||
| Recombinant DNA reagent | pAC8 (Polyhedrin promoter plasmid) | Dr. Nicolas Thomä, FMI, Switzerland | |||
| Peptide, recombinant protein | hsHis6-3C-Spy-CRBN | Nowak et al. (2018) | |||
| Peptide, recombinant protein | hsHis6-3C-Spy-CRBN_V388I | This study | |||
| Peptide, recombinant protein | hsStrep-BirA-SALL4 (590–618) | This study | |||
| Peptide, recombinant protein | hsStrep-BirA-SALL4_Q595H (590-618) | This study | |||
| Peptide, recombinant protein | hsStrep-BirA-SALL4 (378–438) | This study | |||
| Peptide, recombinant protein | hsStrep-BirA-SALL4 (402–436) | This study | |||
| Peptide, recombinant protein | mmStrep-BirA-SALL4 (593–627) | This study | |||
| Peptide, recombinant protein | drStrep-BirA-SALL4 (583–617) | This study | |||
| Peptide, recombinant protein | SpyCatcher S50C | Nowak et al. (2018) | |||
| Peptide, recombinant protein | His-hsDDB1(1–1140)-His-hsCUL4A (38-759)-His-mmRBX1(12–108) (CRL4-CRBN) | Fischer et al. (2011) | |||
| Peptide, recombinant protein | Ubiquitin | Boston Biochem | U-100H | ||
| Peptide, recombinant protein | His-E1 | Boston Biochem | E-304 | ||
| Peptide, recombinant protein | UBE2G1 | Boston Biochem | E2-700 | ||
| Peptide, recombinant protein | UbcH5c | Boston Biochem | E2-627 | ||
| Antibody | Mouse anti-SALL4 | abcam | RRID:AB_2183366; ab57577 | WB (1:250) | |
| Antibody | Rabbit anti-SALL4 - chip grade | abcam | RRID:AB_777810; ab29112 | WB (1:250) | |
| Antibody | Rabbit anti-DTWD1 | Sigma Aldrich | RRID:AB_2677903; HPA042214 | WB (1:500) | |
| Antibody | Mouse anti-FLAG M2 | Sigma Aldrich | RRID:AB_262044; F1804 | WB (1:1000) | |
| Antibody | Rabbit anti-CRBN | Novus Biologicals | RRID:AB_11037820; NBP1-91810 | WB (1:500) | |
| Antibody | Rabbit anti-GZF1 | Thermo Fisher Scientific | RRID:AB_2551727; PA534375 | WB (1:500) | |
| Antibody | Mouse anti-GAPDH | Sigma Aldrich | RRID:AB_1078991; G8795 | WB (1:10,000) | |
| Antibody | IRDye680 Donkey anti-mouse IgG | LiCor | RRID:AB_10953628; 92668072 | WB (1:10,000) | |
| Antibody | IRDye800 Goat anti-rabbit | LiCor | RRID:AB_621843; 92632211 | WB (1:10,000) | |
| Antibody | Rabbit anti-Strep-Tag II | abcam | RRID:AB_1524455; ab76949 | WB (1:10,000) | |
| Antibody | anti-Strep-Tag II HRP conjugate | Millipore | RRID:AB_10806716; 71591 | WB (1:10,000) | |
| Antibody | anti-Mouse IgG HRP conjugate | Cell Signalling | RRID:AB_330924; 7076 | WB (1:10,000) | |
| Other | Amersham ECL prime western blot reagent | GE healthcare | RPN2232 | ||
| Other | BODIPY-FL-Maleimide | Thermo Fisher Scientific | B10250 | ||
| Other | Tb streptavidin | Invitrogen | LSPV3966 | ||
| Other | TMT 10-plex labels | Thermo Fisher Scientific | 90406 | ||
| Other | Lipofectamine 2000 | Invitrogen | 11668019 | ||
Additional files
-
Transparent reporting form
- https://doi.org/10.7554/eLife.38430.032
Download links
A two-part list of links to download the article, or parts of the article, in various formats.
Downloads (link to download the article as PDF)
Open citations (links to open the citations from this article in various online reference manager services)
Cite this article (links to download the citations from this article in formats compatible with various reference manager tools)
Thalidomide promotes degradation of SALL4, a transcription factor implicated in Duane Radial Ray syndrome
eLife 7:e38430.
https://doi.org/10.7554/eLife.38430


