A herpesvirus encoded Qa-1 mimic inhibits natural killer cell cytotoxicity through CD94/NKG2A receptor engagement
- Washington University School of Medicine, United States
- Leiden University Medical Center (LUMC), The Netherlands
Figures
Figure 1 with 2 supplements
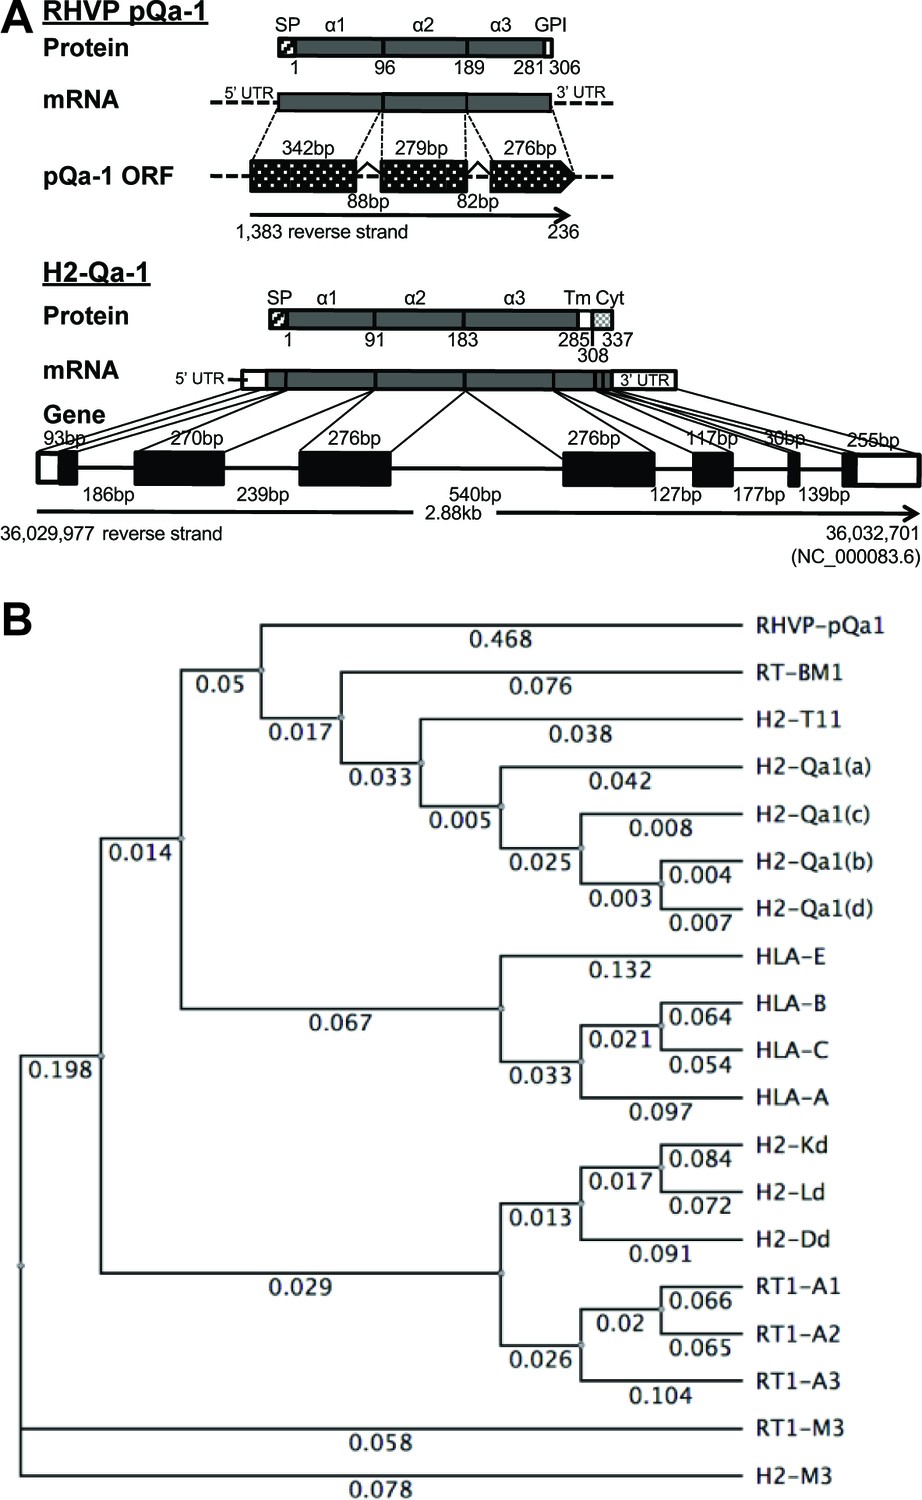
RHVP encodes a Qa-1-like protein.
(A) Schematic comparison of the regions encoding RHVP pQa-1 and mouse H2-Qa-1. The genomic sequence is represented by a black line (solid for mouse and dotted for virus), and genome coordinates are indicated below. The exons of the translated regions of the RHVP genome and the mouse Qa-1 gene (NC_000083.6) are represented by dotted and solid black block, respectively. (B) Unrooted phylogenetic tree of the proteins, including RT-BM1: rat MHC-Ib-S3 (NP_001008886.2); H2-T11: mouse H2-T11 (NP_001257934); H2-Qa1(a), -Qa1(c), -Qa1(b) and -Qa1(d): mouse Qa-1a (XP_003945787), Qa-1c (AAD12244.1), Qa-1b (NP_034528) and Qa-1d (AAD31381); HLA-E: human HLA-E (NP_005507.3); HLA-B: human HLA-B7 (AAA91229); HLA-C: human HLA-Cw0702 (CAA05125); HLA-A: human HLA-A2 (ASA47534); H2-Kd: mouse H2-Kd (P01902.1); H2-Ld: mouse H2-Ld (P01897.2); H2-Dd: mouse H2-Dd (P01900.1); RT1-A1: rat MHC-Ia-A1 (NP_001008827.1); RT1-A2: rat MHC-Ia-A2 (NP_001008829); RT1-A3: rat MHC-Ia-A3 (NP_001008830); RT1-M3: rat MHC-Ib-M3 (NP_075210.2); H2-M3: mouse H2-M3 (AAA39597), was created using PHYLIP Neighbor Joining algorithm (http://evolution.genetics.washington.edu/phylip/phylipweb.html). Horizontal branch lengths reflect the number of nucleotide substitutions per site.
Figure 1—figure supplement 1
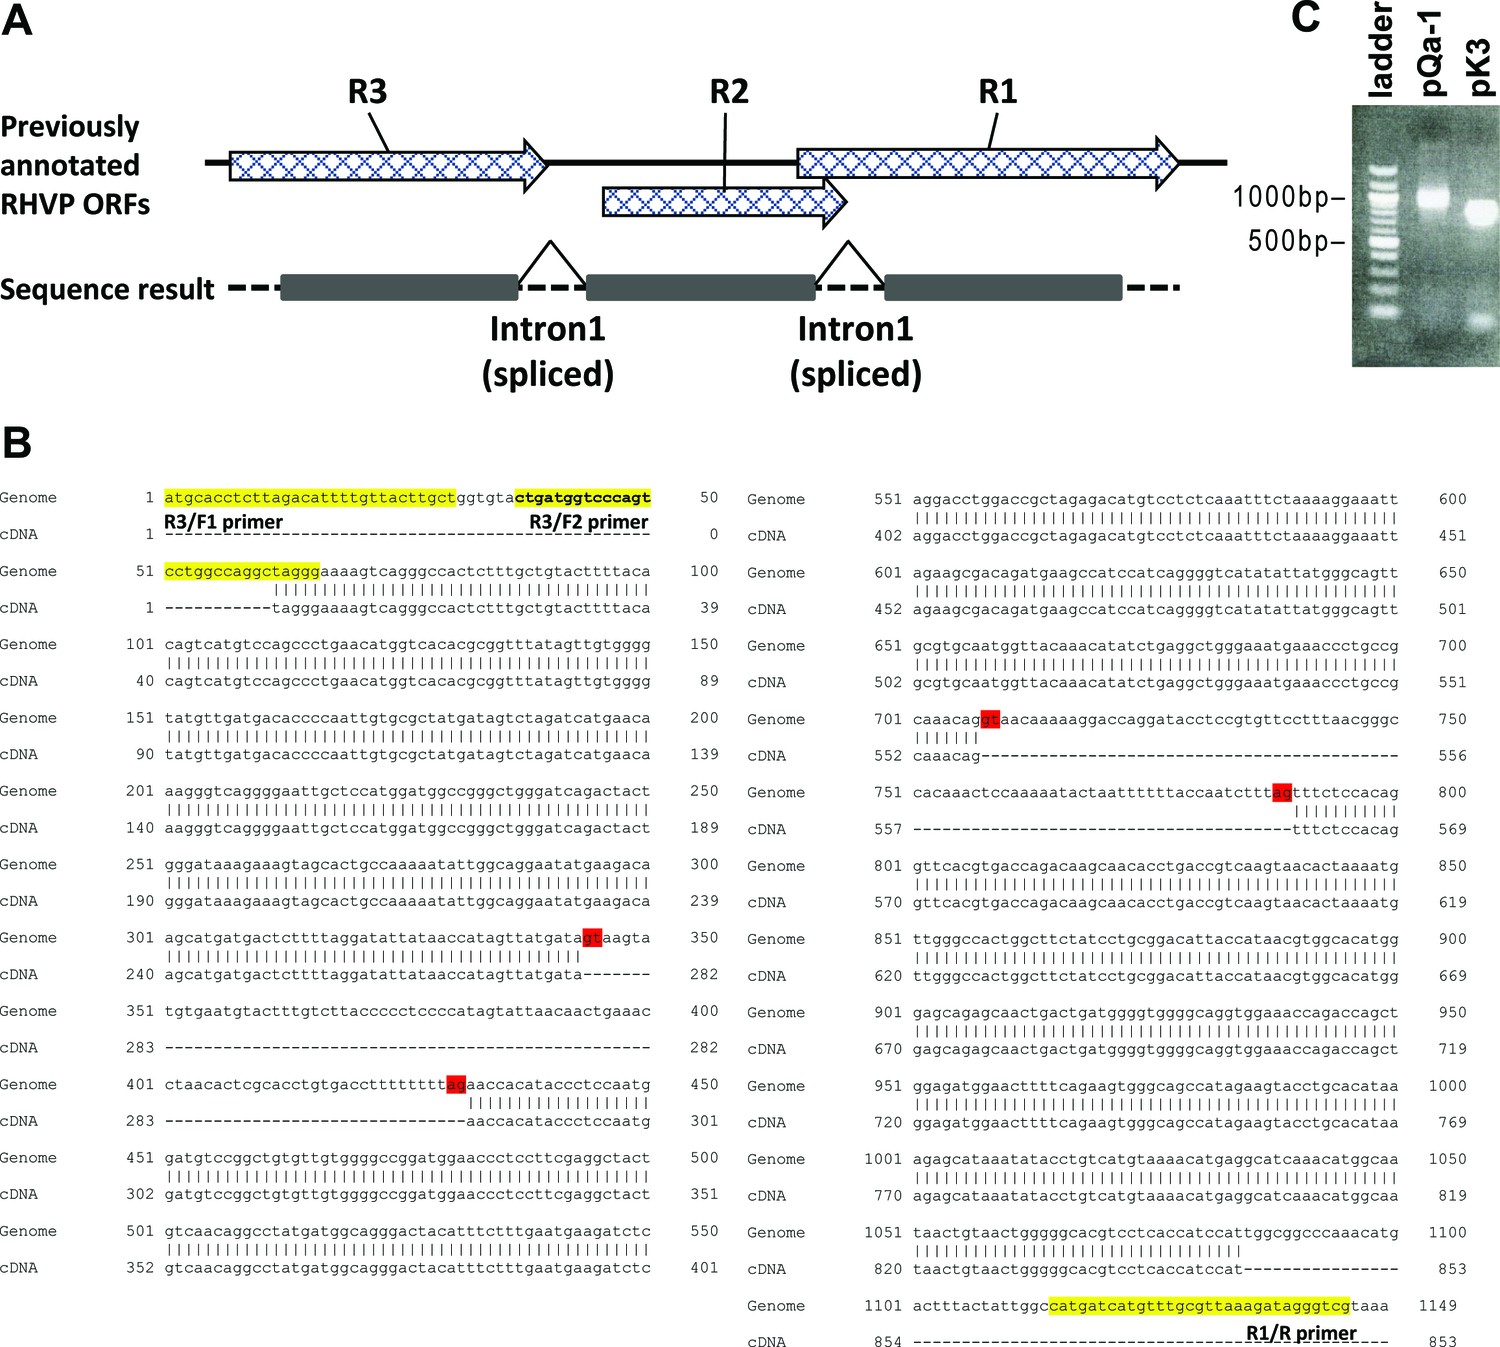
Three previously annotated RHVP ORFs are spliced to form mRNA encoding an MHC-I-like protein.
(A) Schematic depiction of RHVP ORFs and the RNA splicing events. The genomic sequence is represented by a dotted black line. Previously annotated ORFs are represented by pattern-filled block arrows. The translated regions in the RHVP genome verified by RT-PCR and DNA sequencing are represented by black blocks. (B) Nucleotide alignment of the sequencing result to the viral genome. Total RNA was prepared from RHVP-infected IFNαβγR-/- mouse embryonic fibroblasts 24 hr post-infection, from which a first strand cDNA pool was obtained by RT-PCR using oligo dT. The DNA sequences amplified by PCR from the cDNA pool (using primers highlighted in yellow) were aligned with the viral genomic sequence of R1-R3 in reverse direction using EMBOSS Needle. The splice donor and acceptor site borders are highlighted in red and are reminiscent of the consensus splice sites in mammals. (C) Agarose gel image showing the PCR amplicons of the cDNA obtained from RHVP-infected MEFs using primers specific to pQa-1 and pK3. The following primers were used: RHVP-R3/F1 5'-atgcacctcttagacattttgttacttgct; RHVP-R3/F2 5'-ctgatggtcccagtcctggccaggctaggg; RHVP-R1/R 5'-cgaccctatctttaacgcaaacatgatcatg; RHVP-R12 (pK3)/F 5'-atggctttgcaggaggctg; PHVP-R12 (pK3)/R 5'-tataaacaaactgtcctactgc.
Figure 1—figure supplement 2
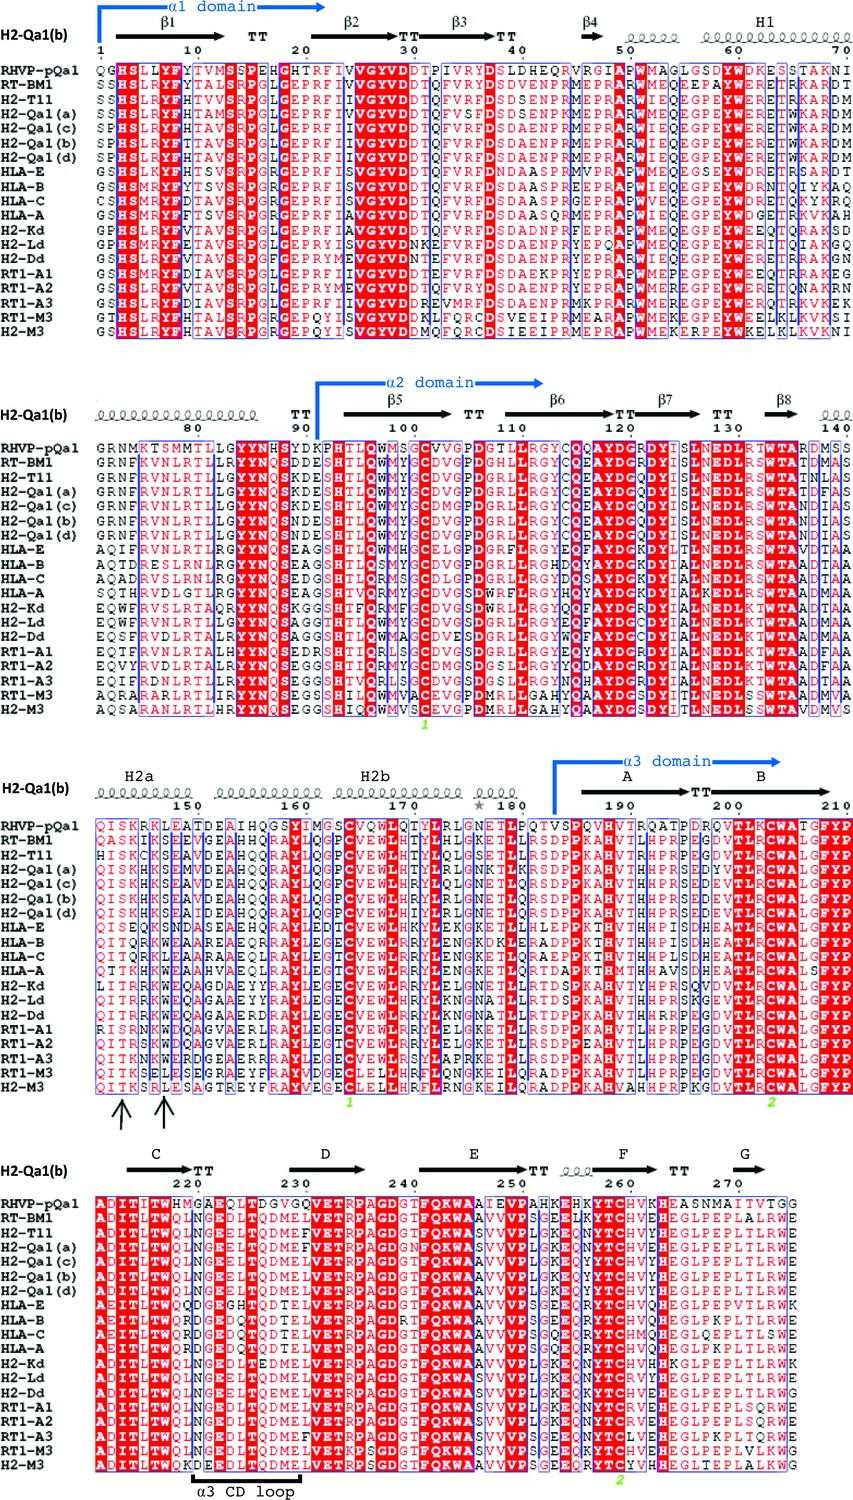
Sequence alignment of pQa-1 with selected classical and non-classical MHC-I proteins.
The pQa-1 ectodomain amino acid sequences are compared to closely related MHC-I proteins using ESPript3 (Robert and Gouet, 2014). The secondary structure of mouse Qa-1 is depicted above the alignment and comes from the available crystal structure (PDB:3VJ6). The residues that distinguish Qa-1 from classical MHC-I in the F pocket of peptide binding are indicated by arrows. RT-BM1: rat MHC-Ib-S3 (NP_001008886.2); H2-T11: mouse H2-T11 (NP_001257934); H2-Qa-1(a), -Qa-1(c), -Qa-1(b) and -Qa-1(d): mouse Qa-1a (XP_003945787), Qa-1c (AAD12244.1), Qa-1b (NP_034528) and Qa-1d (AAD31381); HLA-E: human HLA-E (NP_005507.3); HLA-B: human HLA-B7 (AAA91229); HLA-C: human HLA-Cw0702 (CAA05125); HLA-A: human HLA-A2 (ASA47534); H2-Kd: mouse H2-Kd (P01902.1); H2-Ld: mouse H2-Ld (P01897.2); H2-Dd: mouse H2-Dd (P01900.1); RT1-A1: rat MHC-Ia-A1 (NP_001008827.1); RT1-A2: rat MHC-Ia-A2 (NP_001008829); RT1-A3: rat MHC-Ia-A3 (NP_001008830); RT1-M3: rat MHC-Ib-M3 (NP_075210.2); H2-M3: mouse H2-M3 (AAA39597). Conserved cysteine residues involved in disulfide bond formation are marked with green numerals (1 or 2) under the sequence alignment.
Figure 2
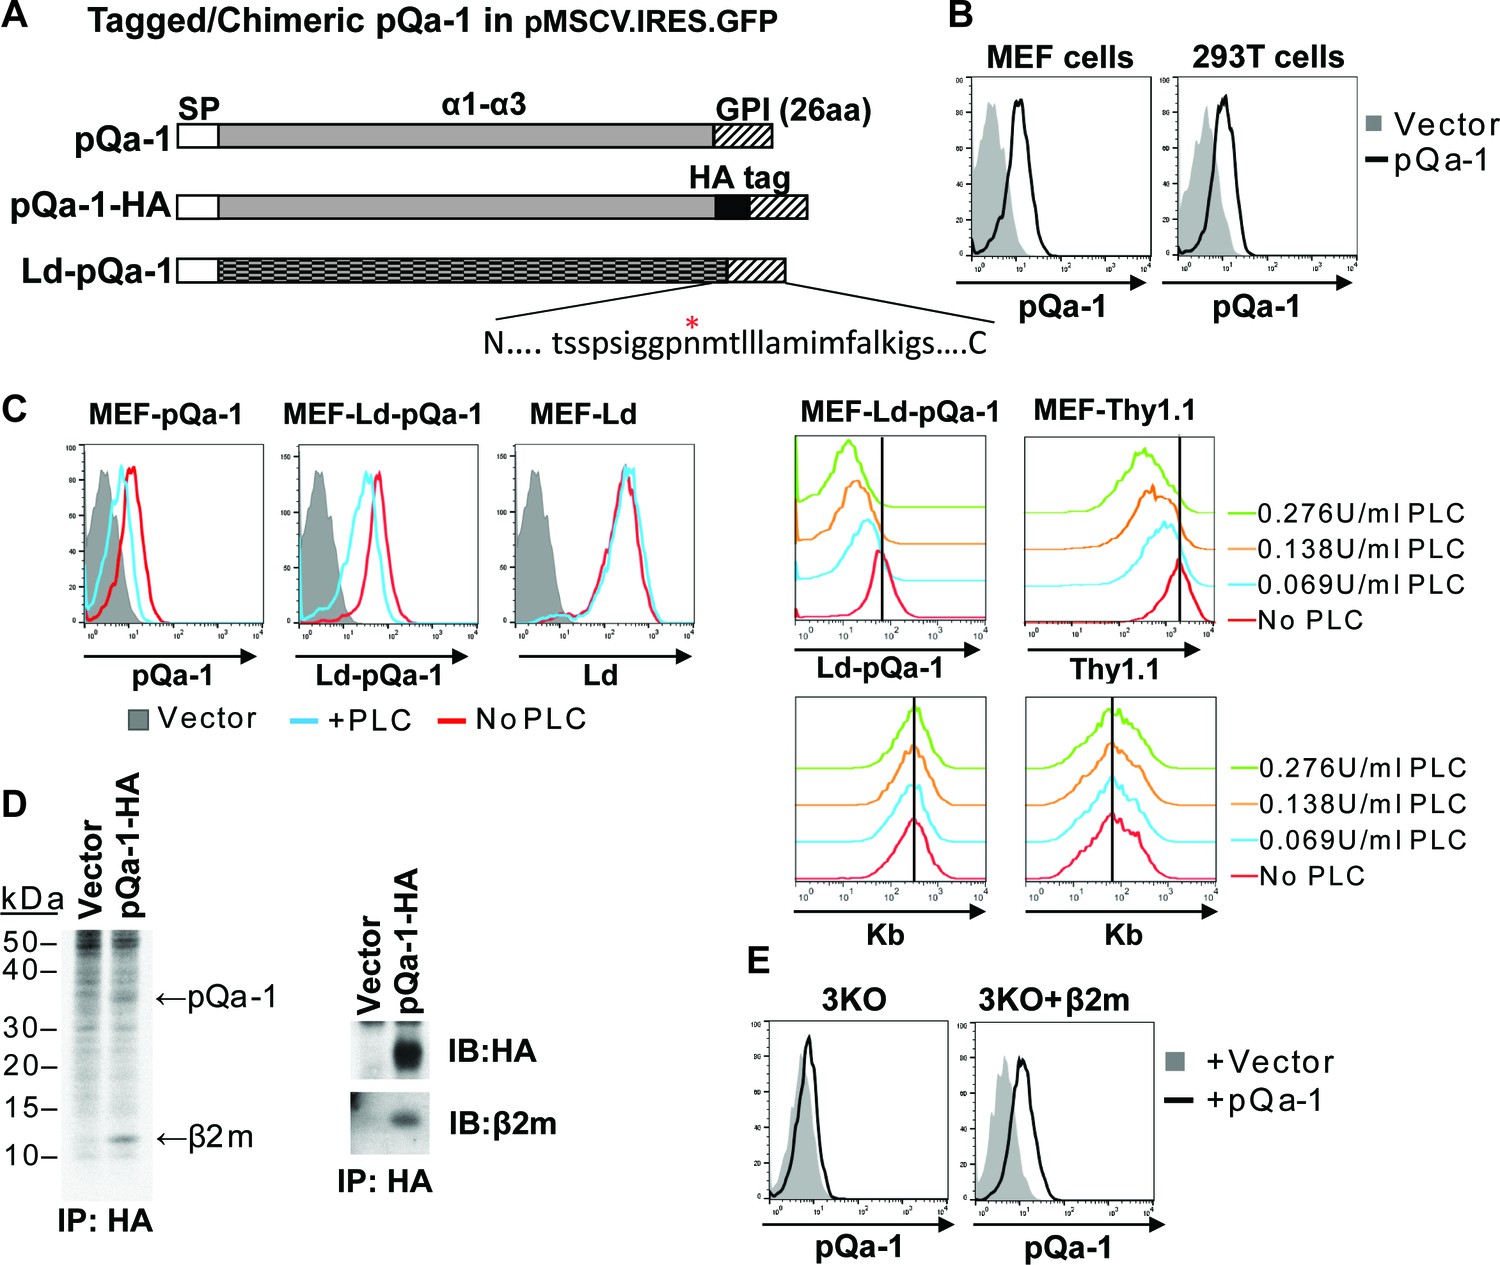
RHVP pQa-1 is GPI anchored, cell surface expressed and assembles with β2m.
(A) Schematic depiction of the pQa-1 expression constructs used in the study. The C-terminal 26aa containing predicted GPI attachment site (marked by red star) is shown under the C-terminus of the last construct. (B) Mouse embryonic fibroblast (MEF) and human 293 T cells were stably transduced with the vector only or pQa-1-HA construct depicted in (A). Surface expression of pQa-1 on these cells was analyzed by flow cytometry using anti-HA antibody. (C) Left panel: cells were treated with (blue) or without (red) 0.069 U/ml phosphatidylinositol-specific phospholipase C (PI-PLC) at 37°C for 45 min before staining with anti-HA or anti-Ld (30-5-7). MEFs expressing vector only served as background staining (solid gray). The representative of two independent experiments is shown. Right panel: following incubation with indicated concentration of PI-PLC, MEF cells expressing Ld-pQa-1 or Thy1.1 were examined. Here endogenous MHC-I (H2–Kb) serves as a negative control protein; its level of surface expression was unaffected by PI-PLC. (D) Following a 30-min pulse with 35S-Cys/Met, pQa-1 transduced MEF cells were lysed with 1% NP-40 and immunoprecipitated for pQa-1 using anti-HA. The precipitated proteins were resolved on SDS-PAGE and visualized by autoradiography (left) or immunoblotted with the indicated antibodies (right). The representative of two independent experiments is shown. (E) MHC-Ia- and β2m-deficient MEFs (H2-Kb-/- H2-Db-/- B2m-/-; 3KO) or 3KO+β2m cells transduced with pQa-1-HA or vector control were examined for surface pQa-1 expression using anti-HA. The representative of two analyses is shown.
Figure 3
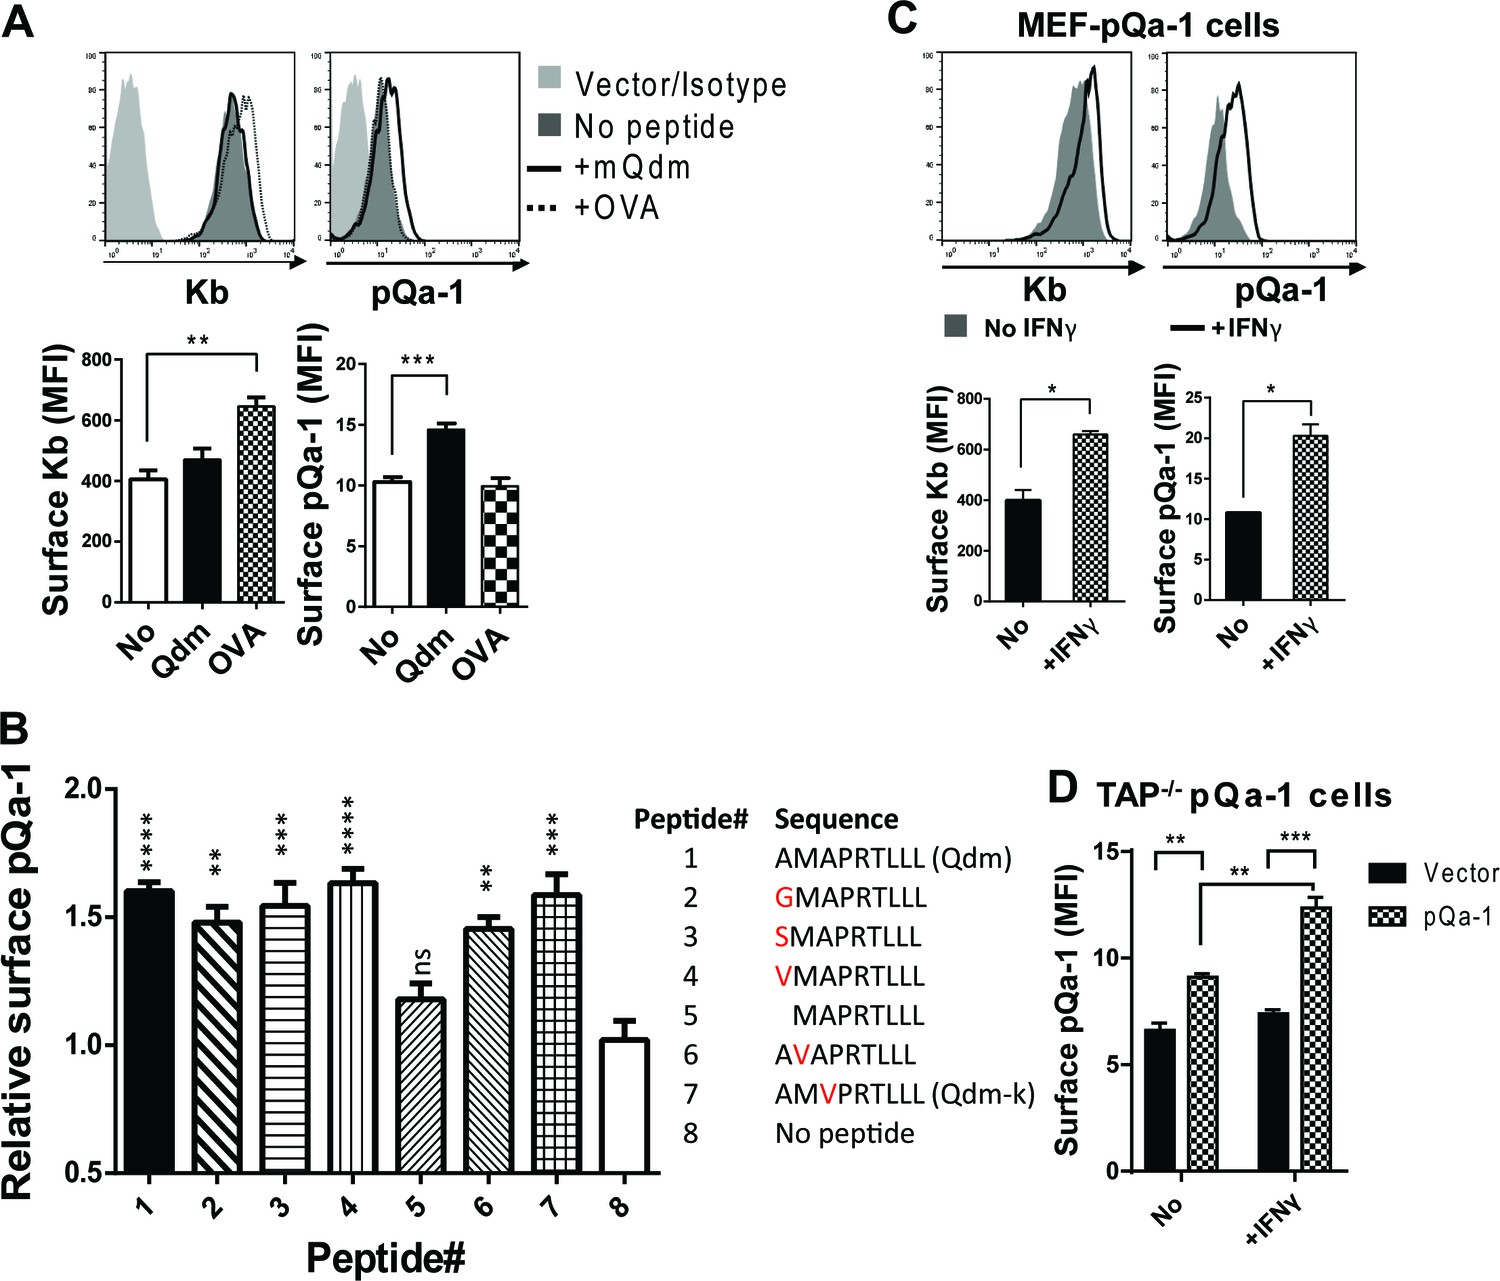
Qdm and Qdm-like peptides stabilize pQa-1 at the cell surface.
(A) Following incubation of MEF-pQa-1cells with 100 μM Qdm (AMAPRTLLL) or OVA257-264 (SIINFEKL) peptide at 37°C for 4 hr, surface pQa-1 and H2-Kb were analyzed by flow cytometry for comparison. (B) MEF-pQa-1were incubated with the indicated peptide (100 μM) at 27°C for 4 hr before staining for surface pQa-1. (C) Surface pQa-1 was FACS analyzed after incubation with 100 U/ml IFNγ for 24 hr. (D) Surface pQa-1 in a stably transduced TAP1-deficient (Tap1-/-) fibroblast line was detected by FACS after incubation with or without 100 U/ml IFNγ for 40 hr. Representative of two analyses with mean ±SD of duplicates is shown. Bars in the figures represent mean ±SEM of two (C) or three (A and B) independent analyses using unpaired t test or one-way ANOVA, Dunnett's multiple comparisons test to compare with no peptide controls (*=p < 0.05; **=p < 0.01; ***=p < 0.001; ****=p < 0.0001; ns = not significant). Endogenous MHC-I Kb in these cells served as positive control.
Figure 4
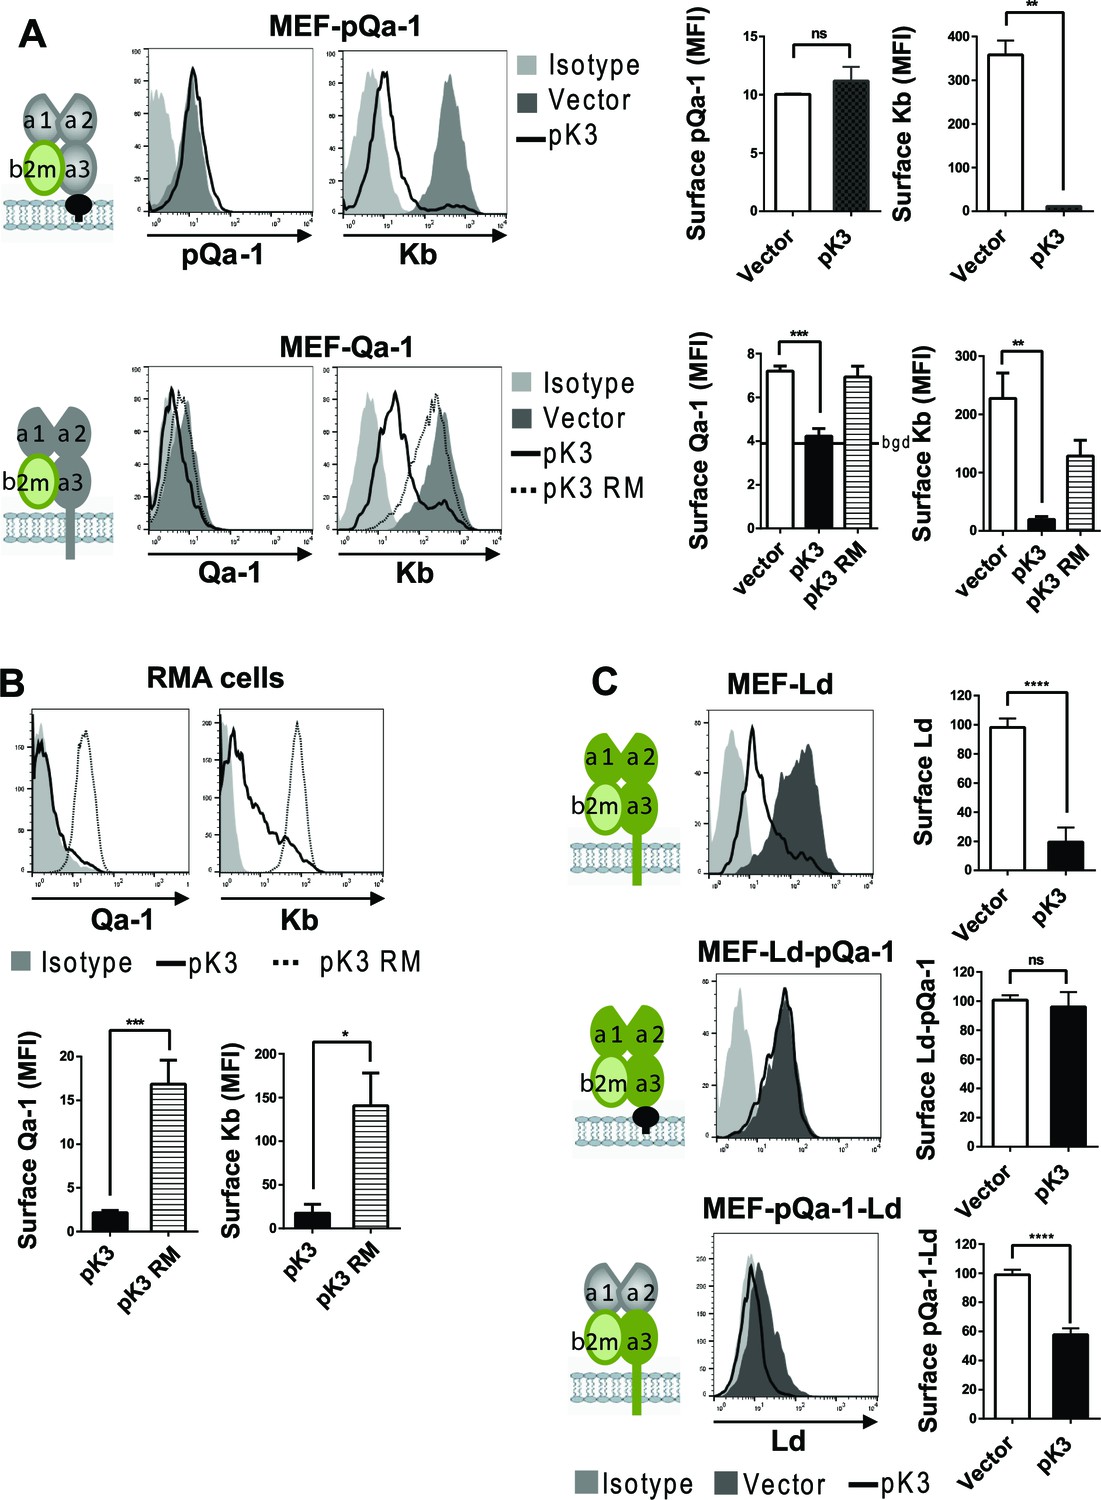
Qa-1 is sensitive to pK3-induced downregulation while pQa-1 is resistant.
(A) MEF-pQa-1 (upper panel) or MEF-Qa-1 (lower panel) cells were transduced with vector, pK3 or pK3 RING mutant (pK3 RM). Surface pQa-1/Qa-1 levels were determined by anti-HA/anti-Qa-1 staining. Surface expression of endogenous MHC-I Kb on these cells served as a positive control of pK3 function. (B) Surface expression of endogenous Qa-1 on RMA cells in the presence of vector, pK3 or pK3 RM were analyzed similarly. (C) Surface levels of classical MHC-I Ld, chimeric Ld-pQa-1 or chimeric pQa-1-Ld (as depicted by cartoons) on MER cells in the presence of vector or pK3 were analyzed. Quantification of median fluorescence intensity (MFI) in (A and B) or relative surface levels in (C) from two to four analyses are shown as bars with mean ±SEM. Unpaired t test or one-way ANOVA Dunnett's multiple comparisons test was used (*=p < 0.05; **=p < 0.01; ***=p < 0.001; ****=p < 0.0001; ns = not significant).
Figure 5 with 2 supplements
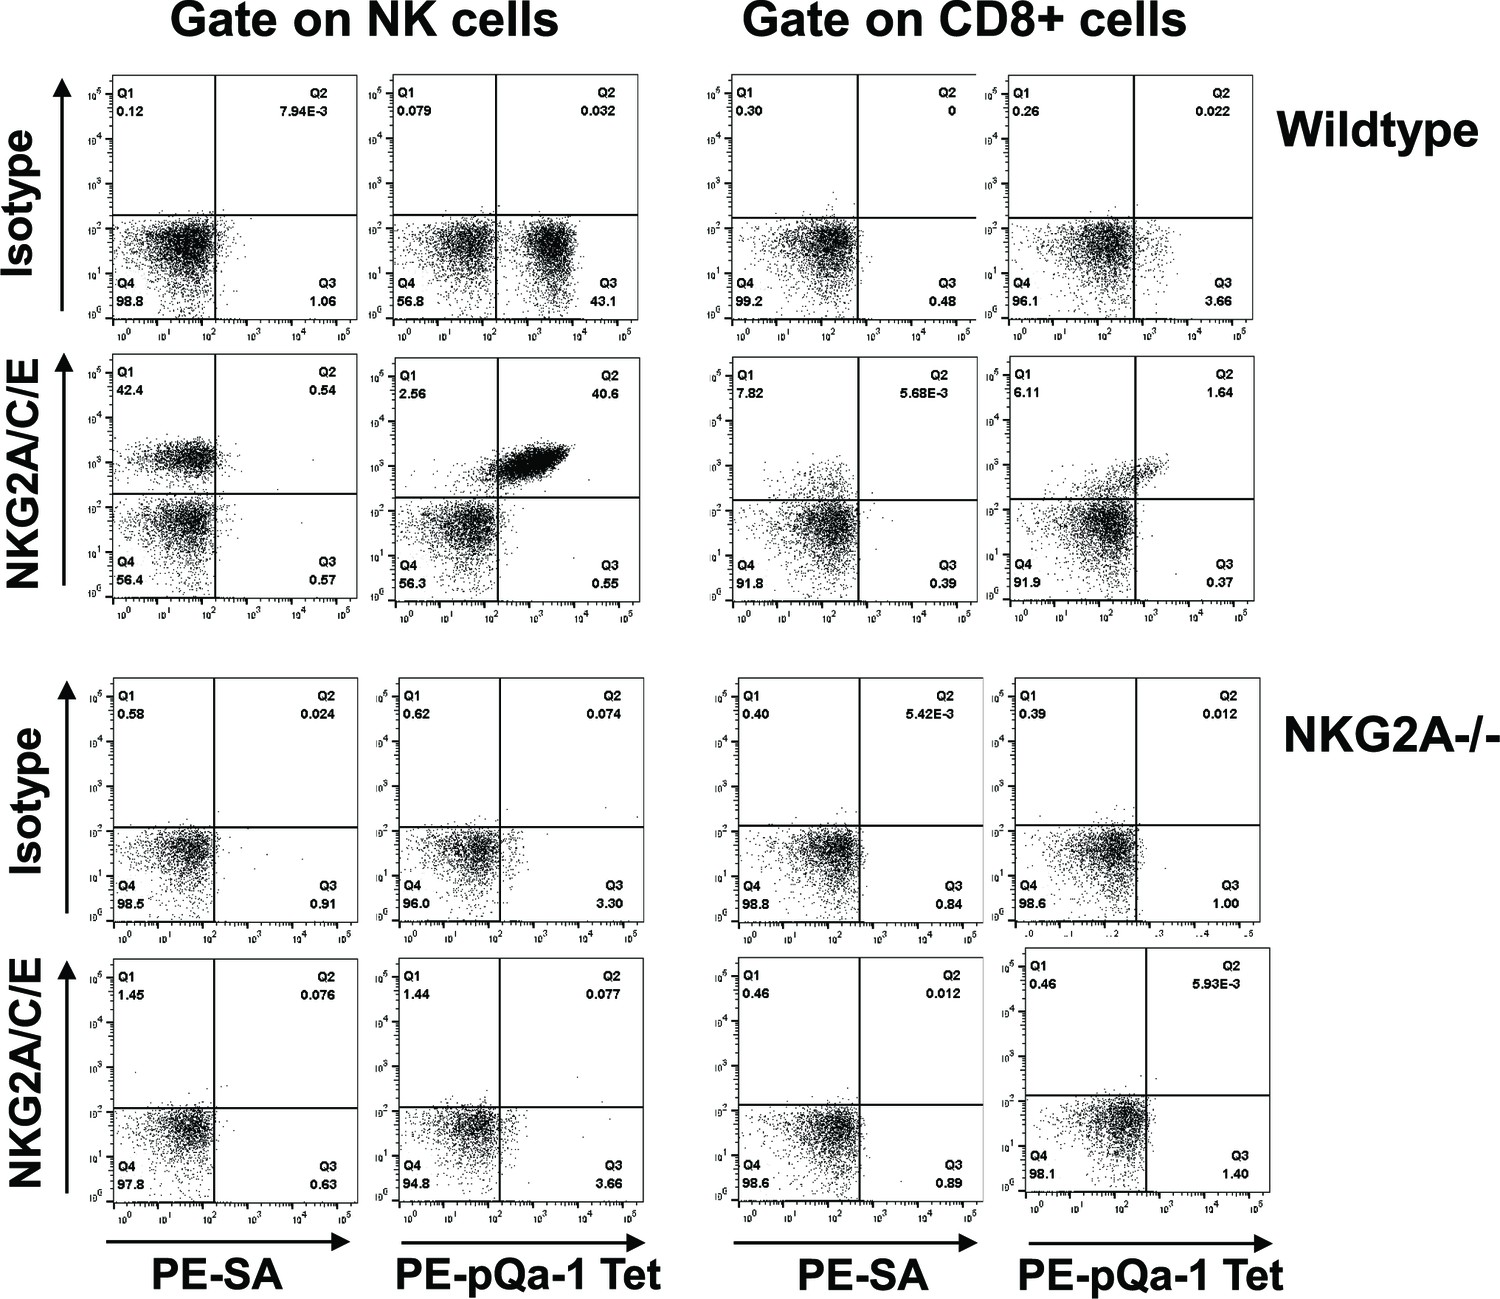
The Qdm-β2m-pQa-1 single chain trimer (SCT) specifically recognizes the CD94/NKG2A receptor.
(A) Spleen lymphocytes isolated from wildtype C57BL/6 or NKG2A-/- knockout mice were stained with PE-labeled pQa-1-dtSCT tetramer (PE-pQa-1 Tet), or PE-labeled streptavidin (PE-SA) as negative control, at room temperature for 1 hr followed by staining with a mixture of fluorochrome labeled antibodies containing either anti-NKG2A/C/E (20D5) or isotype control for 30 min. The stained cells were acquired by BD Canto II and data were analyzed with FlowJo software. Representative data of four (wildtype) and two (NKG2A-/-) independent experiments are shown. NK cells were defined as the live NK1.1+CD3-CD19- population, while CD8 T cells were gated on the live CD19- CD3+CD8+ population.
Figure 5—figure supplement 1
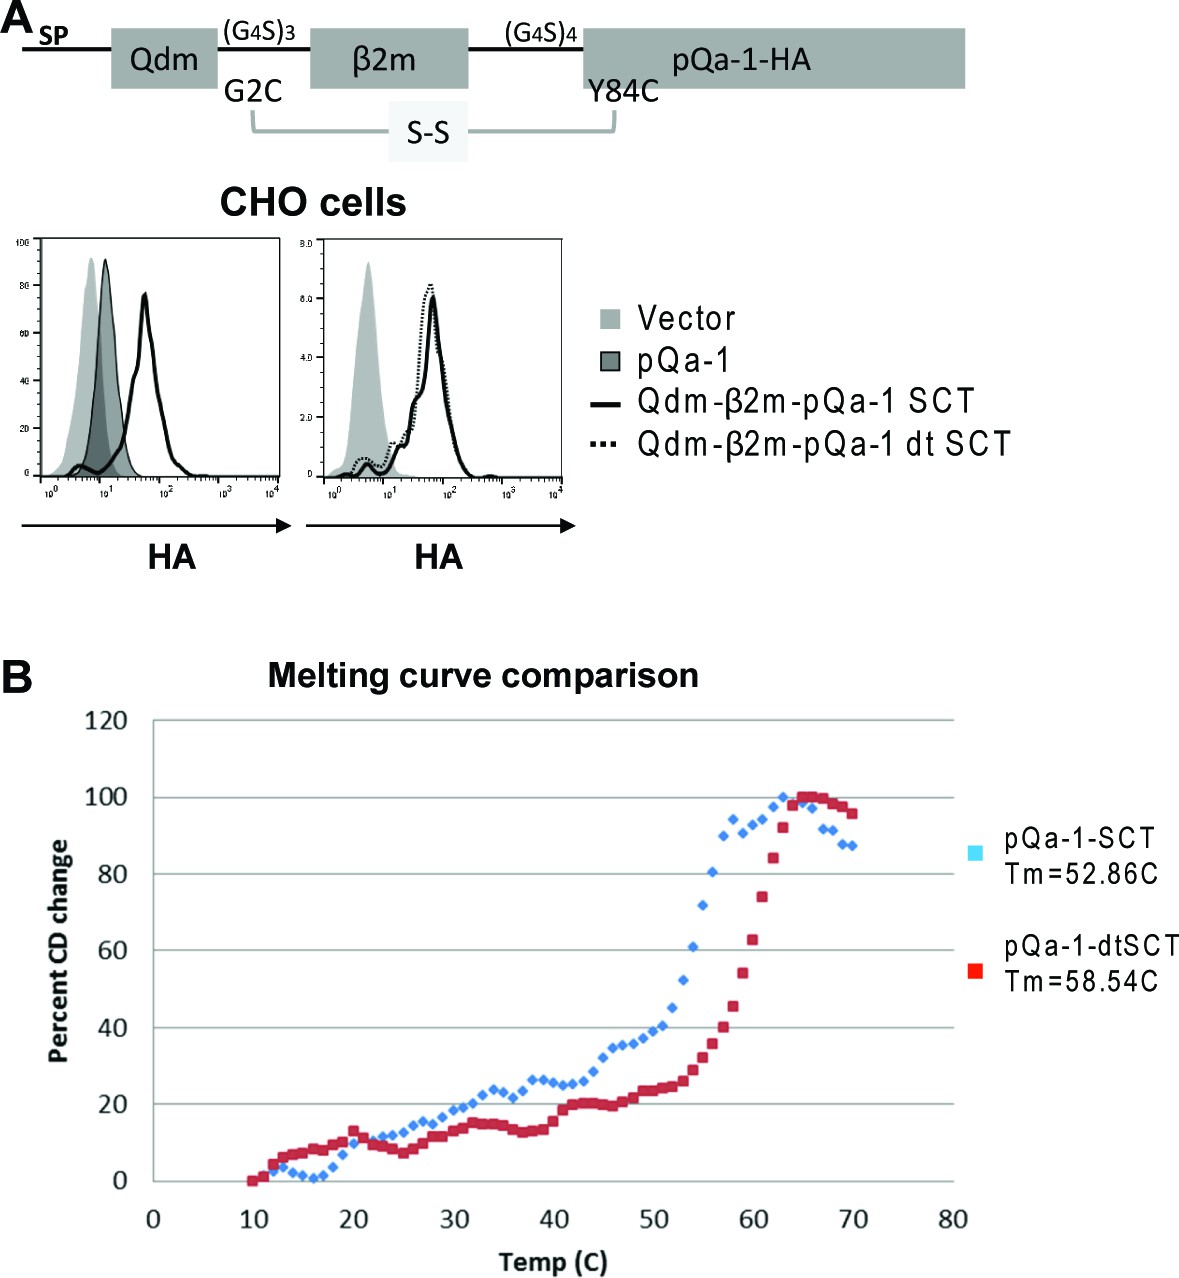
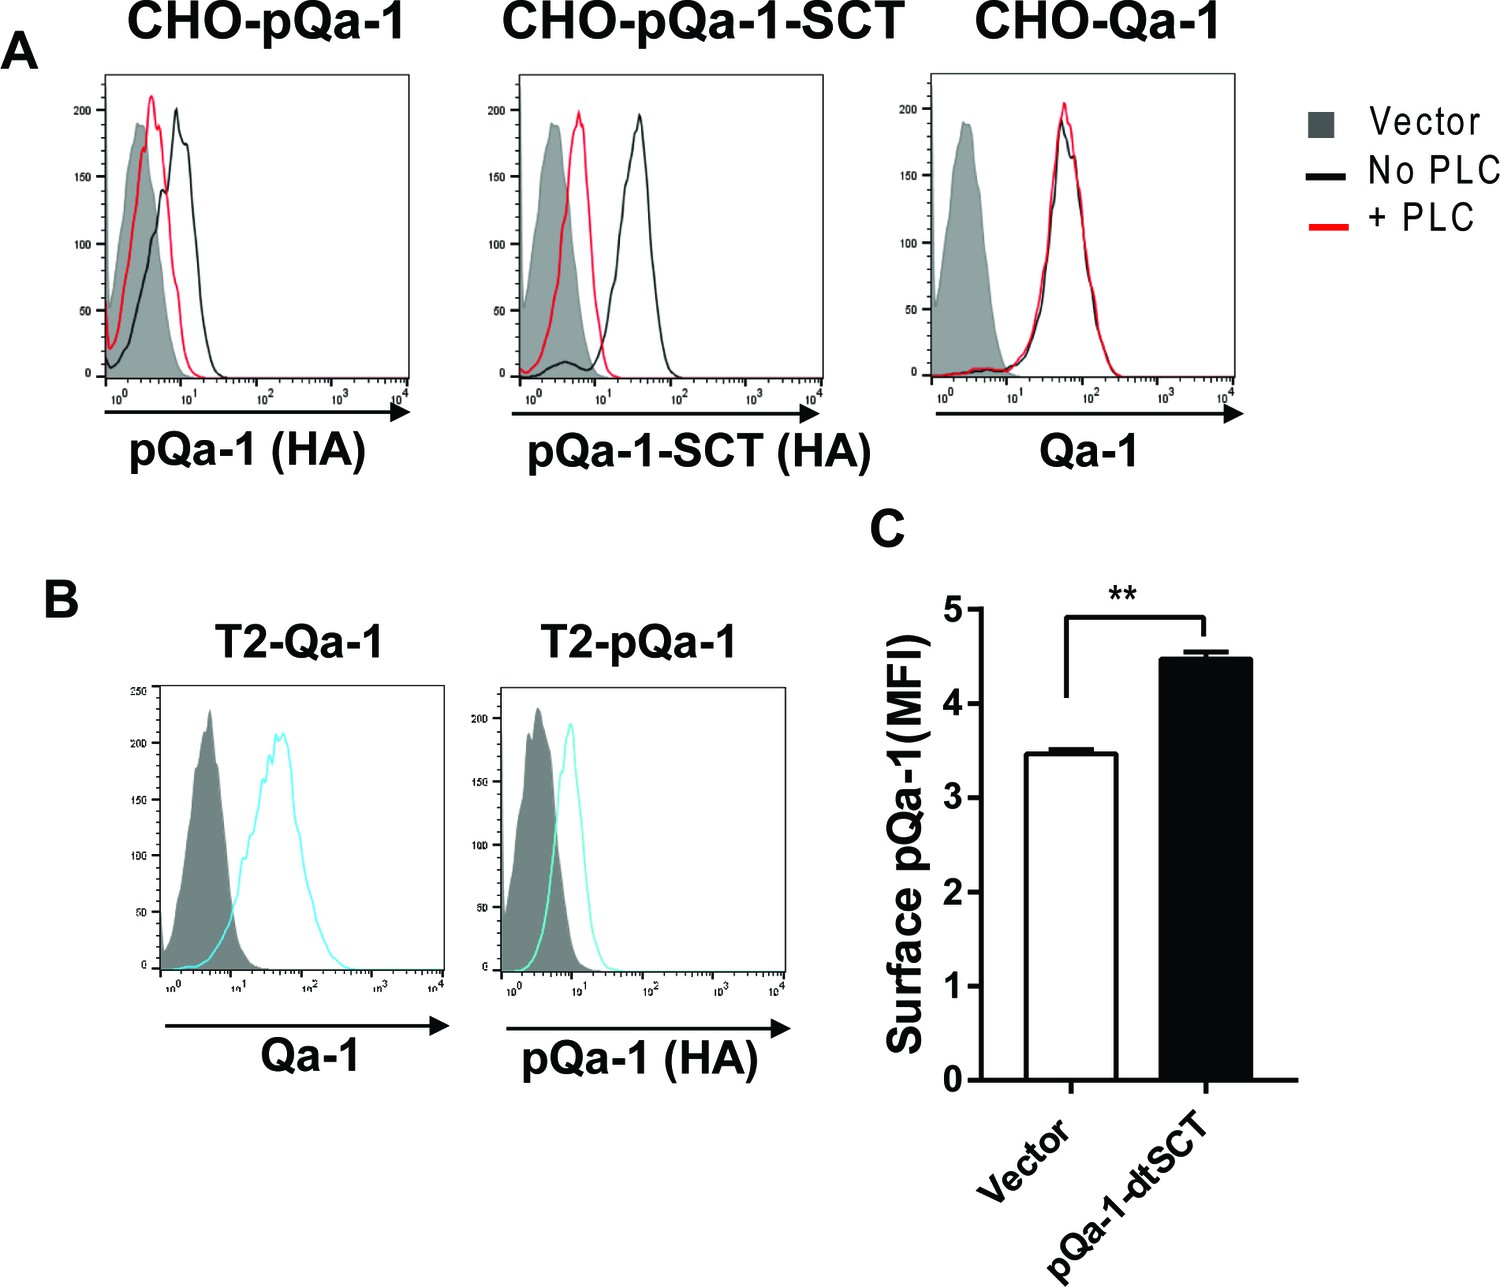
pQa-1 single chain trimer design and increased thermal stability.
(A) Schematic depiction of pQa-1-SCT. A disulfide-trapped version (dtSCT) was made by substitutions of Linker1 G2C and pQa-1 Y84C. Surface expression of pQa-1-SCT on CHO cells was compared with pQa-1 (left) or with pQa-1-dtSCT (right) by FACS analysis. (B) Thermostability of pQa-1-SCT or pQa-1-dtSCT was measured by circular dichroism (CD) as described (Mitaksov et al., 2007). The increase in the CD signal at 220 nm as a function of temperature was normalized on a scale of 0 to 100. The Tm for each protein is denoted in the legend. For these thermal denaturation studies, purified pQa-1-SCT proteins were dialyzed against buffer containing 10 mM K2HPO4/KHPO4pH = 7.5 and 150 mM NaCl, and diluted to 475 nM in buffer containing 20 mM K2HPO4/KHPO4pH = 7.5 and 150 mM NaCl. Circular dichroism (CD) spectra at 10°C were collected between 260 and 200 nm at 0.5 nm increments on a Jasco-810 instrument (Jasco Inc., Easton MD) equipped with a Peltier temperature controller. The thermal denaturation profiles were monitored by the change in CD signal at 220 nm as a function of temperature. Thermal scan data were collected at 1.0°C intervals from 10°C to 70°C with a temperature ramp rate of 50 °C/hour. Thermal denaturation curves were scaled from 0% to 100% to provide plots of the percent of signal change versus temperature. The Tm is the temperature at which the CD signal change is half of the total signal change. All measurements were made at least four times and averaged.
Figure 5—figure supplement 2
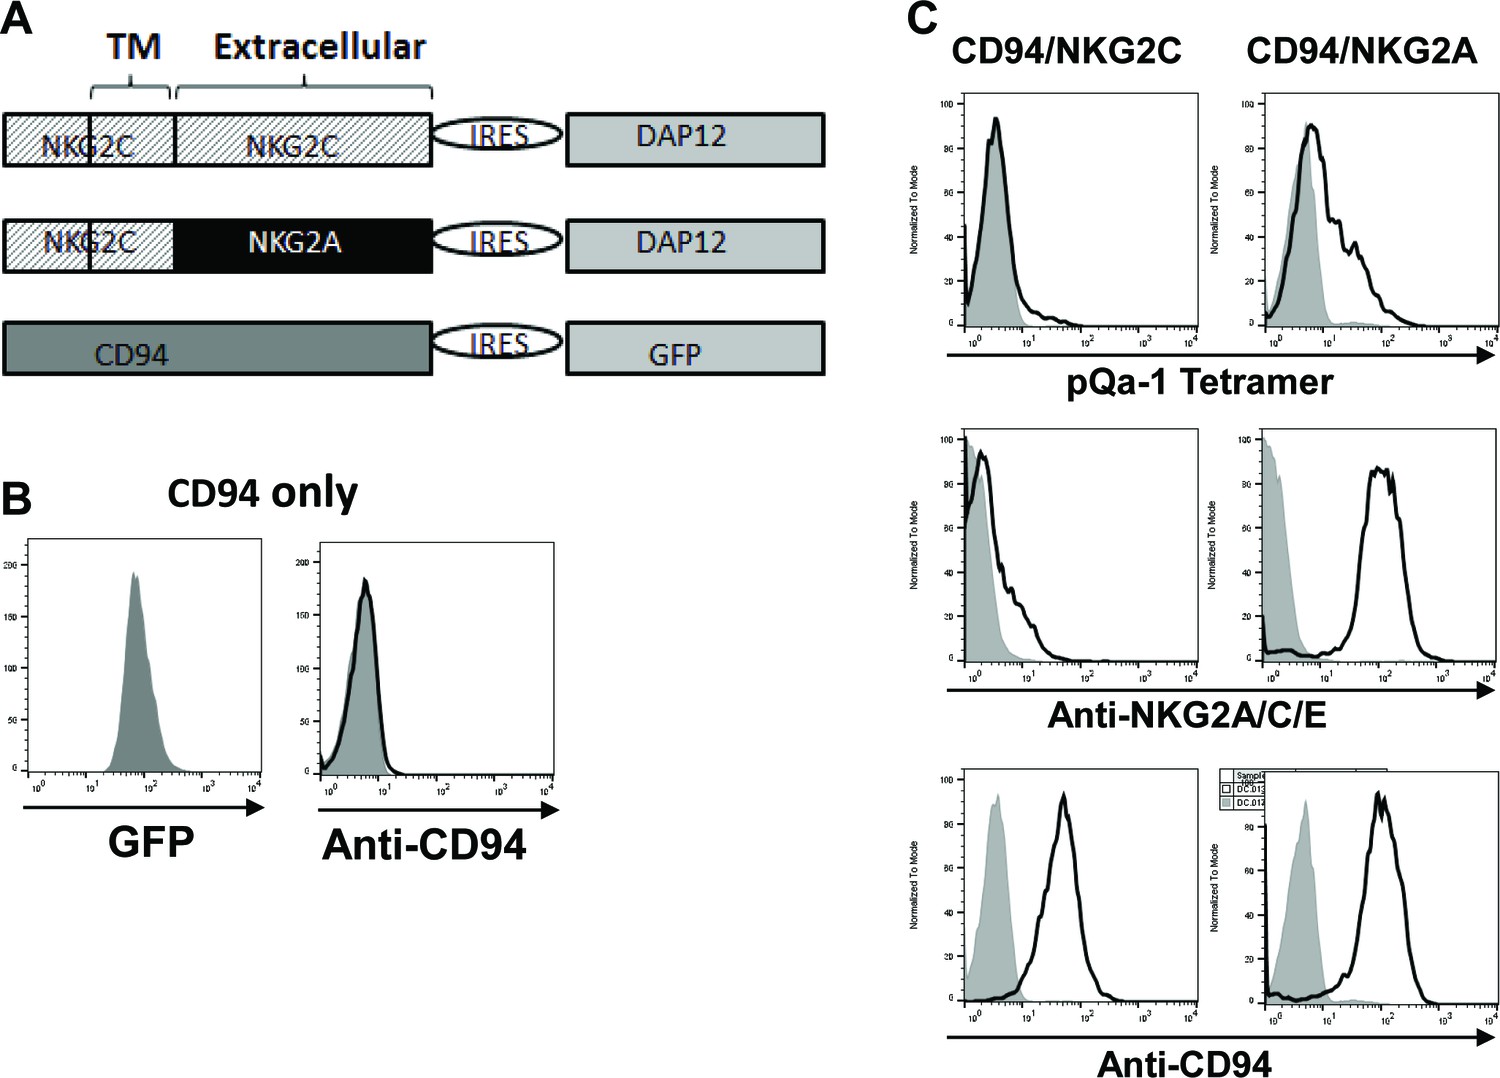
pQa-1-dtSCT tetramer stains CD94/NKG2A expressing cells stronger than CD94/NKG2C-expressing cells.
(A) Schematic depiction of the constructs for expression of CD94, CD94/NKG2C or CD94/NKG2A. (B) Mouse T lymphoma cell line BWZ.36 expressing CD94 alone indicated by GFP could not be detected by surface anti-CD94 staining. (C) BWZ.36-CD94 cells in (B) co-expressing NKG2C and DAP12 or NKG2A and DAP12 were stained by pQa-1-dtSCT tetramer, anti-NKG2A/C/E or anti-CD94, respectively. Parental BWZ.36 cells served as background (shaded peak). The data shown in (B) and (C) had been observed repeatedly.
Figure 6 with 1 supplement

Expression of pQa-1 bound with Qdm/Qdm-like peptide inhibits NKG2A+ NK cell activation and prevents tumor rejection in vivo.
C57BL/6 splenocytes were co-cultured with CHO cells expressing the indicated constructs and the NK cells were subsequently analyzed by flow cytometry (A–F). The ratio of IFNγ production between NKG2A+ and NKG2A- NK cells is shown in the bar graphs. (A) Representative dot plots of NK cell IFNγ production upon stimulation with CHO cells expressing vector, pQa-1, or Qa-1 in the presence of Qdm-k peptide (AMVPRTLLL). (B) Splenocytes were co-cultured with indicated CHO cells in the presence of Qdm-k or control peptide. (C) Co-cultures were performed as in (B) in the presence of isotype or 20D5 (anti-NKG2A/C/E) antibody. (D) IFNγ and (E) CD107a expression by NK cells in response to CHO cells expressing pQa-1 single chain trimer (pQa-1-SCT) was performed as in (C). (F) Same experiment as in (D) and (E) was conducted after CHO-pQa-1-SCT and CHO-V cells were treated with or without 0.5 U/ml PI-PLC. (A–F) Representative experiments are shown from two to three independent experiments per panel. Bars in the figures represent mean ±SEM of duplicates. (G) 5000 Qa-1-restricted Ln12 T cells were co-cultured overnight with titrating amounts of human T2 cells (TAP-deficient cells) expressing vector, Qa-1, or pQa-1. The amount of IFNγ in the supernatants was determined by ELISA. EC7.1-Qa-1, a mouse TAP- and MHC-Ia-deficient lymphoma cell line transduced to express Qa-1 served as a positive control. Mean ±SD of triplicates is shown. (H) Lung metastasis formation 14 days after intravenous injection B16F10 melanoma cells expressing pQa-dtSCT or vector control (B16-pQa-1 or B16-V). Dots over each bar represent individual mice, cumulative data from two independent experiments. Two-tailed unpaired t test was used (*=p < 0.05; **=p < 0.01).
Figure 6—figure supplement 1
Surface level of pQa-1 or Qa-1 on cells used in the assays in Figure 6.
(A) Cells used in Figure 6A–F. Surface pQa-1 and pQa-1-SCT but not Qa-1 molecules were susceptible to PI-PLC treatment (0.5 U/ml for 1 hr). (B) Cells used in Figure 6G. (C) Cells used in Figure 6H. Representative of two or three analyses is shown in (A and B) and mean ±SD of triplicates with unpaired t test (n = 3) is shown in (C).
Figure 7 with 2 supplements
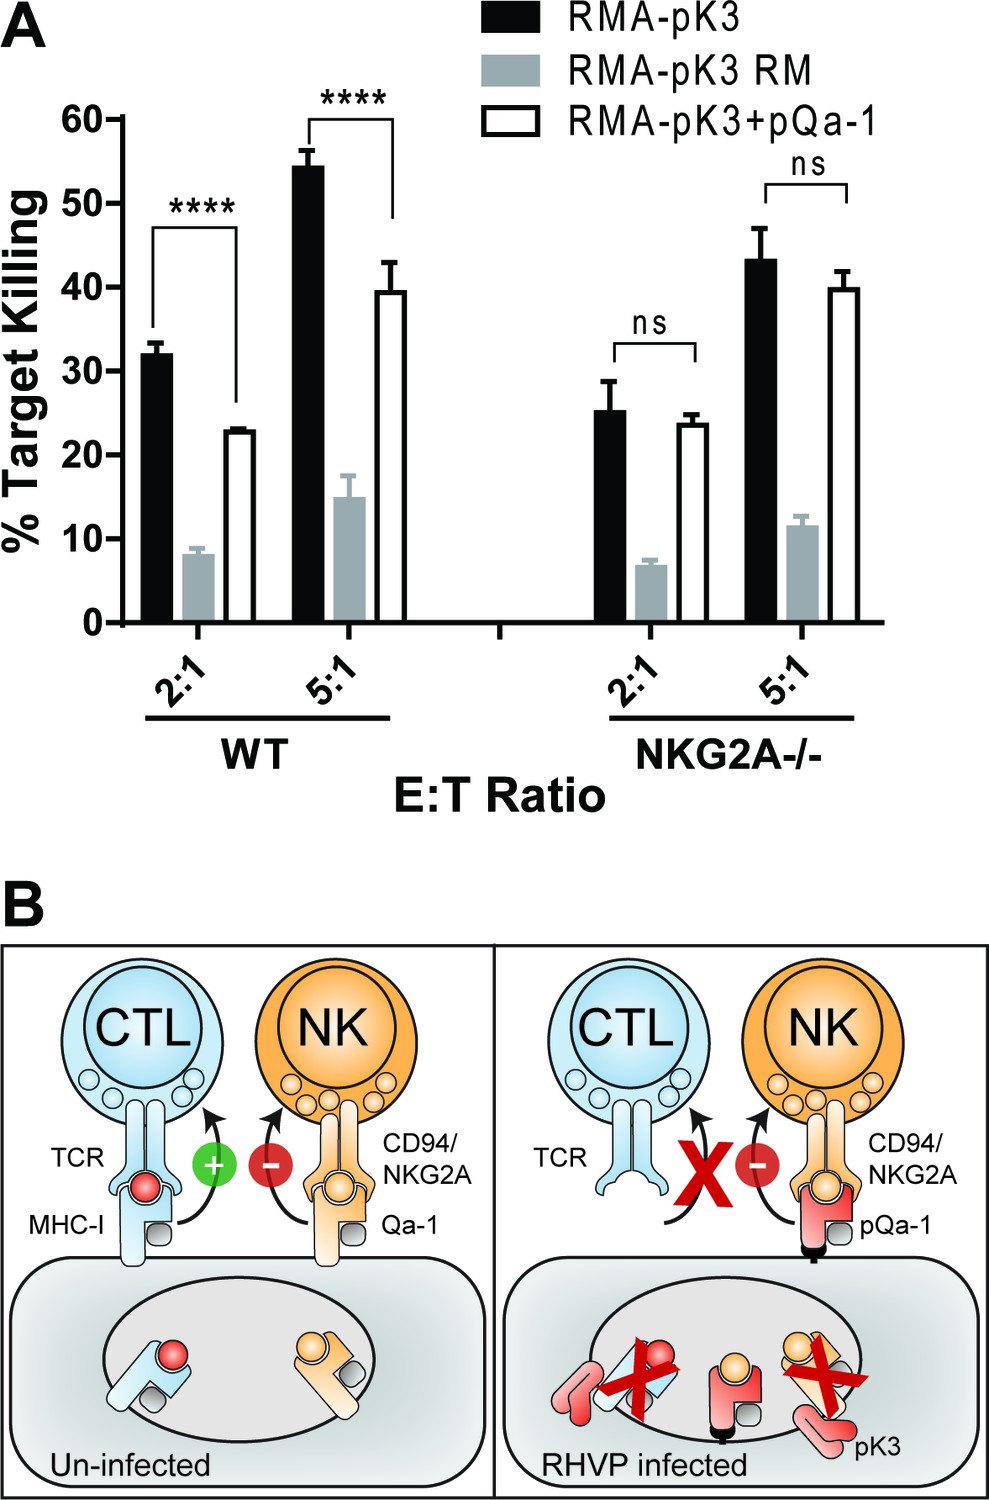
Downregulation of MHC-I by pK3 leads to NK killing susceptibility, while pQa-1 co-expression provides protection in an NKG2A-dependent manner.
(A) The GFP+ target cells (RMA cells expressing pK3 or pK3 RM by IRES-GFP vector or co-expressing pK3 and pQa-1) were mixed with the effectors (NK cells isolated from wildtype C57BL/6 or NKG2A-/- mice and activated by IL-2 for 6 days) at indicated E:T ratio and cultured at 37°C for 4 hr before stained with propidium iodide (PI) and analyzed by flow cytometry. NK killing%=[PI+ target %/(PI+ target%+PI- target%)*100]. Bars represent mean ±SD of four replicates. Dunnett's multiple comparisons test is used. (B) Working model for how RHVP-encoded pK3 and pQa-1 work in concert to evade CTL and NK killing. In normal circumstances, cytotoxic lymphocytes can survey foreign antigen through TCR recognition of MHC-I/peptide complexes at the cell surface, and NK cells can sense defects in antigen presentation and processing via engagement of HLA-E/Qa-1 by the inhibitory receptor CD94/NKG2A (left panel). In RHVP-infected cells, pK3 induces rapid degradation of MHC-I in the ER thus preventing CTL activation and clearance of infected cells; On the other hand, pQa-1 lacks an MHC-I like TM region and is thus resistant to pK3, which allows its cell surface expression and CD94/NKG2A engagement thus undermining ‘missing self’ recognition by NK cells (right panel).
Figure 7—figure supplement 1
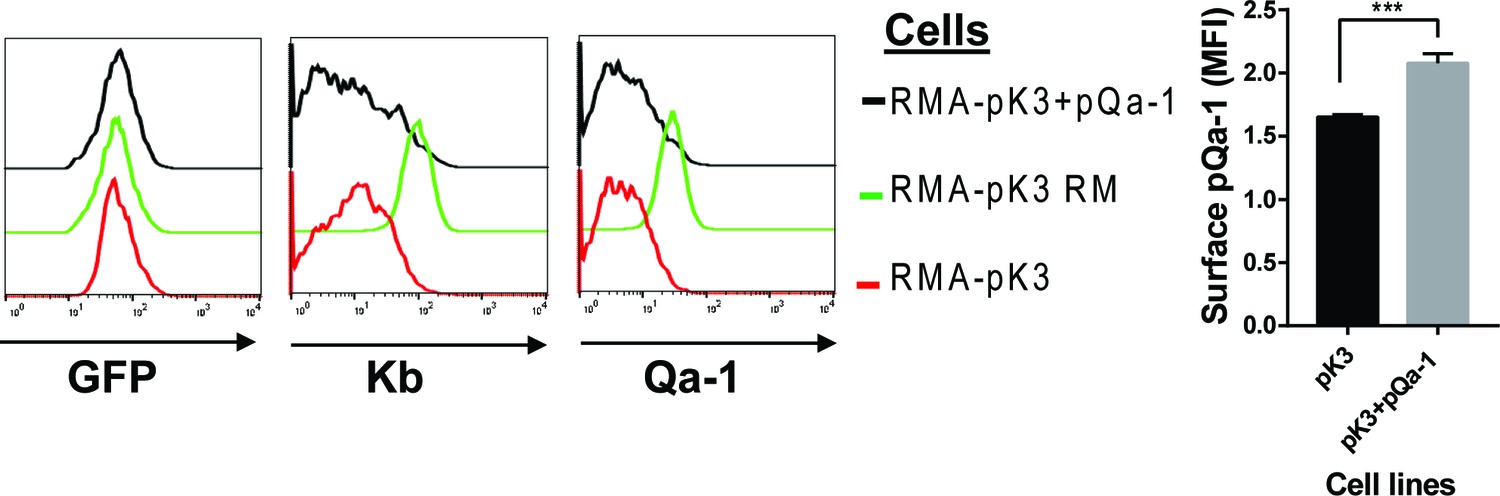
Surface level of endogenous Qa-1, MHC-I and transduced pQa-1 on RMA cells expressing pK3 or pK3 RING mutant (pK3 RM).
Because pK3 or pK3 RM was transduced into RMA cells using an IRES.GFP vector, GFP signal in the cells served as indicator of pK3 or pK3 RM expression. These cells were used as target of syngeneic NK killing in Figure 7.
Figure 7—figure supplement 2
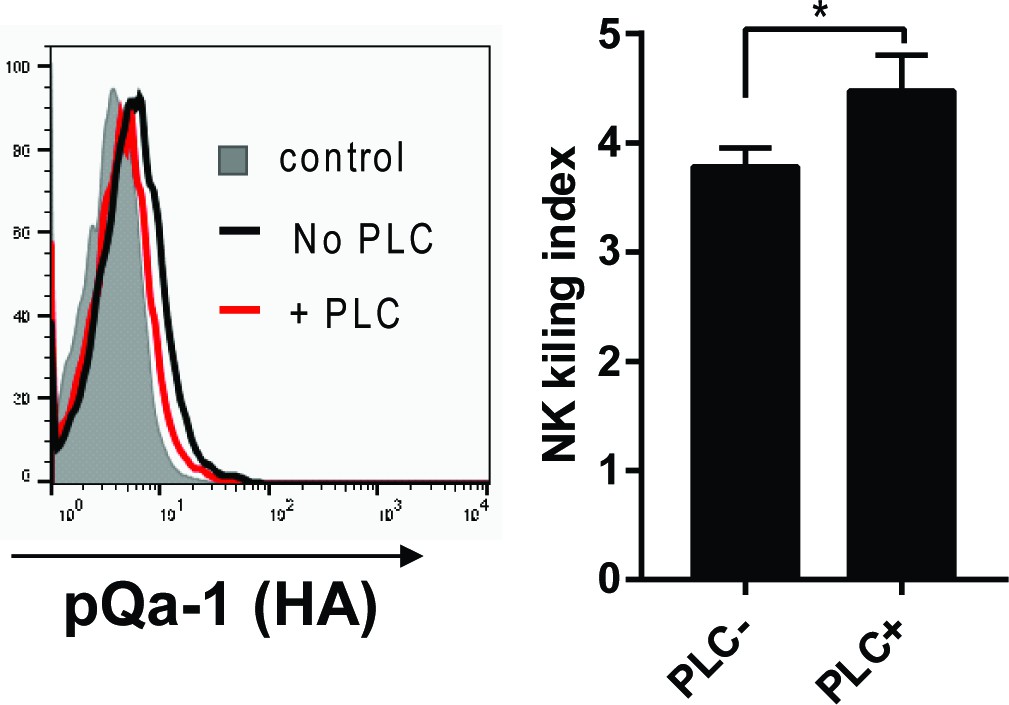
PI-PLC treatment diminishes pQa-1 mediated protection of RMA target cells expressing pK3.
NK cytotoxicity assay was conducted as described in Figure 7 after treatment of RMA cells co-expressing pK3 and pQa-1 (RMA-pK3 +pQa-1) with 0.5 U/ml PI-PLC at 37°C for 1 hr. PI-PLC treatment led to a slight decrease in surface pQa-1 protein as detected using an HA-tag-specific antibody (left). A moderate increase in NK killing was evident with PI-PLC-treated cells compared with untreated cells (right). This analysis was done in triplicate.
Tables
Key resources table
| Reagent type (species) or resource | Designation | Source or reference | Identifiers | Additional information |
|---|---|---|---|---|
| Strain, strain background (M. musculus) | Klrc1-/- | PMID: 26680205 | Dr. Marco Colonna laboratory (Washington University School of Medicine) | |
| Strain, strain background (M. musculus) | C57BL/6NCr | Charles River Laboratories | Strain code: 556 | |
| Cell line (M. musculus) | B6/WT-3 | Dr. Stephen R Jennings (Louisiana State University Health Sciences Center); PMID: 6316651 | an SV-40 transformed, C57BL/6 murine embryo fibroblasts line | |
| Cell line (M. musculus) | BWZ.36 | Dr. Nilabh Shastri (University of California, Berkeley); PMID:8186188 | a mouse T lymphoma line | |
| Cell line (M. musculus) | FT1- (Tap1-/-) | Dr. Michael Edidin (Johns Hopkin University); PMID:10485658 | a fibroblast line derived from Tap1 knockout mice | |
| Cell line (M. musculus) | 3KO (H2-K-/-, H2-D-/-, B2m-/- murine embryo fibroblast line) | Dr. Ted H. Hansen laboratory; PMID:12530981 | 3KO mice were derived by breeding H2-Kb/-Db doubly deficient mice (PMID:10229092) with B2m-/- mice (Jackson Laboratories) | |
| Cell line (Homo sapiens) | T2 (174 x CEM.T2) | American Type Culture Collection | ATCC CRL-1992, RRID:CVCL_2211 | a TAP deficient T-B lymphoblast hybrid (PMID: 3522223) |
| Cell line (M. musculus) | RMA | PMID: 3877776 | RRID:CVCL_J385 | |
| Cell line (M. musculus) | B16-F10 | American Type Culture Collection | ATCC CRL-6475, RRID:CVCL_0159 | |
| Cell line (Cricetulus griseus) | CHO | Dr. Pamela Stanley laboratory (Albert Einstein College of Medicine) | ||
| Cell line (Homo sapiens) | 293F (FreeStyle 293 F Cells) | Thermo Fisher Scientific | R79007, RRID:CVCL_D603 | |
| Cell line (Homo sapiens) | 293T (HEK 293T) | American Type Culture Collection | ATCC CRL-3216, RRID:CVCL_0063 | |
| Antibody | FITC labeled anti-mouse NKG2A/C/E | eBioscience | cat# 11-5896-82 | clone: 20D5 (1:100) |
| Antibody | FITC labeled isotype control (RatIgG2a) | eBioscience | cat# 11-4321-85 | clone: eBR2a (1:100) |
| Antibody | eFluor 660 labeled anti-mouse CD107a | eBioscience | cat# 50-1071-82 | clone: eBio1D4B (1:1000 in culture) |
| Antibody | APC-eFluor labeled anti-mouse CD19 | eBioscience | cat# 47-0193-82 | clone: eBio 1D3 (1:100) |
| Antibody | PE-Cy7 labeled anti-mouse CD19 | eBioscience | cat# 25-0193-82 | clone: eBio1D3 (1:200) |
| Antibody | APC-eFluor 780 labled anti-mouse CD3e | eBioscience | cat# 47-0031-82 | clone: 145–2 C11 (1:100) |
| Antibody | Pacific Blue labeled anti-mouse CD3e | Biolegend | cat# 100214 | clone: 17A2 (1:100) |
| Antibody | PE-eFluor 610 labeled anti-mouse CD8a | eBioscience | cat# 61-0081-80 | clone: 53–6.7 (1:200) |
| Antibody | PE labeled anti-mouse CD94 | eBioscience | cat# 12-0941-82 | clone: 18D3 (1:100) |
| Antibody | mouse anti-HA tag | Covance | cat# MMS-101P | clone: 16B12 (1:500) |
| Antibody | eFluor 450 labeled anti-mouse IFNg | eBioscience | cat# 48-7311-82 | clone: XMG1.2 (1:100) |
| Antibody | PE-Cy7 labeled anti-mouse NK1.1 | eBioscience | cat# 25-5941-82 | clone: PK136 (1:100) |
| Antibody | PerCp Cy5.5 labeled anti-mouse NK1.1 | eBioscience | cat# 45-5941-82 | clone: PK136 (1:200) |
| Antibody | PE-labeled anti-mouse Thy1.1 | BD PharMingen | cat# 551401 | clone: OX-7 (1:150) |
| Antibody | biotin labeled anti-mouse Qa-1 | BD PharMingen | cat# 559829 | clone: 6A8.6F10.1A6 (1:200) |
| Recombinant DNA reagent | pMIG_pQa-1-HA | current study | Schematic depiction is shown in Figure 2A | |
| Recombinant DNA reagent | pMIN_pQa-1-HA | current study | pMSCV.IRES.neo (pMIN) was described previously (PMID:15280476) | |
| Recombinant DNA reagent | pMIG_pK3 | PMID:22403403 | Dr. Ted H Hansen laboratory | |
| Recombinant DNA reagent | pMIN_Qa-1 | current study | DNA sequence encoding Qa-1b (NM_034528) was subcloned into pMIN vector | |
| Recombinant DNA reagent | pMIG_pQa-1-SCT | current study | Schematic depiction is shown in Figure 5—figure supplement 1 | |
| Recombinant DNA reagent | pFM1.2R_pQa- 1-SCT-BirA | current study | Described in the DAN constructs section in Materials and methods | |
| Peptide, recombinant protein | pQa-1-SCT | current study | Described in the Production of pQa-1-SCT Proteins and Tetramers section in Materials and methods | |
| Commercial assay or kit | EasySep mouse NK cell isolation kit | StemCell Tecknologies | cat# 19815 | |
| Chemical compound, drug | PI-PLC (phosphatidylinositol -specific phospholipase C) | Sigma | P8804 | |
| Software, algorithm | PHYLIP Neighbor Joining algorithm | http://evolution.genetics.washington.edu/phylip/phylipweb.html | ||
| Others | rodent herpesvirus Peru (RHVP) | PMID: 21209105 | Dr. Herbert W. Virgin laboratory in Washington University School of Medicine |
Additional files
-
Supplementary file 1
RHVP encodes a protein with high identity to Qa-1.
- https://doi.org/10.7554/eLife.38667.017
-
Supplementary file 2
Peptides used for pQa-1 surface stabilization assay.
- https://doi.org/10.7554/eLife.38667.016
Download links
A two-part list of links to download the article, or parts of the article, in various formats.
Downloads (link to download the article as PDF)
Open citations (links to open the citations from this article in various online reference manager services)
Cite this article (links to download the citations from this article in formats compatible with various reference manager tools)
A herpesvirus encoded Qa-1 mimic inhibits natural killer cell cytotoxicity through CD94/NKG2A receptor engagement
eLife 7:e38667.
https://doi.org/10.7554/eLife.38667


