Translational initiation factor eIF5 replaces eIF1 on the 40S ribosomal subunit to promote start-codon recognition
- MRC Laboratory of Molecular Biology, United Kingdom
- Instituto de Biomedicina de Valencia (IBV-CSIC), Spain
- Indian Institute of Science, India
- Shoolini University of Biotechnology and Management Sciences, India
- Eunice K Shriver National Institute of Child Health and Human Development, National Institutes of Health, United States
Figures
Figure 1 with 6 supplements
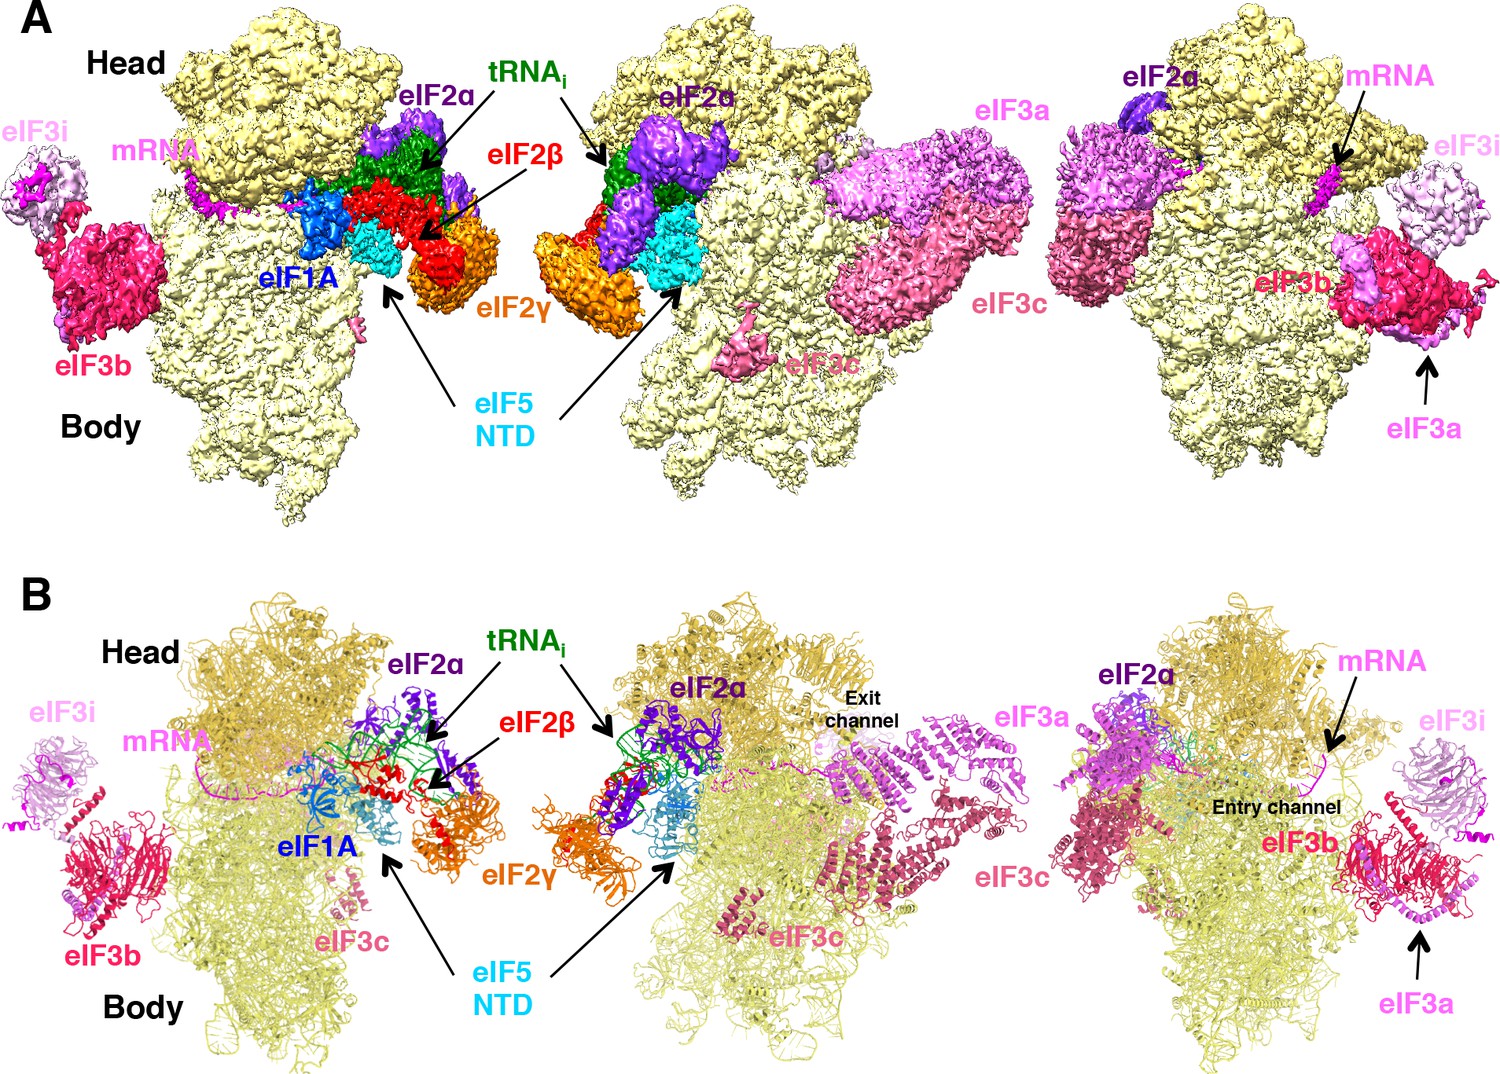
Cryo-EM structure of py48S-eIF5N.
(A) CryoEM maps of the PIC py48S-eIF5N shown in three orientations. Regions of the map are colored by component to show the 40S subunit (yellow), eIF1A (blue), eIF5-NTD (cyan), Met-tRNAiMet (green), mRNA (magenta), eIF2α (violet), eIF2γ (orange), eIF2β (red), eIF3 (different shades of pink). The 40S head is shown in a darker yellow compared to the body. The density for 40S, eIF1A, mRNA, tRNA, eIF2 subunits and eIF5 is taken from Map C1, whereas density for eIF3 PCI domains is taken from Map A, and for eIF3-bgi subcomplex from Map B. The same colors are used in all the figures. (B) Atomic model for the PIC in the same colors and in the same three orientations. See also Figure 1—figure supplements 1, 2, 3, 4, 5 and 6.
Figure 1—figure supplement 1

Scheme of 3D classification of data.
For Sample 1 (without crosslinking dataset) 394,672 particles were selected after 2D classification and an initial 3D refinement was done. After two rounds of 3D-classification, a class containing clear density for TC was refined to 3.0 Å-resolution (Map 1). Densities for peripheral and flexible elements like eIF3, eIF2β and eIF2γ are not seen in the completely sharpened map. For Sample 2 (1%-formaldehyde-crosslinked dataset) 312,041 particles were selected after 2D classification and an initial 3D refinement was done. After two rounds of 3D-classification, a class containing clear density for TC was obtained. Particles from both samples were joined and further separate, focused 3D classifications were carried out. The eIF3 masks ‘PCI mask’ and ‘bgi mask’ as well as the ‘TC mask’ used separately for focused 3D classification on the combined 271,706 particles are shown by an outline. The scheme shows how each map (Maps: 1, (A, B, C1 and C2) was obtained. See ‘Analysis and structure determination’ section for detailed information.
Figure 1—figure supplement 2

Validation of the maps.
(A) Gold-standard Fourier Shell Correlation (FSC) curves for the Maps 1, A and B. (B) Gold-standard Fourier Shell Correlation (FSC) curves for Maps C1 and C2. (C) Analysis of overfitting by cross-validation of the Model C1. FSCwork curves (red) corresponding to the refined model versus the half-map it was refined against, and FSCtest curves (green), that is those calculated between the refined atomic model and the other half-map. The black curve shows the FSC curve between a reconstruction from all particles and the model refined against the map. (D) Analysis of overfitting by cross-validation, similar to that in (C), of the Model C2.
Figure 1—figure supplement 3
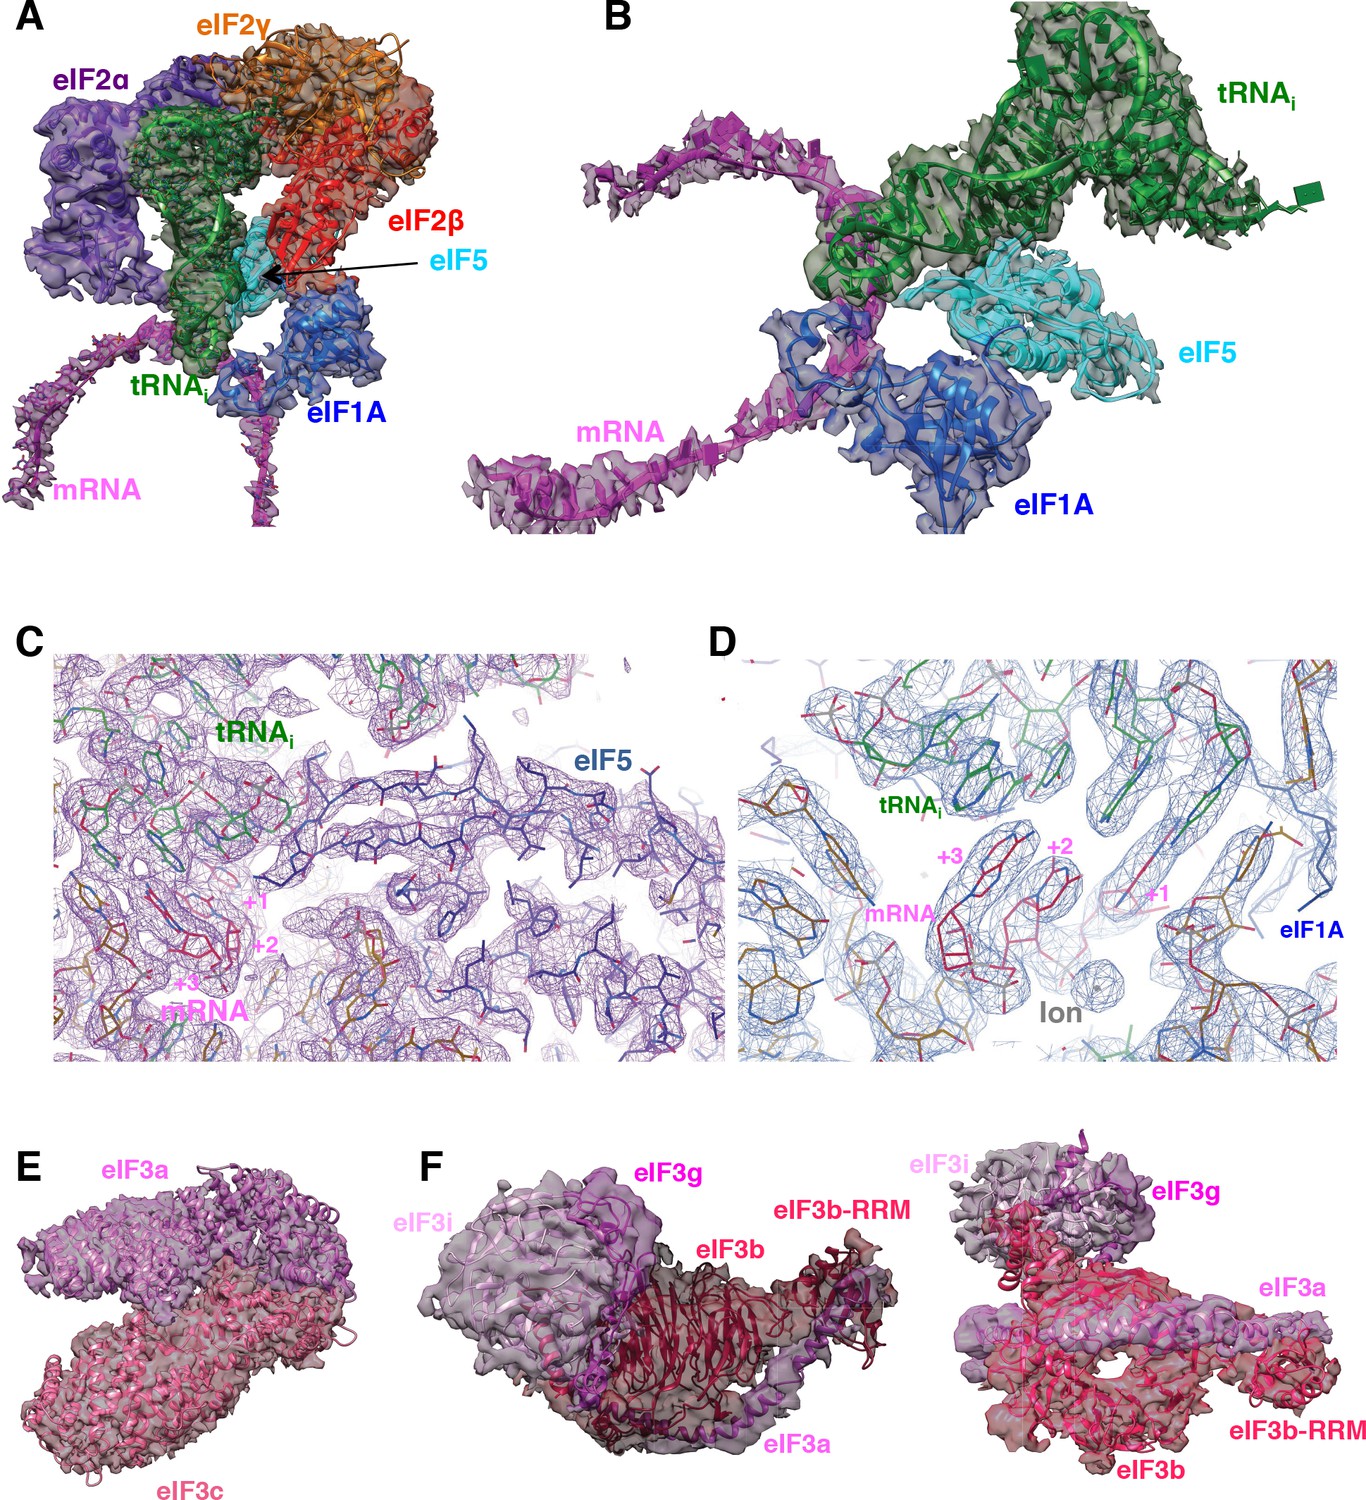
Fitting of ligands in density maps.
(A) Fitting of mRNA (magenta), eIF1A (marine), eIF5-NTD (cyan), tRNAi (green), eIF2α (purple), eIF2β (red) and eIF2γ (orange) in Map C1. (B) As in A, but shown in a different orientation and omitting eIF2 components to highlight the fitting of eIF5-NTD. (C) High-resolution features for tRNAi, mRNA and eIF5-NTD at the P site, at 3.0 Å-resolution (Map 1). (D) As in C, but showing the ion centered around the mRNA codon (E) Fitting of the eIF3a/c PCI domain dimer in map A. (F) Fitting of the eIF3bgi subcomplex in map B, shown in two orientations.
Figure 1—figure supplement 4

Map quality and local resolution Surface (left or top) and cross-sections (right or bottom) of gaussian-filtered maps, colored according to local resolution.
(A) Map 1 (B) Map C1 (C) Map B (D) Map A.
Figure 1—figure supplement 5
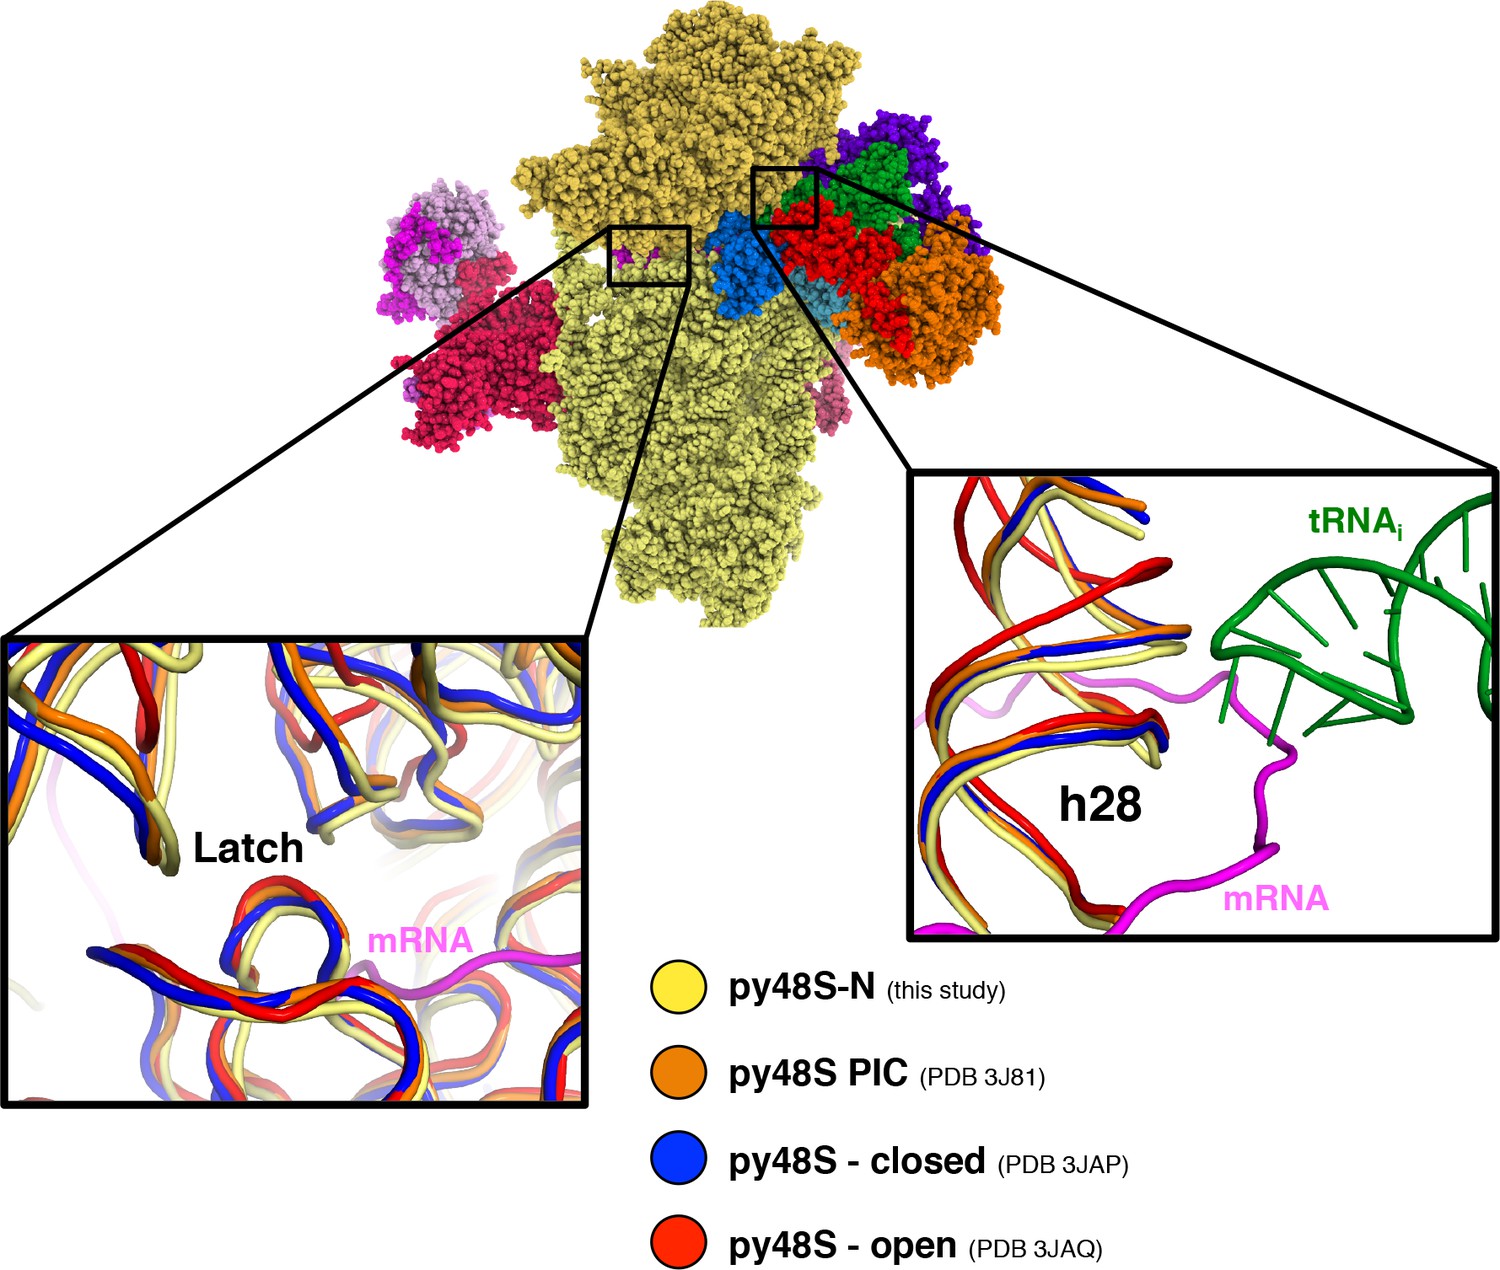
Latch and h28 conformation and head closure in different py48S PICs.
Superimposition of different py48S complexes shows a different degree of head closure around the latch area (left inset). Right inset shows distinct h28 conformations; only py48S-open presents a non-compressed h28, whereas in all other PICs, including py48S-eIF5N presented here, h28 is compressed.
Figure 1—figure supplement 6
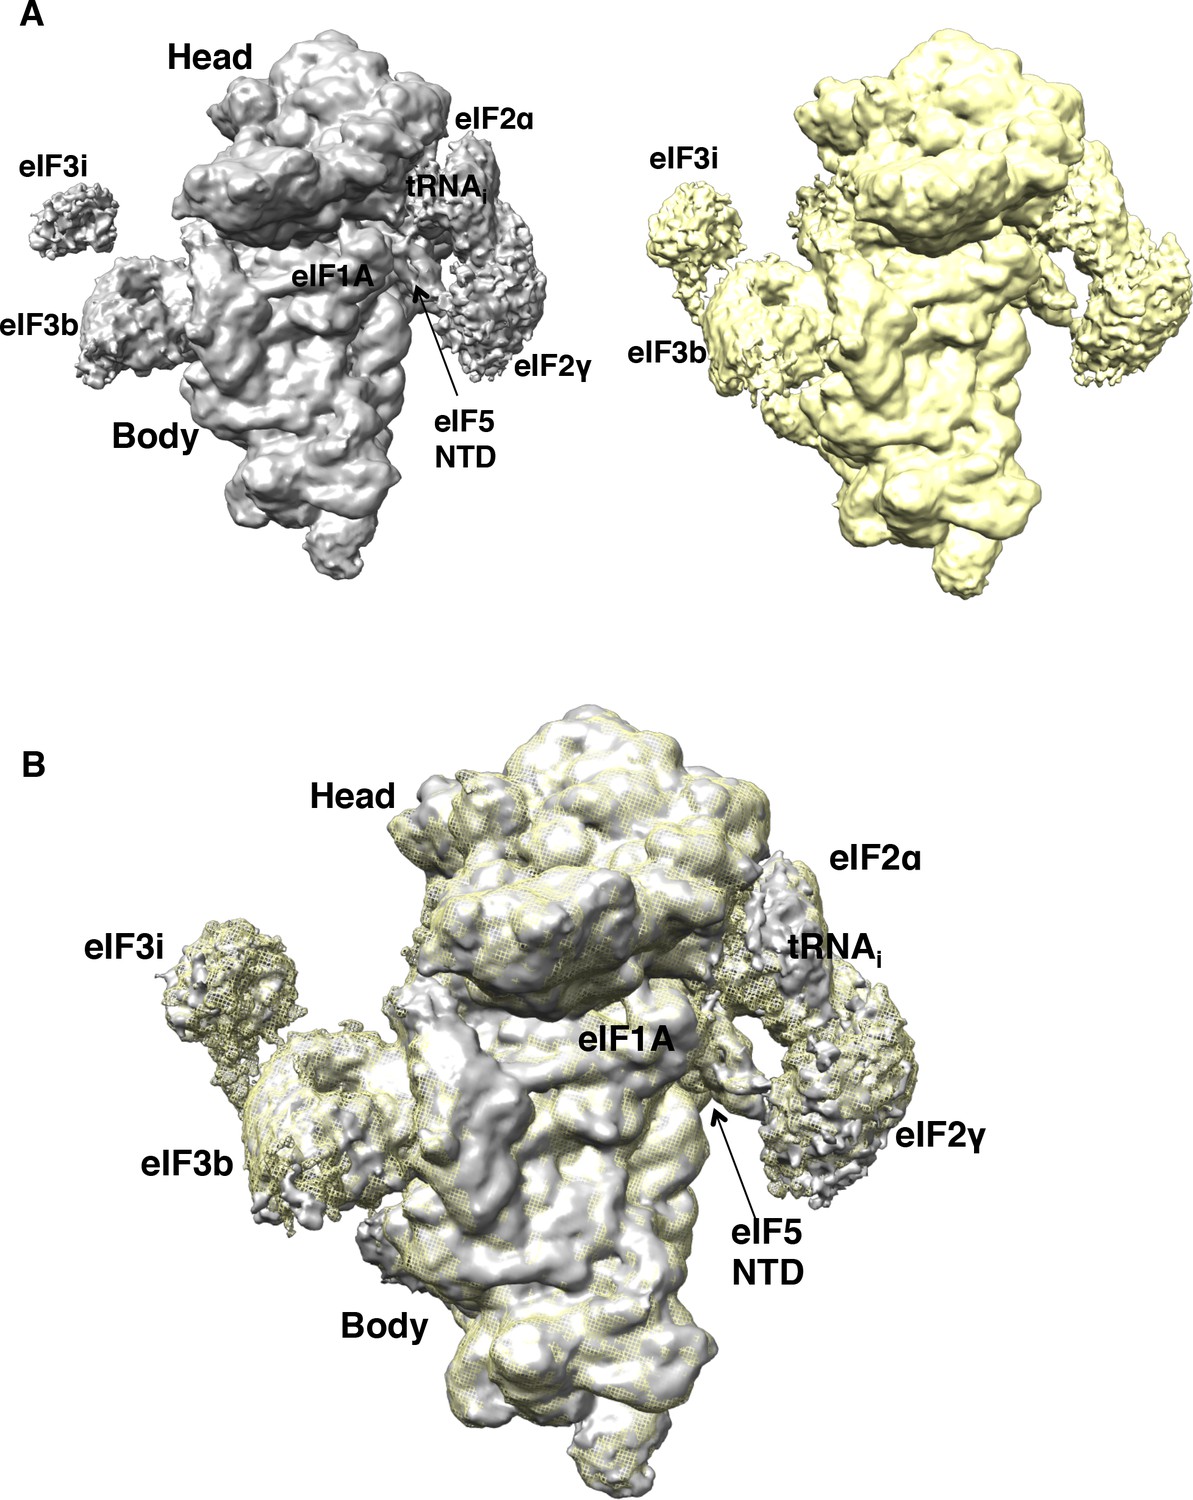
Comparison of the maps obtained with particles from sample 1 (non-crosslinked) and sample 2 (1%-formaldehyde crosslinked).
(A,B) Particles in map B belonging to sample 1 (non-crosslinked; gray) or sample 2 (crosslinked; yellow) were refined independently. Resulting maps, shown separately in (A), or superposed (B) are nearly identical, except for the higher occupancy for eIF3b/eIF3i subunits in the crosslinked dataset.
Figure 2 with 3 supplements
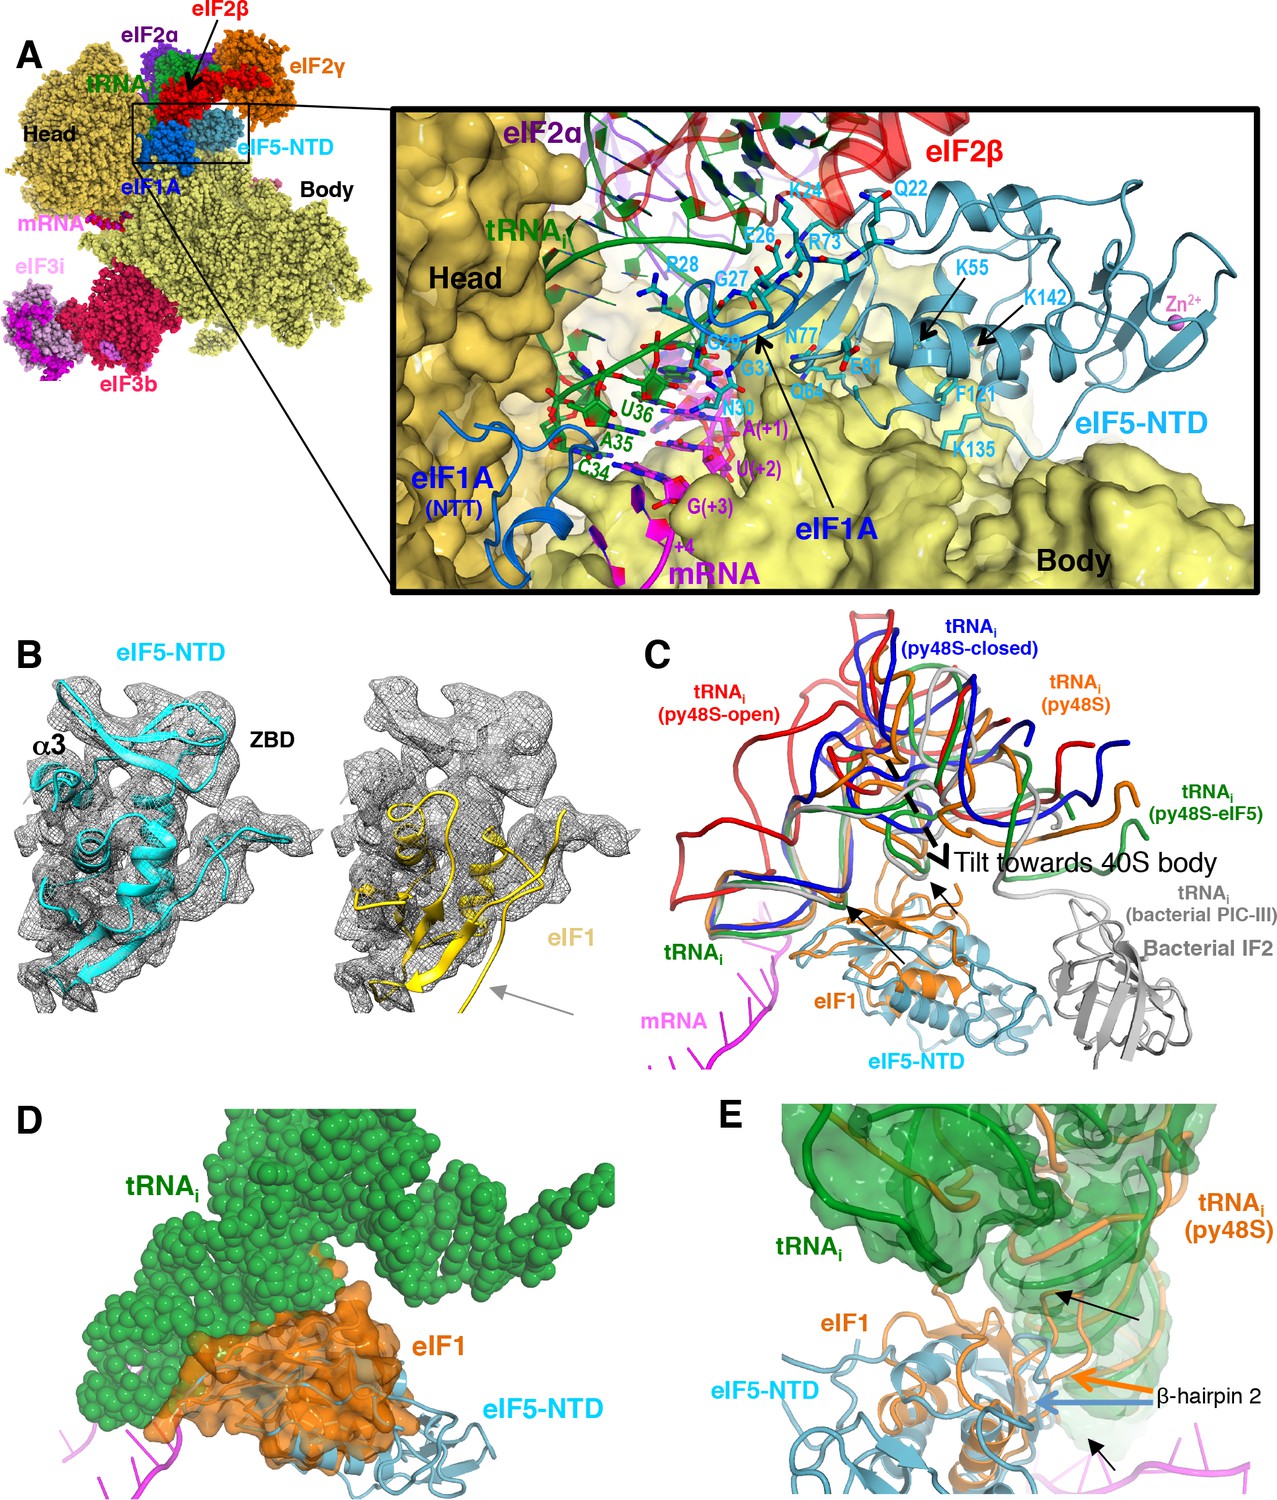
Contacts of eIF5-NTD with the other components in the 48S PIC.
(A) A detailed view of the contacts of eIF5-NTD near the P site with the 40S subunit, tRNAi, mRNA, eIF1A and eIF2β. eIF5 residues involved in the contacts are shown in sticks. (B) Fitting of eIF5-NTD (left) and eIF1(right) on density in Map 1(low-pass filtered to 5 Å). Zinc binding domain (ZBD) and helix α3 of eIF5, both absent in eIF1, are labeled. β5 of eIF1, which is not present in eIF5 is highlighted by a grey arrow. (C) The relative movement of the initiator tRNA in all reported yeast PICs, as deduced by a superposition using the 40S body. tRNAis from py48S-eIF5N (this study; green), py48S PIC (PDB 3J81; orange), py48S PIC-closed (PDB 3JAP; blue) and py48S PIC-open (PDB 3JAQ red) are shown. eIF5-NTD from py48S-eIF5N and eIF1 from py48S PIC (PDB 3J81) are also shown. For comparison, tRNAi and IF2 from a bacterial PIC with accommodated P site tRNA conformation is also shown (PICIII; PDB 5LMV; grey). In all closed conformations, the tip of the ASL is essentially in the same position; however, there is a different tilting of the tRNAi toward the 40S body in the different PICs. eIF1 would clash with tRNAi in py48S-eIF5N; black arrows highlight these clashes. (D) Representation of how eIF1 in py48S (transparent orange surface) would clash with tRNAi in py48S-eIF5N (in spheres). The model results from aligning the 40S bodies of the two structures. (E) eIF1 and eIF5-NTD share a similar fold; however, β-hairpin two in eIF5 is shorter than that in eIF1, which allows a further accommodation of tRNAi in the P site. eIF1 and tRNAi from py48S (PDB 3J81; orange) are superimposed on eIF5-NTD/tRNAi from py48S-eIF5N. See also Figure 2—figure supplements 1, 2 and 3.
Figure 2—figure supplement 1

eIF5 and eIF1 comparison.
(A) Cartoon representation of eIF5 (this study). Secondary structure elements are labeled. (B) Cartoon representation of eIF1 (from PDB:3J81) with labeled secondary structure elements. (C) Amino acid sequence and topology of secondary structure elements of eIF5. The β-strands and α-helices are depicted as superimposed arrows and rectangles, respectively. Residues belonging to the eIF5-NTD are in bold whereas those in light grey (comprising the eIF5-CTD) or in italics (comprising the linker connecting the NTD and CTD) are not visible in the present structure. In eIF5-NTD, the residues having decreased accessibility upon binding to 40S (in blue), tRNA (black circles), eIF2β (transparent circles), eIF2γ (violet triangles) and eIF1A (green triangles) in py48S-eIF5N are indicated. Asn30 interacting with mRNA, tRNA and the 40S simultaneously is shown in red. (D) Cartoon representation showing how Arg15 (essential for GAP activity) is 13 Å away from bound nucleotide in eIF2γ. (E) Contacts of eIF5-NTD with tRNAi or mRNA in py48S-eIF5N. Only secondary structure elements involved in the contacts are labeled. Two basic residues located in β-hairpin loop-2 of eIF5-NTD (K71, R73) interact with tRNAi. (F) Contacts of eIF1 with tRNAi or mRNA in the py48S complex (from PDB:3J81). Only secondary structure elements involved in the contacts are labeled, as in (E). The analogous secondary structure elements participate in the interactions in the two proteins; however, eIF1 β-hairpin loop-2 is negatively charged and exerts electrostatic repulsion between eIF1 and the tRNAi rather than the attraction afforded by basic residues in the eIF5-NTD loop-2 as seen in (E).
Figure 2—figure supplement 2

Density of β-hairpins 1 and 2 of eIF5-NTD and its contacts with tRNAi.
(A) Fitting of β-hairpin 1 of eIF5-NTD (cyan) and tRNAi (green) in Map 1. (B) As in A, but for β-hairpin 2 of eIF5-NTD.
Figure 2—figure supplement 3
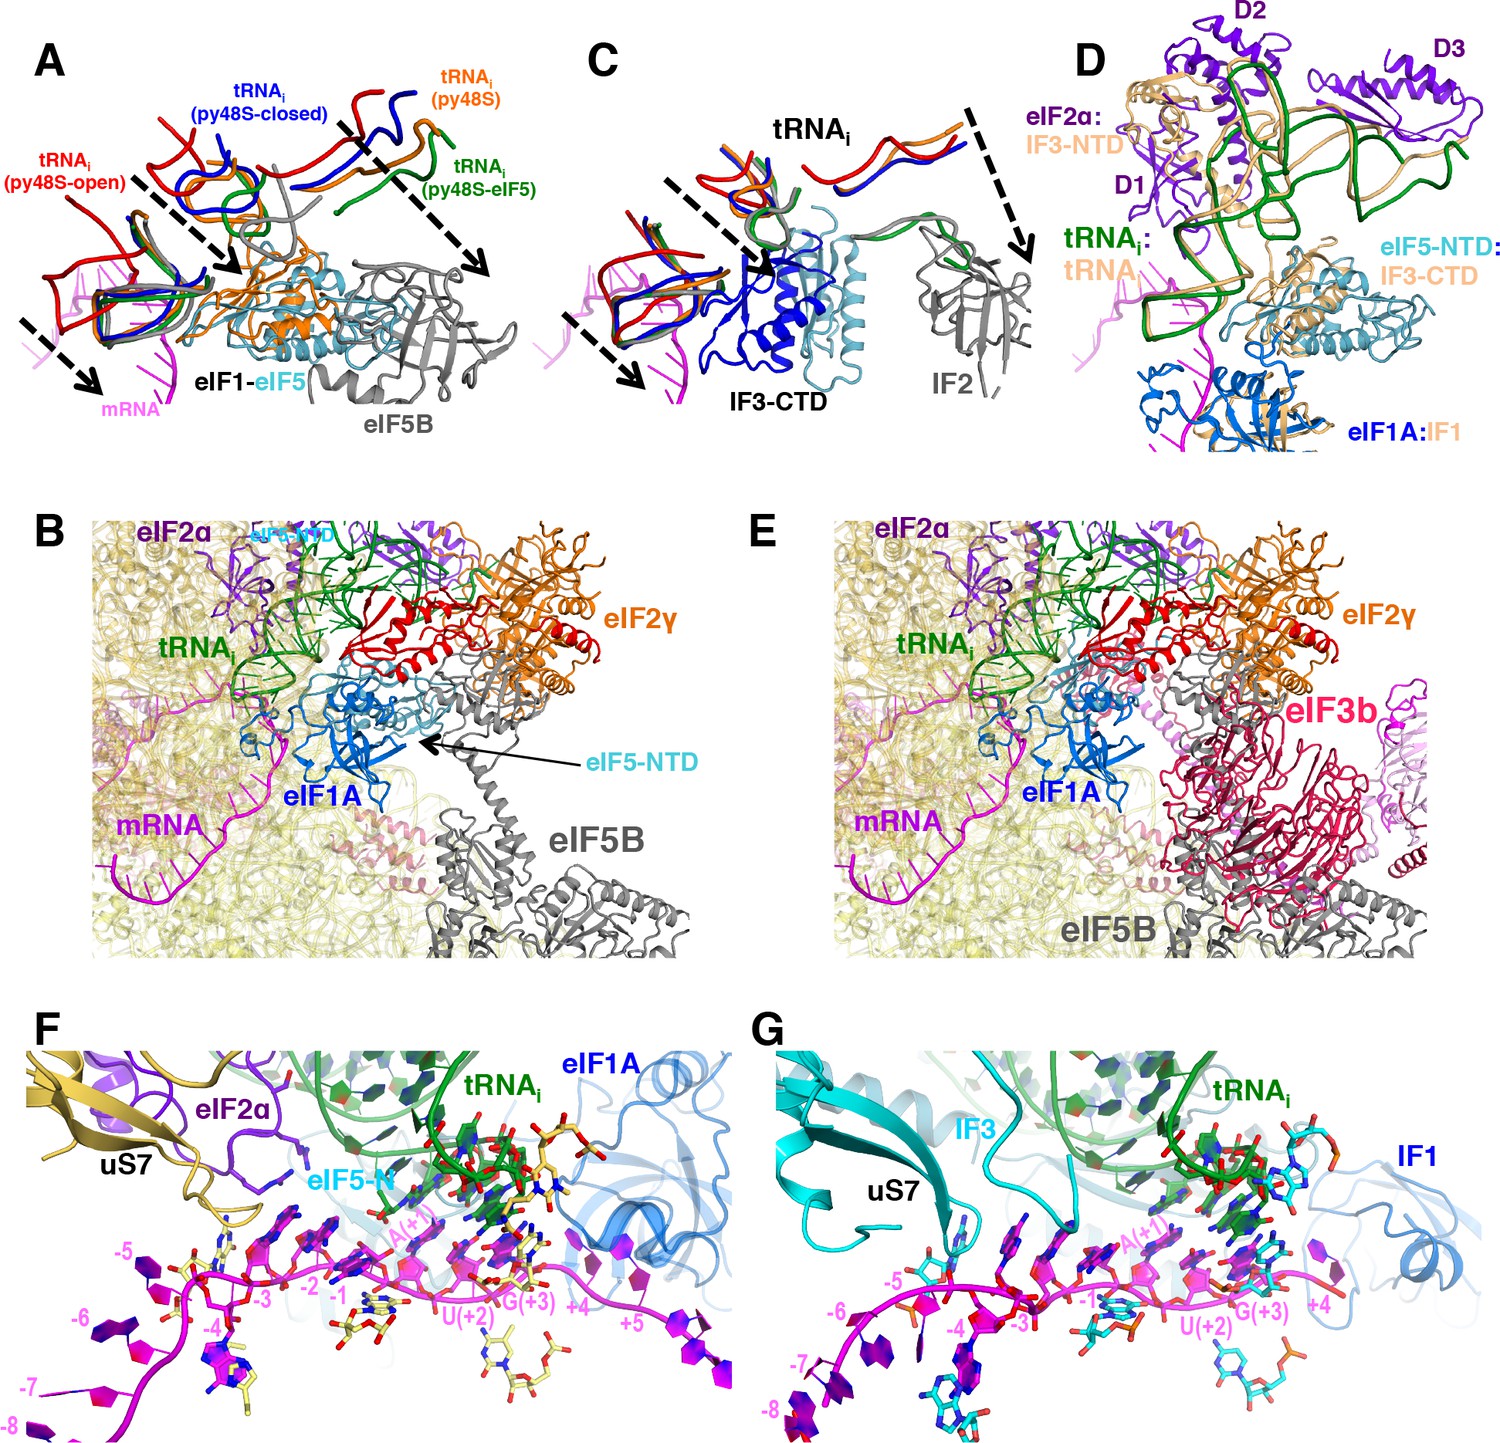
Comparison of eukaryotic and bacterial initiation following start-codon recognition.
(A) Accommodation of tRNAi in the P site in different yeast PICs. Similar representation to that in Figure 2C but including eIF5B and its associated tRNA (in gray) from the structure of an 80S initiation complex (PDB:4UJD) instead of bacterial IF2/tRNAi from bacterial PIC-III. For simplicity, only nucleotides 7–15 (D-loop) +26–43 (ASL) +69–76 (acceptor arm) from tRNA are shown. (C) Same orientation as in (A) of the superimposition of different bacterial PICs. When comparing panels A and C, we observe a similar tRNA accommodation process which depends on the displacement of eIF1/IF3 from near the P site. The present structure with eIF5-NTD in place of eIF1 could be considered the eukaryotic counterpart of bacterial PIC-4 (tRNA in green; IF3-CTD in cyan) or PIC-III (tRNA in gray; IF3-CTD in cyan) wherein IF3-CTD is completely displaced from the P site, since in both prokaryotic/eukaryotic PIC structures the tRNA accommodation process is very similar. (D) Similarity between locations and interactions of different eukaryotic and bacterial initiation factors and tRNAis in closed PIC structures. Bacterial PIC-3 (in yellow) and the py48S-eIF5N structures were superimposed by aligning the 40S/30S bodies. The tRNAis superpose quite well, and IF1:eIF1A, IF3-CTD:eIF5-NTD (or eIF1, not shown), IF3-NTD:eIF2α (domains D1 and D2) all occupy similar positions in two complexes. (Bi) Superimposition of eIF5B from the 80S initiation complex (PDB:4UJD) (in gray) with py48S-eIF5N shows a potential coexistence of eIF5B and eIF5-NTD in the same PIC, as eIF5B would clash with eIF2 but not with eIF5-NTD. (E) Superimposition of eIF5B from the 80S initiation complex (PDB:4UJD) with py48S-closed (PDB 6GSN) shows the incompatibility of eIF3 bound at the subunit interface with eIF5B, based on predicted extensive clashing of eIF3 subunits with eIF5B. (F) Similar representation to that in Figure 6C of the mRNA at the P site and flanking regions of py48S-eIF5N. (G) Same orientation as in (F) of the equivalent region of a bacterial PIC in closed conformation (PIC4; 5LMU), revealing an almost identical mRNA configuration and equivalent elements stabilizing the mRNA as observed in (F).
Figure 3 with 2 supplements
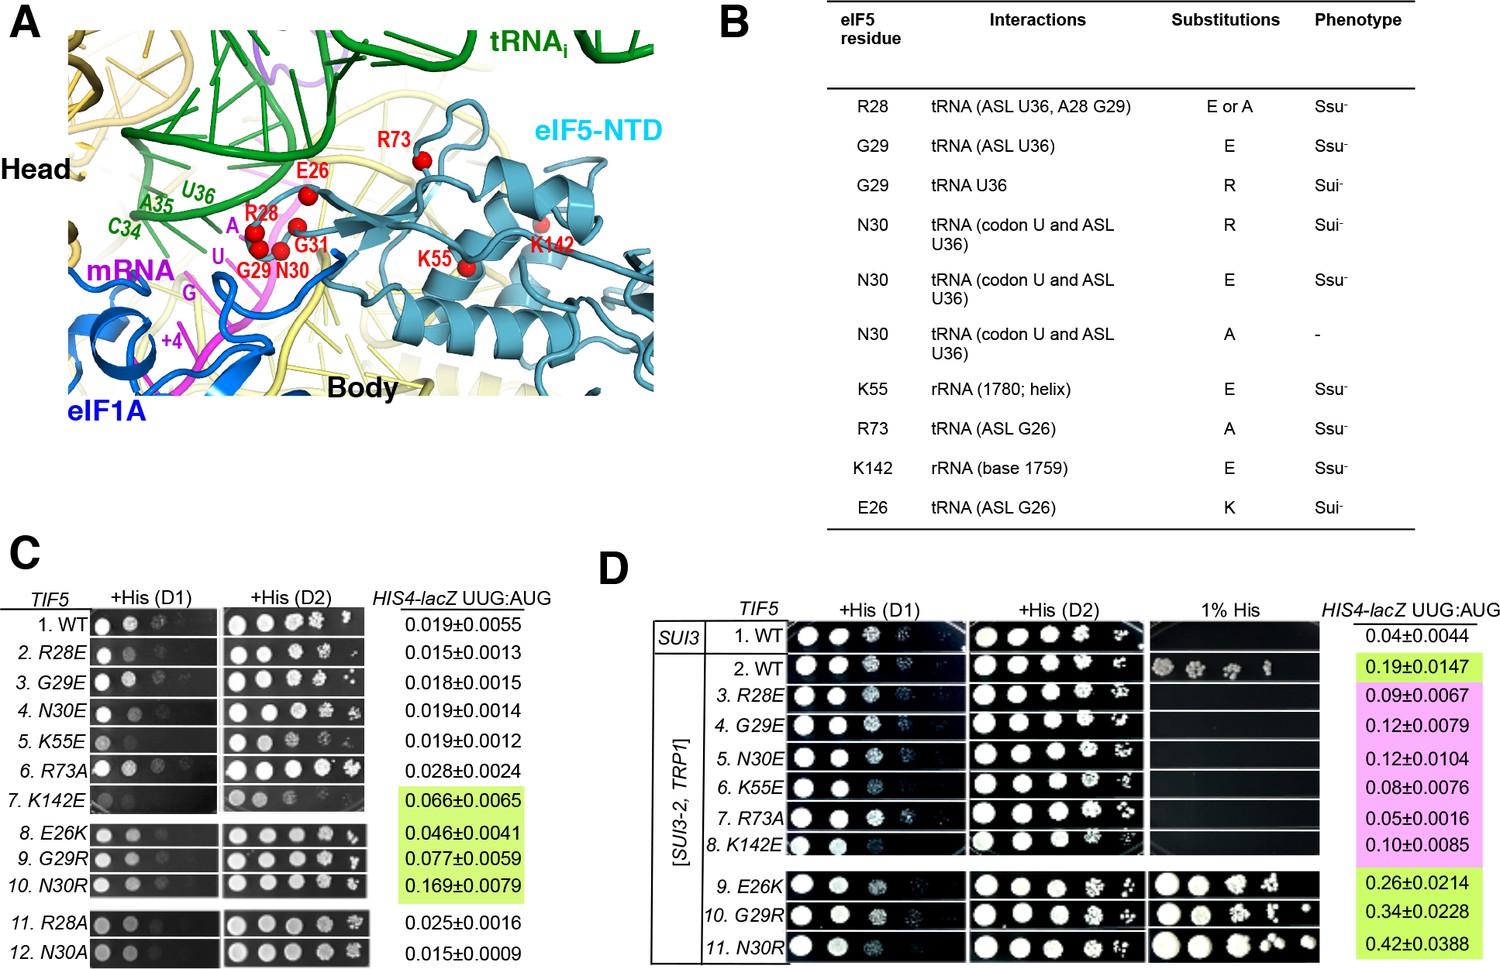
Genetic evidence that contacts of the eIF5-NTD with the tRNAi ASL and mRNA AUG codon in py48S-eIF5N are crucial for stringency of start-codon recognition in vivo.
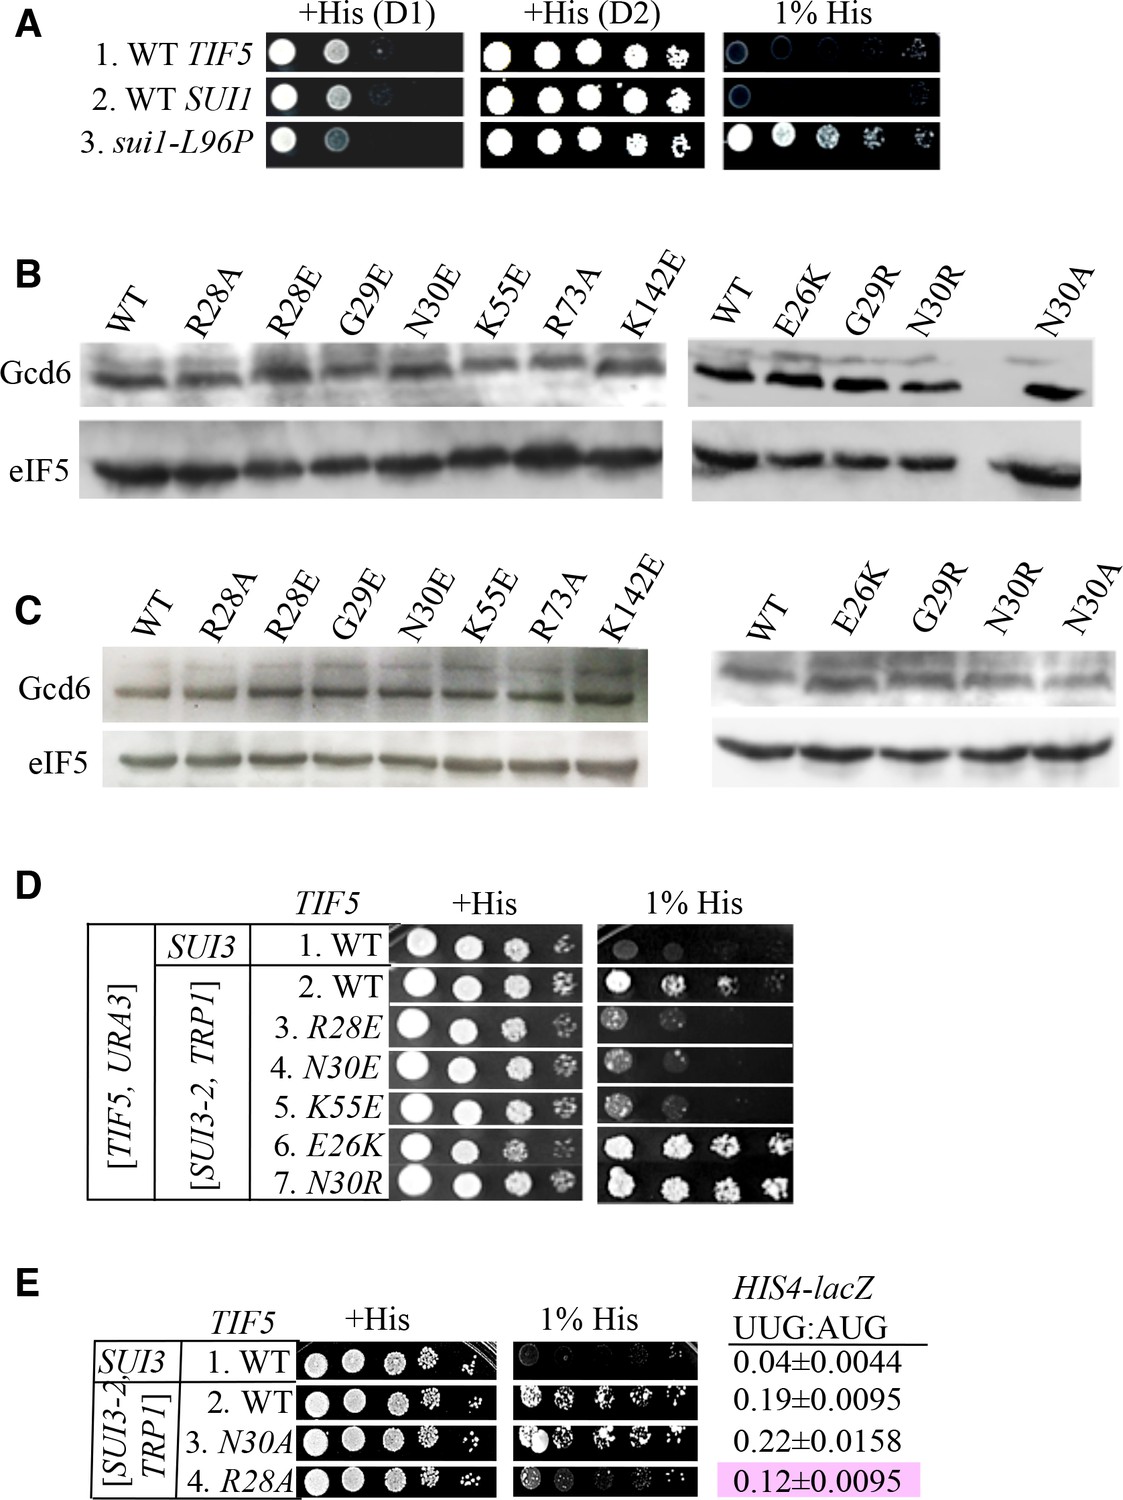
(A) Location of the eIF5 residues substituted in genetic studies, highlighted in red and shown as spheres. (B) Summary of eIF5-NTD residues substituted by TIF5 mutations (col. 1), their interactions in py48S-eIF5N (col. 2), the amino acid substitutions introduced (col. 3), and the observed Sui- or Ssu- phenotypes in vivo (col. 4) revealed by results in (C or D). (C) Slg- and His+/Sui- phenotypes were determined for derivatives of his4-301 tif5Δ strain ASY100 harboring the indicated TIF5-FL alleles on LEU2 plasmids. Ten-fold serial dilutions of the strains were spotted on synthetic complete medium lacking leucine (SC-L) and supplemented with 0.3 mM histidine (+His), and incubated for 1d (D1) or 2d (D2) at 30°C. To assess the effect of TIF5 substitutions on start-codon recognition, the strains were transformed with HIS4-lacZ reporter plasmids containing AUG (p367) or UUG (p391) start codons. Cells were cultured in SC medium lacking leucine and uracil at 30°C and β-galactosidase activities were measured in whole cell extracts (WCEs). Ratios of β-galactosidase expressed from the UUG to AUG reporter were calculated from four independent transformants and mean ratios and S.E.M.s (error bars) are reported on the right. Ratios indicating Sui- phenotypes are highlighted in lime green. (D) Strains described in (C) were transformed with SUI3-2 plasmid pRSSUI3-S264Y-W (rows 2–11) or empty vector (row 1). Slg- and His+/Sui- phenotypes were determined by spotting the 10-fold serial dilutions of strains on SC medium lacking leucine and tryptophan and supplemented with either 0.3 mM histidine (+His) or 0.0003 mM histidine (1% His), and incubated for 1d (D1) or 2d (D2) for +His medium and 6d for 1% His medium, at 30°C. The HIS4-lacZ initiation ratios, were determined as in (B) except the cells were grown in SC medium lacking leucine, uracil and tryptophan. Ratios indicating Sui- (lime green) or Ssu- (pink) phenotypes are highlighted. See also Figure 3—figure supplements 1 and 2.
Figure 3—figure supplement 1
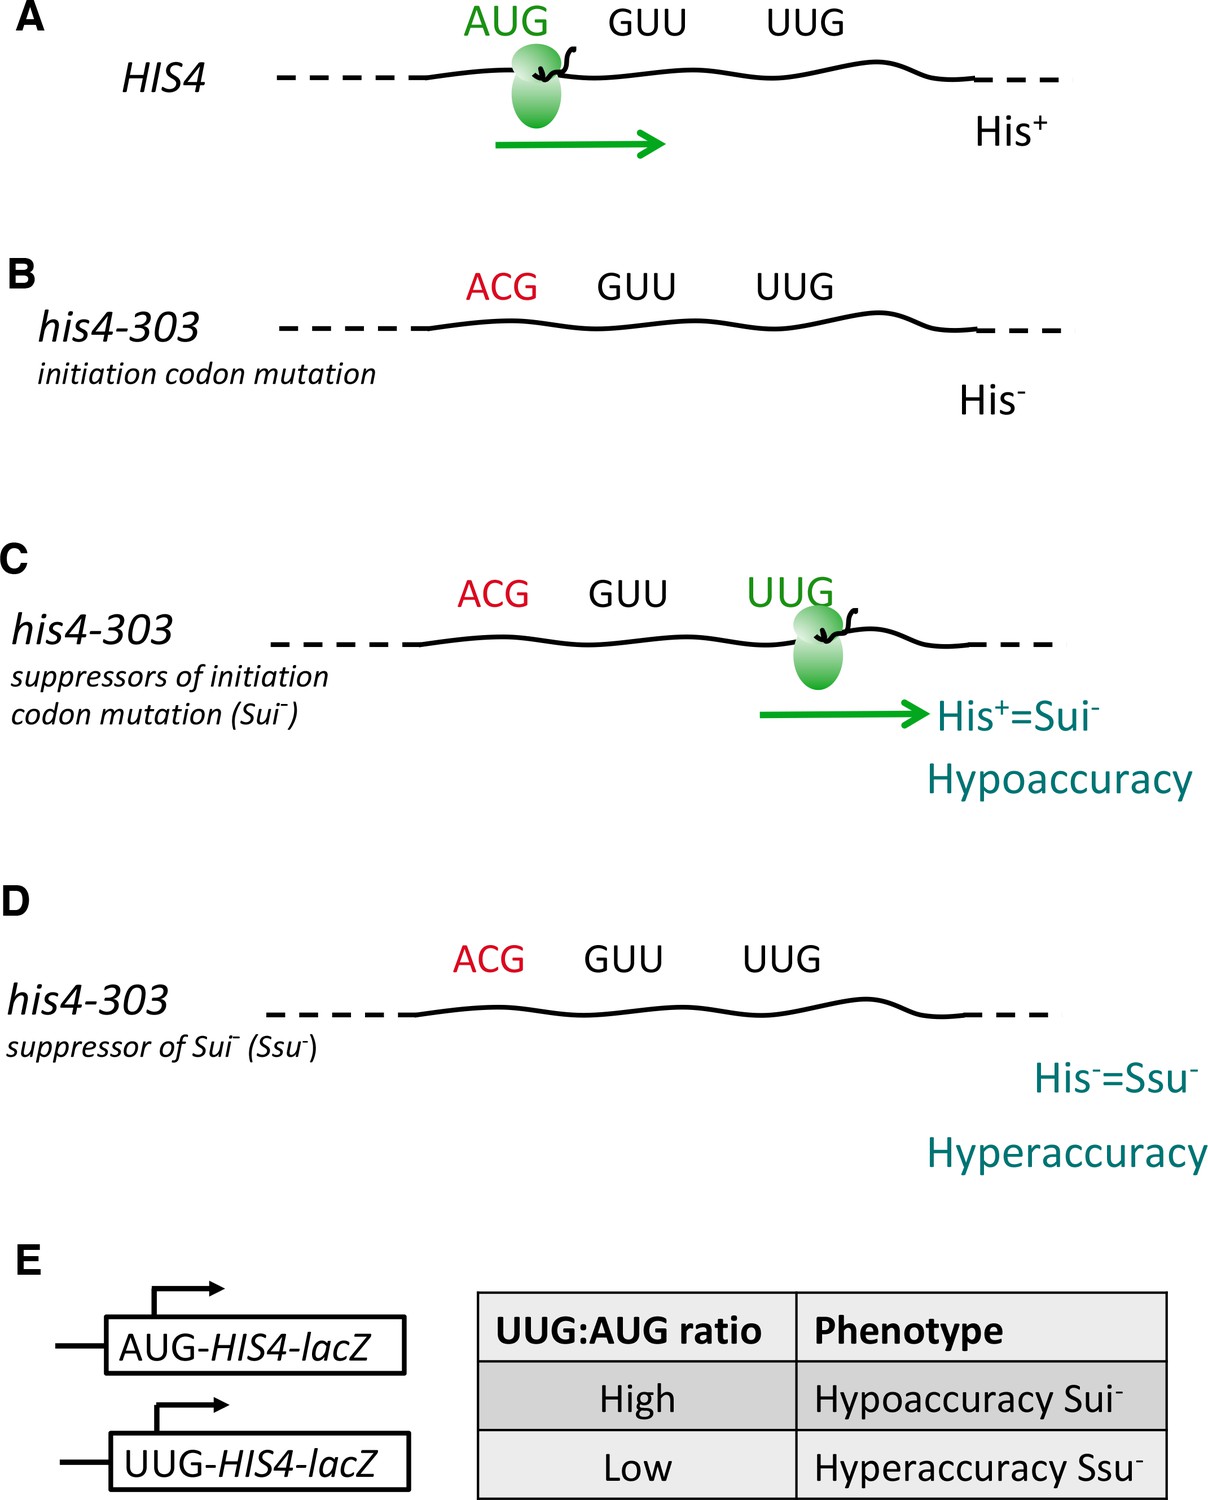
Genetic assays for mutations altering the accuracy of start-codon selection in vivo.
(A–D) Schema depicting wild-type HIS4 mRNA (A) and his4-303 mRNA containing an ACG replacement of the AUG start codon, which diminishes translation of the HIS4-encoded histidine biosynthetic enzyme and prevents cell growth on medium lacking a histidine supplement—the His- phenotype (B) Mutations in various genes encoding initiation factors confer a Sui- (Suppressor of initiation codon mutations) phenotype by suppressing the effects of the his4-303 mutation and enabling increased initiation at the third, in-frame UUG codon, thus restoring a level of his4-303 mRNA translation and attendant histidine biosynthesis sufficient for growth in the absence of a histidine supplement (His+ phenotype). Sui- mutations render start-codon selection hypoaccurate (C) Mutations conferring an Ssu- (Suppressor of Sui- mutations) phenotype suppress the effects of a Sui- mutation in the same or different gene by diminishing initiation at the third UUG codon of his4-303 mRNA, thereby reinstating a histidine requirement (His- phenotype). Ssu- mutations render start-codon selection hyperaccurate (D). (E) Matched HIS4-lacZ reporters containing AUG or UUG as initiation codon are used to quantify hypoaccuracy (Sui-) or hyperaccuracy (Ssu-) phenotypes by calculating the ratio of expression from the UUG vs. AUG reporters measured in the same strains.
Figure 3—figure supplement 2
Genetic assays and eIF5 variants expression.
(A) Strains ASY101, PMY30 and PMY33 with the indicated relevant genotypes (rows 1–3, respectively) were spotted on SC-L medium supplemented with 0.3 mM histidine (+His) or 0.0003 mM histidine (1% His), and incubated for 1d or 2d (+His) or 6d (1% His) at 30°C. (B–C) Ssu- and Sui- substitutions do not alter expression of FLAG-tagged eIF5 proteins. Derivatives of his4-301 tif5Δ strain ASY100 containing the indicated TIF5-FL alleles on sc LEU2 plasmids and harboring only chromosomal WT SUI3 (B) or also plasmid-borne SUI3-2 (C) were cultured in SC medium lacking leucine (B) or leucine and tryptophan (C). WCEs were prepared using trichloroacetic acid, resolved by SDS-PAGE and immunoblotted using antibodies against FLAG epitope or Gcd6. (D) Dominant Slg- and His+/Sui- phenotypes were determined for derivatives of his4-301 tif5Δ strain ASY100 harboring WT TIF5, URA3 plasmid p3342, the indicated TIF5-FL alleles on LEU2 plasmids, and either SUI3-2 plasmid pRSSUI3-S264Y-W (rows 2–7) or empty vector (row 1). Ten-fold serial dilutions were spotted on SC media lacking leucine, tryptophan and uracil supplemented either with 0.3 mM histidine (+His) or 0.0003 mM histidine (1% His) and incubated for 3d (+His) or 6d (1% His) at 30°C. (E) Strains harbouring the indicated TIF5-FL alleles and either SUI3-2 plasmid pRSSUI3-S264Y-W (rows 2–4) or empty vector (row 1) were analyzed as in (D) except that cells were spotted on SC media lacking leucine and tryptophan. HIS4-lacZ initiation ratios were determined in these strains as in Figure 3C. The Ssu- phenotype of -R28A is highlighted in pink.
Figure 4
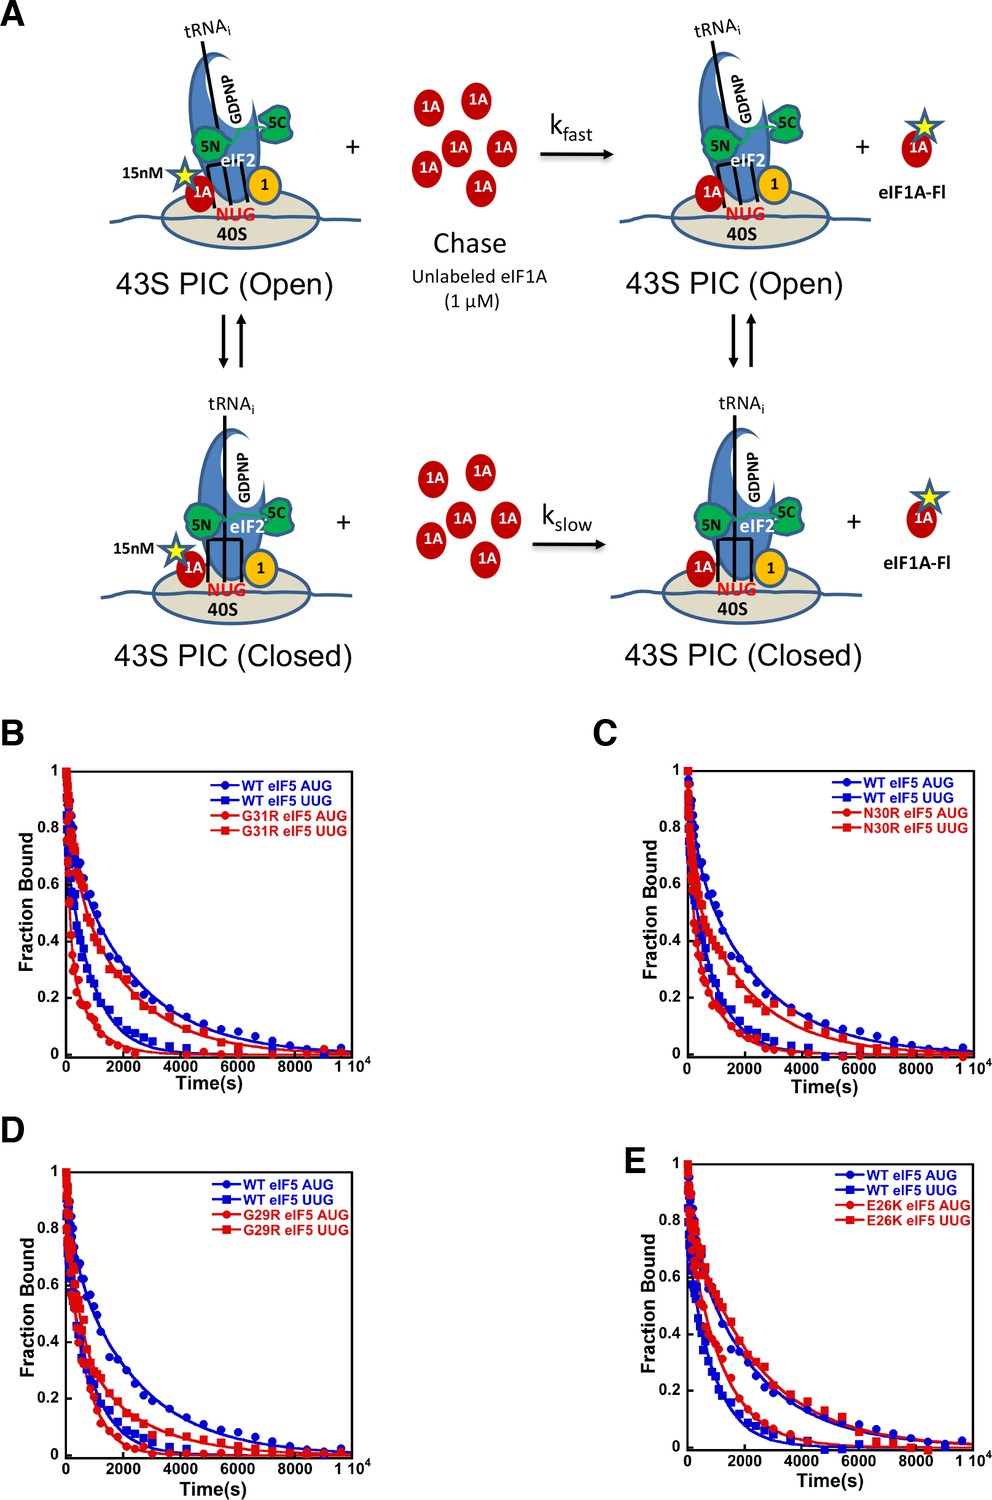
eIF5-NTD Sui- mutants stabilize the closed conformation of the PIC at UUG codons.
Dissociation of fluorescein-tagged eIF1A from 43S·mRNA complexes reconstituted with model mRNAs containing an AUG or UUG start codon and either WT or Sui- variants of eIF5 was monitored as decrease in fluorescence anisotropy over time after addition of excess unlabeled eIF1A. The data were fit with a double exponential decay equation. (A) Schematic of the eIF1A dissociation assay. PICs are assembled with fluorescein-labeled eIF1A (15 nM) and then dissociation of the labeled factor is initiatied with a chase of 66-fold excess unlabeled eIF1A (1 μM). The fast phase (kfast) of the dissociation of eIF1A-Fl reflects release from the open state of the PIC, where as the second, slower phase (kslow) reflects dissociation from the closed state of the PIC. (B) eIF1A dissociation from 48S PICs assembled with WT eIF5 (blue) or eIF5-G31R (red) and mRNAs with an AUG (closed circles) or UUG (closed squares) start codons. (C–E) eIF1A dissociation from PICs containing WT eIF5 (blue) or the indicated mutant eIF5 (red) and mRNAs with AUG (closed circles) or UUG (closed squares) start codons, for eIF5-N30R (C), eIF5-G29R (D), or eIF5-E26K (E). The curves shown are representative experiments. Mean kinetic parameters and average deviations from multiple, independent experiments are presented in Table 4.
-
Figure 4—source data 1
Kinetic parameters for dissociation of eIF1A from 48S PIC.
- https://doi.org/10.7554/eLife.39273.021
Figure 5
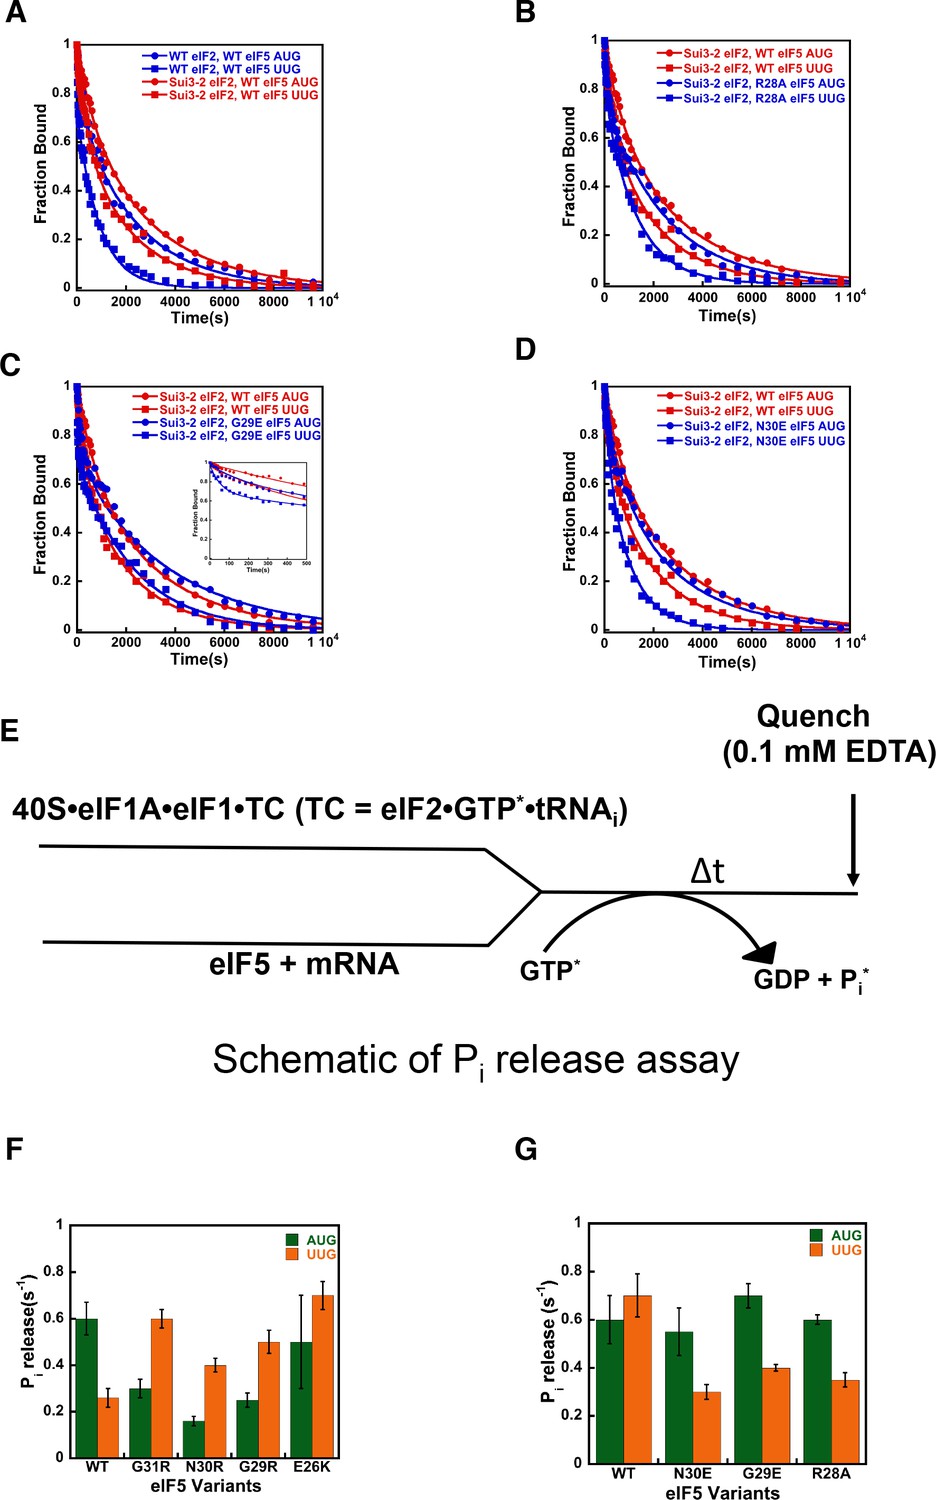
eIF5-NTD Ssu- mutants destabilize the closed conformation of the PIC and accelerate Pi release at UUG codons in the presence of the SUI3-2 Sui- variant of eIF2.
(A–D) eIF1A dissociation kinetics experiments conducted as in Figure 4 for PICs assembled with mRNAs containing AUG (closed circles) or UUG (closed squares) start codons and the following forms of eIF2 and eIF5: (A) WT eIF2/WT eIF5 (blue) or Sui3-2 eIF2/WT eIF5 (red); (B) Sui3-2 eIF2/WT eIF5 (red) or Sui3-2 eIF2/eIF5-R28A (blue); (C) Sui3-2 eIF2/WT eIF5 (red) or Sui3-2 eIF2/eIF5-G29E (blue); (D) Sui3-2 eIF2/WT eIF5 (red) or Sui3-2 eIF2/eIF5-N30E (blue). The curves shown are representative experiments. Mean kinetic parameters and average deviations from multiple, independent experiments are presented in Table 4. (E) Schematic of Pi release experiment (see Materials and methods). (F–G) Rates of Pi release from PICs assembled with mRNAs containing AUG (green) or UUG (orange) start codons and the indicated WT or mutant variants of eIF5. WT eIF2 was employed in (F), whereas Sui3-2 eIF2 was used in (G). Error bars depict average deviations.
-
Figure 5—source data 1
eIF1A dissociation kinetics assays.
- https://doi.org/10.7554/eLife.39273.024
Figure 6

P site conformation and surrounding elements in py48S-eIF5N.
(A) Cartoon representation of the TC in Maps C1 and C2, resulting from superposition of the 40S body in the two maps. The tRNAi, mRNA, and each component of TC is colored differently for C1, whereas all components of C2 are in gray. (B) Cartoon representation of the TC in Map C1 and py48S-closed (PDB 3JAP), resulting from superposition of the 40S body in the two maps. The tRNAi, mRNA, and each component of TC is colored differently for C1, whereas all components from py48S-closed are in gray. (C) Cross-section of the 40S subunit along the mRNA path and tRNAi bound in the P site of py48S-eIF5N, viewed from the top of the 40S subunit. eIF1A, eIF2 and eIF5-NTD are also shown. Black box inset: Detailed view of the codon-anticodon and surrounding elements that stabilize this interaction. Ribosomal, tRNAi and eIF2α residues involved in the interaction with mRNA at (minus) positions 5’ of the AUG codon (+1) are also shown. Blue box inset: Spheres representation of the same region in (C) highlighting the close packing of mRNA from positions −4 to +3 with its stabilizing residues of the ribosome, tRNAi and eIF2α in the mRNA channel. (D) eIF1A NTT interactions with the codon-anticodon duplex and the 40S subunit in py48S-eIF5N.
Figure 7
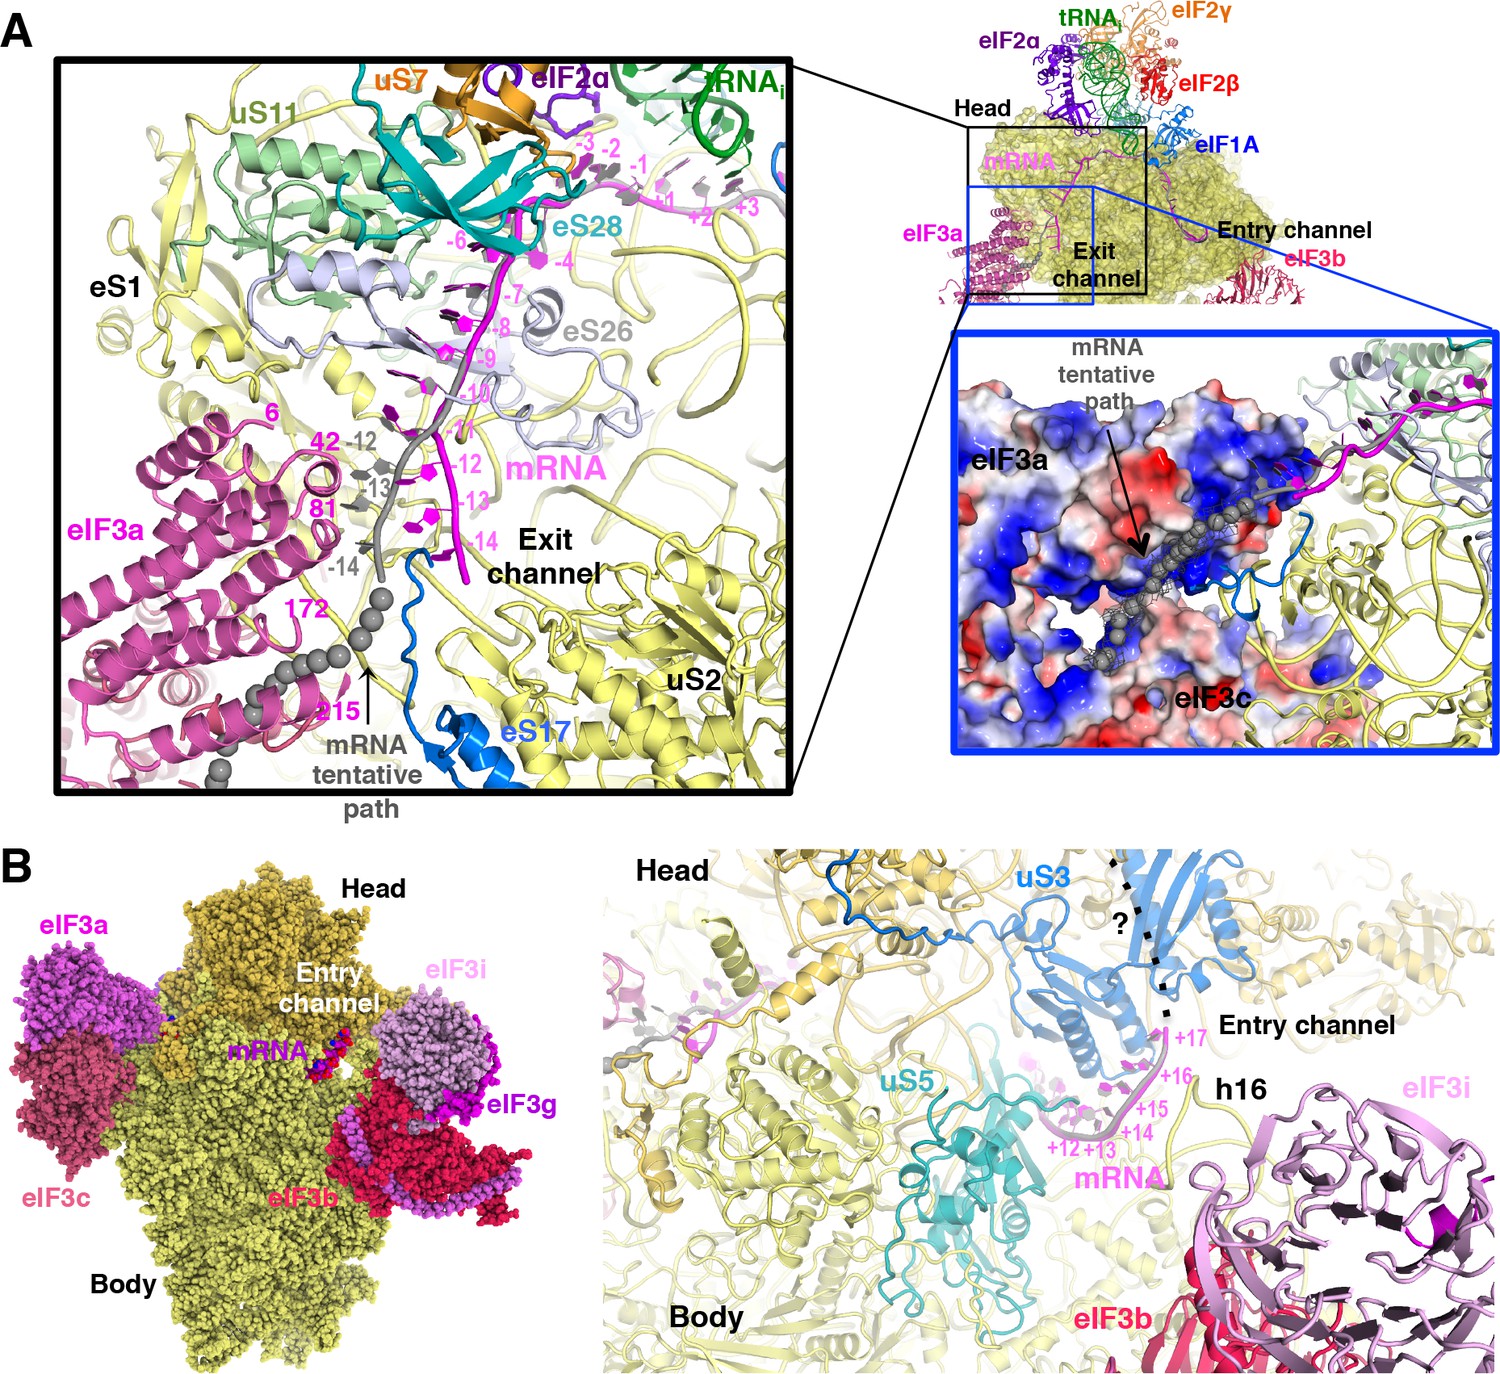
mRNA path at the exit and entry of the 40S mRNA channel in py48S-eIF5N.
(A) Cross-section of the 40S subunit along the mRNA path of py48S-eIF5N, viewed from the top of the 40S subunit, showing both the entry and exit openings of the 40S mRNA channel. Path of the mRNA when the eIF3a/c PCI domains are present in high occupancy (i.e. in model A) is shown in gray. Black box inset: mRNA at the exit tunnel (from nucleotides −1 to −13). mRNA interacting proteins uS7, uS11, eS17, eS26 and eS28 are colored orange, light green, blue, blue-white and teal, respectively. The eIF3a PC1 domain is shown in pink, and a few residues in proximity to the mRNA path are labeled. Grey spheres highlight a tentative path for the mRNA based on an unassigned density in Map A (see tubular-shaped density shown as a grey mesh in the blue box inset). Blue box inset: Surface electrostatic potential of eIF3a/c PCI domains (blue: basic; red: acidic) supports their proposed interaction with mRNA upstream of position −11 depicted as the tubular-shaped density shown in grey mesh. (B) mRNA at the entry tunnel opening (from nucleotides + 11 to+17), colored as in A. mRNA-interacting 40S proteins uS3 and uS5 are colored blue and cyan, respectively. rRNA helix h16 also interacts with mRNA and is labeled. A possible trajectory for the 3’ end of the mRNA is proposed and shown as a discontinuous black line.
Figure 8
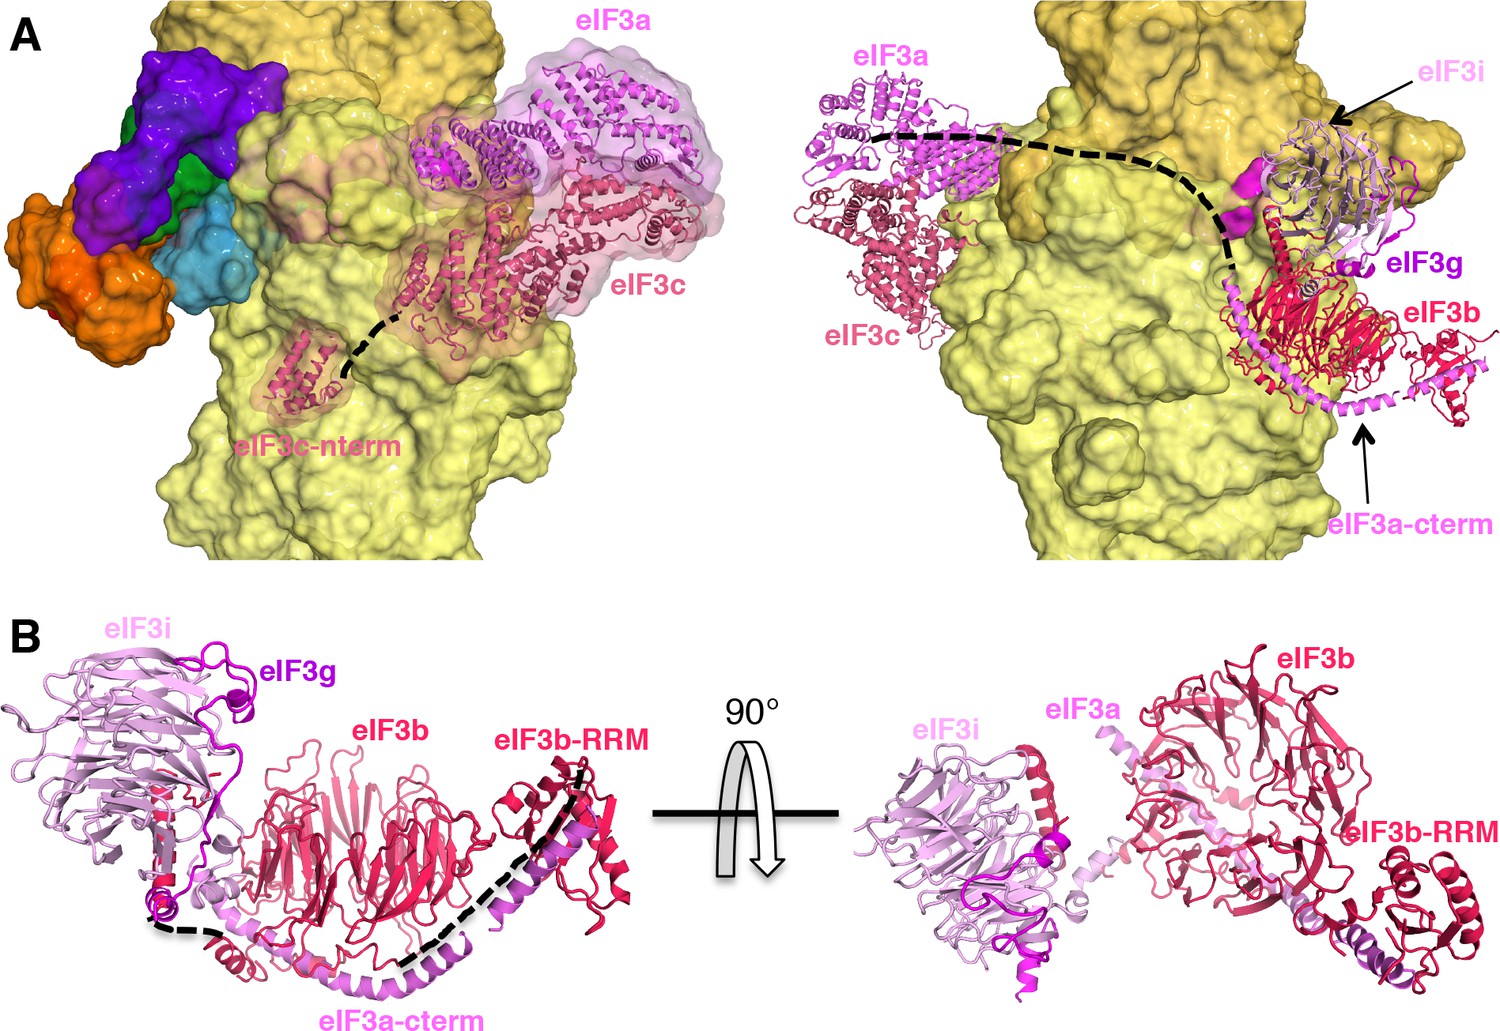
eIF3 architecture within py48S-eIF5N.
(A) Two different views of the py48S-eIF5N PIC showing the locations of the different eIF3 subunits. All eIF3 domains, except for the eIF3c N-terminal helical bundle, reside on the solvent-exposed side of the 40S subunit. Shown as dashed black lines are the proposed linker connecting the eIF3c helical bundle and PCI domain; and the proposed path for the central part of eIF3a connecting the eIF3a/PCI domain and eIF3a C-term helix, of which the latter interacts with the eIF3b β-propeller. (B) Quaternary complex eIF3b/eIF3i/eIF3g/eIF3a-Cterm, shown in two different orientations. Unresolved connections between the eIF3b β-propeller and the eIF3b C-terminal helix and eIF3b RRM domain are shown as dashed black lines.
Figure 9
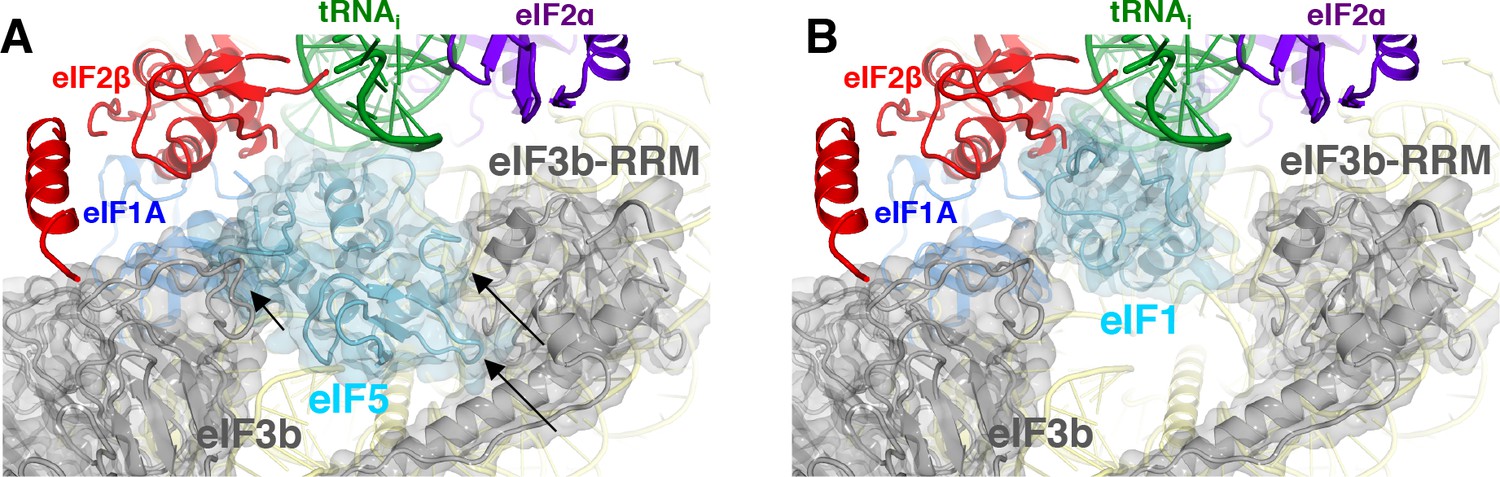
eIF3 relocates back to the solvent-exposed surface of 40S.
(A) Modeling of the eIF3b/eIF3i/eIF3g/eIF3a-Cterm quaternary complex observed in py48S-closed-eIF3 (PDB 6GSN) at the subunit interface of py48S-eIF5N. The location of eIF5-NTD in the latter complex seems to be incompatible with this position of eIF3b/eIF3i/eIF3g/eIF3a-Cterm at the subunit interface, clashing with it at multiple points (highlighted with black arrows). (B) The eIF3b/eIF3i/eIF3g/eIF3a-Cterm quaternary complex in the py48S-closed-eIF3 complex (PDB 6GSN) shows no clashes with eIF1 bound at the P site.
Figure 10
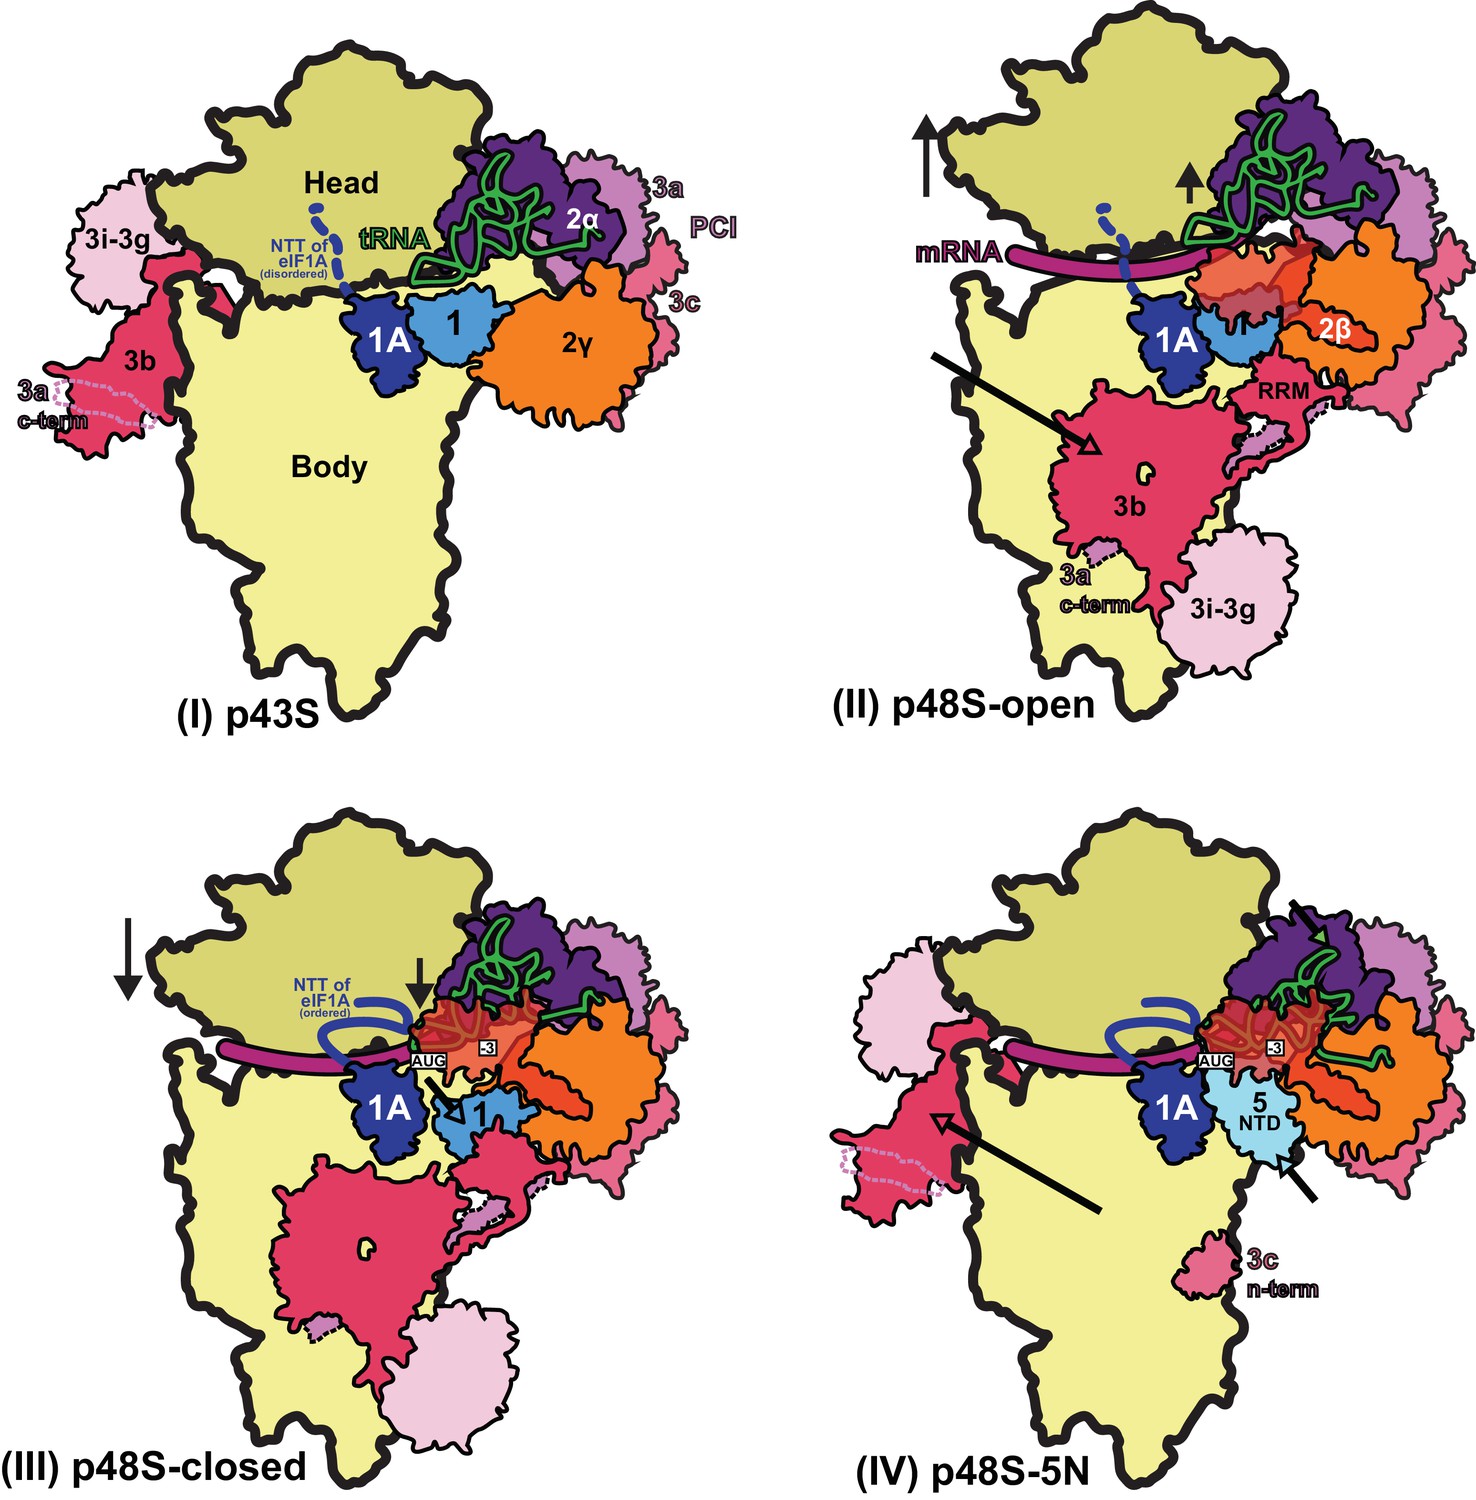
Schematic model of major conformational changes during initiation.
(I) Binding of eIF1, eIF1A and eIF3 to the 40S subunit facilitates TC binding in the POUT conformation to form the 43S PIC. The disordered NTT of eIF1A is shown as a dashed line. eIF2β and 3 c N-term were not resolved in this complex. (II) Upon mRNA recruitment facilitated by the upward movement of the 40S head (and also Met-tRNAi; shown by black arrows), which expands the mRNA entry channel, eIF3 undergoes major conformational changes and the eIF3b/eIF3i/eIF3g/eIF3a-Cterm module is repositioned from its initial position on the solvent exposed face of the 40S to the subunit-interface (shown by a pink arrow), contacting eIF2γ and eIF1. These contacts, together with eIF2β contacts with eIF1 and Met-tRNAi, probably stabilize this open scanning-competent conformation of the PIC (py48S-open). eIF2β is semitransparent overlapping eIF1.) (III) After recognition of the start codon, the 40S head moves downward (shown by a black arrow) to clamp in the mRNA and the ASL of the Met-tRNAi goes deeper into the P site (PIN state). eIF2β loses contact with eIF1 and Met-tRNAi and moves away to interact with the 40S head, the NTT of eIF1A stabilizes the codon:anticodon duplex, and eIF2α-D1 interacts with the −3 position of mRNA in the E site. eIF1 is also slightly displaced by Met-tRNAi from its original position on the 40S platform (shown by a cyan arrow). (IV) Base pairing of Met-tRNAi with the AUG start codon in the PIN state and Met-tRNAi tilting toward the 40S body (shown by a green arrow) weakens eIF1 binding to the 40S subunit causing eIF1 dissociation and, consequently, the eIF3b/eIF3i/eIF3g/eIF3a-Cter module relocates back to the solvent side of the 40S (shown by a pink arrow) and the eIF5-NTD binds at the site vacated by eIF1 (shown by a light cyan arrow) and stabilizes this Met-tRNAi conformation through extensive interactions of eIF5-NTD loop-1/loop-2 residues with the AUG:anticodon duplex. In subsequent steps (not shown), eIF5B binds and captures the accommodated Met-tRNAi in the P site and stimulates the joining of the 60S subunit to produce the 80S initiation complex, leading to the final stage of initiation.
Videos
Video 1
Movie highlighting tRNA accommodation, leading to eIF1 dissociation and eIF5-NTD recruitment to the 48S complex.
Detailed contacts of eIF5-NTD with other elements of the 48S complex are also shown.
Tables
Table 1
Refinement and model statistics.
https://doi.org/10.7554/eLife.39273.013| Model with TC in conformation 1 | Model with TC in conformation 2 | |
|---|---|---|
| Model Composition | ||
| Non-hydrogen atoms | 104,332 | 104,232 |
| Protein residues | 8538 | 8522 |
| RNA bases | 1882 | 1882 |
| Refinement | ||
| Resolution used for refinement (Å) | 3.05 | 3.05 |
| Map sharpening B-factor (Å) | −67 | −66 |
| Average B-factor (Å) | 162 | 121 |
| Fourier Shell Correlation (FSC)* | 0.90 | 0.89 |
| Rms deviations | ||
| Bonds (Å) | 0.006 | 0.006 |
| Angles (°) | 1.139 | 1.194 |
| Validation (proteins) | ||
| Molprobity score (Percentile in brackets) | 2.65 (91st) | 2.74 (89th) |
| Clashscore, all atoms (Percentile in brackets) | 6.87 (100th) | 7.11 (98th) |
| Good rotamers (%) | 91.1 | 89.2 |
| Ramachandran plot | ||
| Favored (%) | 89.8 | 89.2 |
| Outliers (%) | 2.5 | 2.7 |
| Validation (RNA) | ||
| Correct sugar puckers(%) | 98.6 | 96.9 |
| Good backbone conformations(%) | 63.6 | 63.1 |
-
*FSC= Σ(Nshell FSCshell)/ Σ(Nshell), where FSCshell is the FSC in a given shell, Nshell is the number of ‘structure factors’ in the shell. FSCshell = Σ(Fmodel FEM)/ (√(Σ(|F|2model)) √(Σ(|F|2EM)))
Table 2
Local resolution of ligands.
https://doi.org/10.7554/eLife.39273.014| Structures | Map 1 (Å) | Map A (Å) | Map B (Å) | Map C1 (Å) | Map C2 (Å) |
|---|---|---|---|---|---|
| Overall Resolution | 3.00 | 3.50 | 3.50 | 3.50 | 3.10 |
| eIF5-NTD | 3.15 | nd | nd | 3.80 | 3.35 |
| eIF1A | 3.00 | nd | nd | 3.70 | 3.10 |
| eIF2α | 3.65 | nd | nd | 4.15 | 3.65 |
| eIF2β | nd* | nd | nd | 9.40 | >15 |
| eIF2γ | 8.15 | nd | nd | 8.00 | 8.10 |
| tRNAi | 3.20 | nd | nd | 3.65 | 3.20 |
| ASL + mRNA(−4 to + 4) | 2.95 | nd | nd | 3.45 | 3.15 |
| eIF3 PCI domains | nd | 7.80 | nd | nd | nd |
| eIF3b/eIF3a-cterm | nd | nd | 7.25 | nd | nd |
| eIF3b-cterm/eIF3i/eIF3g | nd | nd | 12.20 | nd | nd |
-
*nd – not determined
Table 3
Contribution of non-crosslinked (157,868 particles) and crosslinked (113,838 particles) datasets to each map.
https://doi.org/10.7554/eLife.39273.015| Structures Number of particles (% of the total) and resolution in Å | Map 1 | Map A | Map B | Map C1 | Map C2 |
|---|---|---|---|---|---|
| Non-crosslinked | 157,868 (58%) ; 3.00 | 23,219 (8.5%) ; 3.70 | 25,761 (9.5%) ; 3.60 | 27,012 (10%) ; 3.60 | 99,229 (36.5%) ; 3.10 |
| Crosslinked | - | 30,651 (11.5%) ; 4.30 | 28,938 (10.5%) ; 4.35 | 47,760 (17.5%) ; 4.30 | 37,874 (13.5%) ; 4.05 |
| Merged | 157,868 (58%) ; 3.00 | 53,870 (20%) ; 3.50 | 54,699 (20%) ; 3.50 | 74,772 (27.5%) ; 3.50 | 137,103 (50%) ; 3.10 |
Table 4
Kinetic parameters for dissociation of eIF1A from 48S PIC
https://doi.org/10.7554/eLife.39273.022| (A) Kinetic parameters for dissociation of eIF1A from 48S PIC in presence of eIF5 Sui- mutants | |||||||
|---|---|---|---|---|---|---|---|
| eIF5 variants | mRNA | k1 (open) (x10−3 s−1) | k2 (closed) (x10−3 s−1) | a1 (open) | a2 (closed) | Kamp* (a2/a1) | Rbound† |
| WT | AUG | 6 ± 1 | 0.4 ± 0.05 | 0.15 ± 0.02 | 0.85 ± 0.02 | 5.9 | 0.2105 ± 0.002 |
| UUG | 22 ± 4 | 2.1 ± 0.3 | 0.24 ± 0.02 | 0.76 ± 0.02 | 3.2 | 0.1820 ± 0.002 | |
| G31R | AUG | 18 ± 3 | 3.0 ± 0.4 | 0.33 ± 0.03 | 0.67 ± 0.03 | 2.1 | 0.1915 ± 0.001 |
| UUG | 7.0 ± 1.5 | 0.5 ± 0.02 | 0.13 ± 0.01 | 0.87 ± 0.02 | 6.9 | 0.2025 ± 0.001 | |
| N30R | AUG | 10.0 ± 1.0 | 1.5 ± 0.3 | 0.50 ± 0.1 | 0.50 ± 0.1 | 1.0 | 0.2030 ± 0.002 |
| UUG | 6.0 ± 1.0 | 0.5 ± 0.1 | 0.30 ± 0.05 | 0.70 ± 0.05 | 2.3 | 0.2100 ± 0.002 | |
| G29R | AUG | 20 ± 3.0 | 1.5 ± 0.4 | 0.40 ± 0.02 | 0.60 ± 0.02 | 1.5 | 0.1885 ± 0.001 |
| UUG | 6.0 ± 1.6 | 0.6 ± 0.1 | 0.20 ± 0.03 | 0.80 ± 0.03 | 4.0 | 0.1925 ± 0.002 | |
| E26K | AUG | 17 ± 2.6 | 0.9 ± 0.05 | 0.23 ± 0.02 | 0.77 ± 0.02 | 3.5 | 0.1835 ± 0.001 |
| UUG | 8.0 ± 1.5 | 0.4 ± 0.05 | 0.16 ± 0.01 | 0.84 ± 0.01 | 5.2 | 0.1900 ± 0.002 | |
| (B) Kinetic parameters for dissociation of eIF1A from 48S PIC in presence of eIF5 Ssu- and Sui3-2 eIF2 | |||||||
|---|---|---|---|---|---|---|---|
| eIF5 variants; Sui 3–2 eIF2 | mRNA | k1(open) (x10−3 s−1) | k2(closed) (x10−3 s−1) | a1(open) | a2(closed) | Kamp* (a2/a1) | Rbound† |
| Sui3-2 | AUG | 4 ± 1 | 0.3 ± 0.04 | 0.22 ± 0.03 | 0.78 ± 0.03 | 3.4 | 0.1945 ± 0.002 |
| UUG | 5 ± 1.8 | 0.5 ± 0.04 | 0.20 ± 0.02 | 0.80 ± 0.02 | 4.0 | 0.1910 ± 0.001 | |
| N30E | AUG | 6 ± 0.5 | 0.4 ± 0.04 | 0.15 ± 0.02 | 0.85 ± 0.01 | 5.6 | 0.2045 ± 0.0005 |
| UUG | 15 ± 4 | 1.0 ± 0.16 | 0.23 ± 0.01 | 0.77 ± 0.01 | 3.3 | 0.1830 ± 0.003 | |
| G29E | AUG | 8.0 ± 1.0 | 0.4 ± 0.02 | 0.22 ± 0.02 | 0.78 ± 0.02 | 3.5 | 0.2084 ± 0.0006 |
| UUG | 18 ± 3.0 | 0.36 ± 0.03 | 0.28 ± 0.02 | 0.72 ± 0.02 | 2.6 | 0.1830 ± 0.003 | |
| R28E | AUG | 13 ± 4.0 | 0.5 ± 0.04 | 0.21 ± 0.01 | 0.80 ± 0.01 | 4.0 | 0.2040 ± 0.001 |
| UUG | 23 ± 2.0 | 0.9 ± 0.06 | 0.25 ± 0.03 | 0.75 ± 0.03 | 3.0 | 0.1910 ± 0.003 | |
| R28A | AUG | 8.0 ± 0.8 | 0.3 ± 0.04 | 0.20 ± 0.02 | 0.80 ± 0.02 | 4.0 | 0.2105 ± 0.001 |
| UUG | 14 ± 4.0 | 0.7 ± 0.08 | 0.24 ± 0.01 | 0.76 ± 0.01 | 3.2 | 0.1810 ± 0.003 | |
-
*Higher values of Kamp indicate that a greater proportion of the complexes are in the closed state (Saini et al., 2014).
†Higher values of Rbound indicate that more complexes are in the constrained, closed state ( Saini et al., 2014).
Table 5
Kinetic parameters for Pi release from 48S PIC.
https://doi.org/10.7554/eLife.39273.025| (A) Kinetic parameters for Pi release from 48S PIC with eIF5 Sui- mutants. | ||
|---|---|---|
| eIF5 Variants | Rate of Pi release (s−1) AUG UUG | |
| WT | 0.60 ± 0.08 | 0.26 ± 0.04 |
| G31R | 0.30 ± 0.04 | 0.60 ± 0.04 |
| N30R | 0.16 ± 0.02 | 0.41 ± 0.03 |
| G29R | 0.25 ± 0.03 | 0.55 ± 0.05 |
| E26K | 0.50 ± 0.20 | 0.72 ± 0.06 |
| (B) Kinetic parameters for Pi release from 48S PIC with eIF5 Ssu- mutants in presence of Sui3-2 eIF2 | ||
|---|---|---|
| eIF5 Variants; Sui3-2 eIF2 | Rate of Pi release (s−1) AUG UUG | |
| WT | 0.60 ± 0.10 | 0.75 ± 0.09 |
| N30E | 0.55 ± 0.15 | 0.30 ± 0.03 |
| G29E | 0.72 ± 0.04 | 0.40 ± 0.01 |
| R28A | 0.60 ± 0.02 | 0.35 ± 0.04 |
Additional files
-
Supplementary file 1
Plasmids used in this study
- https://doi.org/10.7554/eLife.39273.031
-
Supplementary file 2
Yeast strains used in this study
- https://doi.org/10.7554/eLife.39273.032
-
Transparent reporting form
- https://doi.org/10.7554/eLife.39273.033
Download links
A two-part list of links to download the article, or parts of the article, in various formats.
Downloads (link to download the article as PDF)
Open citations (links to open the citations from this article in various online reference manager services)
Cite this article (links to download the citations from this article in formats compatible with various reference manager tools)
Translational initiation factor eIF5 replaces eIF1 on the 40S ribosomal subunit to promote start-codon recognition
eLife 7:e39273.
https://doi.org/10.7554/eLife.39273


