Zygotic gene activation in the chicken occurs in two waves, the first involving only maternally derived genes
- Seoul National University, Republic of Korea
- C&K Genomics, Republic of Korea
- Brigham and Women’s Hospital and Harvard Medical School, United States
Figures
Figure 1 with 3 supplements
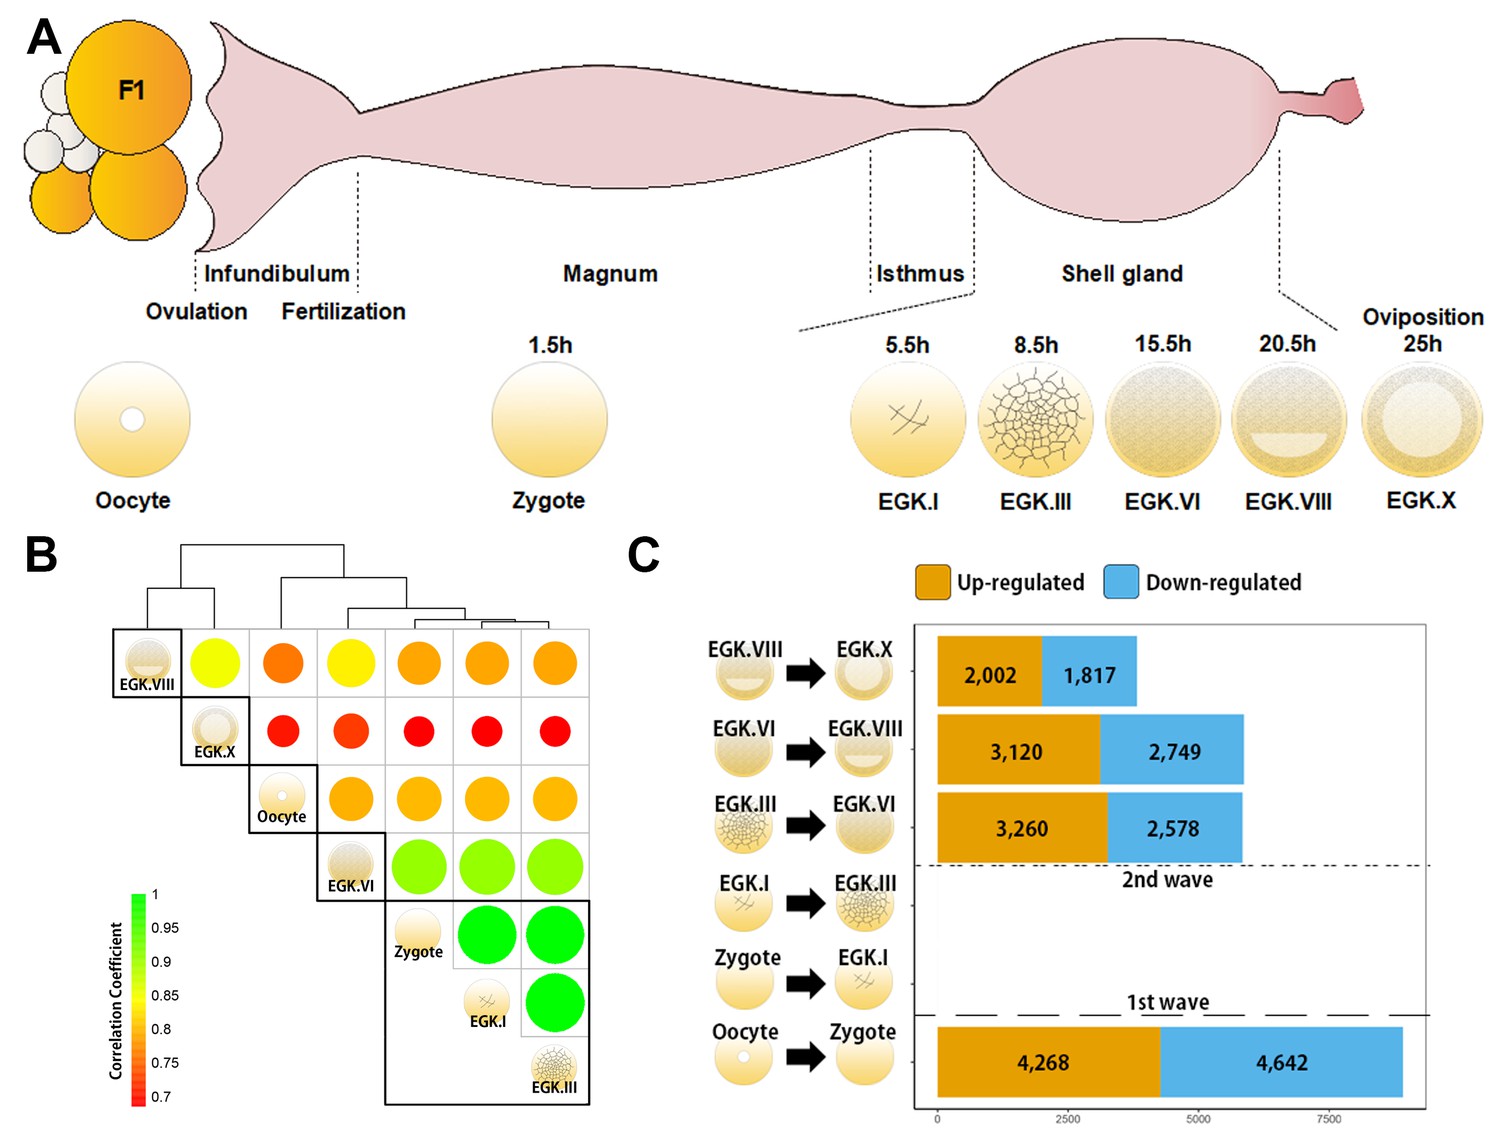
Genome-wide transcriptional activation during chicken early development.
(A) Representative images of early embryos from oocyte to Eyal-Giladi and Kochav X (EGK.X) used for RNA-Seq and acquisition in the chicken oviduct. All embryos were classified following the morphological criteria of EGK. h, hours after fertilisation for each stage of embryos. (B) Hierarchical clustering of the whole transcriptome during early development in chicken. The size and colour of each circle represents the strength of the correlation coefficients based on whole-transcriptome expression. The black rectangle represents optimal clusters (k = 5) based on the Silhouette score. The transcriptomic changes between consecutive stages, including oocyte vs. zygote and EGK.III vs. EGK.VI, are shown. Zygote, EGK.I and EGK.III had similar transcriptome profiles. (C) Number of differentially expressed intronic regions in consecutive stages. The orange and blue colors represent up- and downregulated genes at 5% significance level after false discovery rate (FDR) multiple testing adjustment. The 1st wave of transcriptional activation between oocyte and zygote and the 2nd wave between EGK.III and EGK.VI are shown.
Figure 1—figure supplement 1
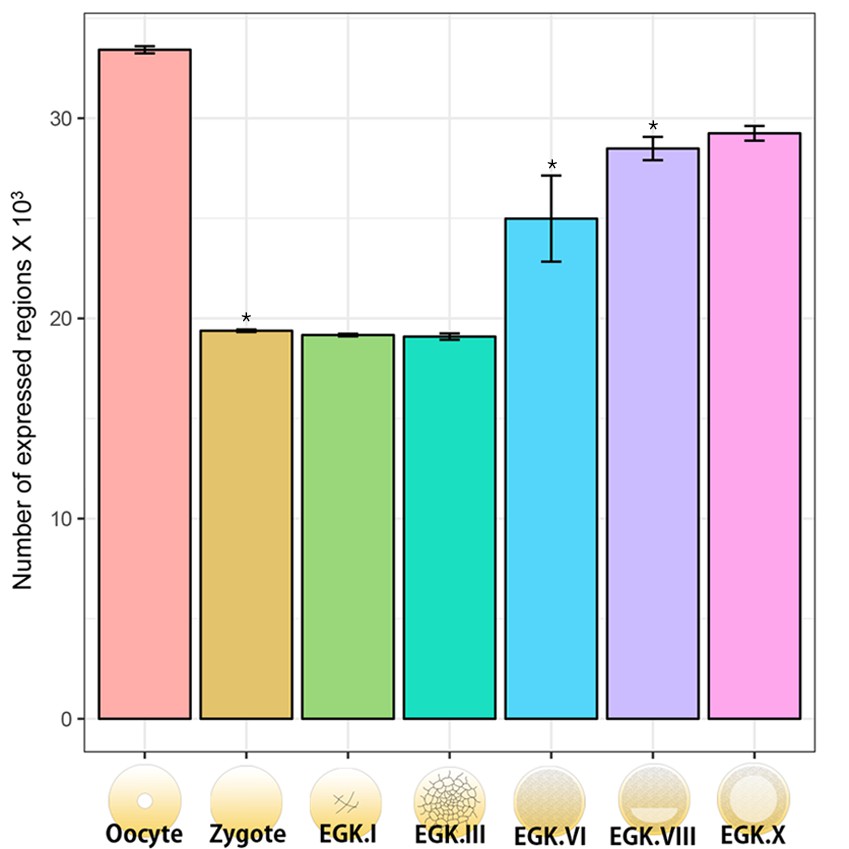
Quantification of the numbers of expressed regions including exons, introns and intergenic regions in the chicken genome.
The number of expressed regions during chicken early development was investigated on the basis of the quantification results of the mapped reads of the chicken genome (a total of 188,533 regions were featured). After normalisation using trimmed mean of M-value (TMM), the expressed regions were defined on the basis that the number of TMM values > 0. Significant differences in the number of annotated regions between consecutive developmental stages (oocyte vs. zygote, EGK.III vs. EGK.VI and EGK.VI vs. EGK.VIII) were represented (pairwise t-test *p<0.05).
Figure 1—figure supplement 2

Distribution of mapped reads on the exonic, intronic and intergenic regions during chicken early development.
The distribution of intronic reads is reduced after fertilisation and gradually increased after EGK.VI, probably because of the increase in the exonic proportion during both gene activation and processing of maternal RNAs. The proportion of intergenic regions exhibits little change during pre-ovipositional development in chicken.
Figure 1—figure supplement 3
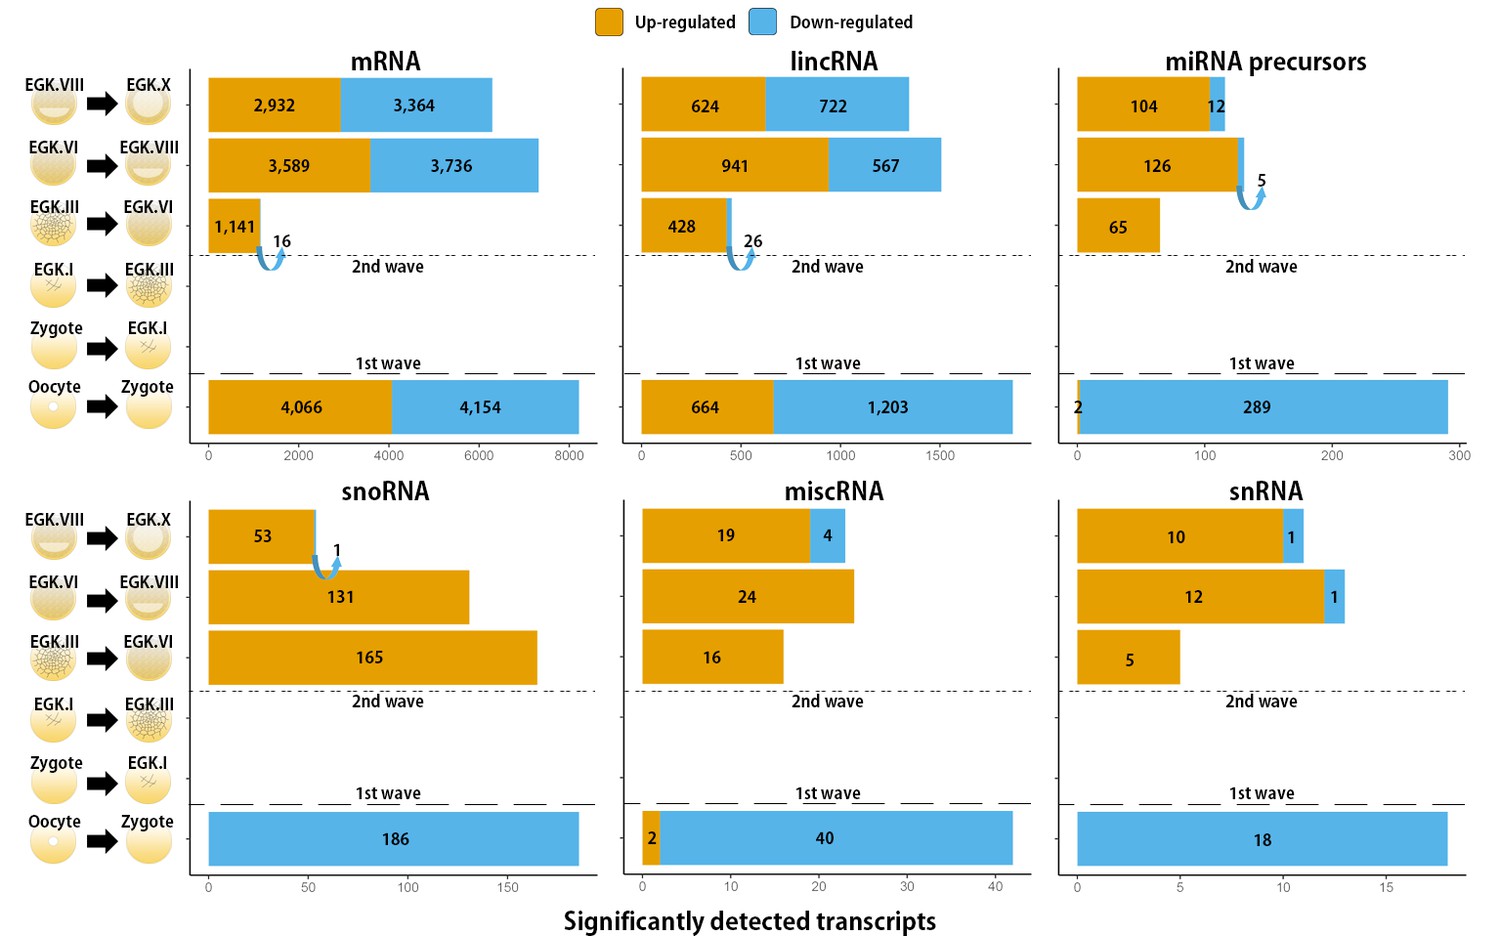
Transcripts that undergo a detected change in expression between each stage during chicken early development.
The number of differentially expressed mRNAs, lincRNAs, miRNA precursors, snoRNAs, miscRNAs and snRNAs was detected using either Ensembl gene annotation or the ALDB database. The orange and blue colors represent up- and downregulated genes at FDR-adjusted p<0.05, respectively.
Figure 2 with 1 supplement

Exonic and intronic mapped reads on candidate genes related to the 1st and 2nd wave of transcriptional activation in chickens.
(A, B) The pooled mapped reads based on the stage (three samples in each stage) were visualised using the Integrative Genomics Viewer tool. Detection with RT-PCR of gene activation via the appearance of primary transcripts based on whole-transcriptome sequencing and validation of the intronic expression of three genes (DLX6, GATA2 and ZIC4) during the 1st wave (A) and of three different genes (WNT11, WNT3A and C8ORF22) during the 2nd wave (B). The following figure supplements are available for Figure 2.
Figure 2—figure supplement 1
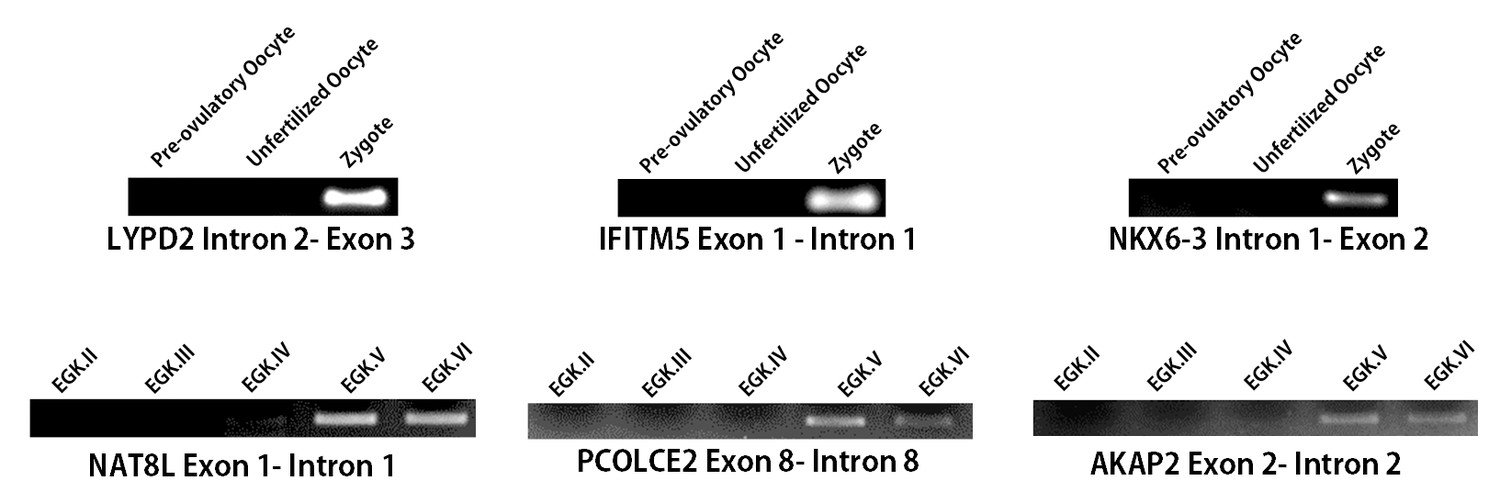
Detection of gene activation and validation of intronic expression.
Validation of the intronic expression of 1st wave genes (LYPD2, IFITM5 and NKX6-3) and of 2nd wave genes (NAT8L, PCOLCE2 and AKAP2)with RT-PCR.
Figure 3 with 2 supplements
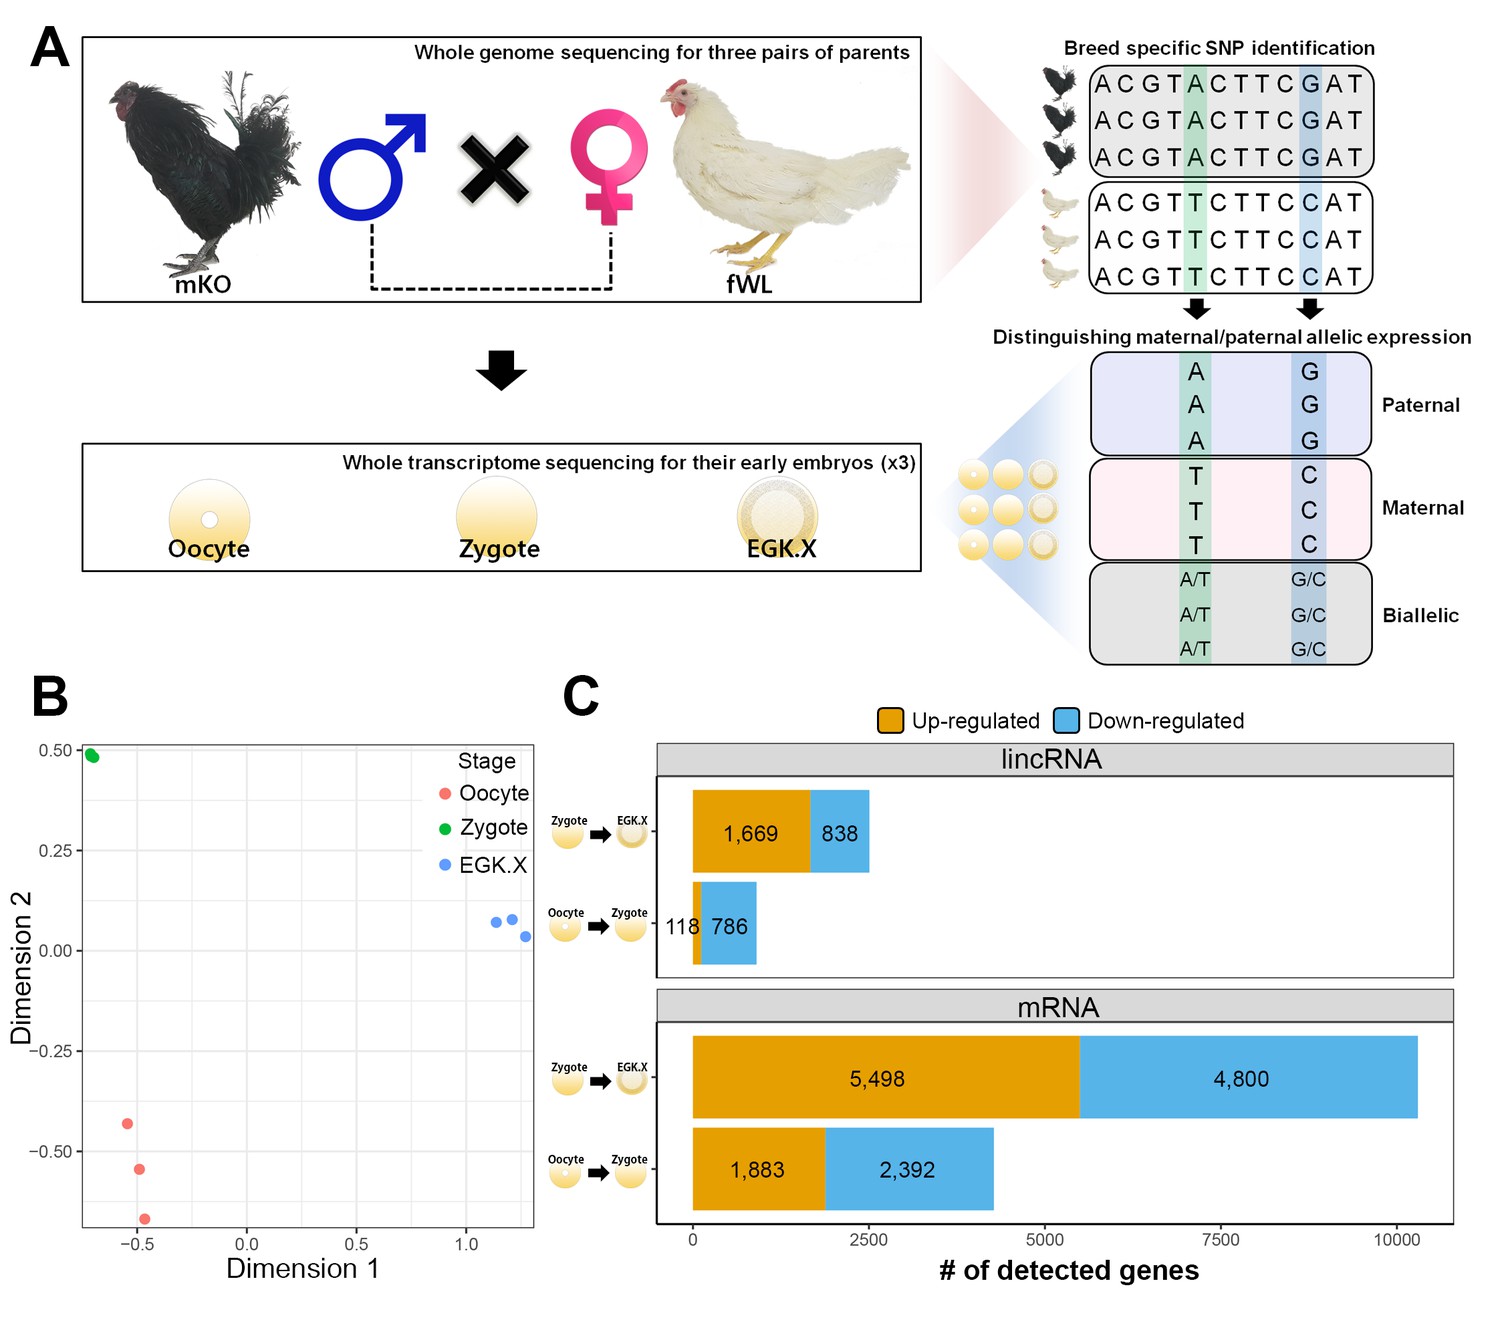
Whole-transcriptome analysis of single early chicken embryos.
(A) Schematic diagram of the experimental design using a multiomics approach to assess allelic expression. Three pairs of parental male Korean Oge (mKO) and female White Leghorn (fWL) chickens were subjected to whole-genome sequencing. Hybrid single embryos between mKO and fWL at the oocyte, zygote and EGK.X stages from each parent were subjected to whole-transcriptome sequencing. Allelic expression in the hybrid embryos was examined on the basis of breed-specific SNPs. (B) Multidimensional scaling (MDS) plot based on log2 trimmed mean of M-value (TMM) normalised gene expression of the whole transcriptome in pre-oviposited chicken embryos. Biological triplicates of single embryos were clustered, and three developmental stages were distinct. (C) Number of significantly detected long transcripts (mRNAs and lincRNAs) detected by comparing gene expression among single oocytes, zygotes and EGK.X embryos (FDR-adjusted p<0.05).
Figure 3—figure supplement 1
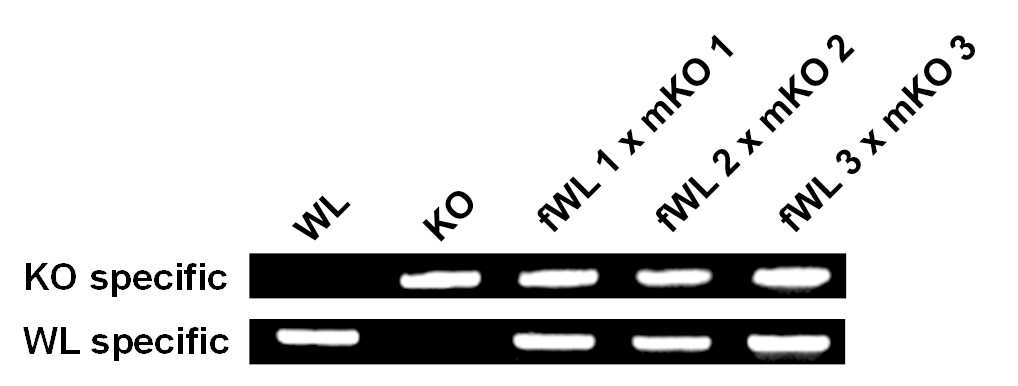
Confirmation of hybrid embryos (Hamburger and Hamilton stage 4) from crosses between female White Leghorn (fWL) and male Korean Oge (mKO) using breed-specific primers.
WL, White Leghorn control; KO, Korean Oge control.
Figure 3—figure supplement 2
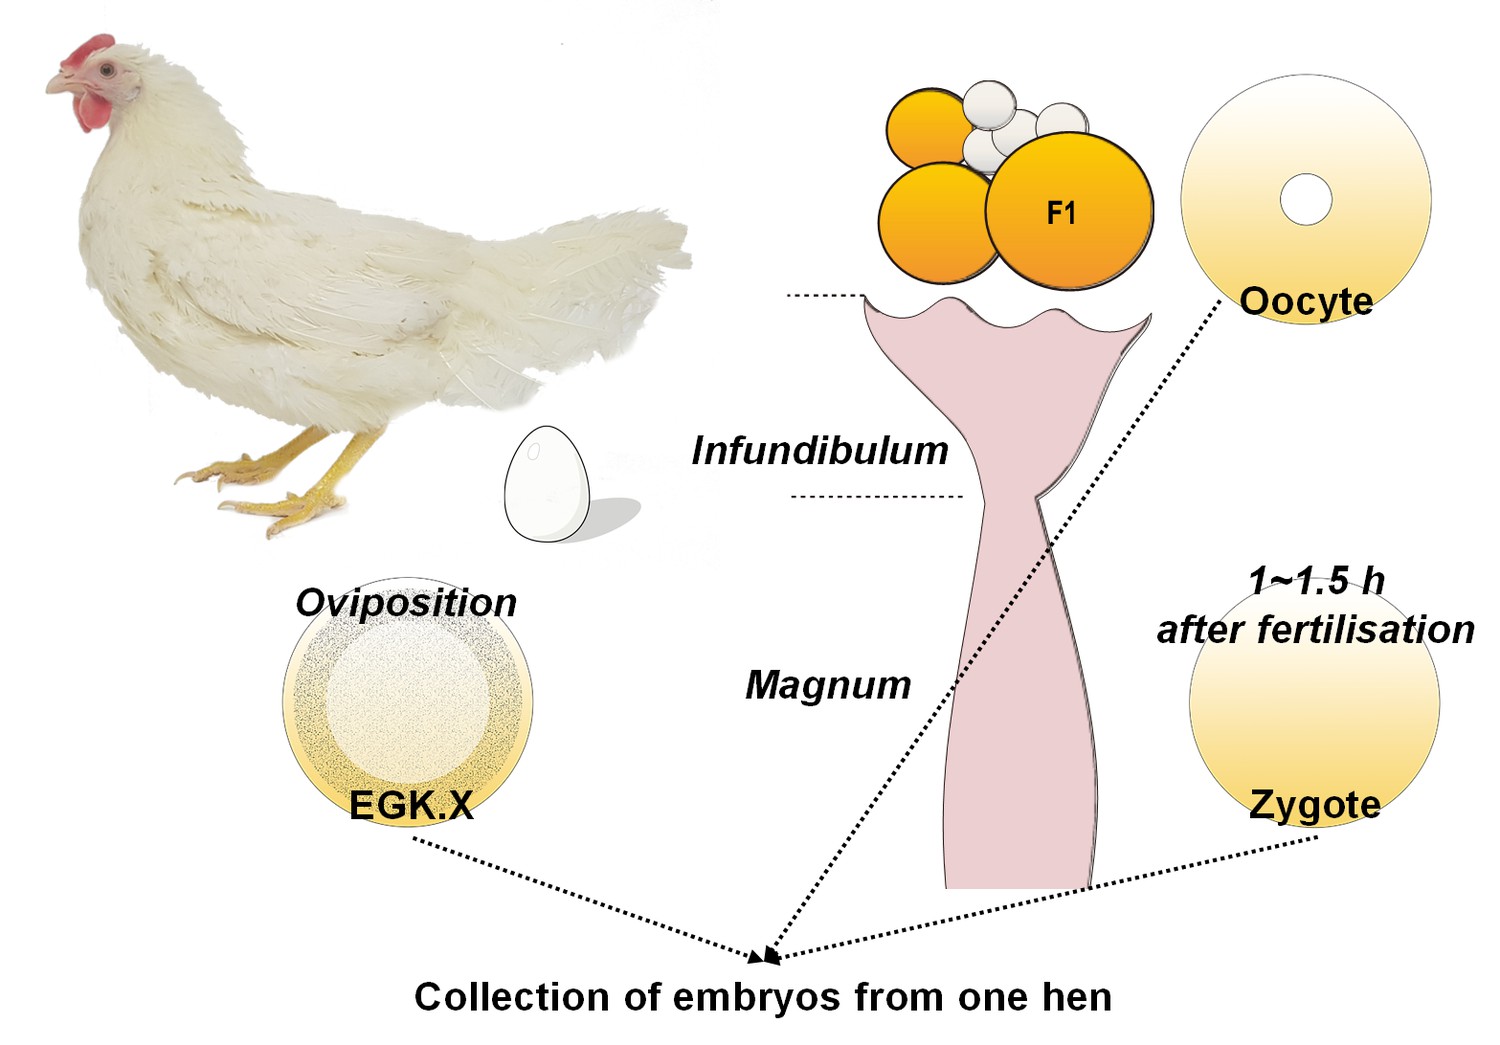
Schematic diagram of single oocyte, zygote and EGK.X embryo acquisition from one hen on the same day.
On the day of embryo acquisition, an EGK.X blastoderm was acquired at oviposition and the time was recorded. Approximately 1–1.5 hr after fertilisation according to the recorded egg-laying times, a pre-ovulatory F1 oocyte in the ovary and a zygote in the magnum were simultaneously collected.
Figure 4 with 2 supplements
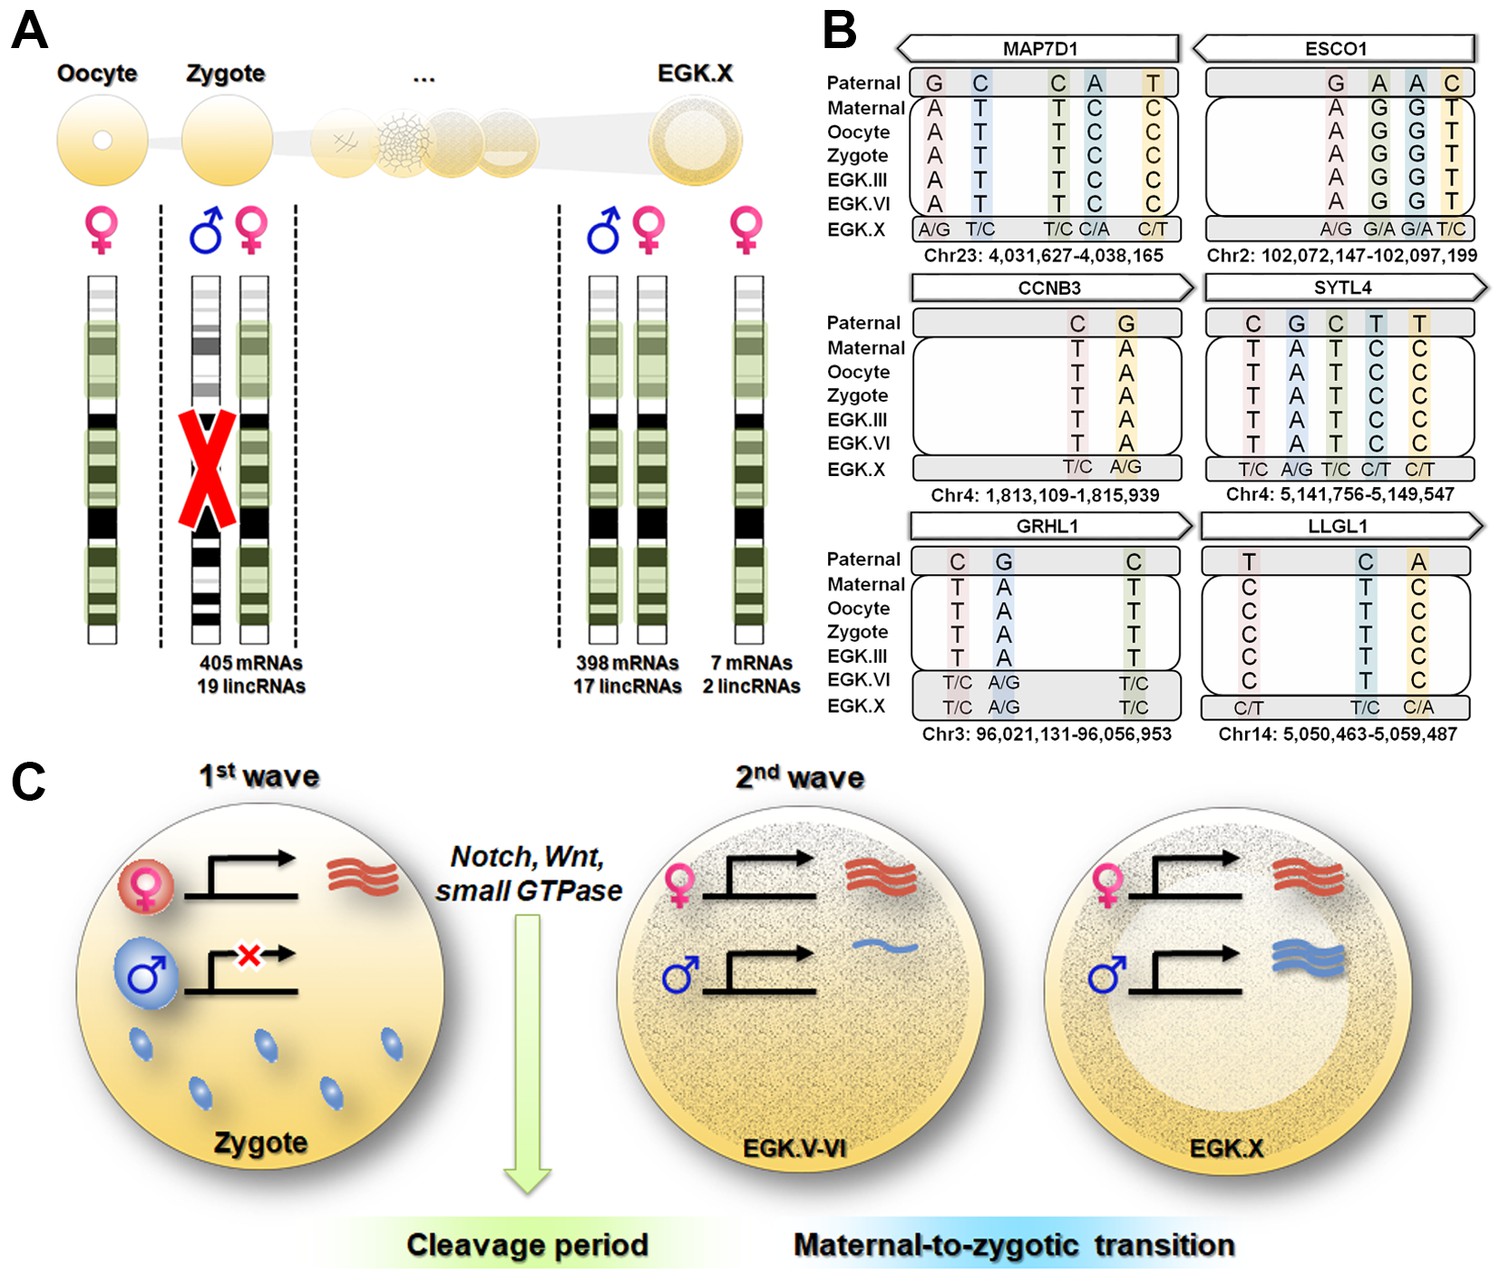
Maternal genome activation (MGA) during the 1st wave of transcriptional activation in chicken zygote.
(A) Determination of parental allelic expression from the zygote stage. Only maternal alleles were observed in transcripts induced by stst activation. These maternally derived upregulated genes showed bi-allelic expression after EGK.X. (B) Validation of 1st wave transcription-induced maternal allelic expression by Sanger sequencing. The maternal transcription profile after the 1st wave changed to bi-allelic expression between EGK.VI and EGK.X after the 2nd activation. (C) Schematic summary of genome activation during chicken early development. Only MGA occurred after fertilisation and this wave of gene activation may regulate the cleavage period.
Figure 4—figure supplement 1

Functional classification of genes by maternal genome activation during the 1st wave of transcriptional activation and tracing through early development.
Heatmaps showing the expression patterns of the transcripts that are significantly upregulatedbetween oocyte and zygote (FDR-adjusted st<0.05 and logFC >0) in terms of biological processes in Gene Ontology (GO) and KEGG pathway enrichment.
Figure 4—figure supplement 2
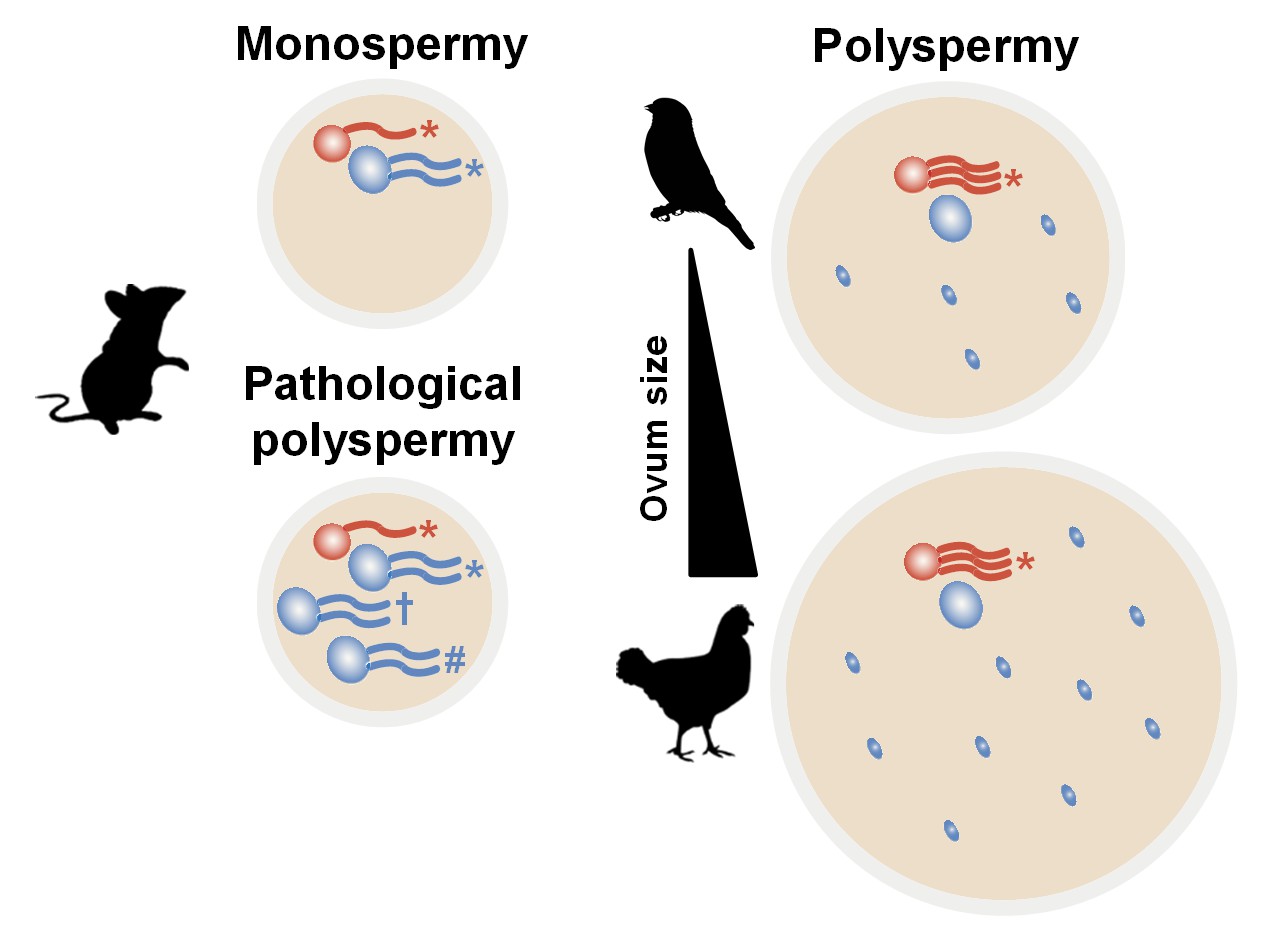
Hypothetical diagram for avian polyspermy and only maternal genome activation after fertilisation.
Maternal genome activation in avian zygotes would be needed to overcome excessive genetic material and genetic instability owing to the variability of polyspermy when compared with mammalian fertilisation. *, † and # indicate different types of transcripts by multiple sperm. Large red circle, maternal pronucleus (PN); large blue circle, paternal PN; small blue circle, supernumerary sperm nucleus in avian species.
Tables
Key resources table
| Reagent type (species) or resource | Designation | Source or reference | Identifiers | Additional information |
|---|---|---|---|---|
| Sequence-based reagent | Breed-specific primers | (Choi et al., 2007) | See elsewhere in 'Materials and methods' | |
| Sequence-based reagent | RT-PCR primers | This paper | See Supplementary file 6 | |
| Commercial assay or kit | DNeasy Mini Kit | Qiagen | Qiagen:69504 | |
| Commercial assay or kit | TRIzol reagent | Invitrogen | Invtirogen:15596026 | |
| Commercial assay or kit | SuperScript III First-Strand Synthesis System | Invitrogen | Invitrogen:18080051 | |
| Commercial assay or kit | pGEM-T Easy Vector Systems | Promega | Promega:A1360 | |
| Software, algorithm | Code used for RNA-seq quantification analysis | This paper | The python code used for RNA-seq quantification analysis. See Source code 1 |
Additional files
-
Supplementary file 1
Gene list and expression of transcripts for exon–intron PCR.
- https://doi.org/10.7554/eLife.39381.015
-
Supplementary file 2
(A) Total RNA quantity of a single chicken early embryo. (B) Upregulated intronic expression between single oocyte and zygote (FDR-adjusted p<0.05).
- https://doi.org/10.7554/eLife.39381.016
-
Supplementary file 3
(A) Variant calling of single hybrid embryo RNA-Seq to determine which parental allele was expressed. (B) Gene list and expression of genotyped transcripts by Sanger sequencing.
- https://doi.org/10.7554/eLife.39381.017
-
Supplementary file 4
Significantly detected biological processes of GO and KEGG pathways on the basis of upregulated DEGs between single oocytes and zygotes.
- https://doi.org/10.7554/eLife.39381.018
-
Supplementary file 5
(A) Detected SNPs on each chromosome from the WGS data. (B) Quality information for detected SNPs in WGS data. (C) Detected SNPs on each chromosome from the WTS data. (D) Quality information for detected SNPs in WTS data. (E) Detected maternal SNPs in multiomics analysis.
- https://doi.org/10.7554/eLife.39381.019
-
Supplementary file 6
(A) Primers used for the exon–intron RT-PCR. (B) Primers used for the validation of allelic expression.
- https://doi.org/10.7554/eLife.39381.020
-
Source code 1
Python script for generating intron and intergenic regions based on the Ensembl GTF.
- https://doi.org/10.7554/eLife.39381.021
-
Transparent reporting form
- https://doi.org/10.7554/eLife.39381.022
Download links
A two-part list of links to download the article, or parts of the article, in various formats.
Downloads (link to download the article as PDF)
Open citations (links to open the citations from this article in various online reference manager services)
Cite this article (links to download the citations from this article in formats compatible with various reference manager tools)
Zygotic gene activation in the chicken occurs in two waves, the first involving only maternally derived genes
eLife 7:e39381.
https://doi.org/10.7554/eLife.39381


