Age-dependent dormant resident progenitors are stimulated by injury to regenerate Purkinje neurons
- Sloan Kettering Institute, United States
- Organization for the Promotion of Regional Innovation, Mie University, JAPAN
- Weill Cornell Graduate School of Medical Sciences, United States
Figures
Figure 1 with 3 supplements
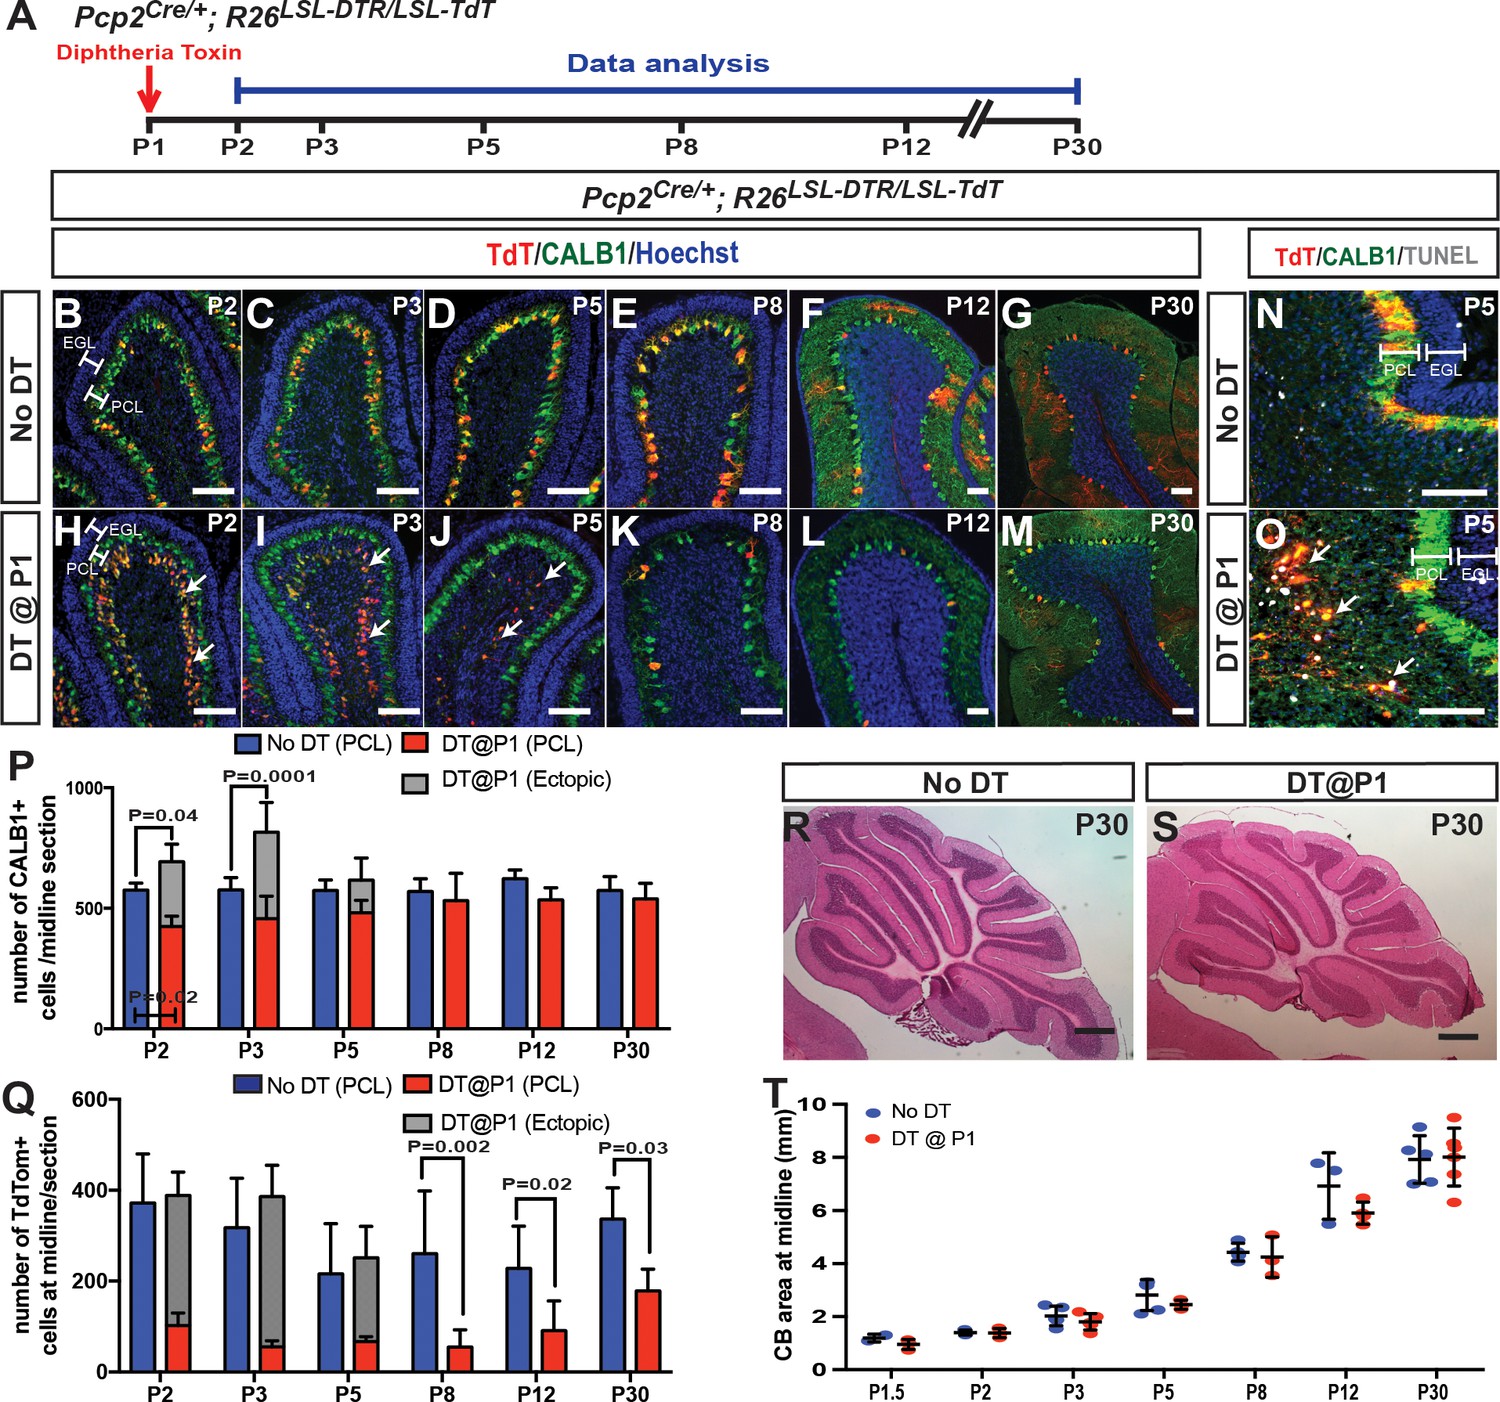
Ablation of PCs at P1 stimulates their replenishment and development of normal CB size and morphology.
(A) The experimental plan. (B–M) IF analysis at the indicated ages for TdT and CALB1 in sagittal cerebellar sections of lobule IV-V in No DT (B-G) and P1-PC-DTR mice (H-M). (N–O) Analysis of apoptosis at P5 using TUNEL. (P) Quantification of CALB1+ cells per midline section in PCL (blue or red) and ectopic layer (grey) (PCL cells: Two-way ANOVA F(5,54)=4.034, p=0.0035, and total number of PCs: Two-way ANOVA F(5,27)=4.732, p=0.003, n ≥ 3 animals/condition). (Q) Quantification of TdT+ cells per section (PCL cells: Two-way ANOVA F(5,48)=6.957, p=0.0001). Significant post hoc comparisons are shown. (R–S) H and E stained midline sagittal sections of cerebella at P30 of No DT (R) and P1-PC-DTR (S) mice. (T) Quantification of midline sagittal areas of cerebella shows no differences upon DT injection (p=0.89, n ≥ 3 for each age). Scale bars: (B–O) 200 μm, (R–S) 500 μm. (EGL: external granule layer, PCL: Purkinje cell layer).
-
Figure 1—source data 1
Summary of the antibodies used in the study.
- https://doi.org/10.7554/eLife.39879.007
-
Figure 1—source data 2
Summary of the statistics performed.
- https://doi.org/10.7554/eLife.39879.008
Figure 1—figure supplement 1
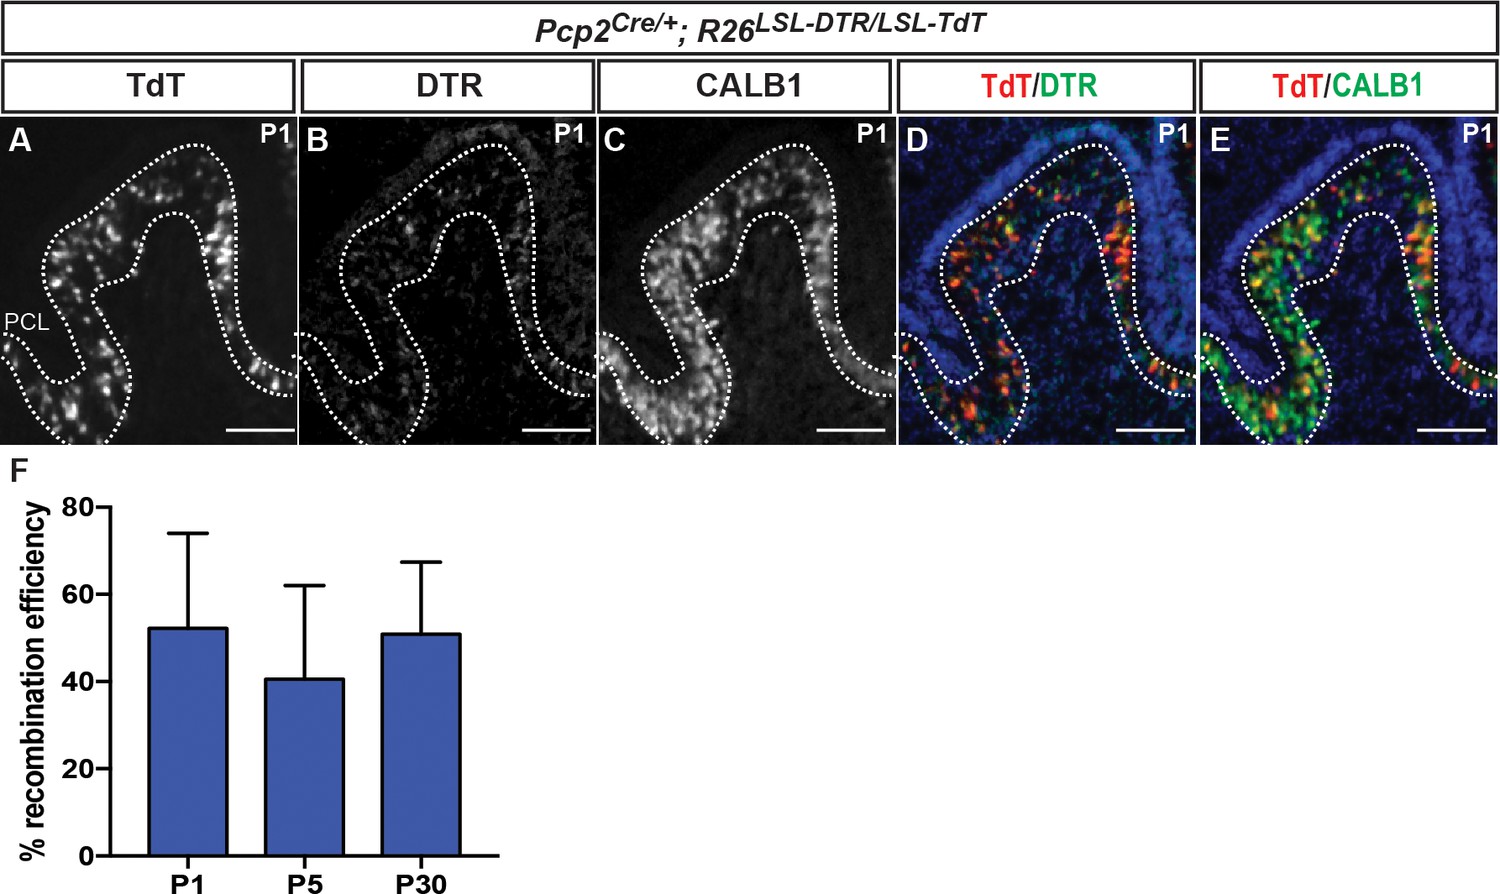
DTR and TdT are co-expressed in ~50% of PCs in PC-DTR mice at P1, P5 and P30.
(A–E) IF analysis at P1 of the indicated proteins and combinations shows that all the TdT+ cells express DTR and CALB1. (F) Quantification of recombination efficiency in PCs (%TdT+ and CALB1+ cells over all CALB1+ cells) at P1, 5 and 30 shows no significant change (One-way ANOVA, F(2,9)=0.4341, p=0.66, n ≥ 3 animals/age). DTR: Diphtheria toxin receptor, PCL: Purkinje cell layer. Scale bar: 100 μm.
Figure 1—figure supplement 2
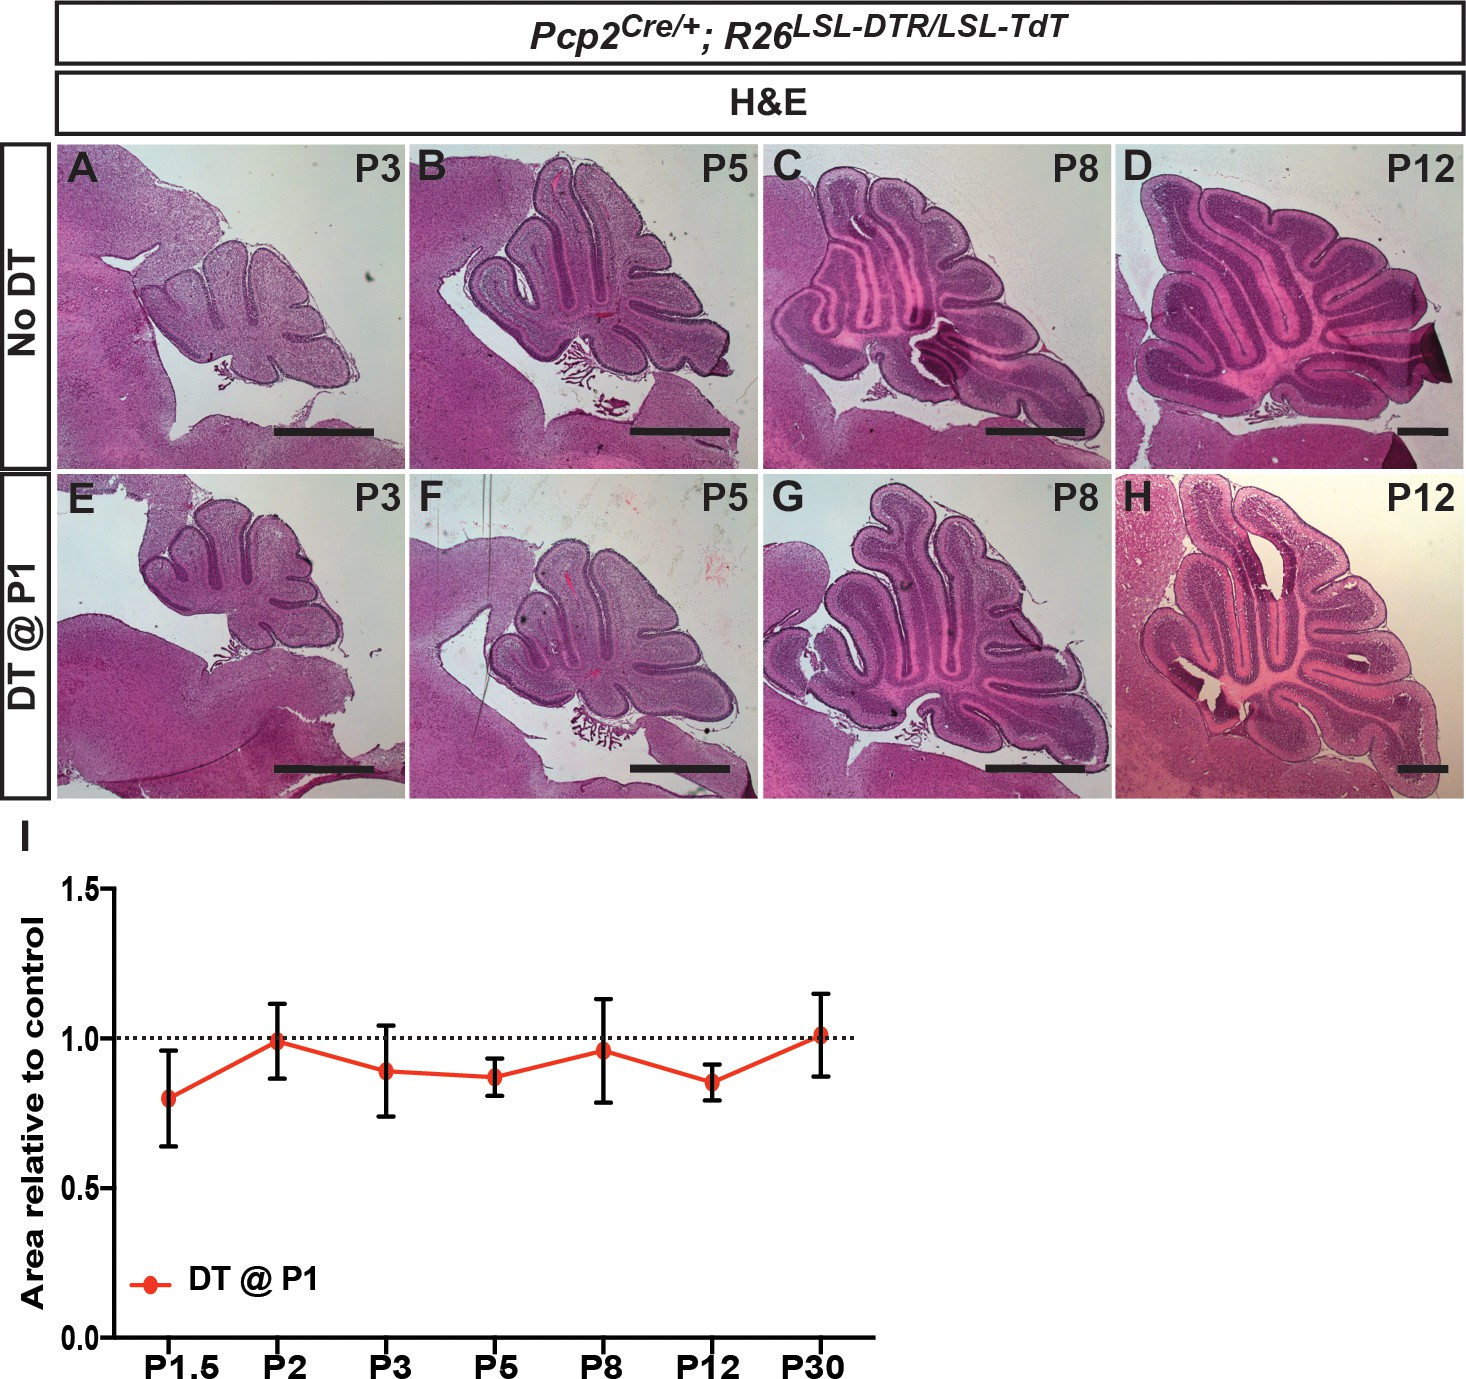
CB size and morphology appears normal following DT-mediated ablation of PCs at P1.
(A–H) H and E stained midline sagittal sections of cerebella at the ages indicated for No DT (A-D) and P1-PC-DTR (E-H) mice. (I) Quantification of midline sagittal areas of cerebella shows no differences upon DT injection (n ≥ 3 for each age). Scale bars: 500 μm.
Figure 1—figure supplement 3
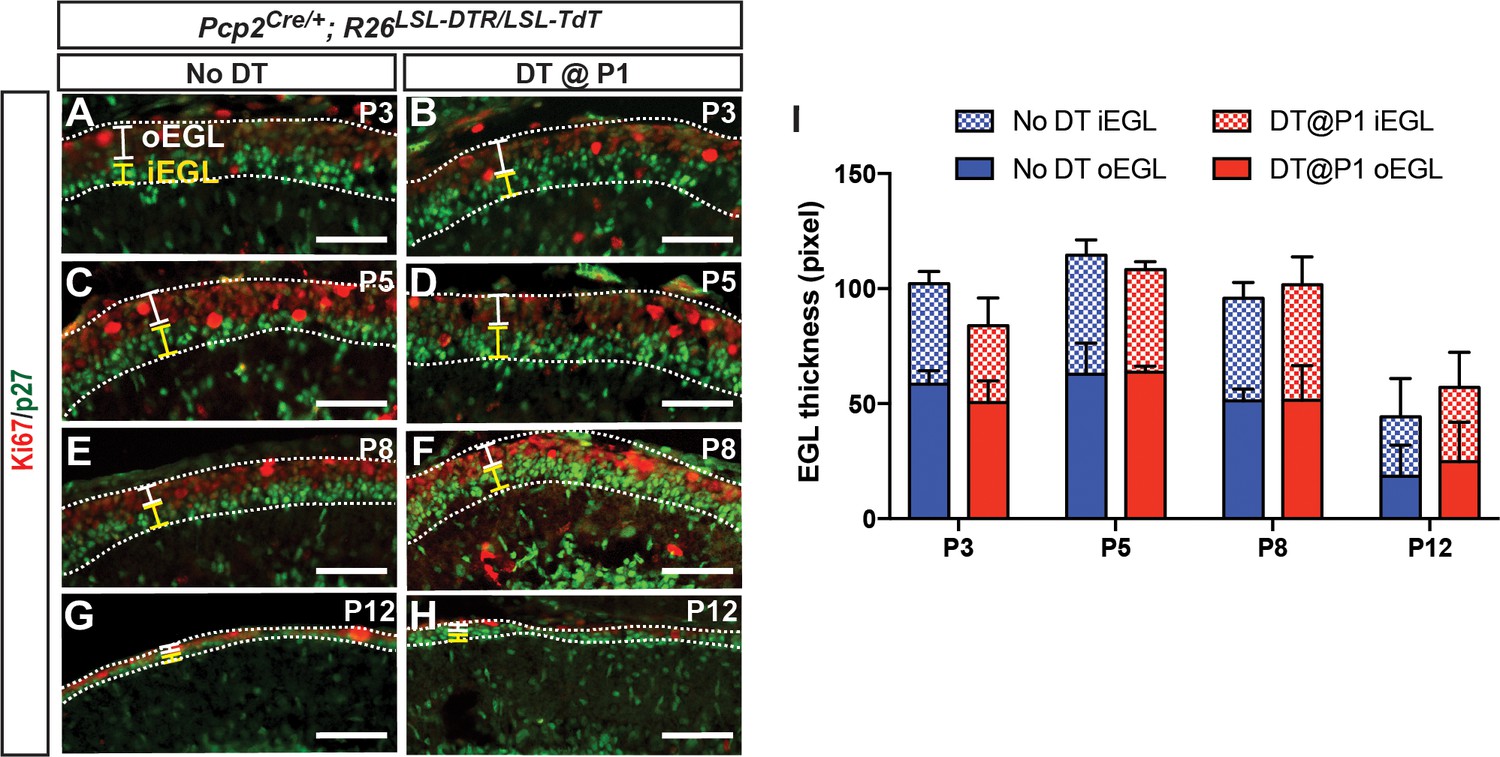
External granule cell layer thickness is not changed after DT-mediated killing of PCs at P1.
(A–H). IF analysis of Ki67 (outer EGL, oEGL) and p27 (inner EGL, iEGL) in No DT (A, C, E, G) and P1-PC-DTR (B, D, F, H) animals at the indicated ages. (I) Quantification of the thickness (area/length) of the outer EGL (oEGL), which contains proliferating granule cell progenitors, and the inner EGL (iEGL), which contains the differentiating granule cells, reveals no significant differences in total EGL area and the ratio of inner and outer EGL areas between No DT and P1-PC-DTR animals (n = 3/condition) (p=0.85). EGL: external granule layer. Scale bars: 100 μm.
Figure 2 with 5 supplements
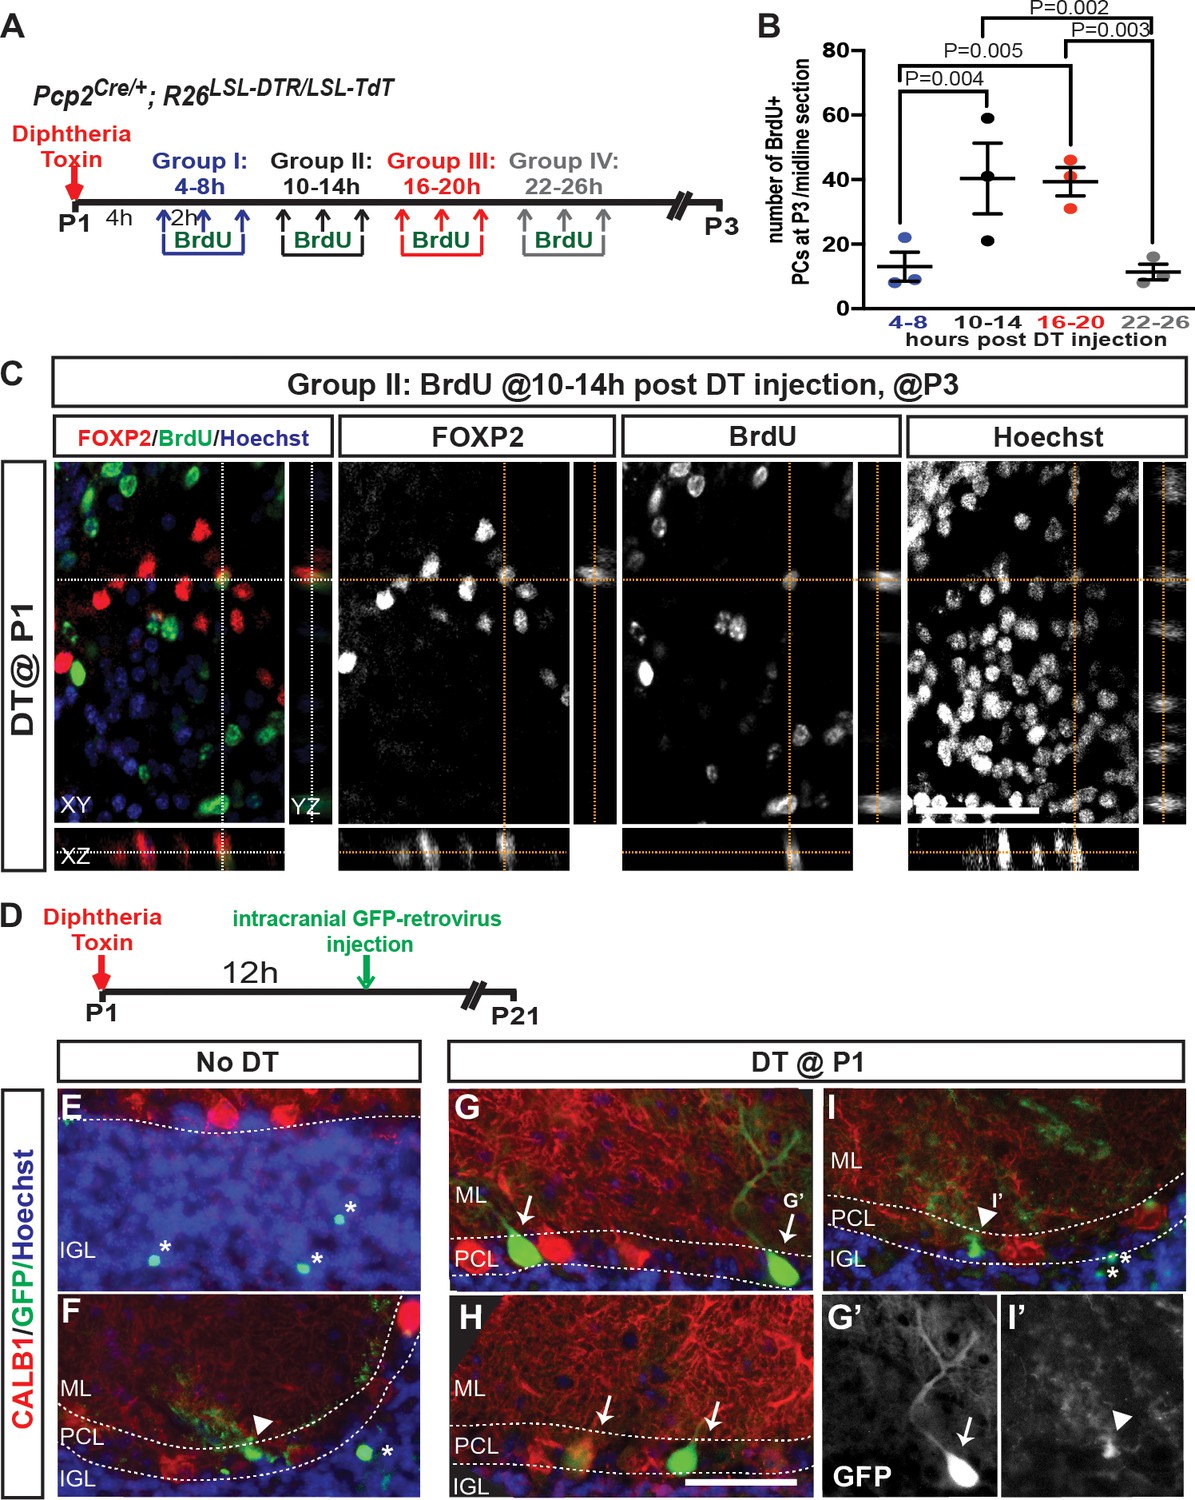
Progenitors proliferate within 24 hr of DT-injection at P1 in PC-DTR mice and produce new PCs.
(A) The experimental plan. (B) Quantification of the number of BrdU+ PCs (CALB1+) at P3 in P1-PC-DTR mice (Two-way ANOVA F(3,16)=6.163, p=0.006, n = 3 animals/condition). Significant post hoc comparisons are designated in the figure. (C) Representative images of BrdU injection performed at 10–14 hr post DT injection in P3 P1-PC-DTR CB. (n = 3 animals/condition). Orthogonal view from z-stack obtained by confocal microscopy demonstrates colocolization of BrdU and FOXP2 after PC depletion. (D) Experimental plan for retroviral labeling. P1-PC-DTR pups were injected with GFP expressing retrovirus to label proliferating cells and the brains were analyzed 3 weeks later. (E–I) IF analysis shows examples in two mice of each genotype of rare retrovirus labeled PCs (arrows) following regeneration (G, H) only in P1-PC-DTR mice. GFP+ GCs (asterisk) and Bergmann glia cells (arrow head) were observed in No DT (E, F) and P1-PC-DTR (I) mice (n = 6 mice/condition). G’ and I’ shows GFP-expressing PC and a Bergmann glia cell. Scale bars: 50 μm.
Figure 2—figure supplement 1
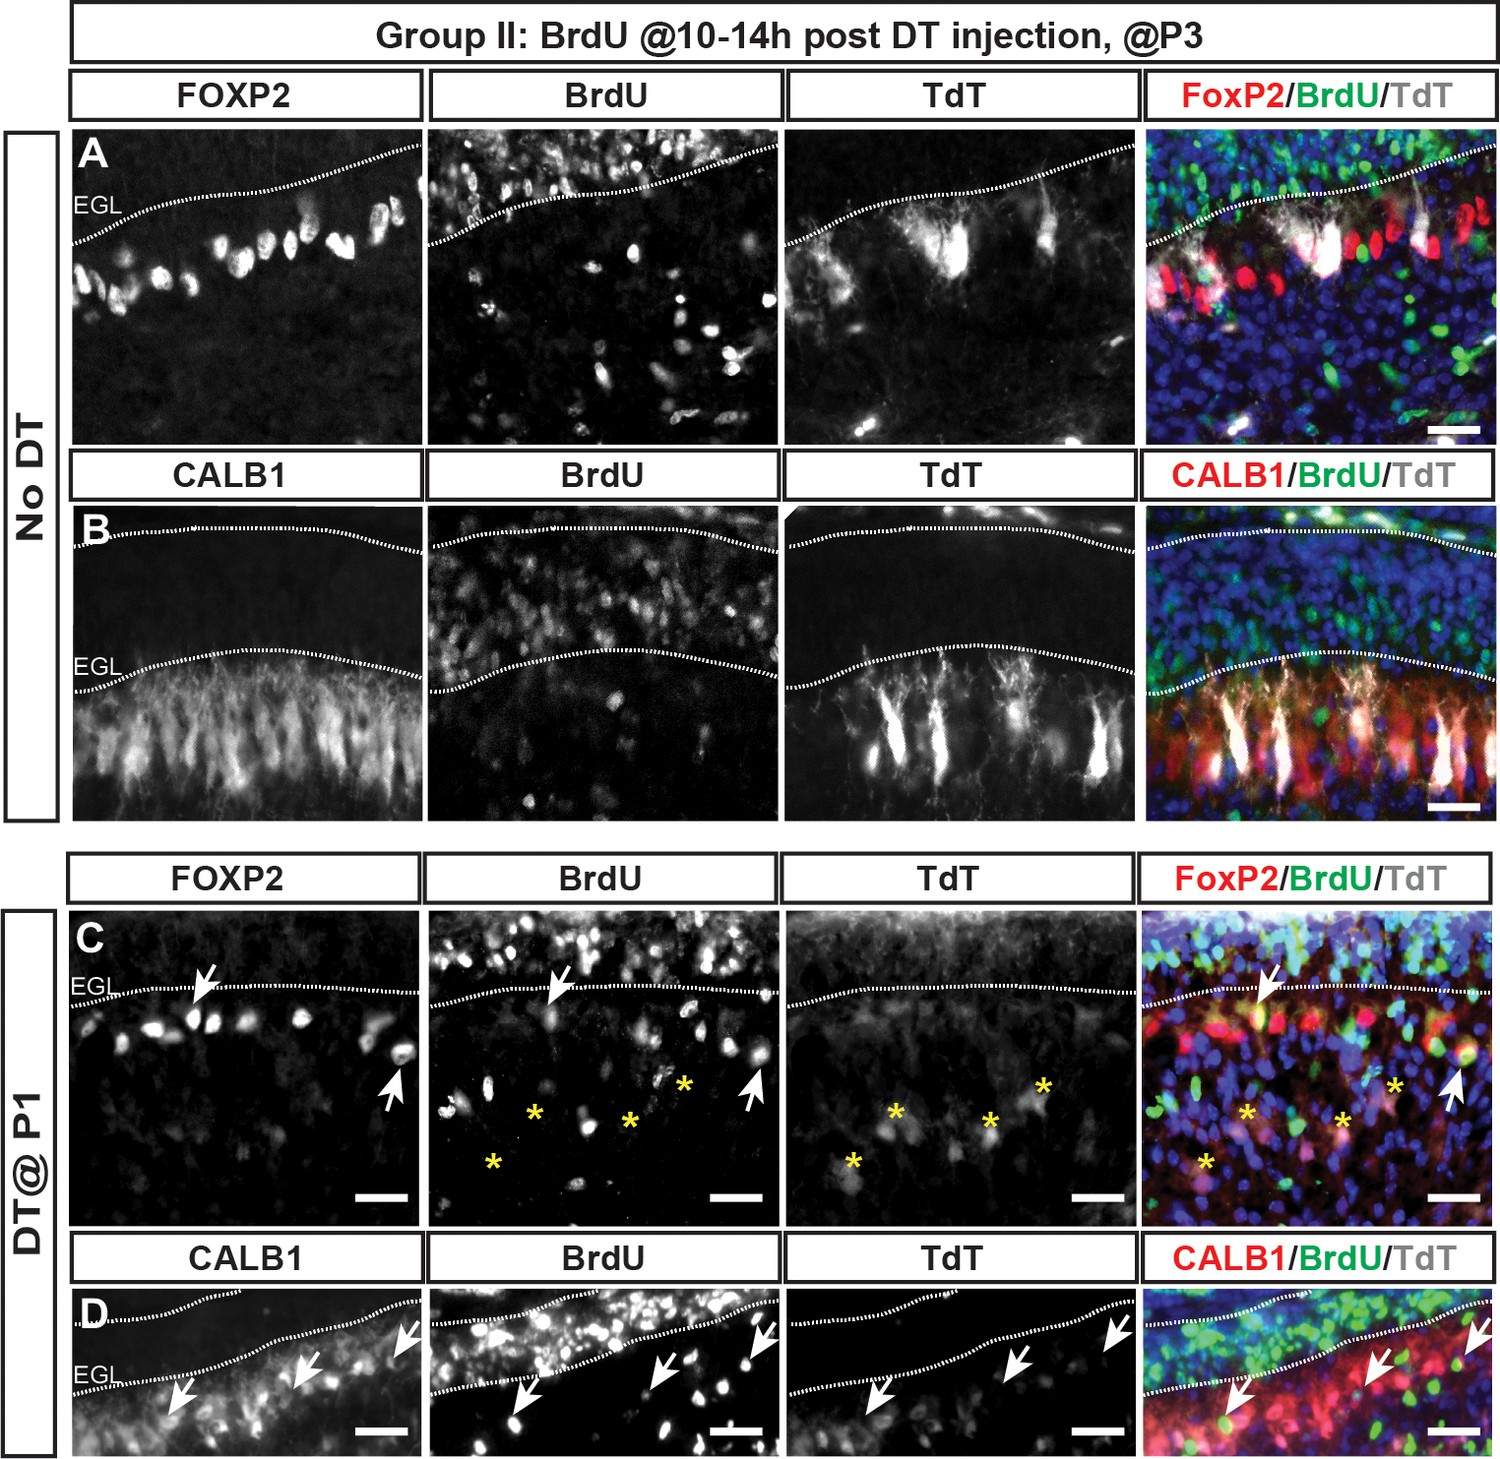
BrdU incorporation occurs within 24 hr of DT injection at P1 in PC-DTR mice and BrdU+ PCs can be observed at P3.
(A–D) Representative images of P3 cerebella from BrdU injection performed 10–14 hr post DT injection at P1 in No DT (A, B) or P1-PC-DTR (C, D) mice (n = 3 animals/condition). IF analysis of No DT brains at P3 shows no BrdU incorporation in PCs, identified by either FOXP2 (A) or CALB1 (B). IF analysis of P1-PC-DTR animals at P3 shows BrdU+ cells that are FOXP2+ (C) or CALB1+ (D) (arrows). Asterix shows TdT+ cells are BrdU-.
Figure 2—figure supplement 2
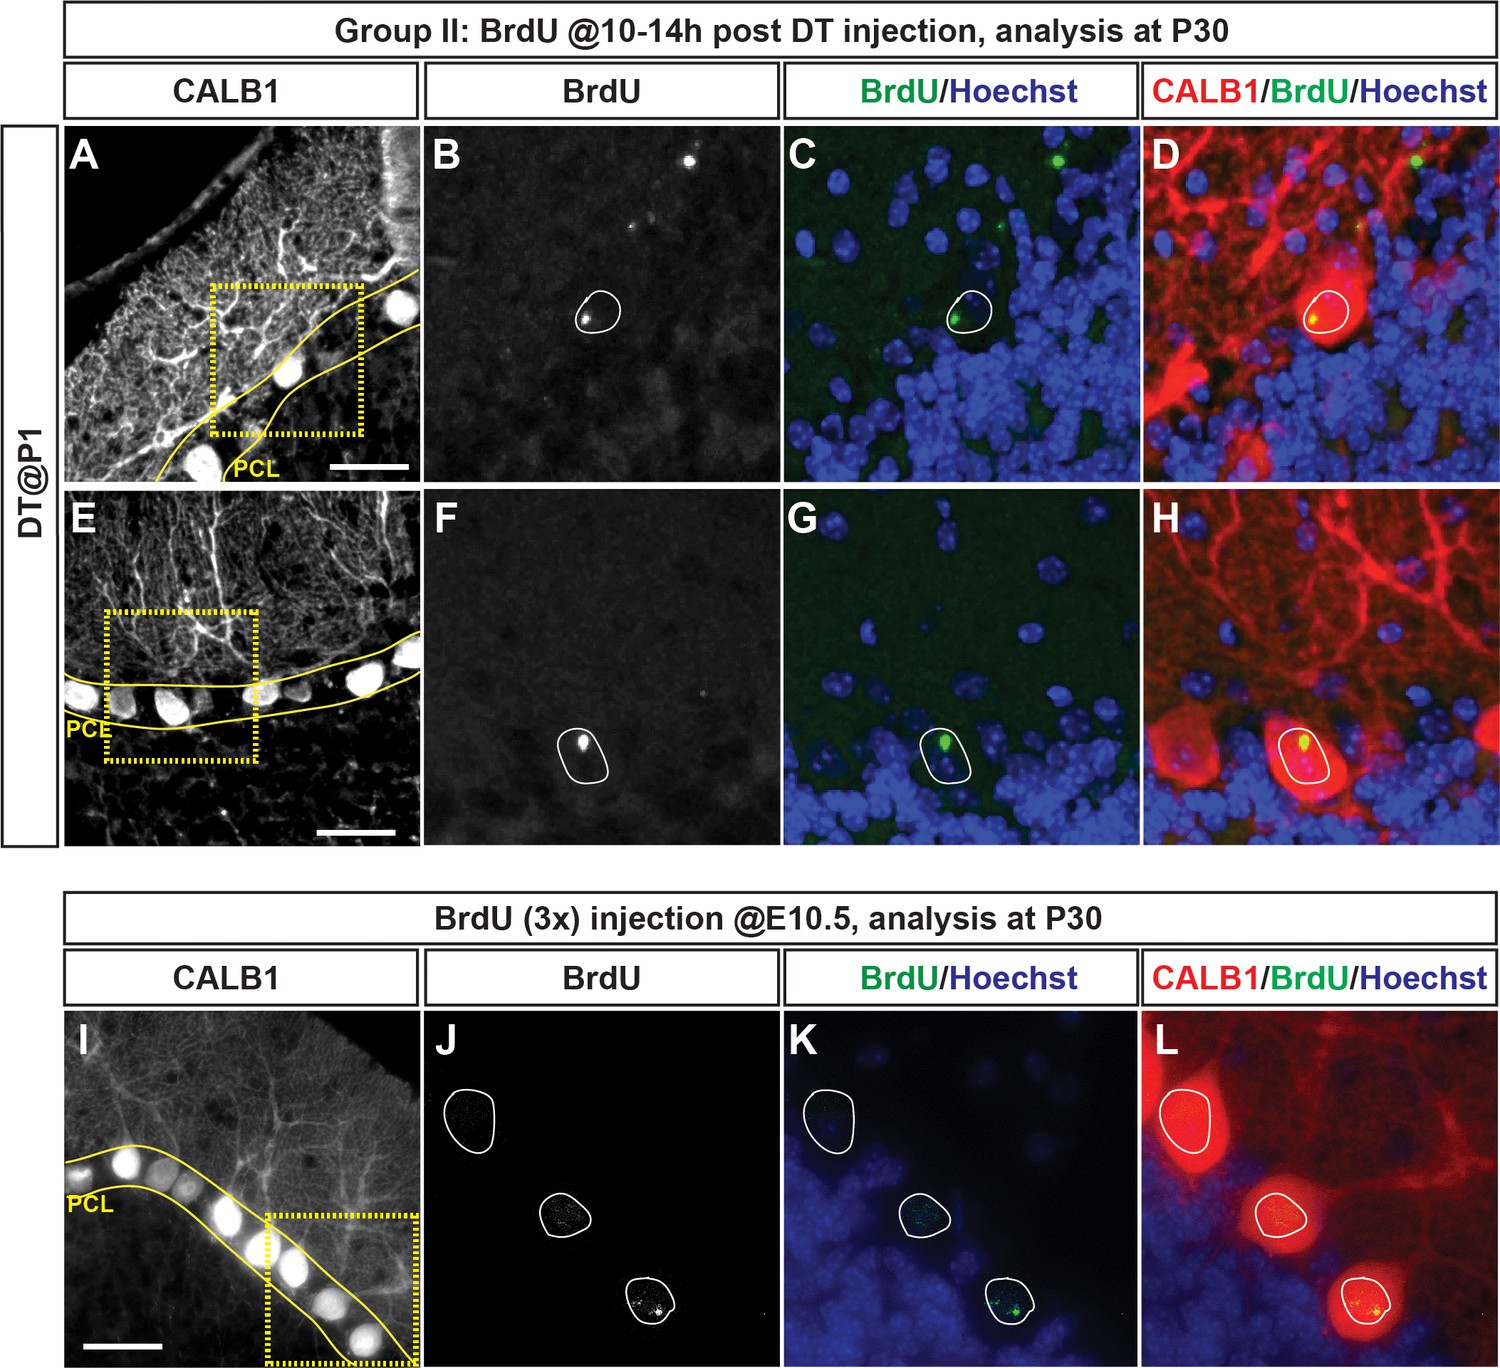
BrdU is detected in adult PCs of P1-PC-DTR animals that received BrdU 10–14 hr post DT injection.
(A–H) IF analysis of BrdU+ cells in P30 P1-PC-DTR pups given three 2 hr apart injections at 10-14hpi shows that PCs that incorporated BrdU survive to adulthood and have similar cell bodies and dendritic trees to their neighbors. (I–L) As a control, wild type E10.5 embryos were injected with BrdU (three 2 hr apart injections) and PCs were analyzed at P30. This experiment (I-L) shows highly localized BrdU incorporation in the PCs, similar to the staining pattern observed in P1-PC-DTR mice (A-H). Scale bars: 50 μm.
Figure 2—figure supplement 3

DNA damage following irradiation or depletion of PCs in P1-PC-DTR mice does not result in incorporation of BrdU.
(A) Schematic describing the experimental plan. As a positive control for DNA damage we performed irradiation on P1 pups. (B–C) IF analysis of control brains (no IR and no DT, R26LSL-DTR/LSL-TdT mice) for BrdU+ and γ-H2AX shows only proliferating cells that are mainly in the EGL co-label for both markers and no cells in the PCL. (E–G) 4Gy irradiation was performed 30 min prior to BrdU injections. Thinning of the EGL due to death of proliferating granule cell precursors is observed compared to control and P1-PC-DTR conditions. γ-H2AX foci are observed in most cells, including PCs (asterisk in G). No clear BrdU incorporation is observed following irradiation. (H–J) P1-PC-DTR animals show no y-H2AX in the cells that incorporated BrdU (arrow in J). n = 3 animals/condition were analyzed. Scale bars: 50 μm.
Figure 2—figure supplement 4
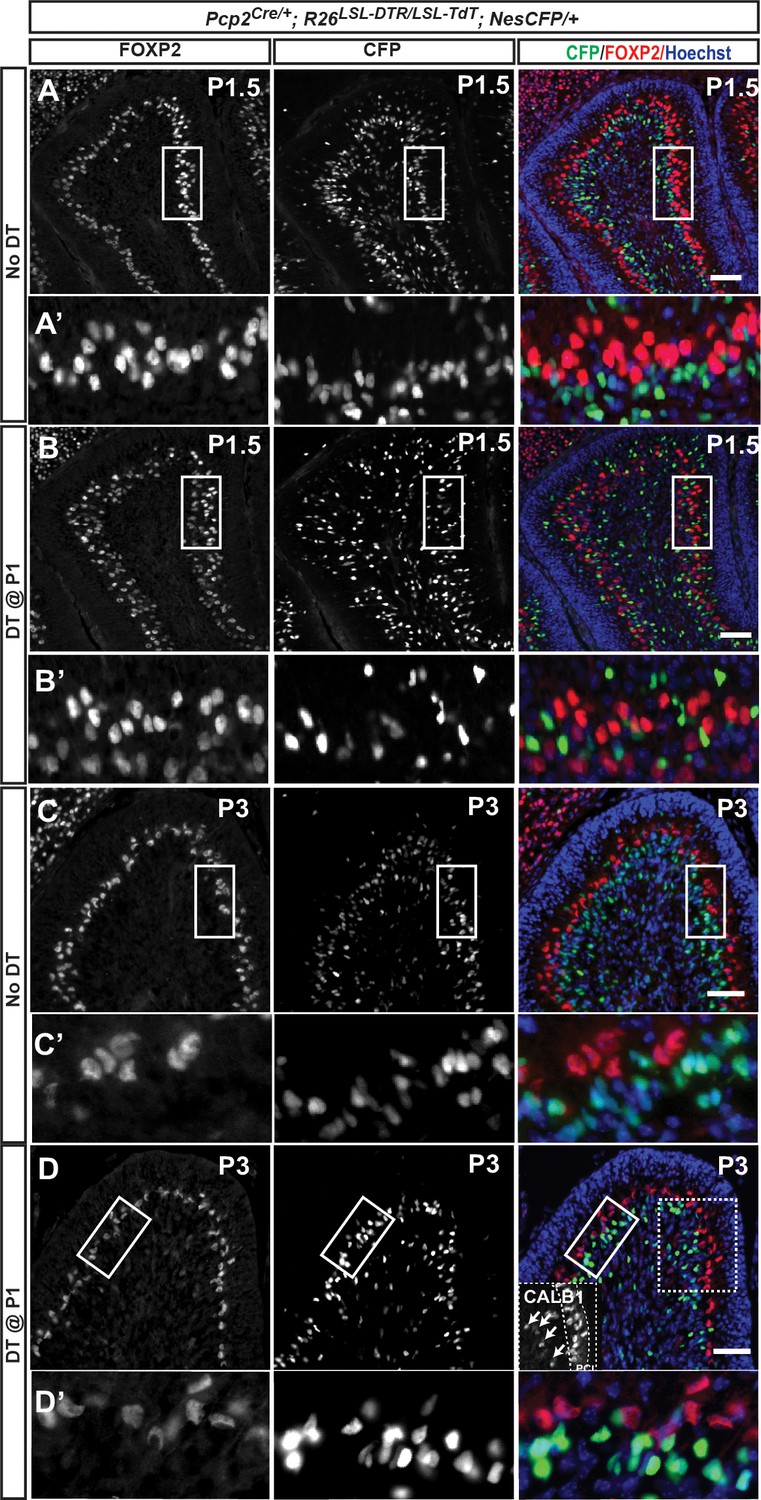
Nestin-expressing progenitors are not responsible for the recovery of PCs following DT-mediated ablation at P1.
(A–D) A Nestin-CFP reporter was used to transiently track the fate of NEPs and revealed no overlap between FOXP2+ cells and CFP staining 12 hr (P1.5) (A, A’ and B, B’) and 2 days (P3) (C, C’ and D, D’) after PC depletion in P1-PC-DTR mice. Note that in B’ FOXP2 staining is weaker in the ectopic layer of dying PCs that in the PCL. Inset in (D) shows the ectopic CALB1+ cells. n = 3 animals/condition were analyzed. Scale bars: 100 μm.
Figure 2—figure supplement 5
Fate mapping confirms that Nestin-expressing progenitors are not responsible for the recovery of PCs following DT-mediated ablation at P1.
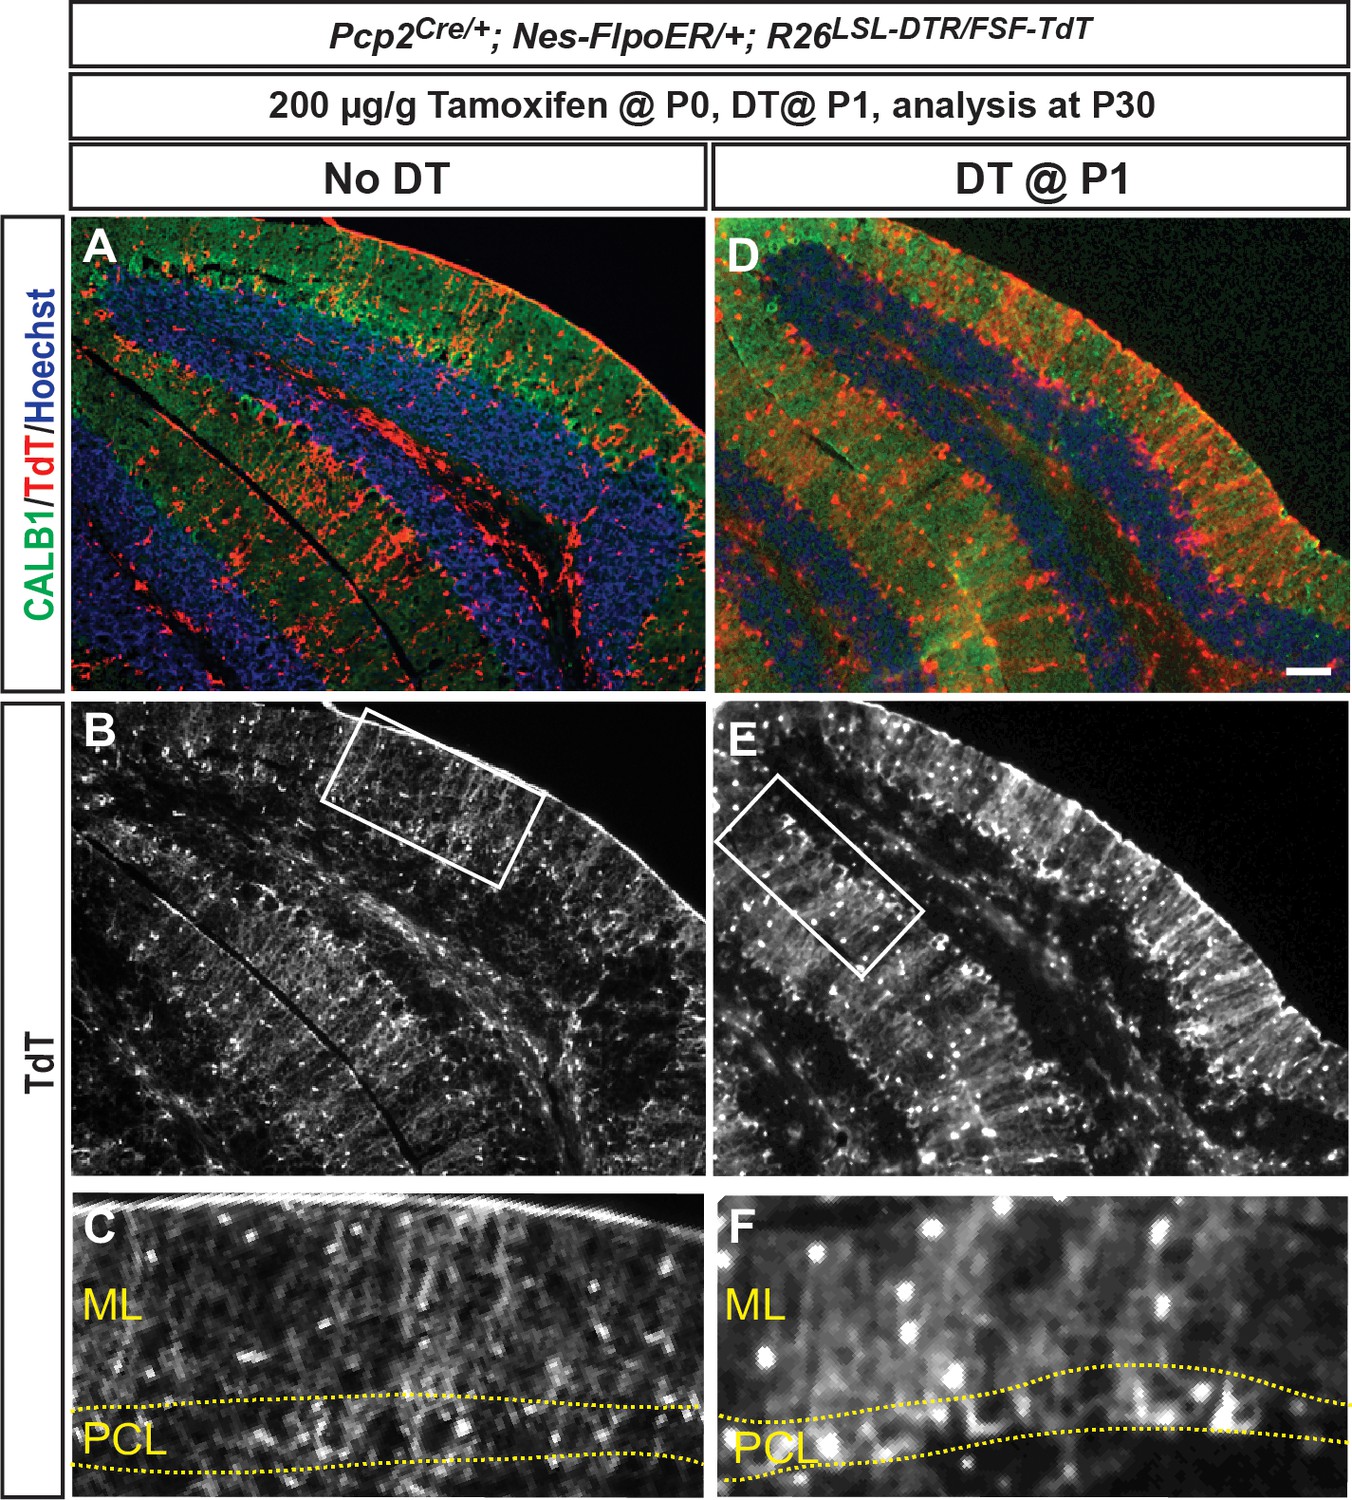
(A–D) A Nestin-FlpoER/+; R26FSF-TdT/+ was used to fate map Nestin-expressing progenitors. Tamoxifen was given prior to depletion at P0, followed by DT injection at P1. Brains were analyzed at P30 (n = 3/condition). Fate mapping shows no TdT+ PCs at P30 after PC depletion in P1-PC-DTR and in No DT mice. Scale bars: 100 μm.
Figure 3 with 8 supplements
The number of iPCs diminishes with age and increases after ablation of PCs.
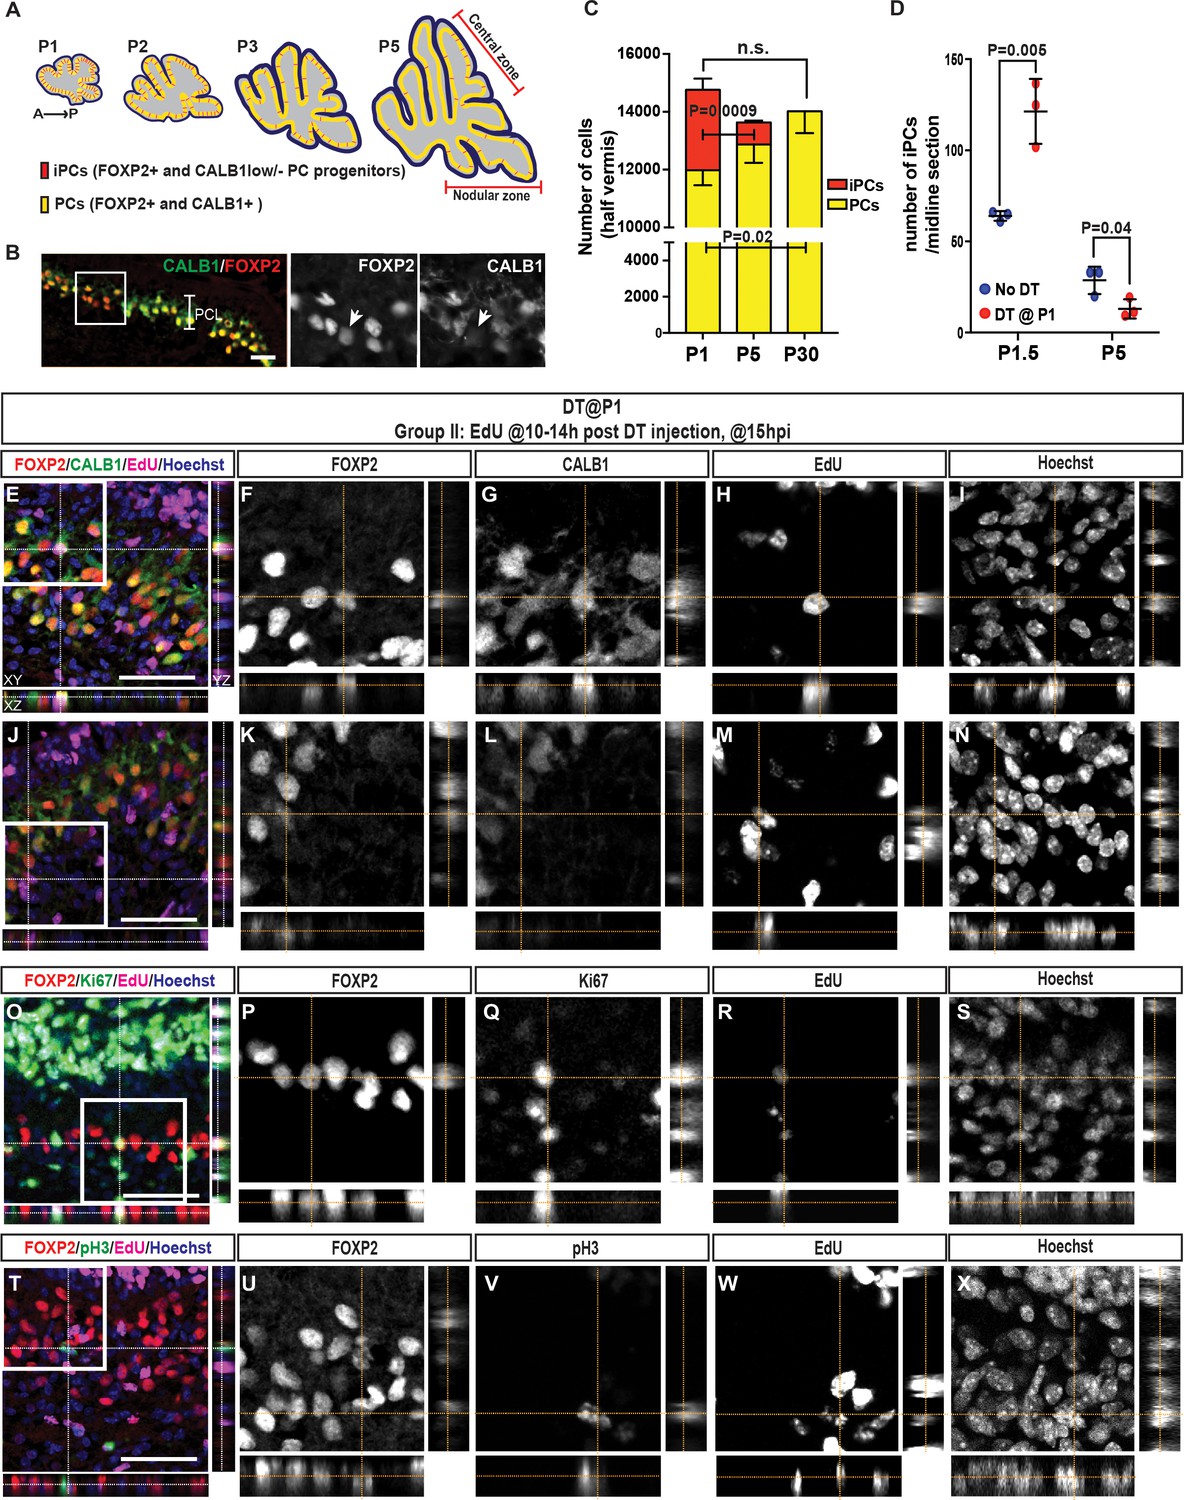
(A) Schematic representation of the distribution of iPCs (red) in sagittal midline sections of P1-5 cerebella (yellow, FoxP2+ and CALB1+ PCs) (B) IF analysis of iPCs (FoxP2+ and CALB1-/low, arrow) at P1.5 in No DT mice. (C) Quantification of the numbers of iPCs and PCs at P1, P5 and P30 (CALB1+: One-way ANOVA F(2.6) = 6.883, p=0.028, iPCs: Student’s t-test: p=0.0009, all cells: One-way ANOVA F(2.6) = 1.813, p=0.24, n = 3 animals/condition). Significant post hoc comparisons are shown. (D) Quantification of the numbers of iPCs at P1.5 (Two-tailed t-test, p=0.005, n = 3) and P5 (Two-tailed t-test, p=0.04, n = 3) in No DT and P1-PC-DTR mice. (E–N) Orthogonal projections of z-stack shows a EdU+ PC (CALB1+, FOXP2+) (E–I) or iPC (CALB1-/low, FOXP2+) (J–N) at 15 hr post injection (hpi) in P1-PC-DTR mice (n = 3). (O–X) Orthogonal projections of z-stack shows EdU+ and FOXP2+ cells that either express the cell cycle markers KI67 (O–S) or pH3 (T–X) at 15 hr post injection (hpi) in P1-PC-DTR mice (n = 3). Scale bars: (B) 100 μm, (E, J, O, T) 50 μm.
Figure 3—figure supplement 1
iPCs are not labeled by Pcp2Cre and their numbers diminish with age.
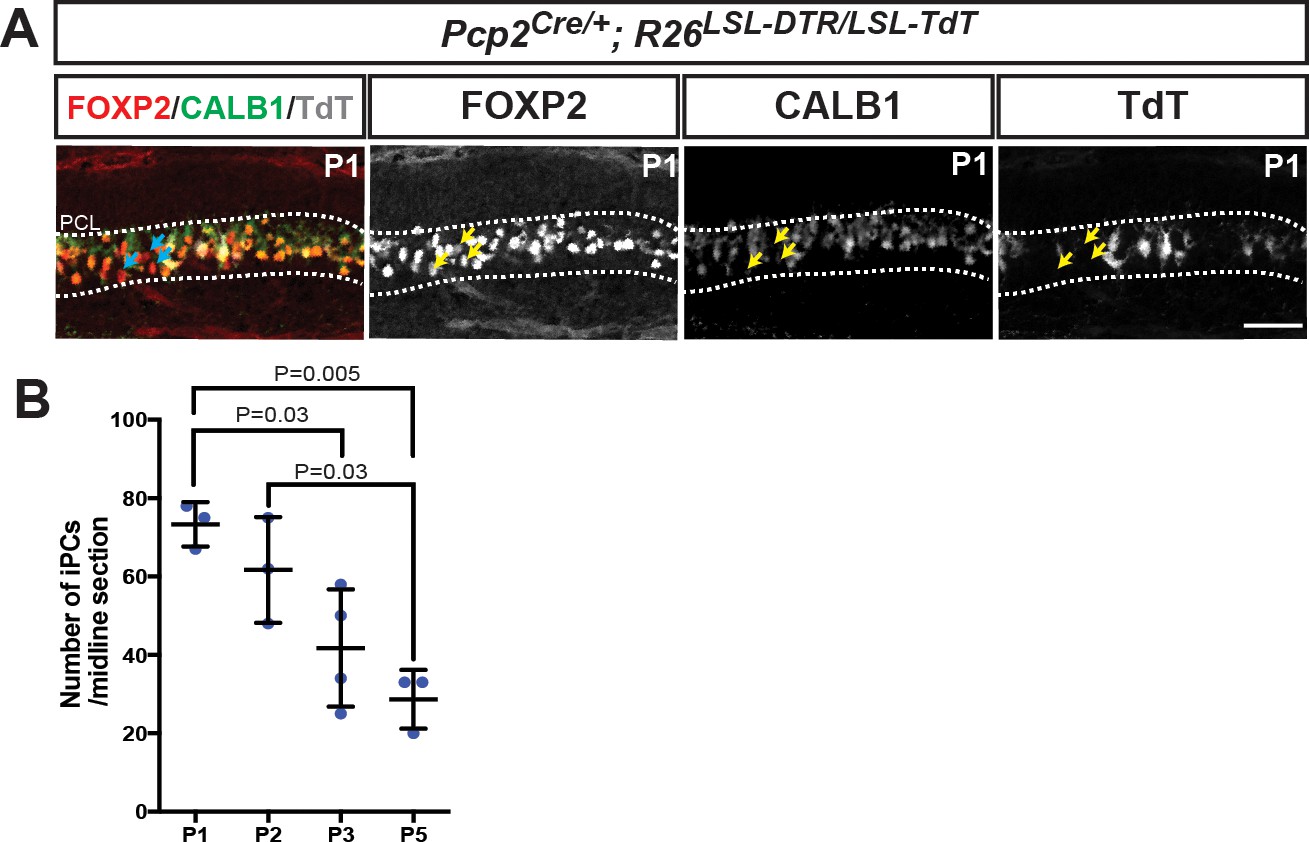
(A) IF analysis of iPCs at P1 (FOXP2+ and CALB1-/low, arrows) shows that they are not TdT+, thus they escape DT-mediated cell death. (B) Quantification of the number of iPCs shows a steady decrease in the number of cells/midline section. (One-way ANOVA F(3,9)=9.074, p=0.004, n ≥ 3 animals/condition and three sections/mouse). Significant post hoc comparisons are shown.
Figure 3—figure supplement 2

FoxP2-TdT fate mapping marks iPCs in the PCL at P1 as well as rare cells outsidethe PCL.
FoxP2Flpo/+; R26FSF-TdT/+ (FoxP2-TdT; FSF = frt stop-frt) animals were analyzed at P1. (A) As predicted, all of the FOXP2+ cells in the PCL were labeled with TdT+ and some were CALB1-/low. Arrow shows a TdT+, FOXP2+ CALB1-/low cell (iPC) in the PCL. (B–D) FoxP2-TdT also marks rare PAX2+ interneurons (B), PAX6+ granule cells (C) and SOX2+ glial cells/progenitors (D), none of which reside in the PCL. These results suggest the Flpo allele is unexpectedly expressed transiently in rare embryonic progenitors of other lineages than PCs. n = 3 animals/condition were analyzed. Scale bars: 200 μm.
Figure 3—figure supplement 3
The number of FoxP2-TdT transiently marked iPCs increases 12 hr after DT injection at P1.
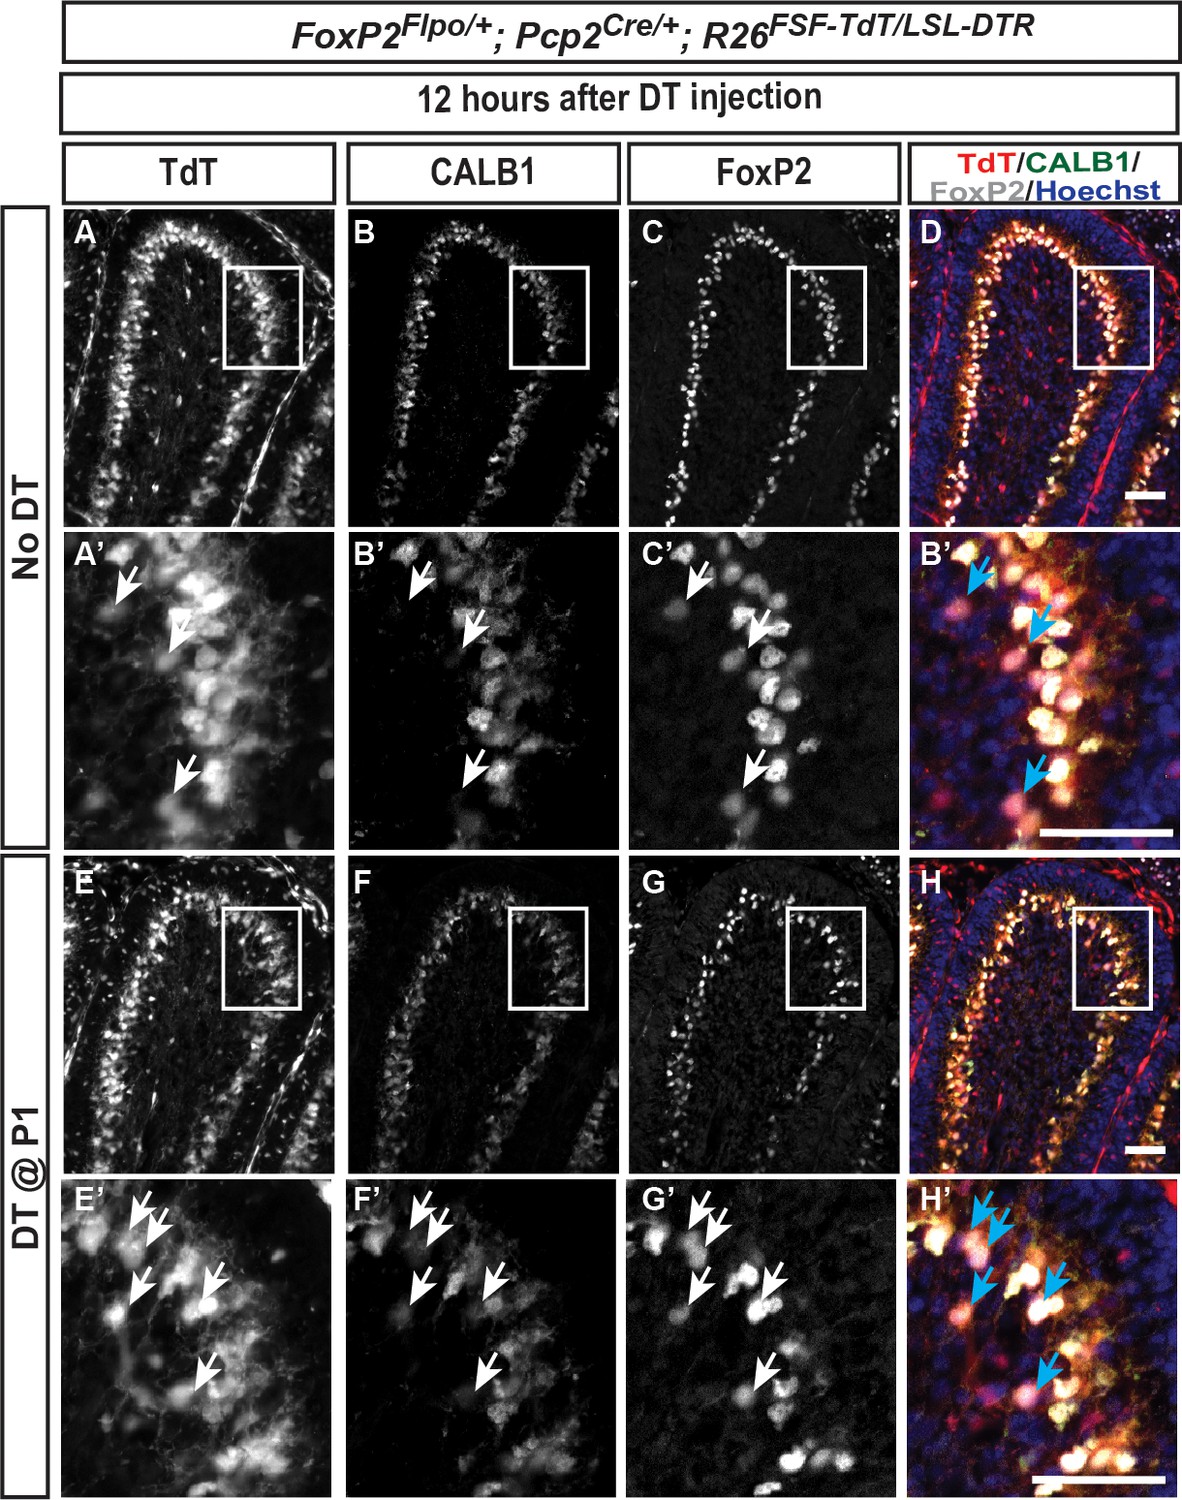
(A–H) iPCs (TdT+, FOXP2+, CALB1-/low, arrows in the higher magnified images) are sparsely located in No DT FoxP2-TdT pups (A–F) and the number increases 12 hr after DT injection at P1 (E-H, see text, n = 3 animals/condition). Scale bars: 50 μm.
Figure 3—figure supplement 4
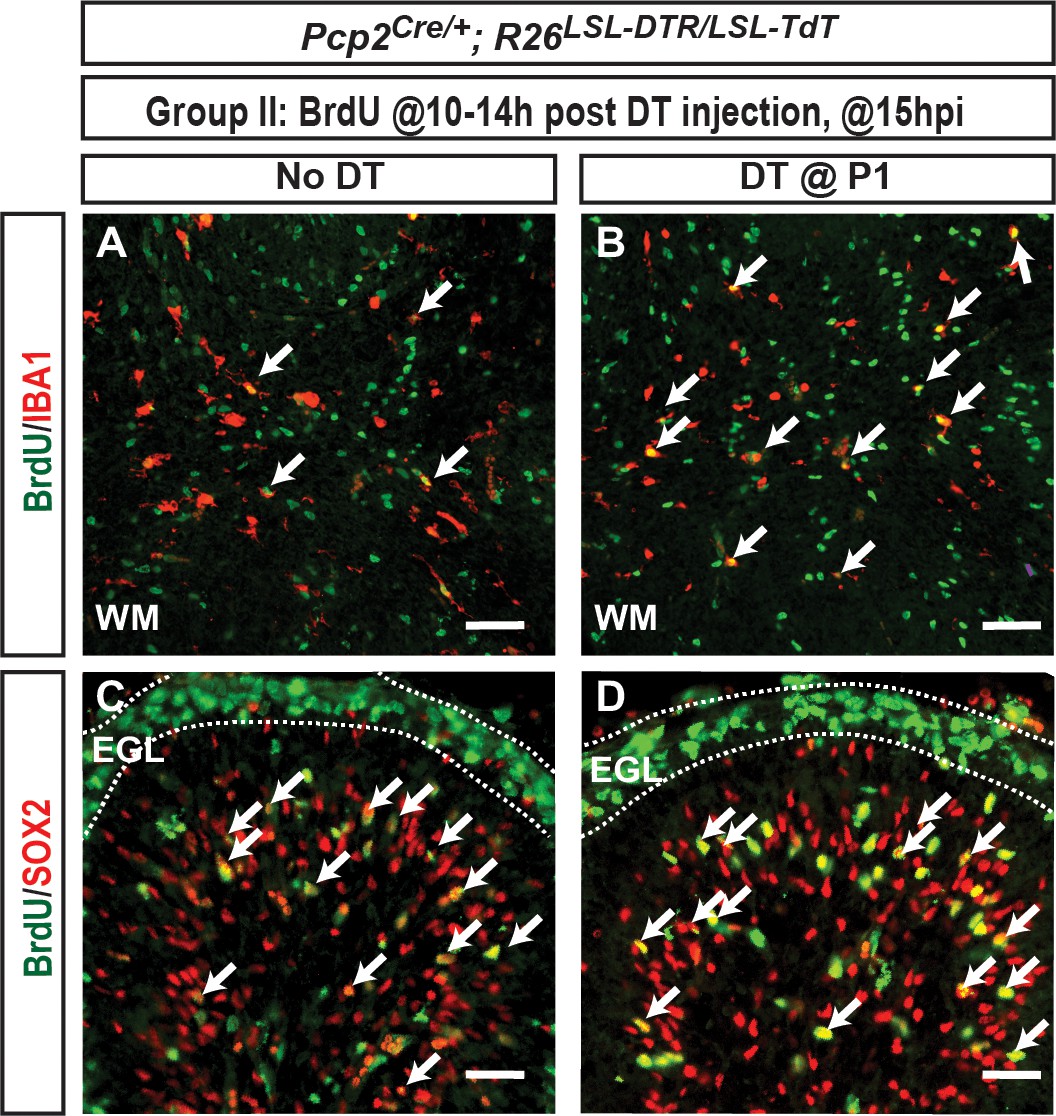
Microglia and glial progenitors proliferate in both No DT and DT P1-PC-DTR mice.
(A–D) IF analysis of BrdU+ cells shows that (A–B) IBA1+ microglia and (C–D) SOX2+ glial progenitors proliferate 15hpi (astrocytes and NEPs). Arrows show BrdU+ IBA1+ and Sox2+ cells. n = 3 animals/condition were analyzed. Scale bars: 100 μm.
Figure 3—figure supplement 5
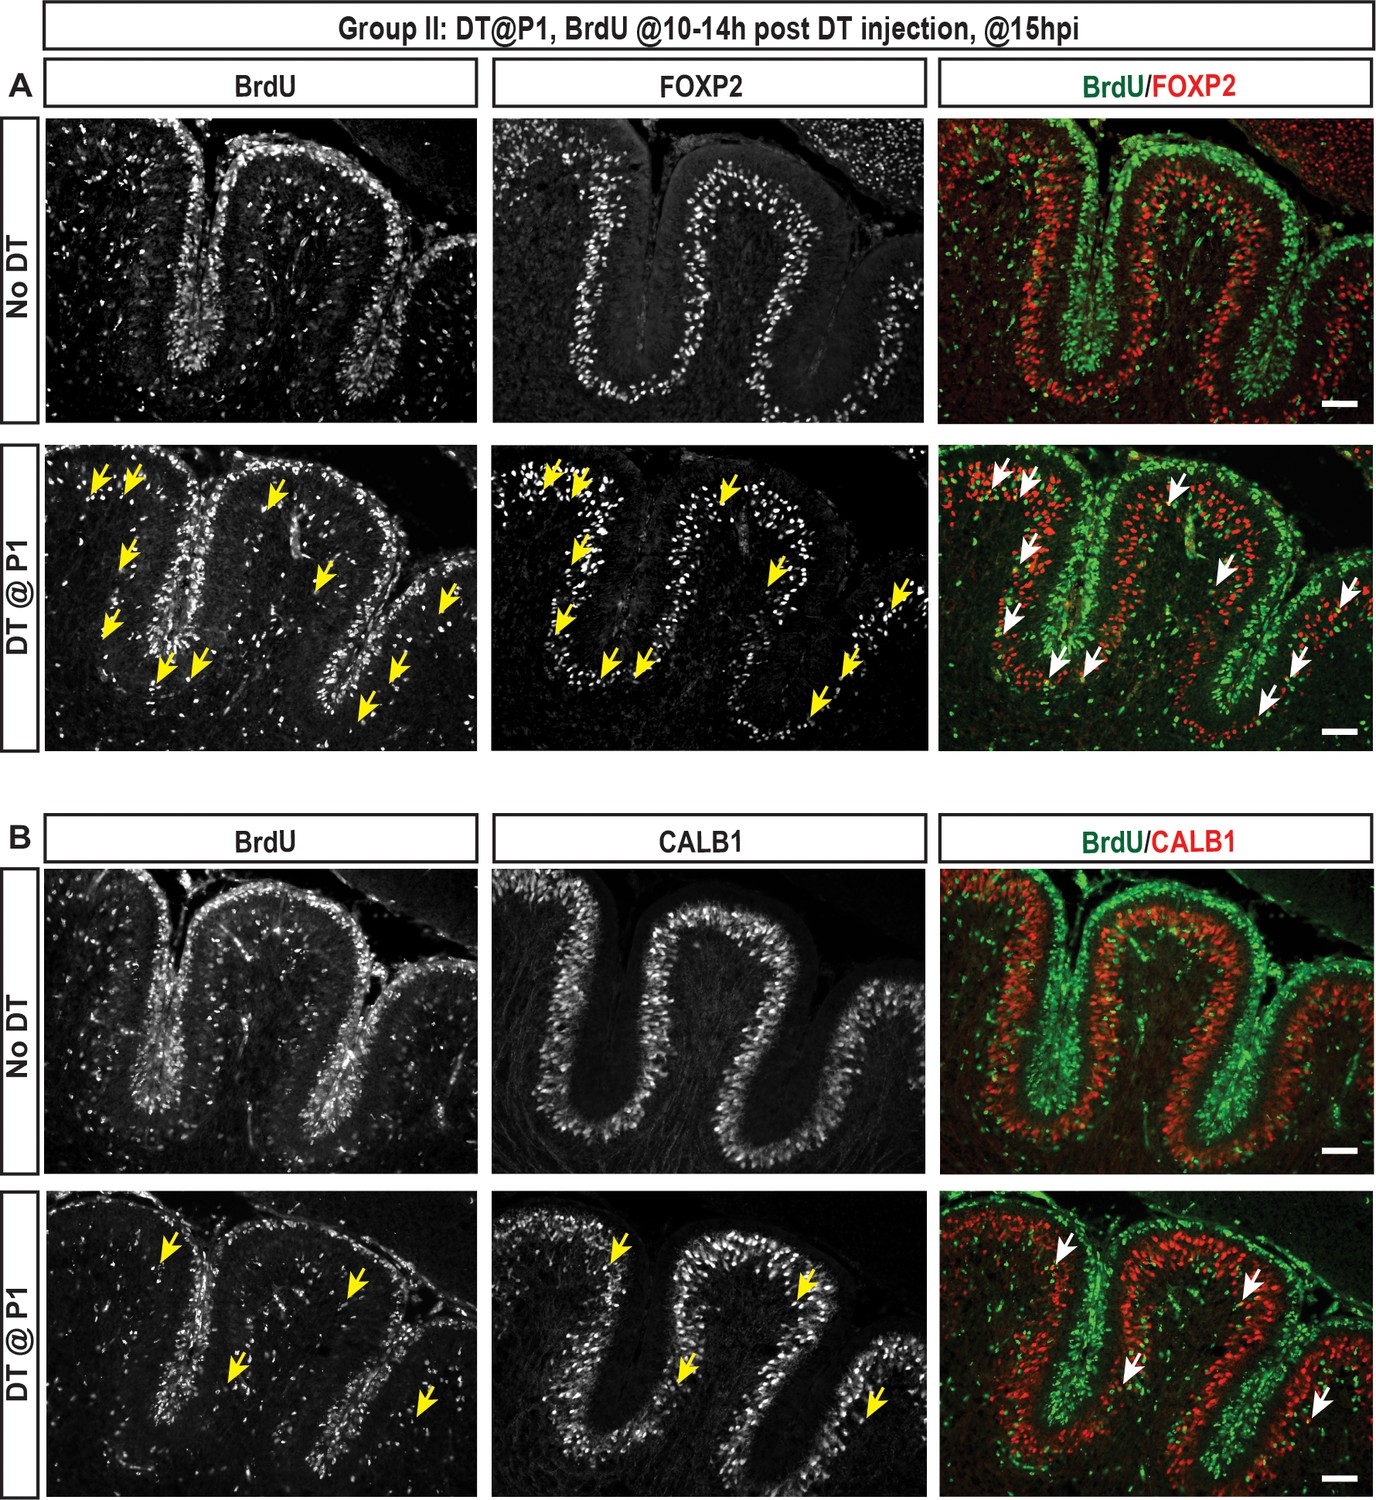
IF analysis of PCs at P1.5 (15h post DT injection at P1) shows that FoxP2+ cells proliferate and there are more FoxP2+ CALB1-/low cells that incorporate BrdU than FOXP2+ CALB1+ high cells.
(A–-B) Analysis of co-labeling for FOXP2 (A) or CALB1 (B) with BrdU (injected 10–14 hr post DT) at 15 hpi of DT shows that more FOXP2+ CALB1-/low cells incorporate BrdU upon DT injection (lower panels) in P1-PC-DTR mice, compared to FOXP2+ CALB1+ cells. Brains of No DT mice show no PCs that incorporated BrdU (top panels). n = 3 animals/condition were analyzed. Scale bars: 100 μm.
Figure 3—figure supplement 6
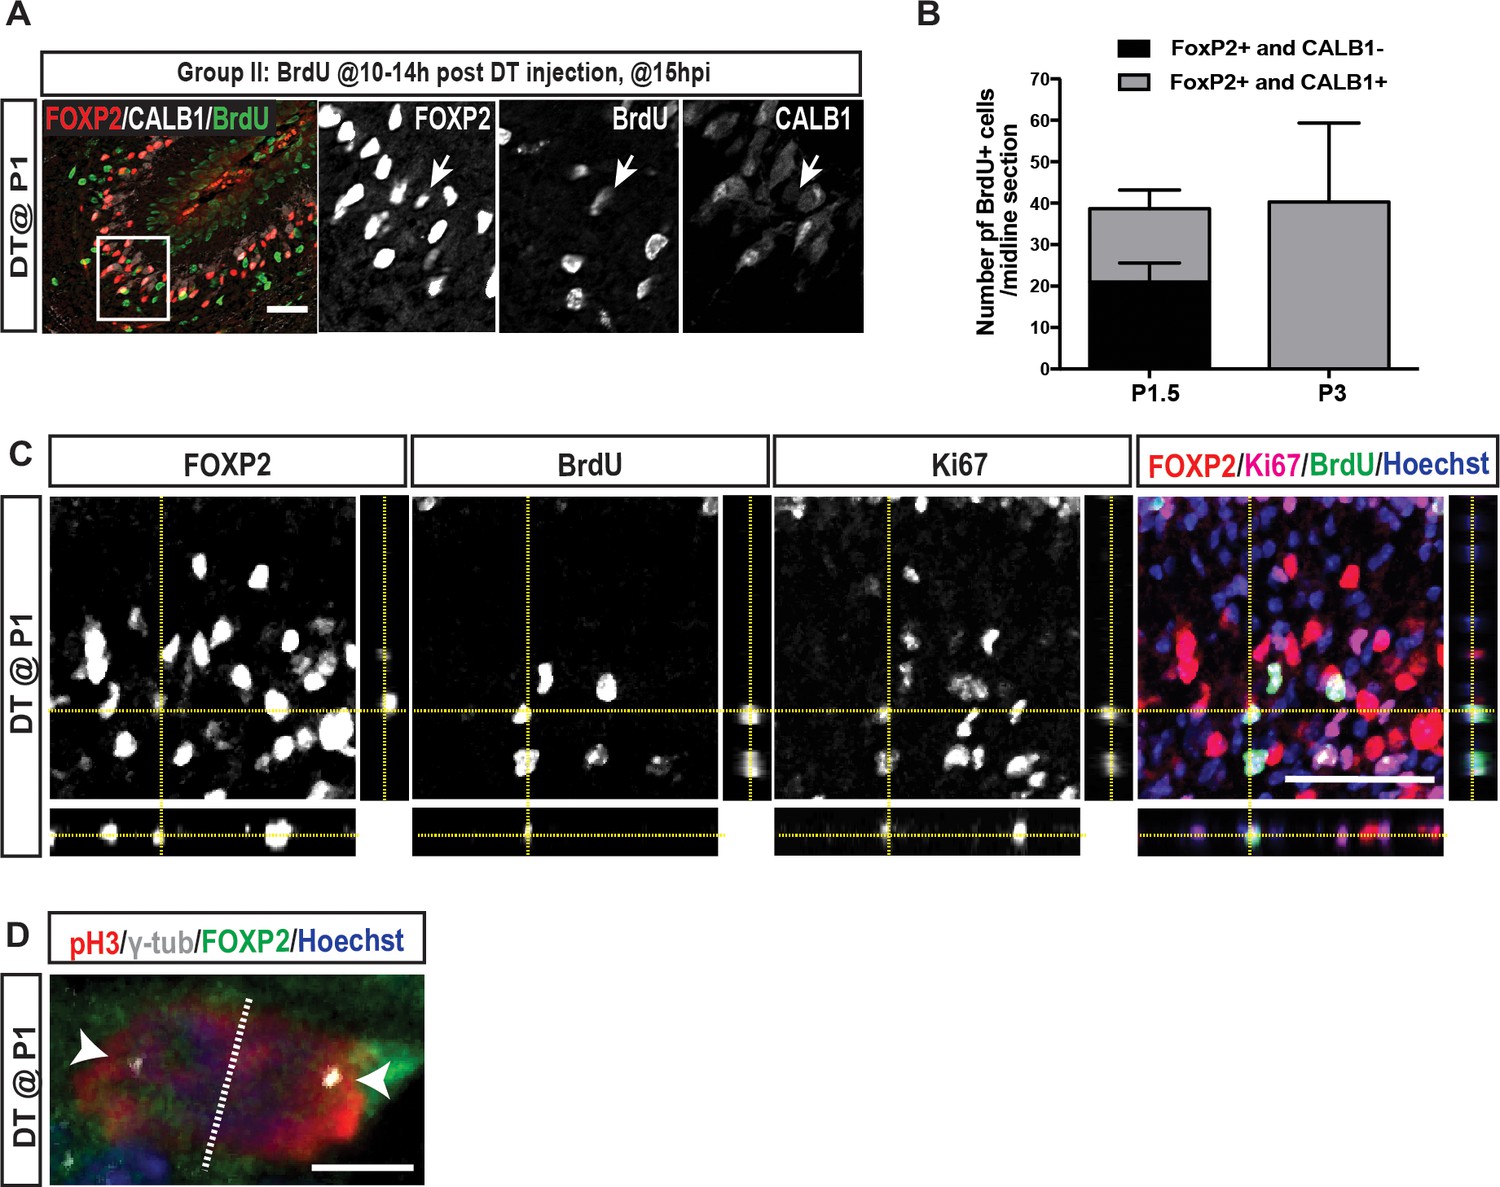
IF analysis of PCs at P1.5 (15h post DT injection at P1) shows that FOXP2+ cells proliferate (Ki67+ or pH3+) and BrdU+ FOXP2+ CALB1-/low cells can be observed at P1.5 but not at P3.
(A) Arrow indicates a BrdU+ iPC (CALB1-/low, FoxP2+) at 15 hr post injection (hpi) in P1-PC-DTR mice (n = 3). (B) Quantification of the number of BrdU+ cells that are also FOXP2+ cells and that are CALB1 positive or negative per midline sagittal section at P1.5 and at P3 (n = 3/ age). (C) Orthogonal projections of z-stack shows a BrdU+ and FOXP2+ cell that also expresses the cell cycle marker KI67. (D) An example of IF analysis of the nucleus of a pH3+ and FOXP2+ cell 15 hpi in P1-PC-DTR mice (n = 3). γ-tubulin staining is used to label the centrosomes. Note the subnuclear compartmentalization of FOXP2 and pH3 signals during proliferation. Scale bars: (A and C) 100 μm, (D) 5 μm.
Figure 3—figure supplement 7
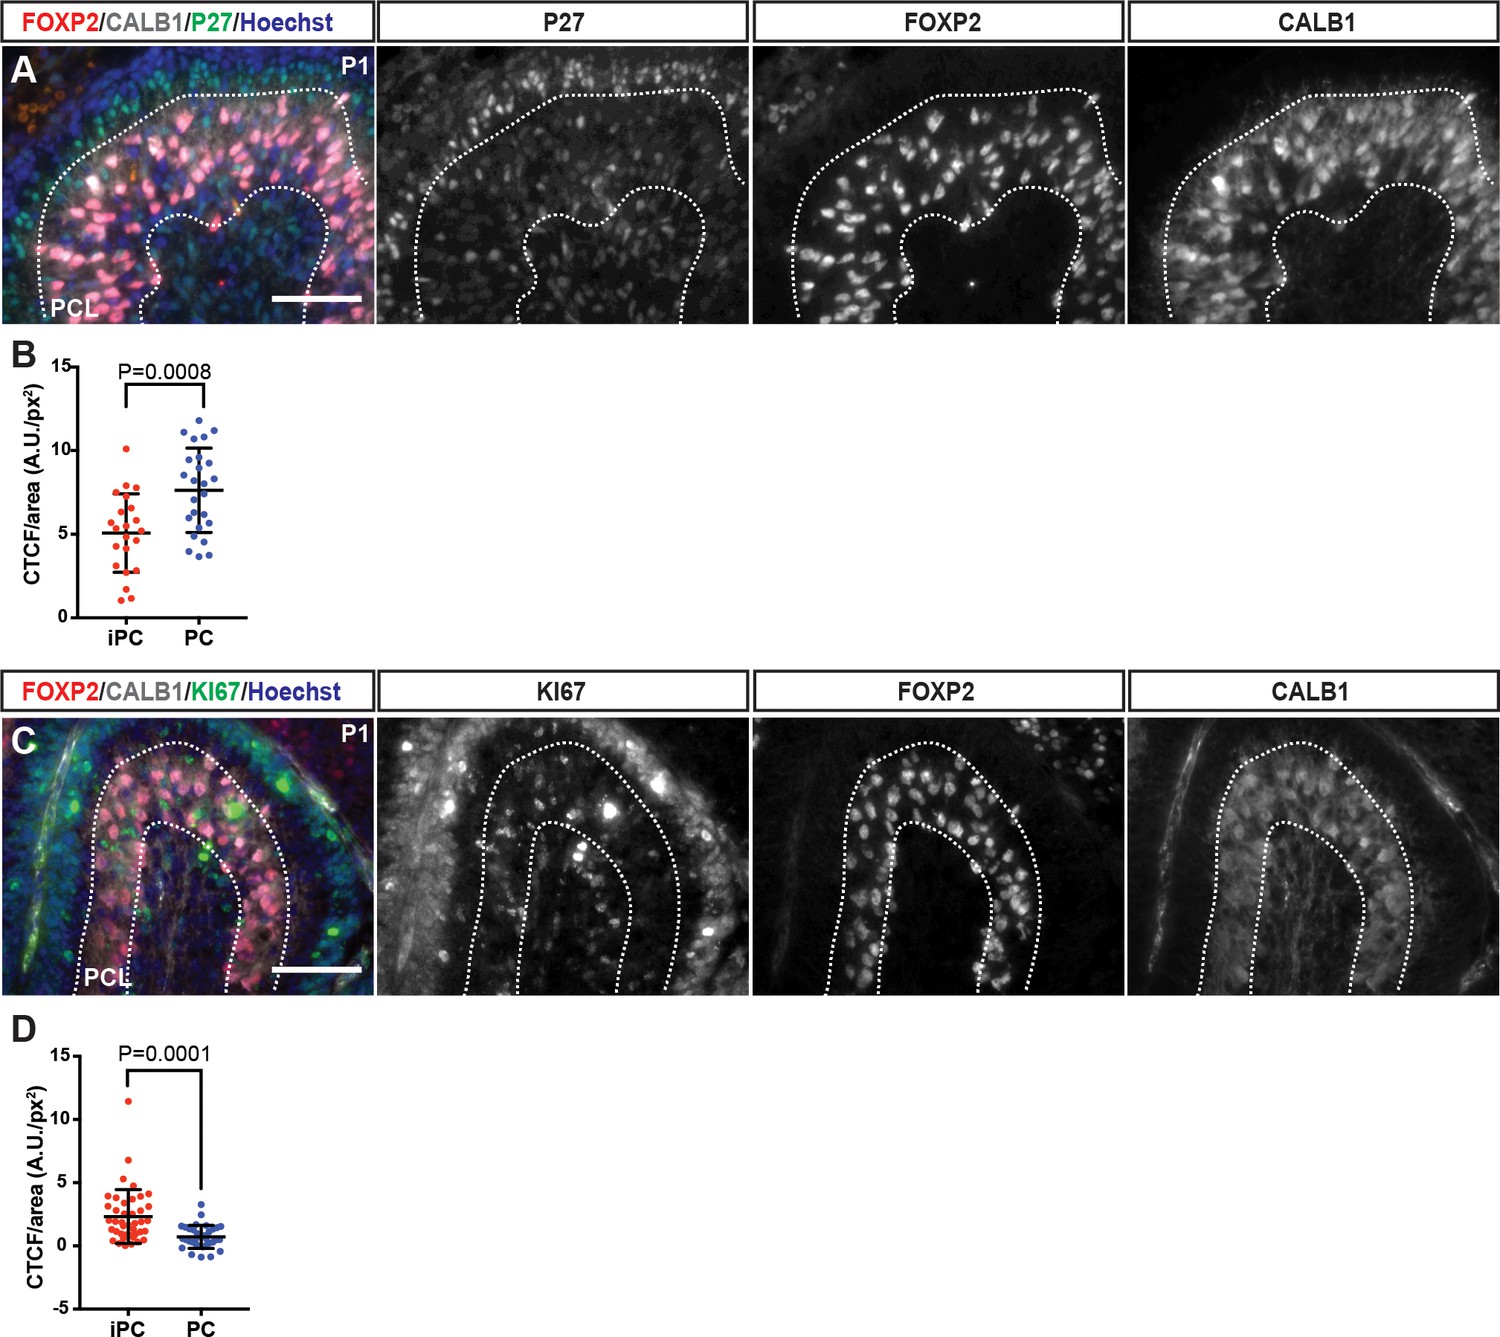
Analysis of P27 and Ki67 fluorescence intensity of iPCs and CALB1+ PCs in P1 wild type mice.
(A–D) P1 iPC or CALB1+ PC nuclei were defined as regions of interest and the marker fluorescence intensity and the nuclear area was measured and reported as corrected total cell fluorescence (CTCF)/nuclear area. (CTCF = Integrated Density – (Nuclear area X mean fluorescence of background readings). (A–B) iPCs show lower P27 levels compared to PCs (Students t-test, p=0.0008,>30 cells at three different section/n = 3 brains) (C–D) iPCs show higher KI67 levels compared to PCs (Students t-test, p=0.0001,>30 cells at three different section/n = 3 brains). Scale bars: 100 μm.
Figure 3—video 1
Three-dimensional projection of a z-stack from the PCL of a P1 CB showing FoxP2+ CALB1 low/- iPCs.
Arrow heads indicate iPCs (FOXP2+ and CALB1low/-) distributed alongside PCs in the PCL.
Figure 4 with 5 supplements
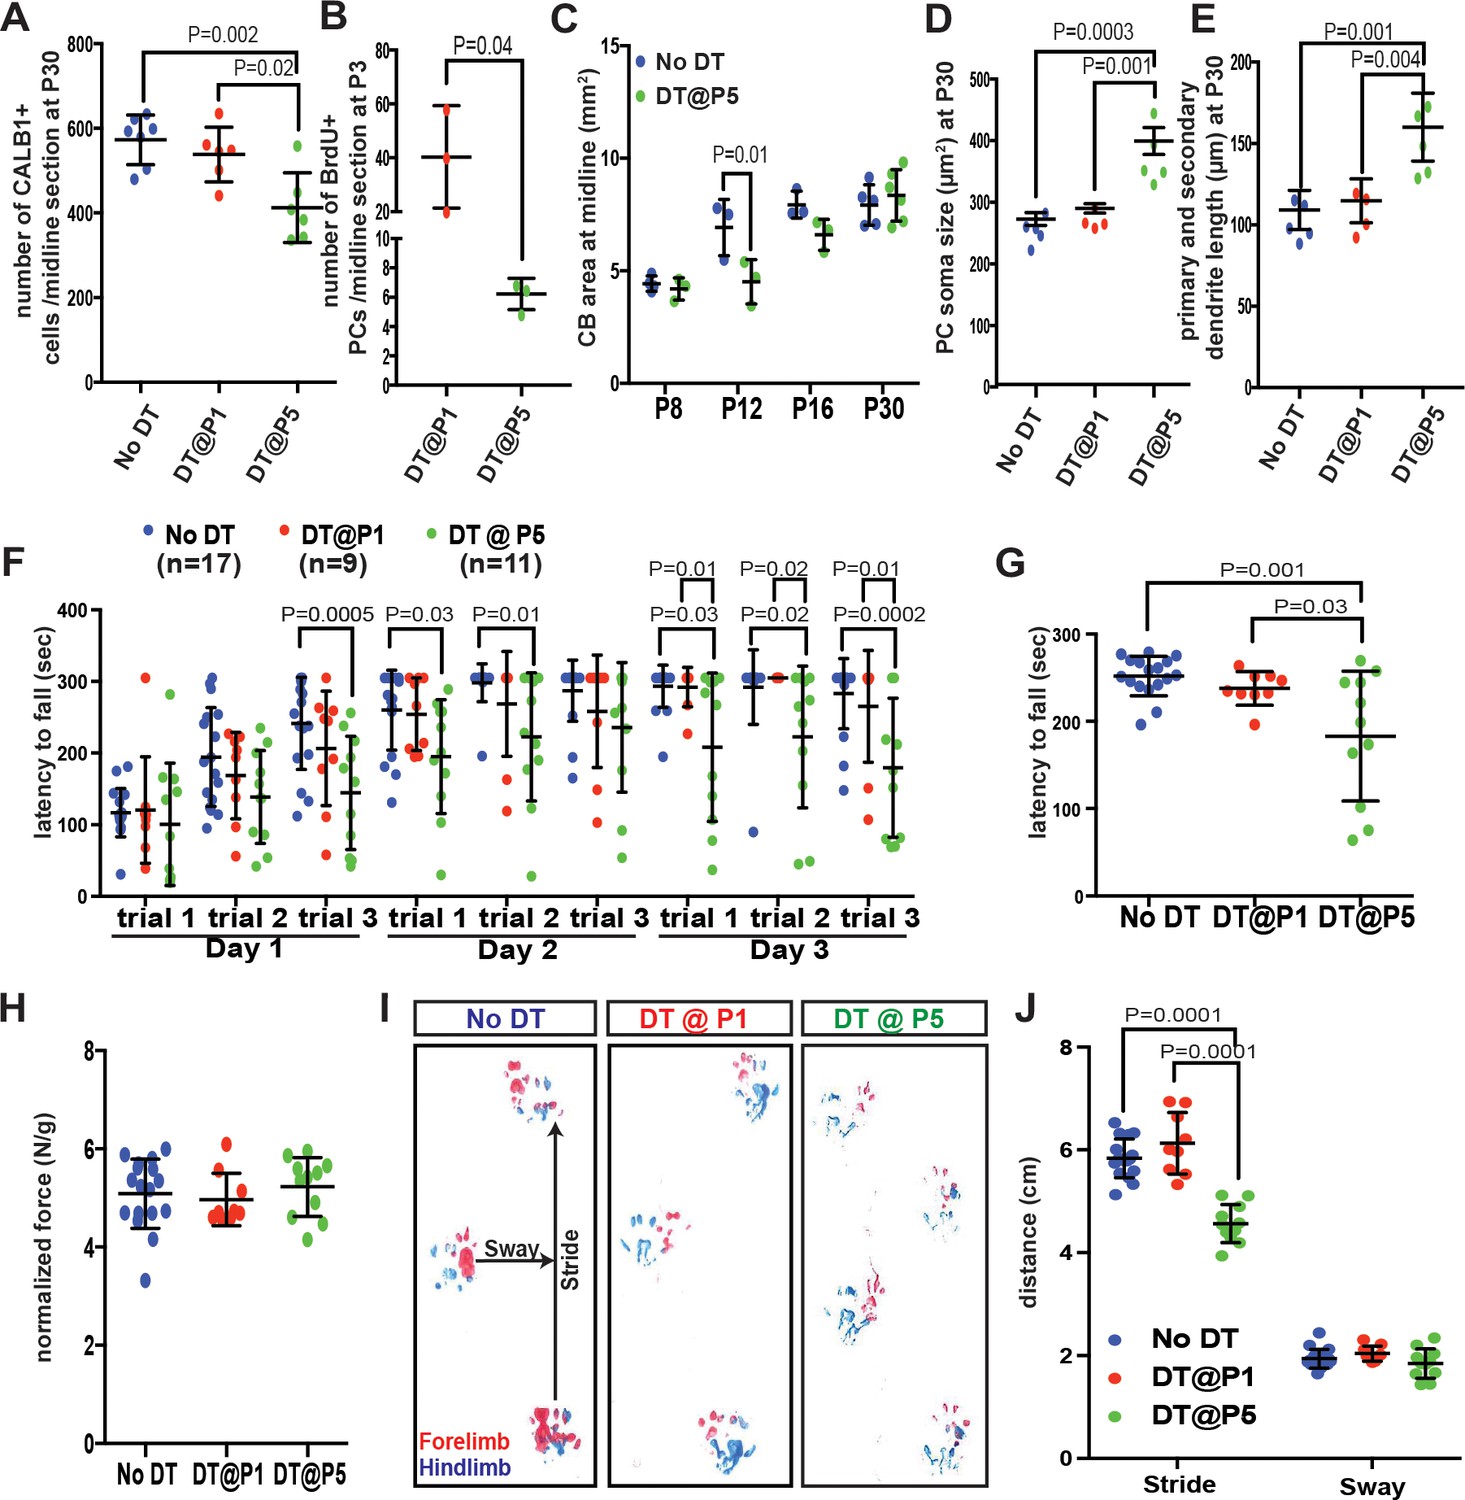
Despite the recovery of CB size, PCs are poorly replenished and motor behavior deficits develop when PCs are killed at P5 but not at P1.
(A) Number of CALB1+ cells at P30 (One-way ANOVA, F(2,16)=9.464, p=0.002, n ≥ 6). (B) Number of BrdU+ PCs 2 days post DT-injection in P1- or P5-PC-DTR mice (Two-tailed t-test, p=0.04). (C). Quantification of CB area in midline sagittal sections demonstrates that CB size is smaller at P12 in P5-PC-DTR mice but not later (Two-way ANOVA, F(1,22)=7.045, p=0.01, n ≥ 3). (D–E) PC soma size (D, One-way ANOVA, F(2.11) = 20.56, p=0.0002, n ≥ 4) and primary and secondary dendrite lengths (E, One-way ANOVA, F(2,11)=14.54, p=0.0008, n ≥ 4) at P30 were increased in P5-PC-DTR animals compared to No DT and P1-PC-DTR animals. (F–G) Latency to fall from rotarod at each trial (F, Two-way ANOVA, F(2,34)=8.37, p=0.001, n ≥ 9) and cumulative analysis (G, One-way ANOVA, F(2,34)=11.12, p=0.0002, n ≥ 9, No DT vs. DT@P1: p=0.83) for P30 P5-PC-DTR animals compared to No DT and P1-PC-DTR animals. (H) Analysis of grip strength showed no change in P1 (n = 9, vs No DT: p=0.89) and P5 (n = 11, vs. No DT: p=0.84, vs. DT@P1: p=0.64) DT-injected mice compared to controls (No DT, n = 17). (I–J) Representative images (I) and quantification (J) of footprint analysis performed on P1- (vs. No DT: stride: p=0.10 and sway: p=0.90) and P5-PC-DTR mice and controls (Two-way ANOVA, F(2,133)=73.45, p=0.0001, n ≥ 9). Significant post hoc comparisons are shown.
Figure 4—figure supplement 1
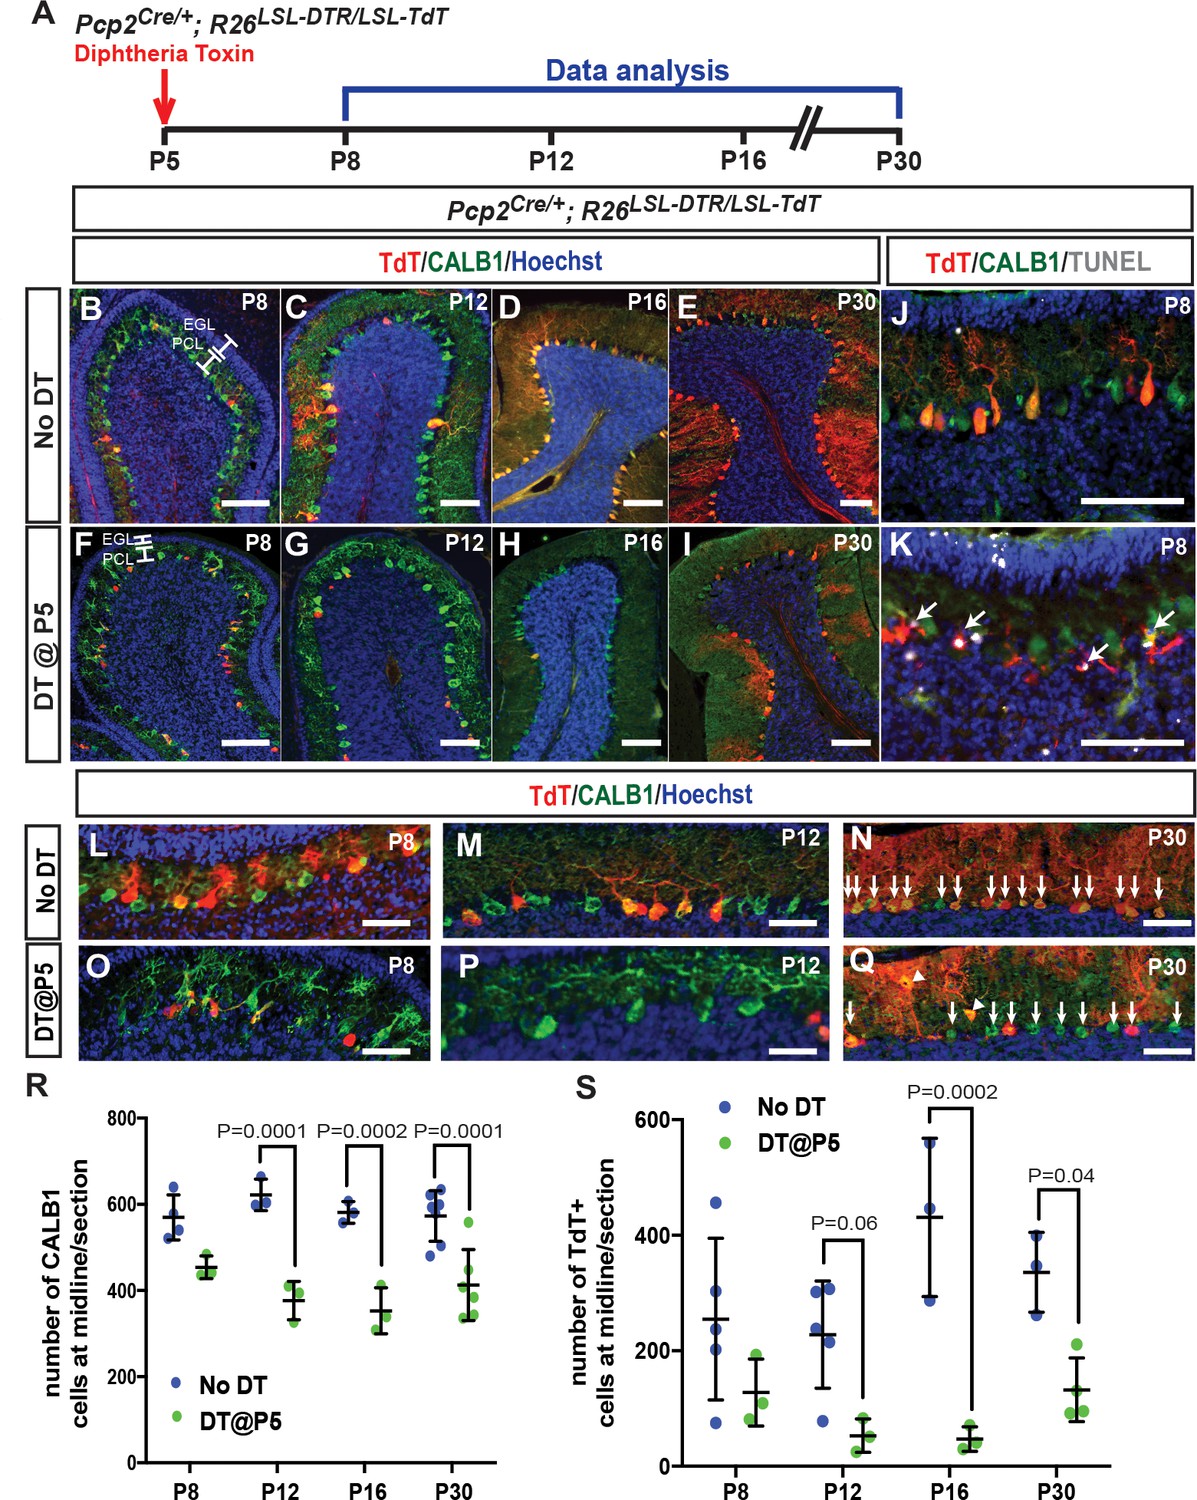
PC numbers are reduced upon PC ablation at P5 in PC-DTR mice.
(A) Schematic representation of the experimental plan. (B-I). IF analysis of PCs upon ablation at P5 (F, G, H, I) reveals lack of full recovery of PC numbers in mouse mice. (J-K) Analysis of apoptosis by TUNEL reveals TUNEL+ TdT cells (arrows) in the PCL of P5-PC-DTR mice (K) but not is No DT mice (J) at P8. (L-Q) Higher magnification of PCs from P8, P12 and P30 P5-PC-DTR animals and No DT controls reveal that P5-PC-DTR mice have disrupted PC morphology at P8 and P12. Arrows show PCs. Arrowheads indicate ectopic PCs at P30. (R) Quantification of CALB1+ cells shows that PC numbers do not recover in most animals from ablation of PCs at P5 (Two-way ANOVA, F(1,24)=77.85, p=0.0001, n ≥ 3). (S) Quantification of the number of TdT+ cells, shows a large variation in recombination efficiency in No DT brains, and an initial decrease in TdT+ cells after DT injection at P5 (Two-way ANOVA, F(1,21)=40.17, p=0.0001, n ≥ 3). At P30, P5-PC-DTR brains show a decrease in the number of TdT+ cells compared to No DT animals (t-test, p=0.03, n ≥ 4), similar to P1-PC-DTR animals (Figure 1q). Significant post hoc comparisons are shown. EGL: External granule layer, PCL: Purkinje cell layer. Scale bars: a-k: 100 μm, l-q: 50 μm.
Figure 4—figure supplement 2
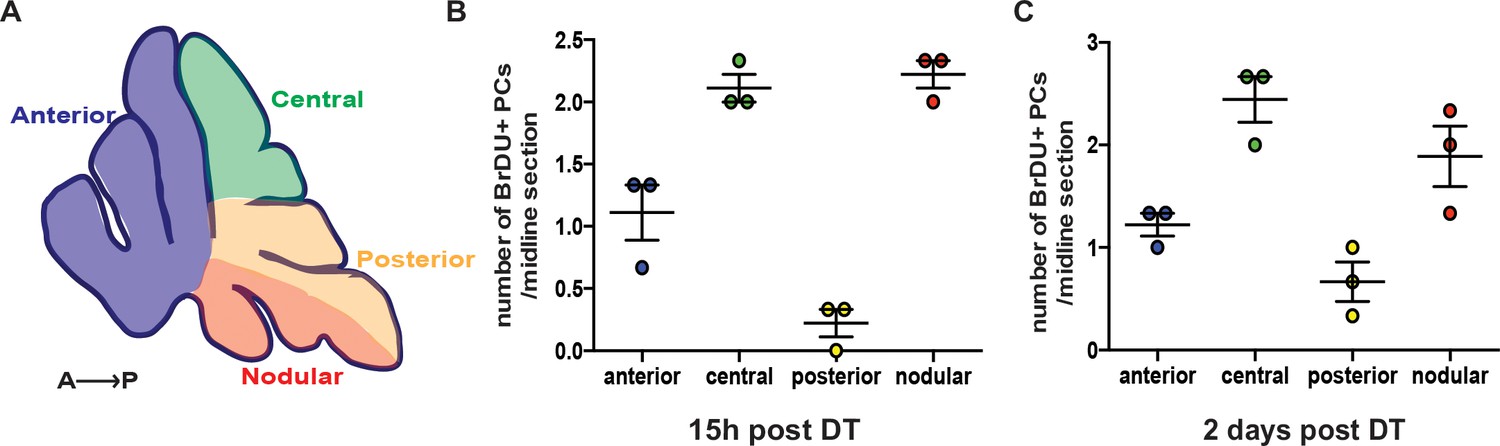
Distribution of BrdU+ PCs in P5-PC-DTR mice at 15 hr and 2 days post injection of DT.
(A) Schematic showing the different zones of the CB in a P5 sagittal midline section. (B-C) Distribution of BrdU+ PCs across different zones analyzed 15 hr (B) and 2 days (C) after DT injection in P5-PC-DTR animals reveals that incorporation of BrdU is limited, and most of the cells reside in the central and the nodular zones (n = 3/ condition). No BrdU incorporation was detected in No DT mice at the same ages.
Figure 4—figure supplement 3
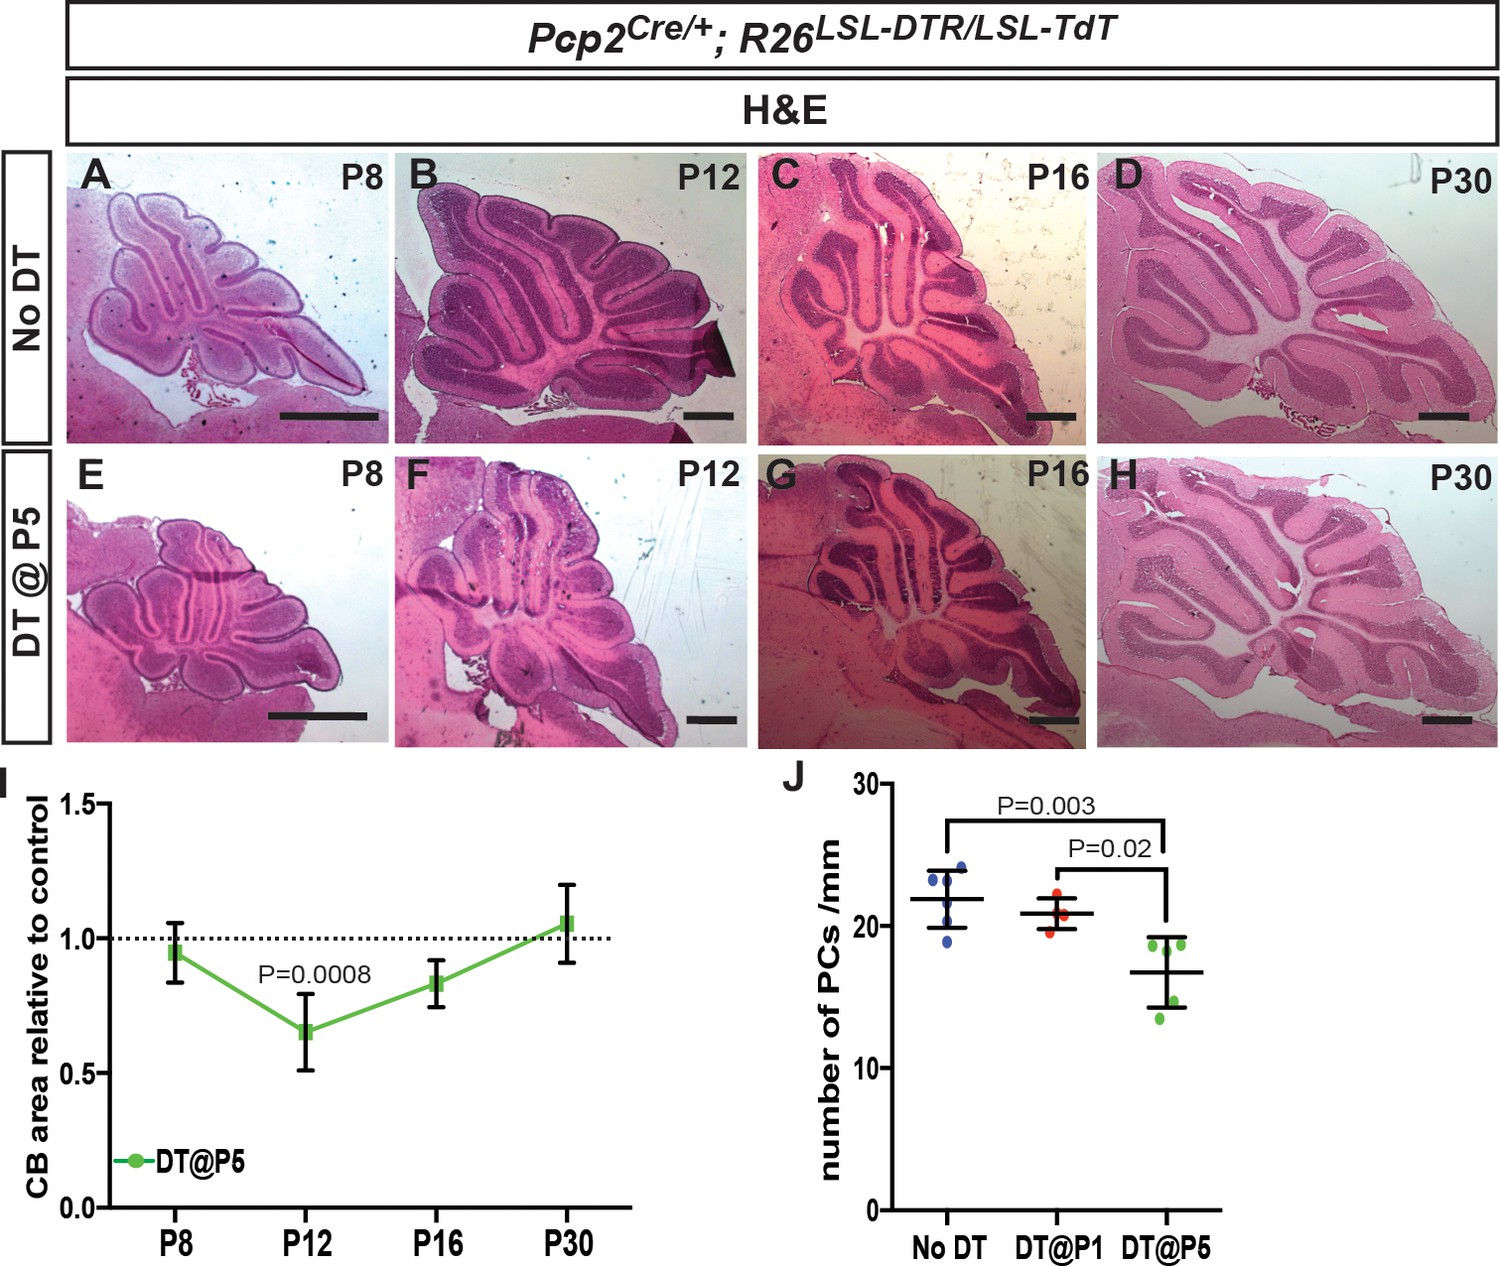
Transient decrease in CB size and altered PC morphology after ablation of PCs at P5.
(A-H) H and E staining shows that the area of the CB (sagittal sections) is reduced at P12 after DT injection in P5-PC-DTR mice compared to No DT (F compared to B), but no significant difference in area is seen at P16 and P30. (I) Quantification of CB area in midline sagittal sections demonstrates that CB size is smaller only at P12 (Two-way ANOVA, F(1,22)=7.799, p=0.01, n ≥ 3). (J) The density of PCs is reduced at P30 in P5-PC-DTR but not in P1-PC-DTR animals, correlating with poor recovery of PC numbers in P5-PC-DTR mice (One-way ANOVA, F(2,12)=9.687, p=0.003, n ≥ 4). Significant post hoc comparisons are shown. Scale bars: 500 μm.
Figure 4—figure supplement 4
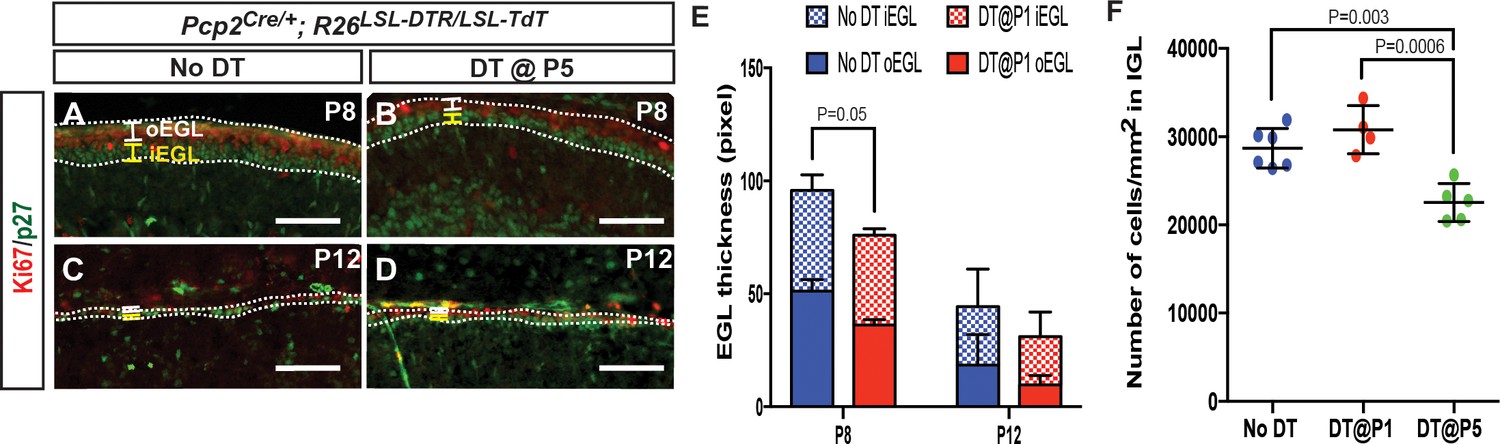
Transient decrease in external granule cell layer thickness after DT injection at P5.
(A-D) IF analysis of Ki67 (outer EGL, oEGL) and p27 (inner EGL, iEGL) in No DT (A, C) and P5-PC-DTR (B, D) mice. (E) Quantification shows that both the oEGL and iEGL thicknesses (area/length) are significantly reduced at P8 (Two-tailed t-test, p=0.05, n = 3), but not at P12 in P5-PC-DTR mice. (F) Likely as a consequence of the thinner EGL at P8 in in P5-PC-DTR mice, granule cell density in the internal granule cell layer (IGL) is reduced in P5-PC-DTR animals, but not in No DT and P1-PC-DTR animals at P30 (One-way ANOVA, F(2,12)=15.73, p=0.0004, n ≥ 4). Significant post hoc comparisons are shown. Scale bars: 100 μm.
Figure 4—figure supplement 5
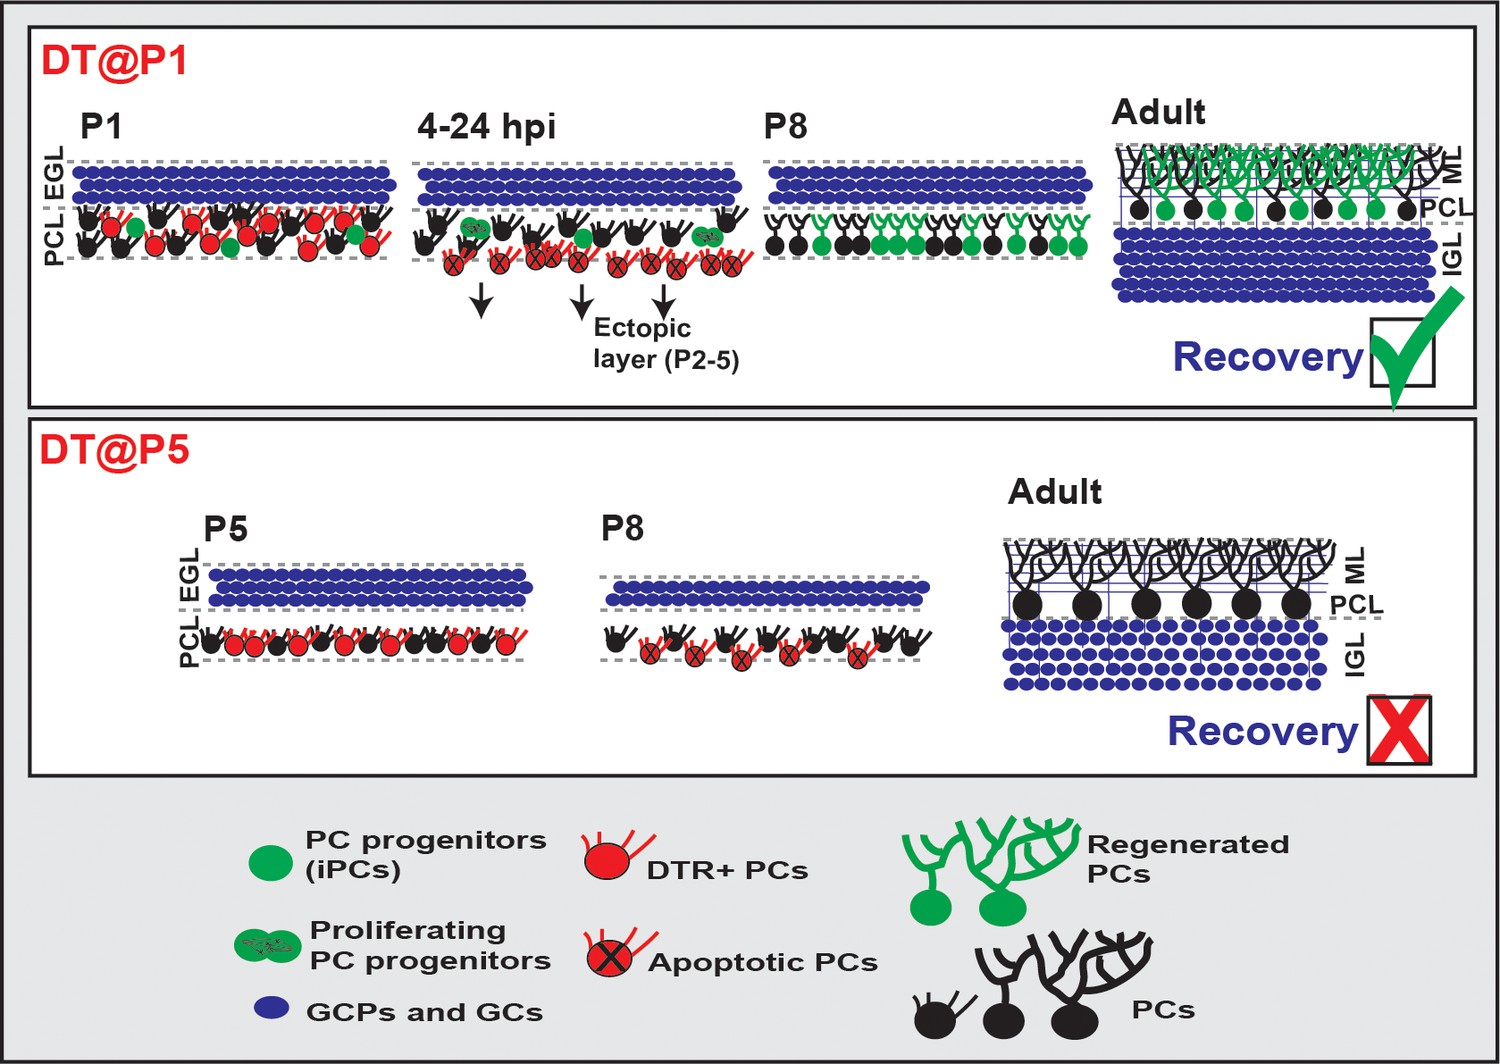
Graphical summary of the findings.
iPCs: CALB1 negative/low and FoxP2-expressing progenitors that are immature PCs, EGL: external granule cell layer, PCL: Purkinje cell layer, ML: Molecular Layer, GCP: granule cell progenitors, GC: granule cells.
Author response image 1

Soma size determination by quantifying thick and thin histological sections gave similar results.
https://doi.org/10.7554/eLife.39879.032Additional files
-
Transparent reporting form
- https://doi.org/10.7554/eLife.39879.030
Download links
A two-part list of links to download the article, or parts of the article, in various formats.
Downloads (link to download the article as PDF)
Open citations (links to open the citations from this article in various online reference manager services)
Cite this article (links to download the citations from this article in formats compatible with various reference manager tools)
Age-dependent dormant resident progenitors are stimulated by injury to regenerate Purkinje neurons
eLife 7:e39879.
https://doi.org/10.7554/eLife.39879


