Tuning of delta-protocadherin adhesion through combinatorial diversity
- Cornell University, United States
- The University of Sydney, Australia
- Fitchburg State University, United States
Figures
Figure 1 with 1 supplement

Combinatorial expression of δ-Pcdhs in mouse olfactory sensory neurons (OSNs).
(A) Representative image of a double label RNA in situ hybridization with Pcdh19 (red) and Pcdh10 (green) in E17.5 olfactory epithelium. Both probes are co-expressed in a subset of neurons (arrowhead). Scale bar, 50 μm. (B) Heat map showing the percentage of co-expression among δ-Pcdhs and OSNs expressing one of five different odorant receptors. The color intensity indicates the percent of co-expression for any one δ-Pcdh with a given receptor. (C) Representative confocal images of Olfr124 positive OSNs co-expressed with Pcdh1 (top row) but not Pcdh10 (bottom row). Arrowhead indicates location of Olfr124 positive OSN. Scale bar, 50 μm. (D) Heat map of log2 transformed NanoString counts. (E) Constrained gamma-normal mixture modeling analysis shows individual, randomly selected OSNs express zero to seven δ-Pcdhs. (F) qRT-PCR of randomly selected single OSNs shows a mosaic pattern of δ-Pcdh expression similar to the NanoString data.
-
Figure 1 —source data 1
NanoString codeset and primer sequences.
- https://doi.org/10.7554/eLife.41050.005
-
Figure 1 —source data 2
NanoString nCounter data.
- https://doi.org/10.7554/eLife.41050.006
Figure 1—figure supplement 1
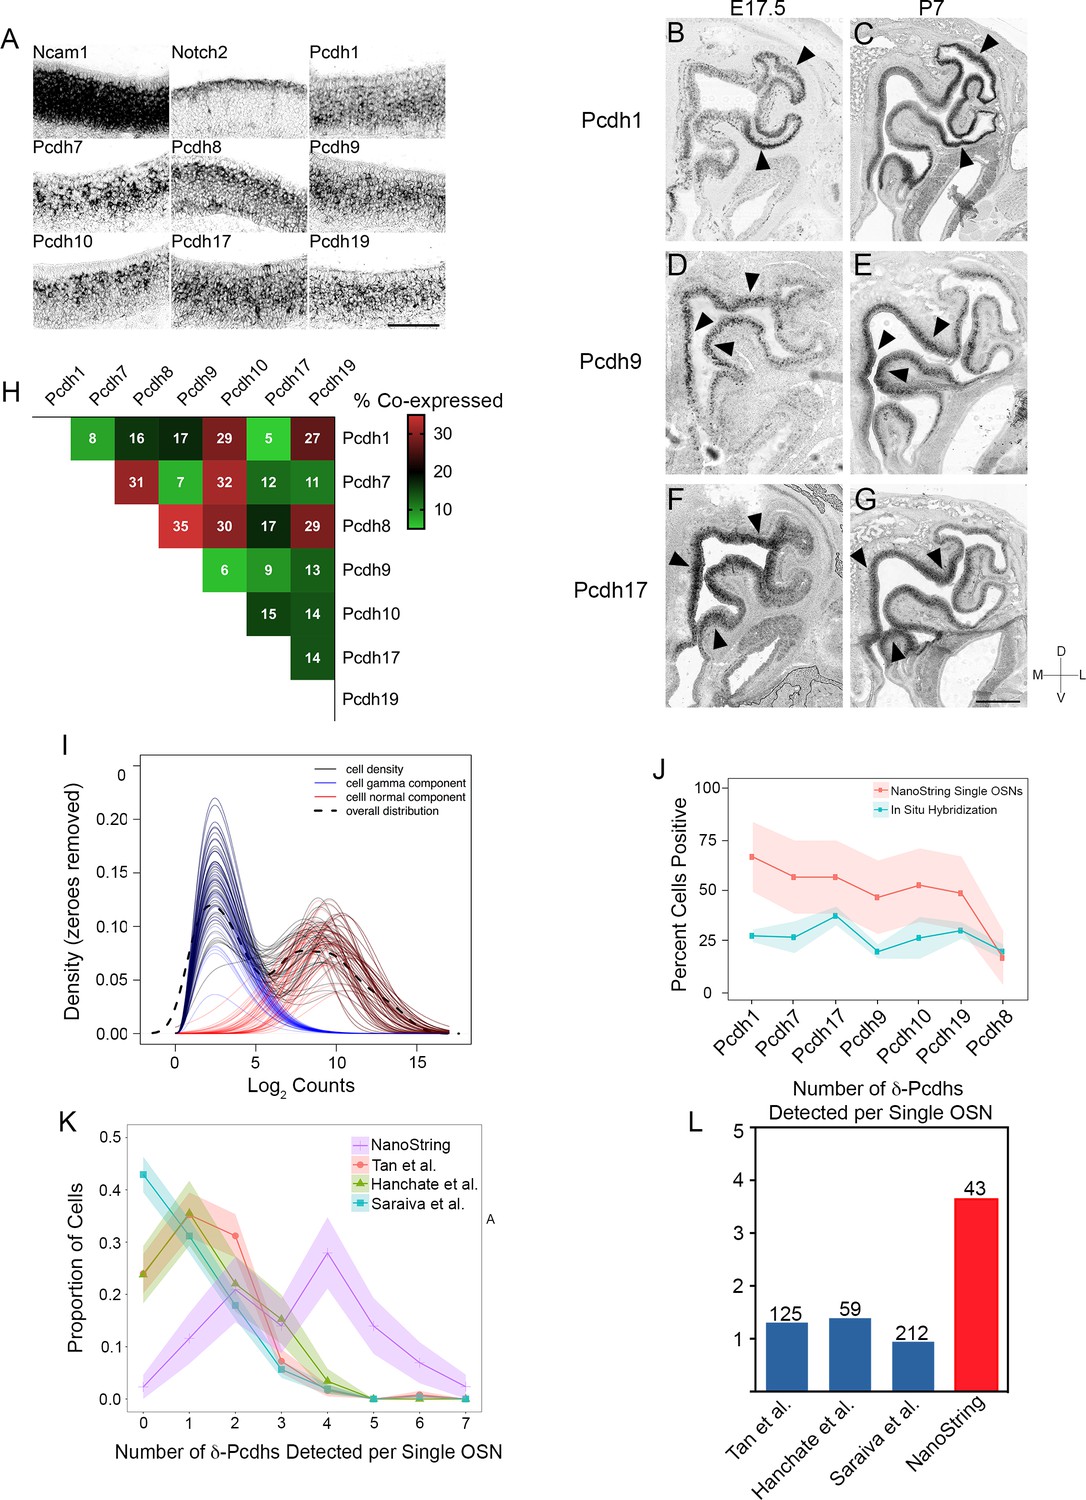
Expression of δ-Pcdhs in OSNs.
(A) Single color RNA in situ hybridization of Ncam1 (a marker of OSNs), Notch2 (a marker of non-neuronal sustentacular cells), and δ-Pcdhs in P7 olfactory epithelium. Note punctate expression of δ-Pcdhs. Scale bar, 100 μm. Pcdh11x and Pcdh18 could not be detected. (B–G) Single color RNA in situ hybridization of Pcdh1, Pcdh9, and Pcdh17 in E17.5 (B,D,F) and P7 (C,E,G) olfactory epithelia. Arrowheads indicate areas of enriched regional expression. Scale bar, 400 μm for (B,D,F) and 500 μm (for C,E,G). (H) Confocal analysis of a round robin double label RNA in situ hybridization series from E17.5 olfactory epithelia. Values indicate percent overlap in OSNs for any given pair. Pcdh11x and Pcdh18 could not be detected with this approach. (I) Constrained gamma-normal mixture modeling was used to determine if expression of a given gene was ‘on’ or ‘off’ within a given cell. Each line represents a density plot from the model for a single cell. Blue curves represent the lowly expressed component (e.g. ‘off’), which was allowed to vary in relative proportion but with constant mean and variance parameters. Red curves represent the highly expressed component (e.g. ‘on’) as a normal distribution with variable mean and variance parameters. The dashed curve represents the sample density of all cells across all genes. (J) Ribbon plot comparing percentage of OSNs expressing a given δ-Pcdh as determined by NanoString (red line) and quantification of RNA in situ hybridization signal (blue line). Similar trends were observed for both methods, suggesting enzymatic dissociation during OSN isolation did not greatly alter δ-Pcdh expression. Shaded regions represent 95% CI. (K) Ribbon plot comparing δ-Pcdh expression in single OSNs as detected by NanoString and three different single OSN RNA-seq studies. Data from RNA-seq studies were re-analyzed using the constrained gamma-normal mixture modeling approach. Cells were first filtered based on positive gene expression of Ncam1 to parallel the selection of Ncam1 positive OSNs used in this study. The three single OSN RNA-seq studies follow similar distributions, with the majority of OSNs expressing zero or one δ-Pcdh. In contrast, the NanoString dataset detects more δ-Pcdhs per cell. Ribbons represent standard deviation following repeated bootstrapping of samples. (L) Mean number of δ-Pcdhs per OSN from single cell RNA-seq datasets and NanoString. Numbers above bars represent the number of Ncam1 positive cells in each study.
Figure 2 with 1 supplement
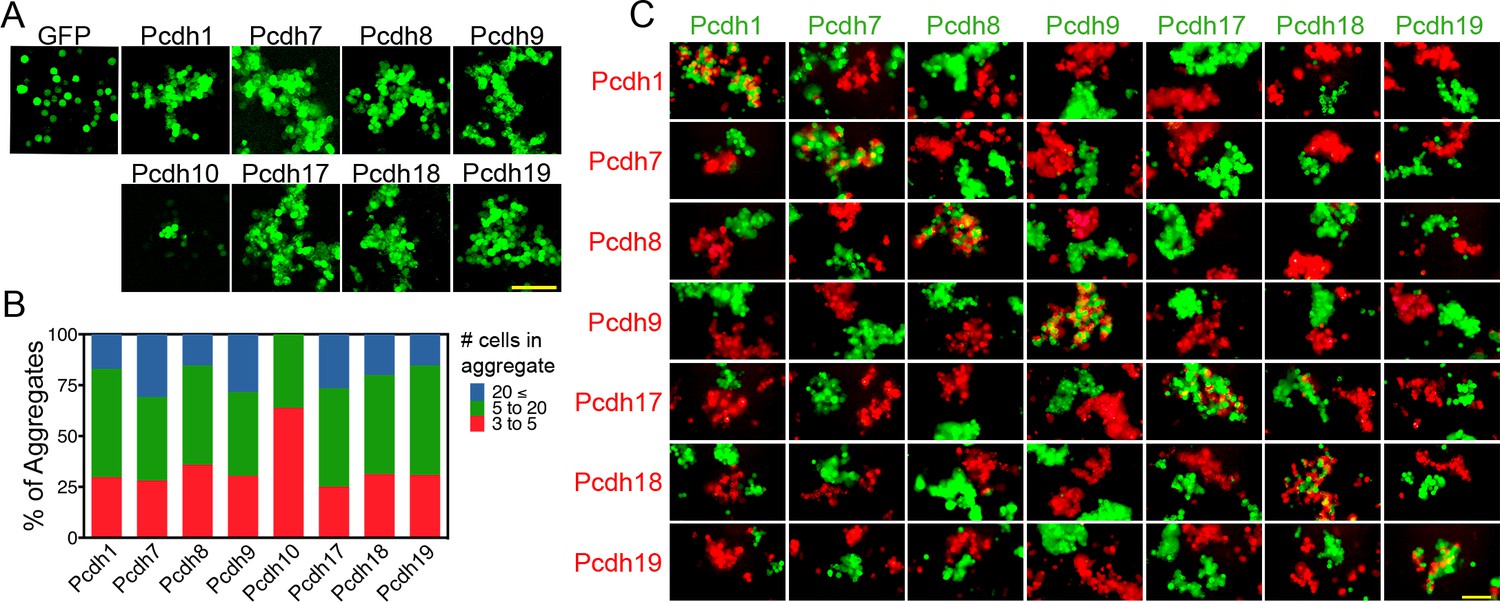
δ-Pcdhs mediate homophilic aggregation.
(A) Aggregates formed by ECTM constructs tagged with P2A-GFP. Pcdh11x could not be expressed. Scale bar, 100 μm. (B) Distribution of aggregate sizes after titrating DNA input. Results for each δ-Pcdh were determined from three independent electroporations. Pcdh10 aggregate size could not be increased by varying DNA input. (C) Pair wise analysis of δ-Pcdh binding specificity. Only pairs expressing the same δ-Pcdh coaggregated (diagonal), while cells expressing different δ-Pcdhs segregated. Results for each pair were determined from two independent electroporations. Scale bar, 100 μm.
Figure 2—figure supplement 1
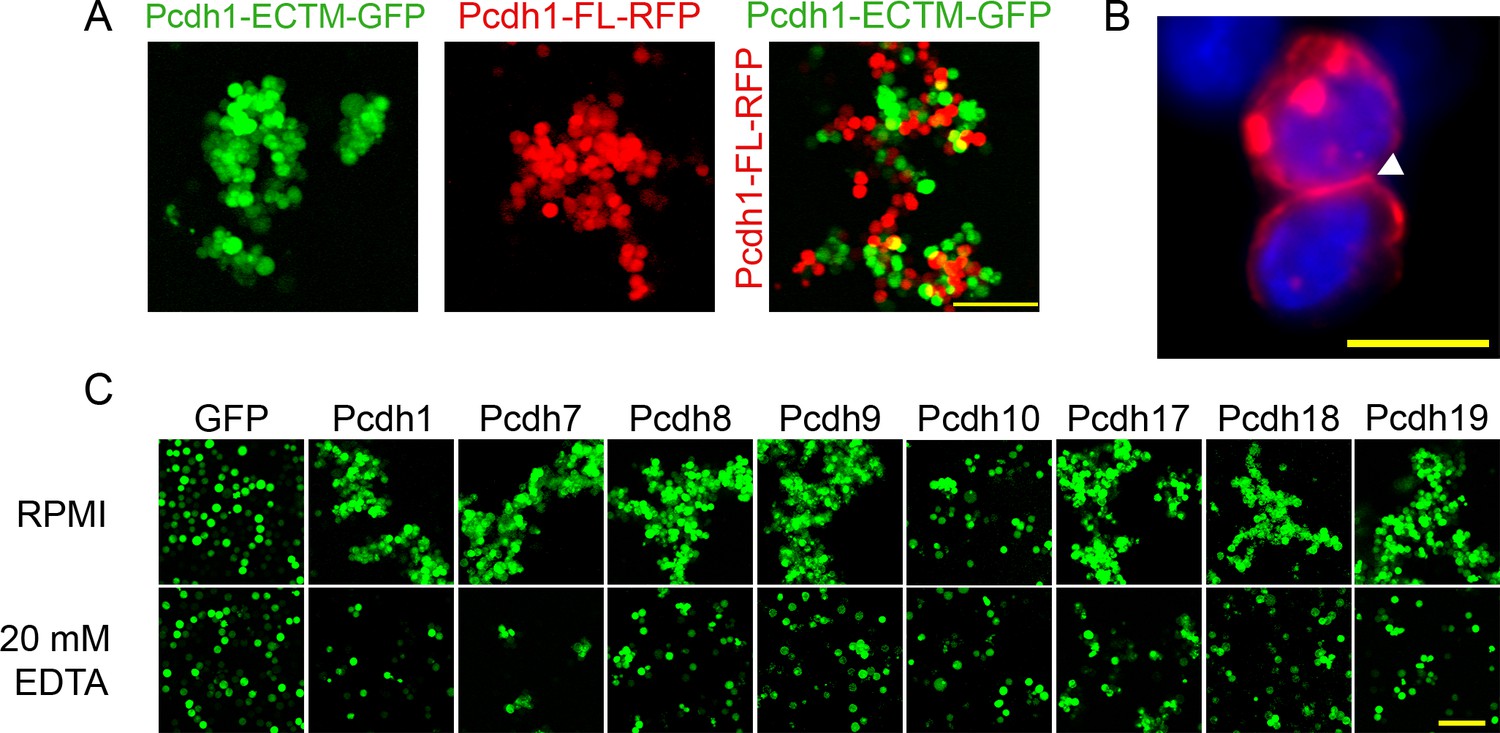
δ-Pcdh homophilic aggregation does not require an intracellular domain and is sensitive to EDTA.
(A) Representative images of aggregates induced by a Pcdh1 ECTM construct (left) and a full length Pcdh1 construct (middle). The two populations coaggregated when mixed (right), demonstrating the intracellular domain is not required for homophilic recognition and adhesion. Scale bar, 100 μm. (B) δ-Pcdhs are localized at sites of intercellular adhesion (arrowhead). K562 cells expressing Pcdh7-RFP were fixed and stained with DAPI prior to imaging. Scale bar, 10 μm. (C) δ-Pcdh aggregation is severely disrupted by the presence of 20 μM EDTA, although some δ-Pcdhs still maintained small aggregates (e.g. Pcdh8 and Pcdh17). Scale bar, 100 μm.
Figure 3
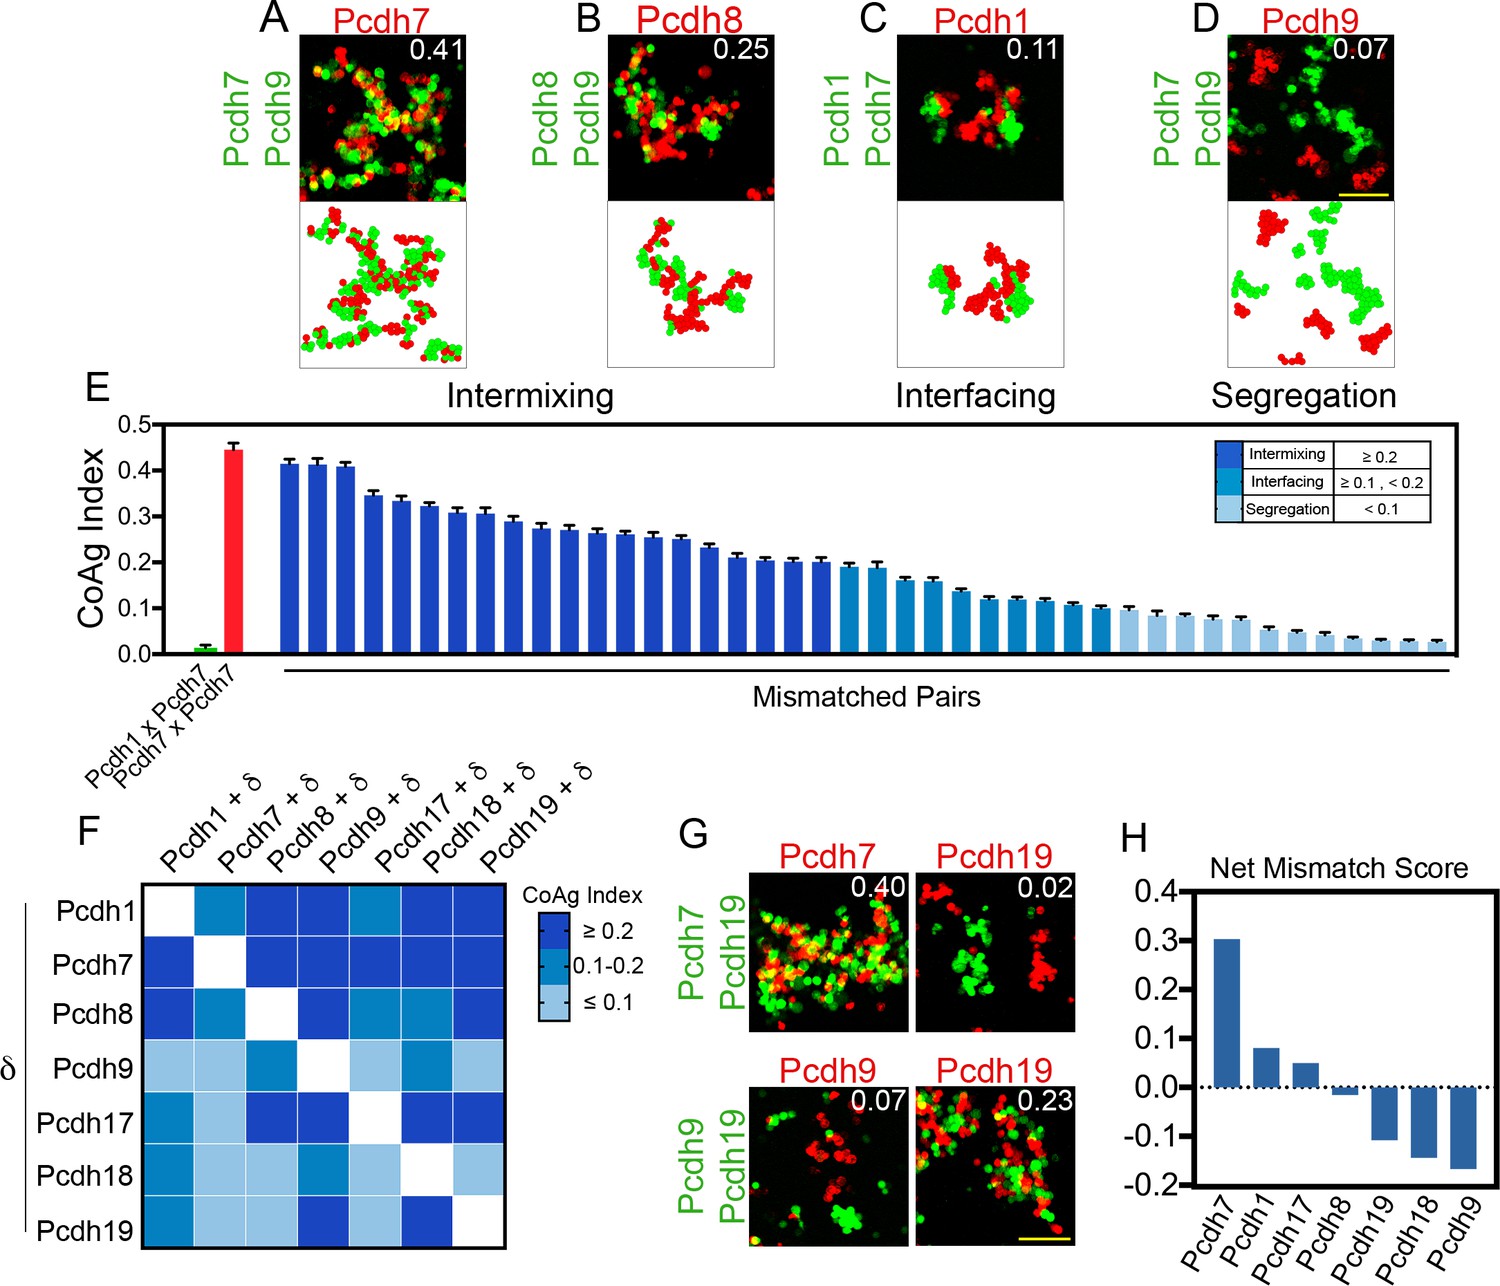
Mismatch coaggregation screen reveals complex patterns of differential adhesion.
(A–D) Representative examples of different coaggregation behaviors (mean CoAg values for each experiment are displayed in the upper right of each representative image). Examples of (A) high intermixing, (B) moderate intermixing, (C) interfacing, and (D) segregation behaviors. Scale bar, 100 μm. (E) Range of coaggregation behaviors in our mismatch screen as revealed by the CoAg Index. (F) Heat map of mean CoAg values from the screen reveals high asymmetry across the diagonal. Each row represents a population expressing a single δ-Pcdh, while each column represents the cells co-expressing the listed δ-Pcdh plus the corresponding row partner. White boxes indicate redundant homophilic pairs and were not tested. Results for each of the 42 pairs tested were determined from two independent electroporations. (G) Examples of asymmetric behavior. Pcdh7 cells intermix with Pcdh7+Pcdh19 cells while Pcdh19 cells segregate. Pcdh19 cells intermix with Pcdh9+Pcdh19 cells while Pcdh9 cells segregate. Scale bar, 100 μm. (H) Net mismatch scores estimate the ability of a given δ-Pcdh to overcome a mismatch and still coaggregate. Pcdh7 has the highest such score and Pcdh9 the lowest, illustrating a potential hierarchy among δ-Pcdhs.
Figure 4 with 1 supplement
Differential coaggregation outcomes persist after controlling for surface expression levels.
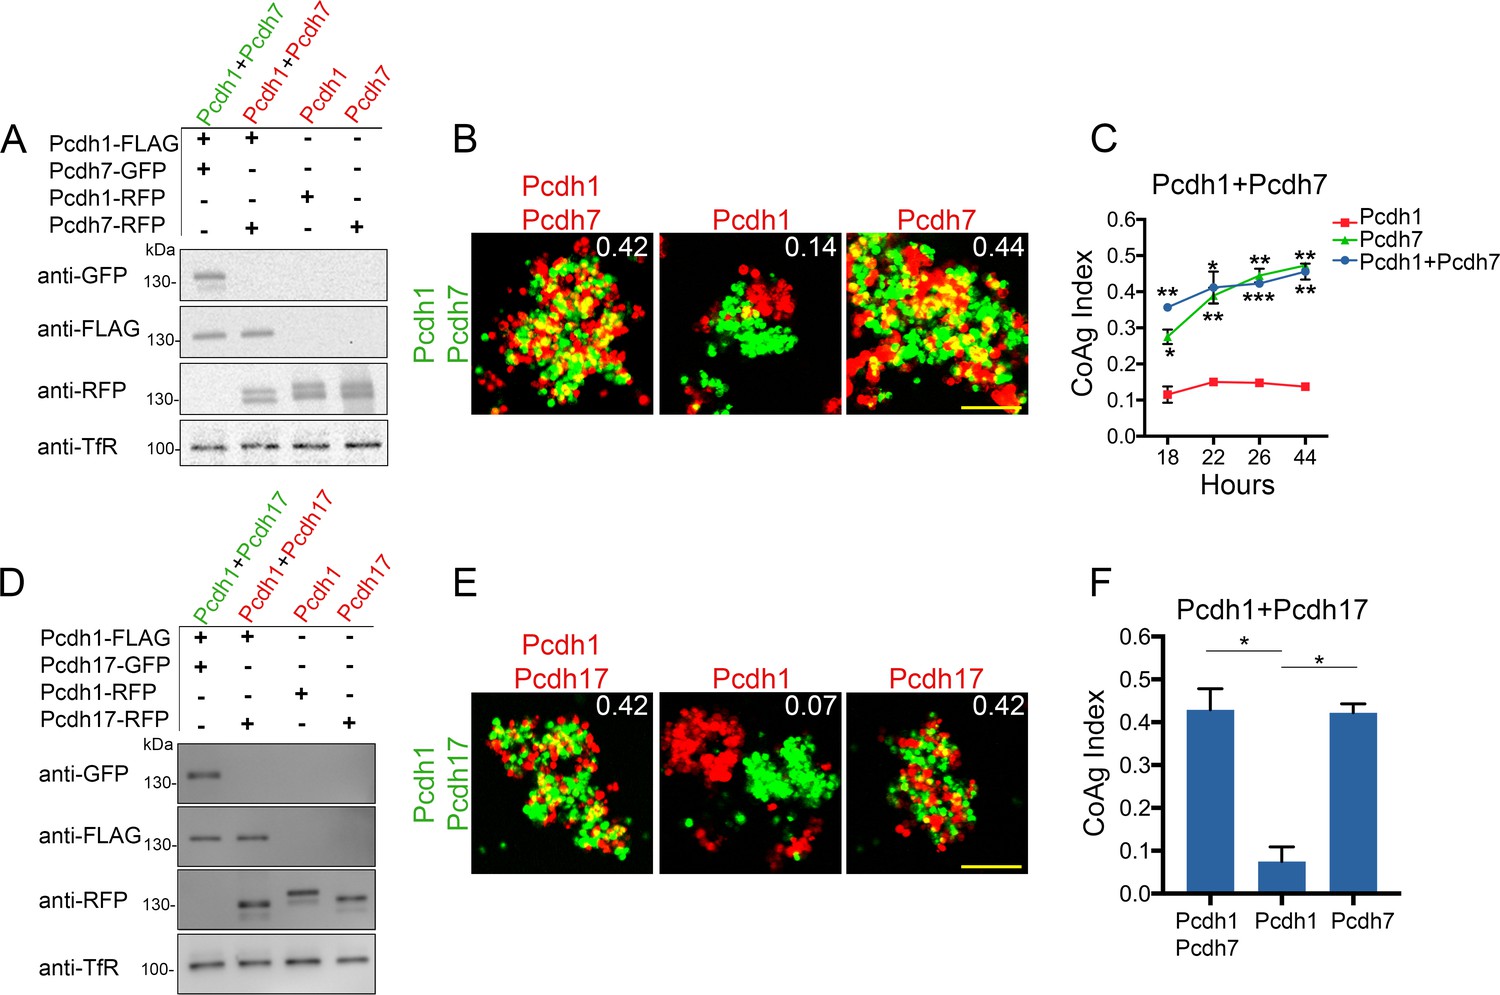
(A) Western blot of biotinylated membrane protein showing all populations in a Pcdh1+Pcdh7 mismatch assay possess similar surface expression levels after titration. (B) Representative images from the mismatch assay at 26 hr. Pcdh1 cells interface with Pcdh1+Pcdh7 cells while Pcdh7 cells intermix. Scale bar, 100 μm. (C) Mean CoAg values for each population at each time point. Each p-value is with respect to Pcdh1. Error bars indicate ±SEM, * indicates p≤0.05, **p≤0.01, ***p≤0.001. Results for each assay were determined from two independent electroporations. (D) Western blot of biotinylated membranes showing all populations in a Pcdh1+Pcdh17 mismatch assay possess similar levels of surface expression after titration. (E) Representative images from the Pcdh1+Pcdh17 mismatch assay at 26 hr. Pcdh1 cells segregate while Pcdh17 cells intermix. Scale bar, 100 μm. (F) Mean CoAg values at 26 hr post electroporation. Error bars indicate ±SEM, * indicates p≤0.05. Results for each assay were determined from three independent electroporations.
Figure 4—figure supplement 1
Differences among δ-Pcdhs in coaggregation behavior remain despite controlling for surface expression levels.
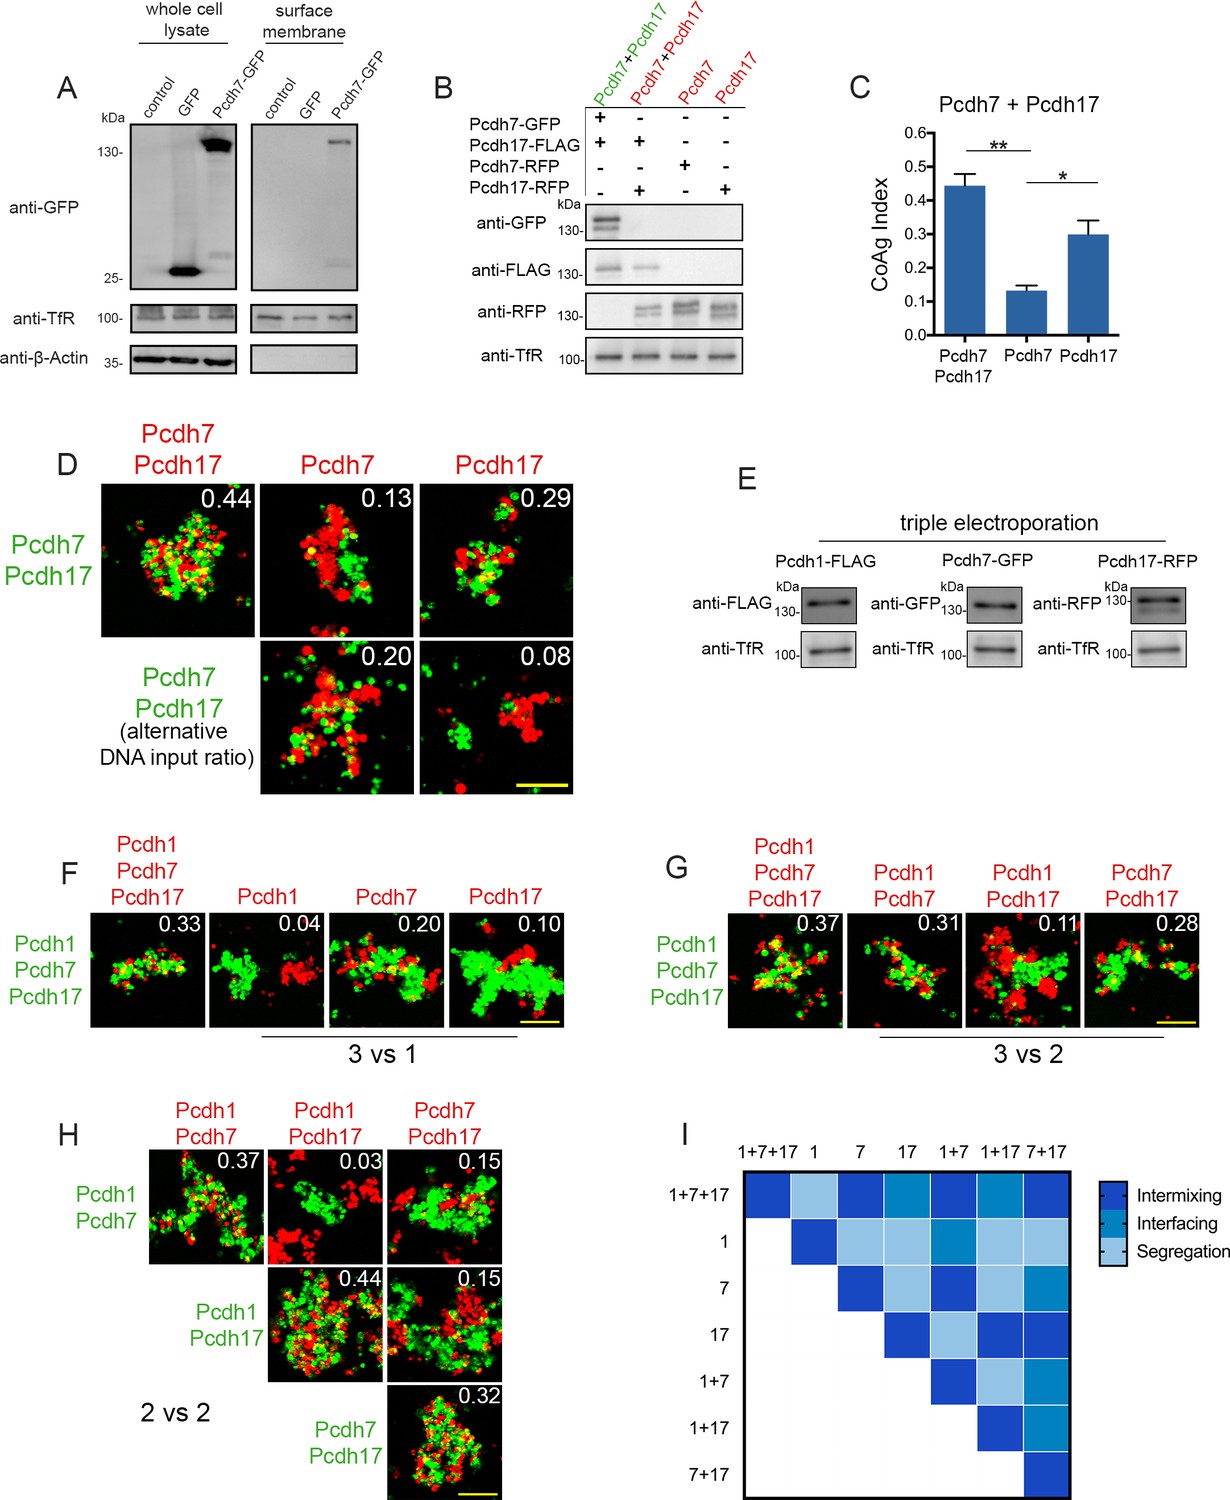
(A) Western blot comparing whole cell lysate (left panel) with membrane fractions following surface biotinylation (right panel). Surface membrane samples show no detectable signal for cytosolic GFP or beta-actin, but are enriched for the surface membrane marker transferrin receptor (TfR). The difference in expression of Pcdh7-GFP in the whole cell lysate vs. the surface membrane sample highlights the importance of measuring surface expression. (B) Western blot of biotinylated membrane protein showing all populations in a Pcdh7+Pcdh17 mismatch assay possess similar levels of surface expression. (C) Mean CoAg values for each population. Error bars indicate ±SEM, * indicates p≤0.05, **, indicates p≤0.01. Results for each assay were determined from three independent electroporations. (D) Representative images of Pcdh7+Pcdh17 mismatch assay. Note that the mean CoAg values for Pcdh7 and Pcdh17 can be shifted with minor variations in DNA input ratios. Such sensitivity was not observed for any other pair tested. Scale bar, 100 μm. (E) Western blot of biotinylated membrane protein showing all populations in a Pcdh1+Pcdh7+Pcdh17 mismatch assay possess similar levels of surface expression. For imaging experiments, tags were interchanged to prevent color mixing within a single population. (F) 3 vs 1 mismatch assays using Pcdh1+Pdh7+Pcdh17 cells. Pcdh1 cells segregated, Pcdh17 cells interfaced, while Pcdh7 cells weakly intermixed. Scale bar, 100 μm. Results for each assay were determined from three independent electroporations. (G) 3 vs 2 mismatch assays using Pcdh1+Pcdh7+Pcdh17 cells. Pcdh1+Pcdh7 cells intermix, Pcdh1+Pcdh17 cells interface, and Pcdh7+Pcdh17 cells intermix. Scale bar, 100 μm. Results for each assay were determined from three independent electroporations. (H) 2 vs 2 mismatch assays. Segregation, interfacing, and intermixing are observed depending on the particular δ-Pcdhs expressed. Scale bar, 100 μm. Results for each assay were determined from three independent electroporations. (I) Heat map of mean CoAg outcomes for all Pcdh1, Pcdh7 and Pcdh17 combinations.
Figure 5 with 1 supplement
Relative surface expression modulates mismatch coaggregation behavior.
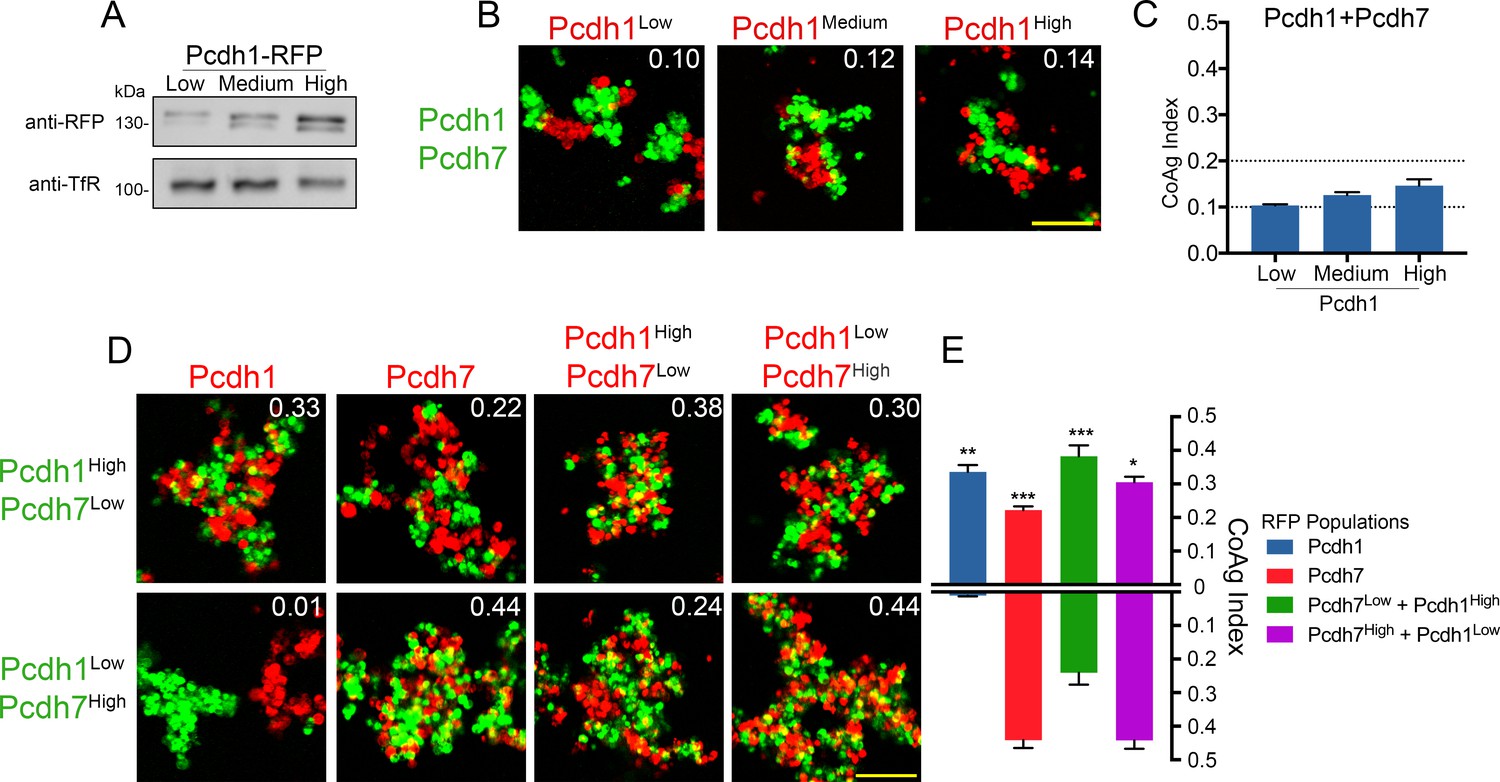
(A) Western blot of biotinylated membranes showing low, medium, and high surface expressing populations of Pcdh1 after DNA titration. (B) Representative images of mismatch coaggregation assays mixing Pcdh1+Pcdh7 cells with Pcdh1 (low, medium, and high) cells. Scale bar, 100 μm. Results for each assay were determined from three independent electroporations. (C) Mean CoAg values show varying the expression levels in Pcdh1 cells did not alter the coaggregation behavior (interfacing), but did affect the degree of interfacing. Error bars indicate ±SEM. Dotted lines indicate thresholds for change in coaggregation category. (D) Representative images of mismatch coaggregation assays where the relative expression levels of co-expressed δ-Pcdhs were varied. Pcdh1High+Pcdh7Low cells and their complement, Pcdh1Low+Pcdh7High cells, were combined with cells expressing a given δ-Pcdh population. The two images in a given column (e.g. Pcdh1, column 1) illustrate the differences in coaggregation behavior when mixed with these two populations. (E) Mean CoAg values for (D), each bar indicates values for the top image in a given column vs. values for the lower image in a given column. Error bars indicate ±SEM, * indicates p≤0.05, **p≤0.01, ***p≤0.001. Results for each assay were determined from four independent electroporations.
Figure 5—figure supplement 1
Effects of surface expression levels on mismatch coaggregation behavior.
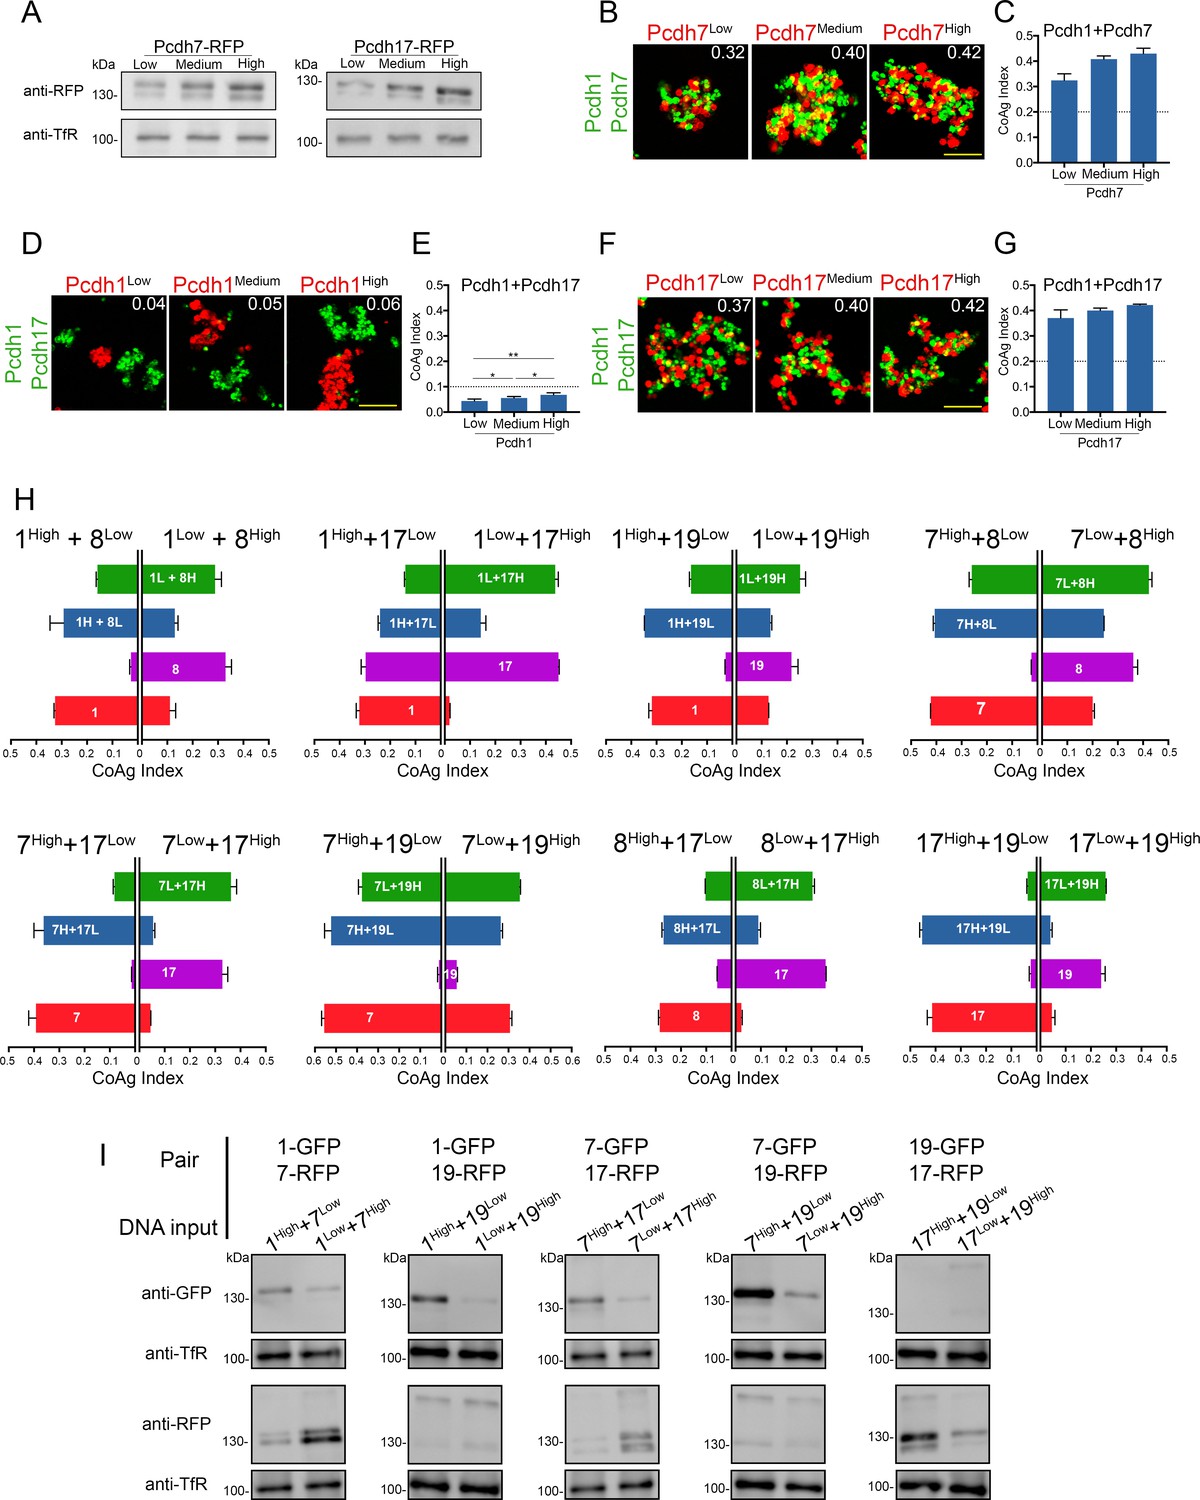
(A) Western blots of purified membranes showing low, medium, and high levels of Pcdh7 and Pcdh17 surface expression after DNA titration. (B,D,F) Representative images of mismatch coaggregation assays with (B) Pcdh1+Pcdh7 and (D,F) Pcdh1+Pcdh17 cells. (C,E,G) Mean CoAg values show varying surface expression in cells expressing a single δ-Pcdh did not fundamentally alter coaggregation behavior. Dotted lines indicate the threshold to change coaggregation categories. Cells still intermixed (Pcdh7, Pcdh17) or segregated (Pcdh1), although small changes in CoAg values do occur with increasing expression. Error bars indicate ±SEM, * indicates p≤0.05, **p≤0.01. Results for each assay were determined from three independent electroporations. (H) The impact of changing relative expression levels in cells expressing two δ-Pcdhs was tested for eight additional pairs of δ-Pcdhs. Each graph shows the mean CoAg values obtained for each mismatch assay. For example, the first graph shows the effects of varying relative expression of Pcdh1+Pcdh8. The left half of this graph shows results from assays using Pcdh1High+Pcdh8Low cells, while the right half shows results using the opposite conditions (Pcdh1Low + Pcdh8High). The impact of changing these relative expression levels is easiest to interpret by comparing the left and right half of each horizontal bar. For example, for the first bar (green), Pcdh1Low+Pcdh8High cells intermix more strongly with cells expressing Pcdh1Low+Pcdh8High than with Pcdh1High+Pcdh8Low cells. Pcdh8 cells (purple bar) intermixed with Pcdh1Low+Pcdh8High cells, but segregated from Pcdh1High+Pcdh8Low cells. Changing the relative level of expression in co-expressing cells can therefore change the category of coaggregation behavior. Error bars indicate ±SEM. Results for each assay were determined from two independent electroporations. (I) A subset of conditions shown in (H) and in Figure 5D were tested to confirm high/low DNA inputs resulted in changes in relative surface expression. Compare relative signal from the top half of each lane to the bottom. Note that the goal was to generate different expression ratios between the two lanes for each pair shown, and not to generate ‘high’ or ‘low’ surface expression.
Figure 6 with 2 supplements

δ-Pcdhs possess differences in apparent adhesive affinity.
(A) Representative images of cell aggregates at select speeds. Pcdh7 cells possessed small aggregates even at 220 RPM while Pcdh1 and Pcdh17 cells dissociated. Scale bar, 100 μm. (B) Mean aggregate size at each speed. Pcdh1 and Pcdh17 were significantly different from Pcdh7 by ANOVA, p=1×10⁻¹⁵. Error bars indicate ±SEM. Results for each assay were determined from four independent electroporations. (C) Representative images of a mismatch coaggregation assay with Pcdh1+Pcdh7 cells. At higher speeds, Pcdh1 cells change from interfacing to segregating (middle column), while the other two populations remain intermixed. Scale bar, 100 μm. (D) Mean CoAg values of (C). Error bars indicate ±SEM, * indicates p≤0.05, ** indicates p≤0.01. Results for each assay were determined from three independent electroporations. (E) Monte Carlo simulations incorporating affinity and relative expression level capture most, but not all, mismatch assay results. We modeled the behavior of a given mismatch assay (e.g. row 1, Pcdh1+Pcdh7). The Y-axis represents the CoAg Index (simulated (solid black and red lines) and observed (thick dashed line with standard error represented by thin dashed lines). Solid lines represent simulations where the relative expression level of the two δ-Pcdhs has been varied (from 1:1 to 20:1). The X-axis represents increasing differences in apparent adhesive affinity (e.g. the left most point on the X-axis represents conditions where both δ-Pcdhs are of equal apparent adhesive affinity). In all three simulated coaggregation assays, the model predicted intermixing conditions (e.g. CoAg index above 0.2), but was not able to precisely model segregation or interfacing behaviors (compare right most graph in each row against the other two).
Figure 6—figure supplement 1
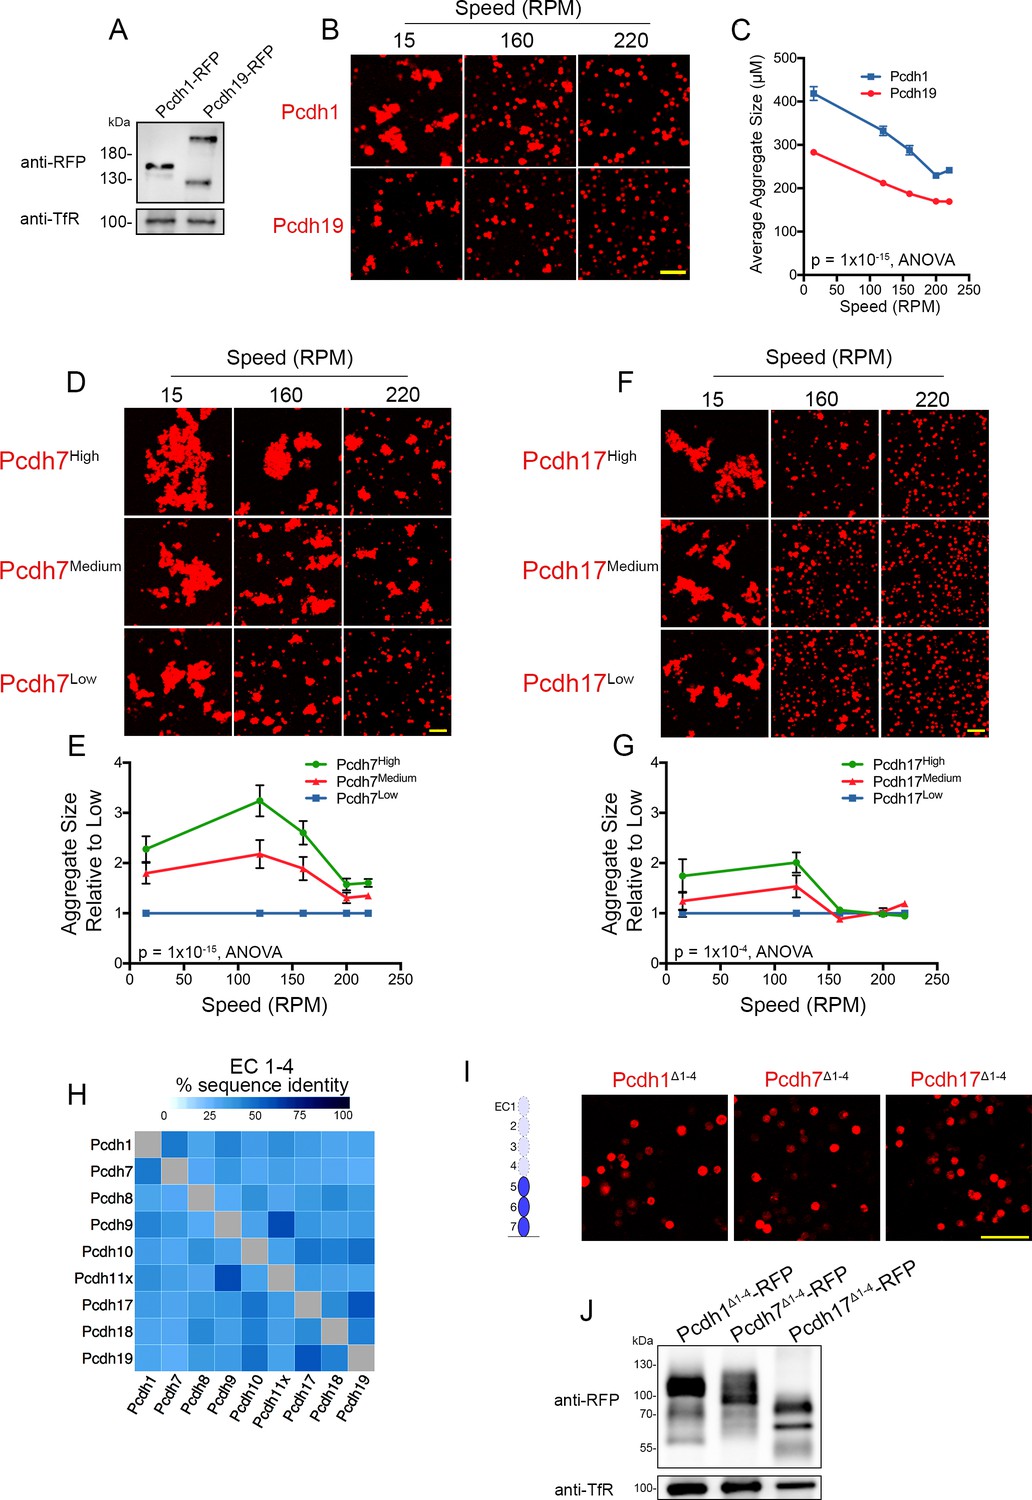
δ-Pcdhs possess differences in apparent adhesive affinity, which appears to be mediated by EC domains 1–4.
(A) Western blot showing similar surface level expression for Pcdh1 and Pcdh19 cells. A second, high-molecular weight band is frequently observed for Pcdh19. (B) Representative images of cell aggregates taken at various speeds. Scale bar, 100 µm. (C) Quantification of aggregate size shows Pcdh1 cells maintained larger aggregates than Pcdh19 cells at all speeds. Pcdh1 and Pcdh19 cell behaviors were significantly different by ANOVA, p=1×10⁻¹⁵. Error bars indicate ±SEM. Results for each assay were determined from four independent electroporations. (D–G) Cells expressing high, medium, and low levels of Pcdh7 (D) and Pcdh17 (F) were subject to increasing rotational speeds. Mean aggregate sizes for Pcdh7 (E) and Pcdh17 (G). Increased surface expression led to larger aggregates at each speed tested. Error bars indicate ±SEM. Results for each assay were determined from three independent electroporations. (H) MUSCLE protein alignments show low overall sequence identities for EC1-4. (I) Pcdh1Δ1-4, Pcdh7Δ1-4 and Pcdh17Δ1-4 constructs fail to mediate adhesion. Cartoon illustrates EC1-4 deletion for Pcdh1 and Pcdh7. Pcdh17 construct has only two EC domains following deletion of EC1-4. Scale bar, 100 µm. (J) Western blot of biotinylated surface show proteins with deletions in EC1-4 are transported to the surface.
Figure 6—figure supplement 2
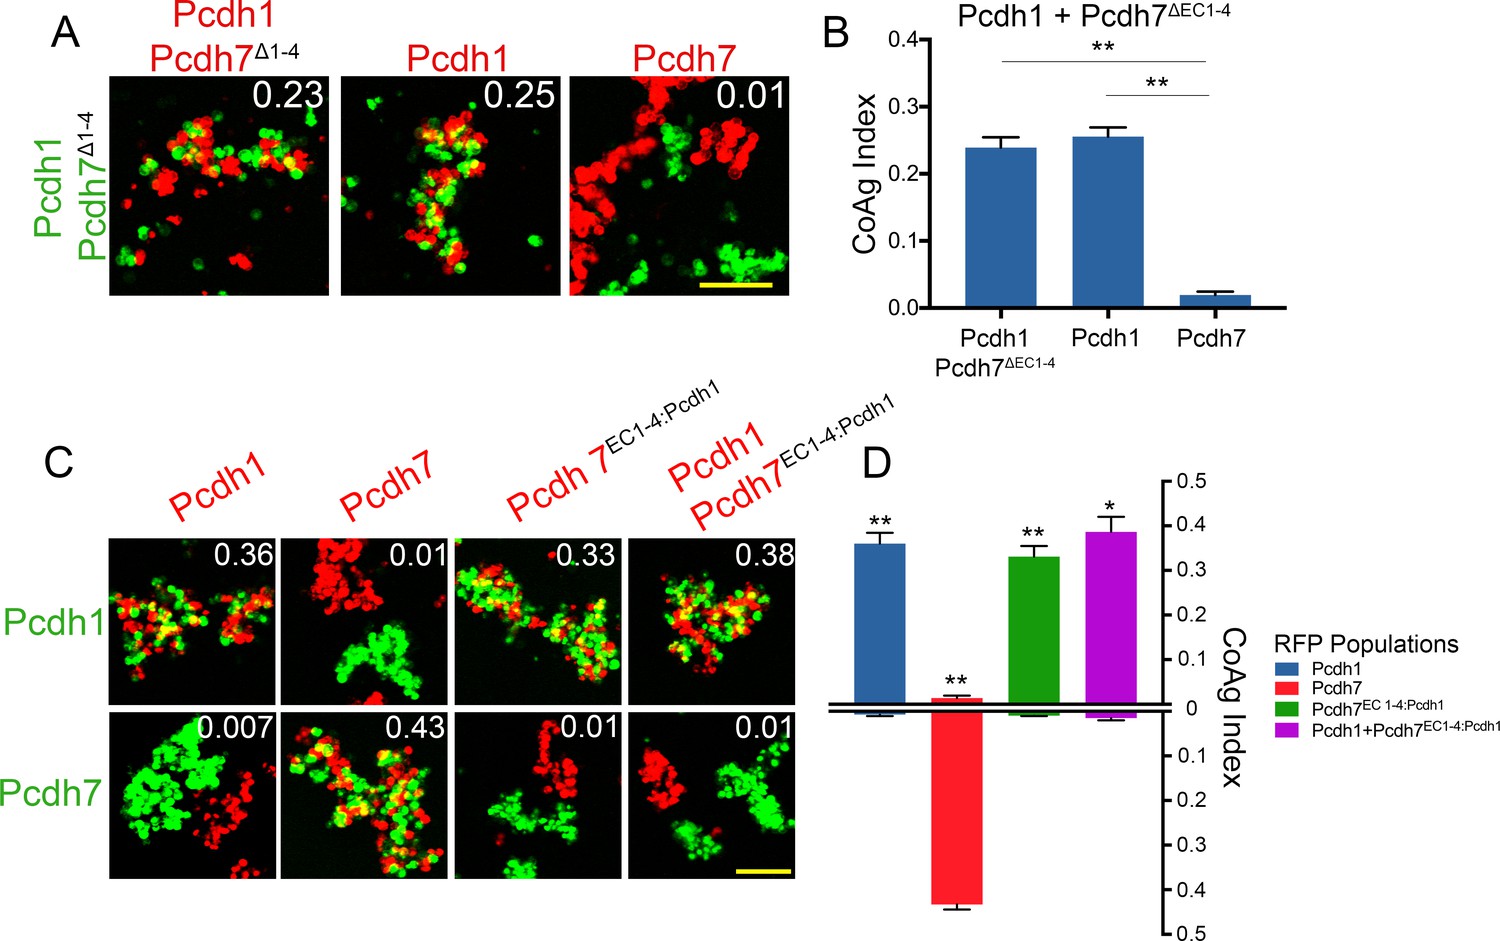
EC1-4 mediate adhesive interactions among δ-Pcdhs.
(A) Representative images of coaggregation assay with Pcdh1+Pcdh7Δ1-4 cells.
Pcdh1 cells now intermix with this population while Pcdh7 cells segregate. Scale bar, 100 µm. (B) Mean CoAg values, error bars indicate ±SEM, * indicates p≤0.05, ** indicates p≤0.01. Results for each assay were determined from three independent electroporations. (C) Representative images of coaggregation assay where EC1-4 of Pcdh7 has been swapped with that from Pcdh1. Results are best interpreted by comparing images within individual columns. Columns 3 and 4 shows the swap construct Pcdh7EC1-4:Pcdh1 enables these cells to now intermix with Pcdh1 cells, and cause Pcdh7 cells to now segregate. Scale bar, 100 µm. (D) Mean CoAg values. Values from the top half of each bar should be compared against those in the bottom half to visualize differences in coaggregation behavior. Error bars indicate ±SEM, * indicates p≤0.05, ** indicates p≤0.01. Results for each assay were determined from three independent electroporations.
Figure 7 with 1 supplement

Effect of increasing co-expression of δ-Pcdhs on adhesion and interactions with clustered Pcdhb11.
(A) Western blot showing surface expression of Pcdh7 (FLAG) in the presence of increasing numbers of co-expressed δ-Pcdhs (all labeled with GFP). (B) Representative images of Pcdh7 cells when mixed with Pcdh7 +increasing numbers of δ-Pcdhs. Note shift from intermixing (left panel) to interfacing (right panel) as the number of δ-Pcdhs increases. Scale bar, 100 μm. (C) Linear regression analysis of mean CoAg values (R2 = 0.94; blue) and relative surface expression of Pcdh7 (red) with increasing numbers of co-expressed δ-Pcdhs. Error bars indicate ±SEM. Results for each assay were determined from three independent electroporations. Dot-dash line indicates boundary between intermixing and interfacing. R2 = 0.97 and 0.98 for CoAg index and proportion of Pcdh7 on surface, respectively. (D) Western blot of Pcdh7 and Pcdhb11 surface expression with varying DNA input ratios. (E) Quantitation of western blot data shown in (D). Error bars indicate ±SEM. Results for each assay were determined from three independent electroporations. (F) Representative images and (G) Mean CoAg values of coaggregation assays with Pcdh7+Pcdhb11 cells. As the ratio of Pcdh7:Pcdhb11 decreases, the CoAg value of Pcdhb11 cells increases, and shifts from segregation to interfacing (compare bars on bottom half of graph). Although the CoAg values of Pcdh7 drop somewhat (compare bars on top half of graph), Pcdh7 cells still intermix, despite low DNA input ratios. Error bars indicate ±SEM, * indicates p≤0.05. Results for each assay were determined from three independent electroporations. Scale bar, 100 μm.
Figure 7—figure supplement 1
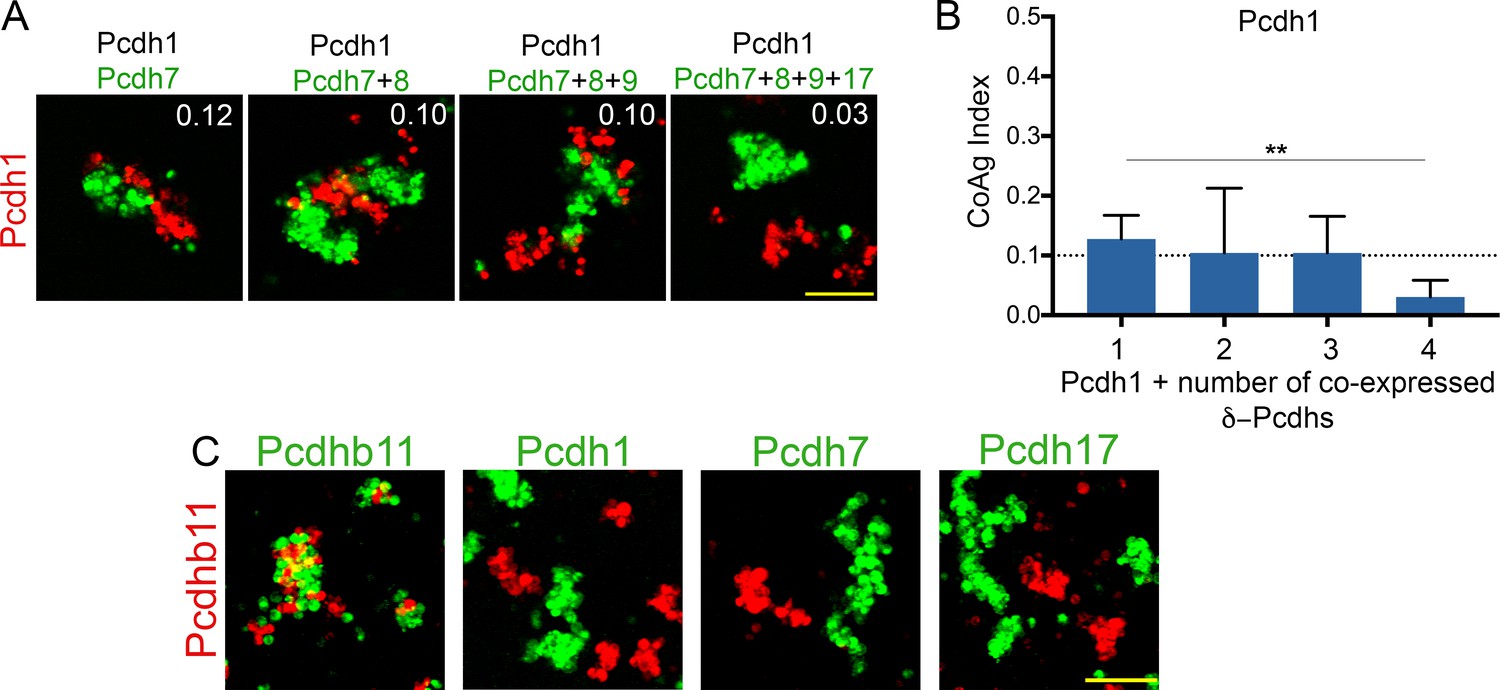
Increasing δ-Pcdh combinatorial expression and homophilic adhesion among protocadherins.
(A) Representative images of Pcdh1 cells mixed with Pcdh1 + increasing numbers of δ-Pcdhs. Note cells shift from interfacing (left panel) to segregation (right panel) as the number of δ-Pcdhs increases. Scale bar, 100 µm. (B) Mean CoAg index values fall as the number of δ-Pcdhs increases, and shifts categories (e.g. drops below 0.1, the boundary between interfacing and segregation as indicated by dotted line). Error bars indicate ±SEM, ** indicates p≤0.01. Results for each assay were determined from three independent electroporations. (C) Representative images showing Pcdhb11 will intermix with other Pcdhb11 cells, but will segregate from cells expressing a given δ-Pcdh. Scale bar, 100 μm.
Tables
Key resources table
| Reagent type (species) or resource | Designation | Source or reference | Identifiers | Additional information |
|---|---|---|---|---|
| Gene (Mus musculus) | Pcdh1 | this paper | NCBI: NM_029357.3 | cloned from isolated RNA from mouse olfactory epithelium |
| Gene (Mus musculus) | Pcdh7 | this paper | NCBI: NM_001122758.2 | cloned from isolated RNA from mouse olfactory epithelium |
| Gene (Mus musculus) | Pcdh8 | this paper | NCBI: NM_001042726.3 | cloned from isolated RNA from mouse olfactory epithelium |
| Gene (Mus musculus) | Pcdh9 | this paper | NCBI: NM_001271798.1 | cloned from isolated RNA from mouse olfactory epithelium |
| Gene (Mus musculus) | Pcdh10 | this paper | NCBI: NM_001098172.1 | cloned from isolated RNA from mouse olfactory epithelium |
| Gene (Mus musculus) | Pcdh11x | this paper | NCBI: NM_001271809.1 | cloned from isolated RNA from mouse olfactory epithelium |
| Gene (Mus musculus) | Pcdh17 | this paper | NCBI: NM_001013753.2 | cloned from isolated RNA from mouse olfactory epithelium |
| Gene (Mus musculus) | Pcdh18 | this paper | NCBI: NM_130448.3 | cloned from isolated RNA from mouse olfactory epithelium |
| Gene (Mus musculus) | Pcdh19 | this paper | NCBI: NM_001105246.1 | cloned from isolated RNA from mouse olfactory epithelium |
| Gene (Mus musculus) | Pcdhb11 | this paper | NCBI: NM_053136.3 | cloned from isolated RNA from mouse olfactory epithelium |
| Strain, strain background (Mus musculus) | FVB/NJ | The Jackson Laboratory | 1800 | |
| Strain, strain background (Mus musculus) | C57BL/6J | The Jackson Laboratory | 664 | |
| Strain, strain background (Mus musculus) | CD-1 | Charles River | 22 | |
| Cell line (Homo sapiens) | K-562 | ATCC | CCL-243 | |
| Biological sample (Mus musculus) | primary olfactory sensory neurons | this paper | isolated for single cell analysis from P6-P8 mice, both sexes | |
| Biological sample (Mus musculus) | olfactory epithelium | this paper | isolated and sectioned for RNA in situ hybridization, at ages indicated in paper, both sexes | |
| Antibody | moust anti-GFP | Thermo Scientific | MA5-15256 | 1:4000 |
| Antibody | mouse anti-RFP | Thermo Scientific | MA5-15257 | 1:2000 |
| Antibody | mouse anti-FLAG | Thermo Scientific | MA1-91878 | 1:6000 |
| Antibody | mouse anti-Transferrin Receptor (TfR) | Thermo Scientific | 13–6800 | 1:1000 |
| Recombinant DNA reagent | N1-p2a- GFP or RFP | this paper | modified from Clontech N1-eGFP | |
| Recombinant DNA reagent | N1-GFP or RFP | this paper | modified from Clontech N1-eGFP | |
| Sequence- based reagent | this paper | see supplemental tables for all primers | ||
| Commercial assay or kit | Pierce Cell Surface Isolation Kit | Thermo Scientific | 89881 | |
| Commercial assay or kit | Ingenio Electroporation Kit | Mirus | MIR 50118 | |
| Chemical compound, drug | Valproic acid sodium salt | Sigma-Aldrich | P4543 | 4 μM |
| Software, algorithm | Co-Ag index | this paper | code written in Mathematica (Wolfram Research) | |
| Software, algorithm | Aggregate size measurement | this paper | code written in Mathematica (Wolfram Research) | |
| Software, algorithm | Cell aggregation Monte Carlo Simulator | this paper | https://github.com/shazanfar/cellAggregator ; Ghazanfar et al., 2016 |
Additional files
-
Transparent reporting form
- https://doi.org/10.7554/eLife.41050.019
Download links
A two-part list of links to download the article, or parts of the article, in various formats.
Downloads (link to download the article as PDF)
Open citations (links to open the citations from this article in various online reference manager services)
Cite this article (links to download the citations from this article in formats compatible with various reference manager tools)
Tuning of delta-protocadherin adhesion through combinatorial diversity
eLife 7:e41050.
https://doi.org/10.7554/eLife.41050


