A re-inducible gap gene cascade patterns the anterior–posterior axis of insects in a threshold-free fashion
- Friedrich-Alexander Universität Erlangen-Nürnberg, Germany
Figures
Figure 1 with 1 supplement
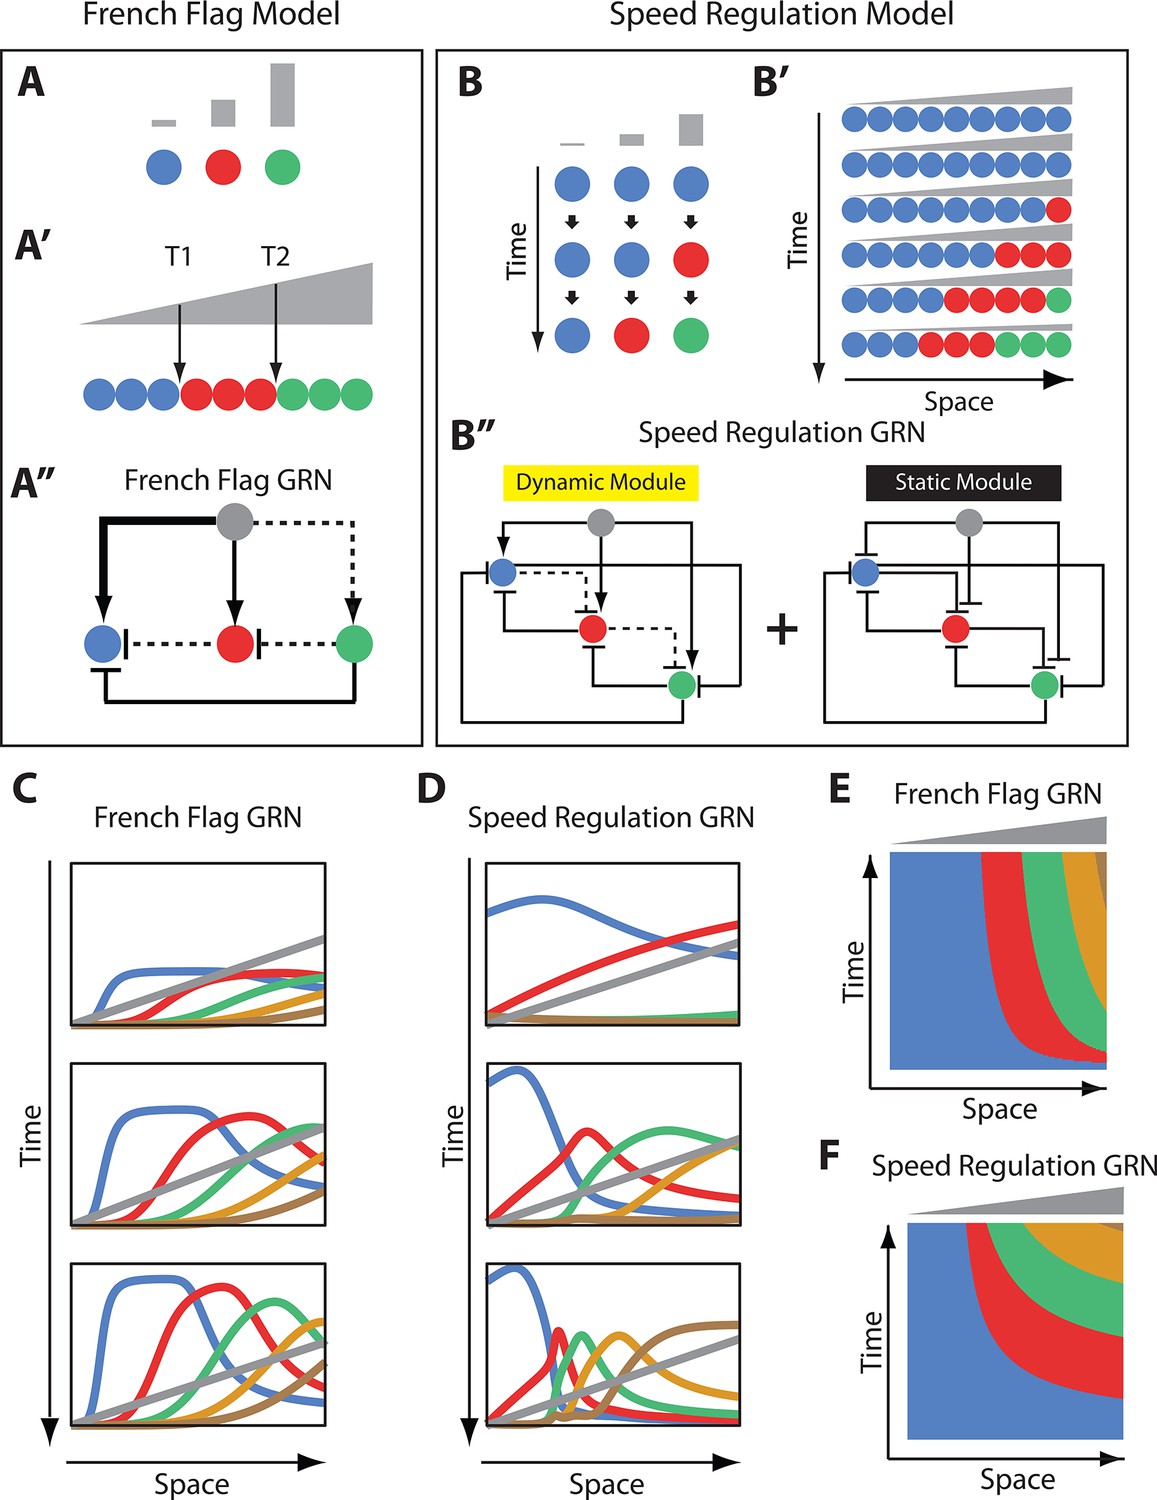
French Flag model versus Speed Regulation model.
(A–A’’). In the French Flag (FF) model, different concentrations of a morphogen gradient (grey) activate different cellular states (A, A’) based on a set of morphogen thresholds (here T1 and T2; A’). In A and A’, cells are represented by circles and cellular states are shown in blue, red and green. Shown in A’’ is a GRN realization of the FF model (genes representing different cellular states are shown in circles; arrowheads stand for activation, and flat bars stand for repression; the thicker the line, the stronger the activation/repression; dashed lines stand for the weakest activation/repression). (B-B’’) In the Speed Regulation (SR) model, all cells (shown in circles in B and B’) transit through different cellular states (shown in blue, red, and green) with a speed that is proportional to the concentration of a morphogen gradient (grey). Shown in B’’ is a GRN realization of the SR model (genes representing different cellular states are shown in circles; arrowheads stand for activation, and flat bars stand for repression; dashed lines stand for weak activation/repression). (C,E) Computer simulation of FF GRN shown as plots of expression domains along space for selected time points (C) and as a kymograph (E). (D,F) Computer simulation of SR GRN shown as plots of expression domains along space for selected time points (D) and as a kymograph (F).
© 2017, PNAS. All rights reserved. Panels B-B’’ are re-produced from (Zhu et al., 2017) under the following license agreement: http://www.pnas.org/sites/default/files/advanced-pages/authorlicense.pdf. They are not available under CC-BY and are exempt from the CC-BY 4.0 license.
Figure 1—figure supplement 1
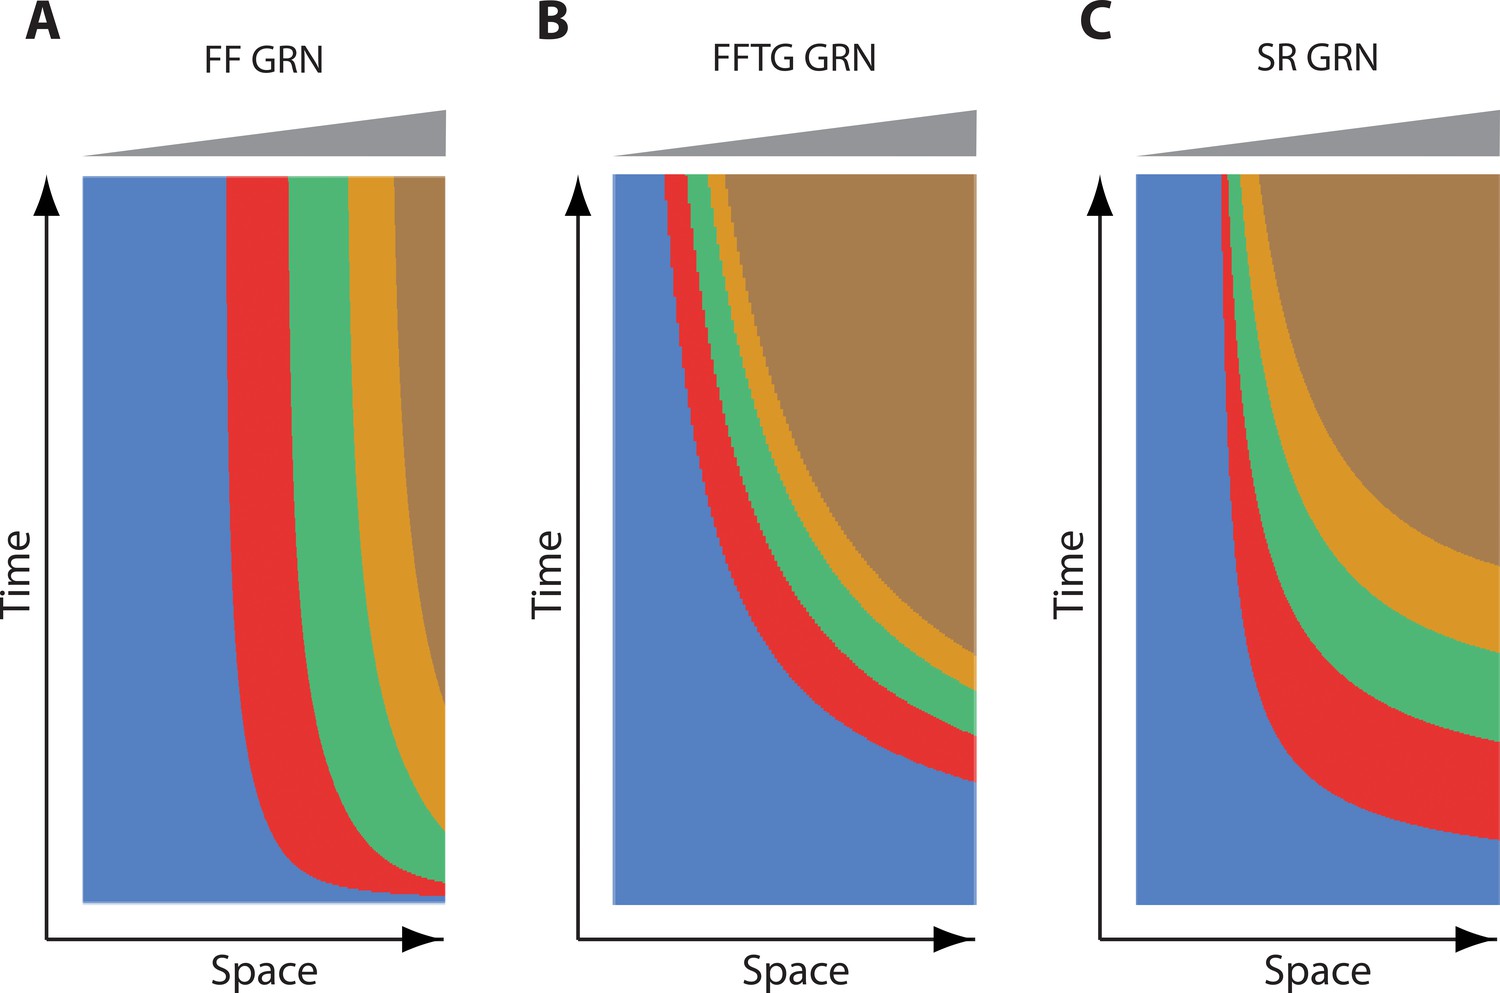
Steady state behavior of French Flag GRN, French Flag with Timer Gene GRN, and Speed Regulation GRN.
Shown are kymographs of computer simulations of French Flag (FF) GRN, French Flag with Timer Gene (FFTG) GRN, and Speed Regulation (SR) GRN. For FF GRN, genes are expressed initially in sequential waves, but eventually reach steady state. For FFTG and SR GRNs, genes are expressed in sequential waves that keep propagating and shrinking as long as the morphogen gradient (shown in grey) is applied.
Figure 2
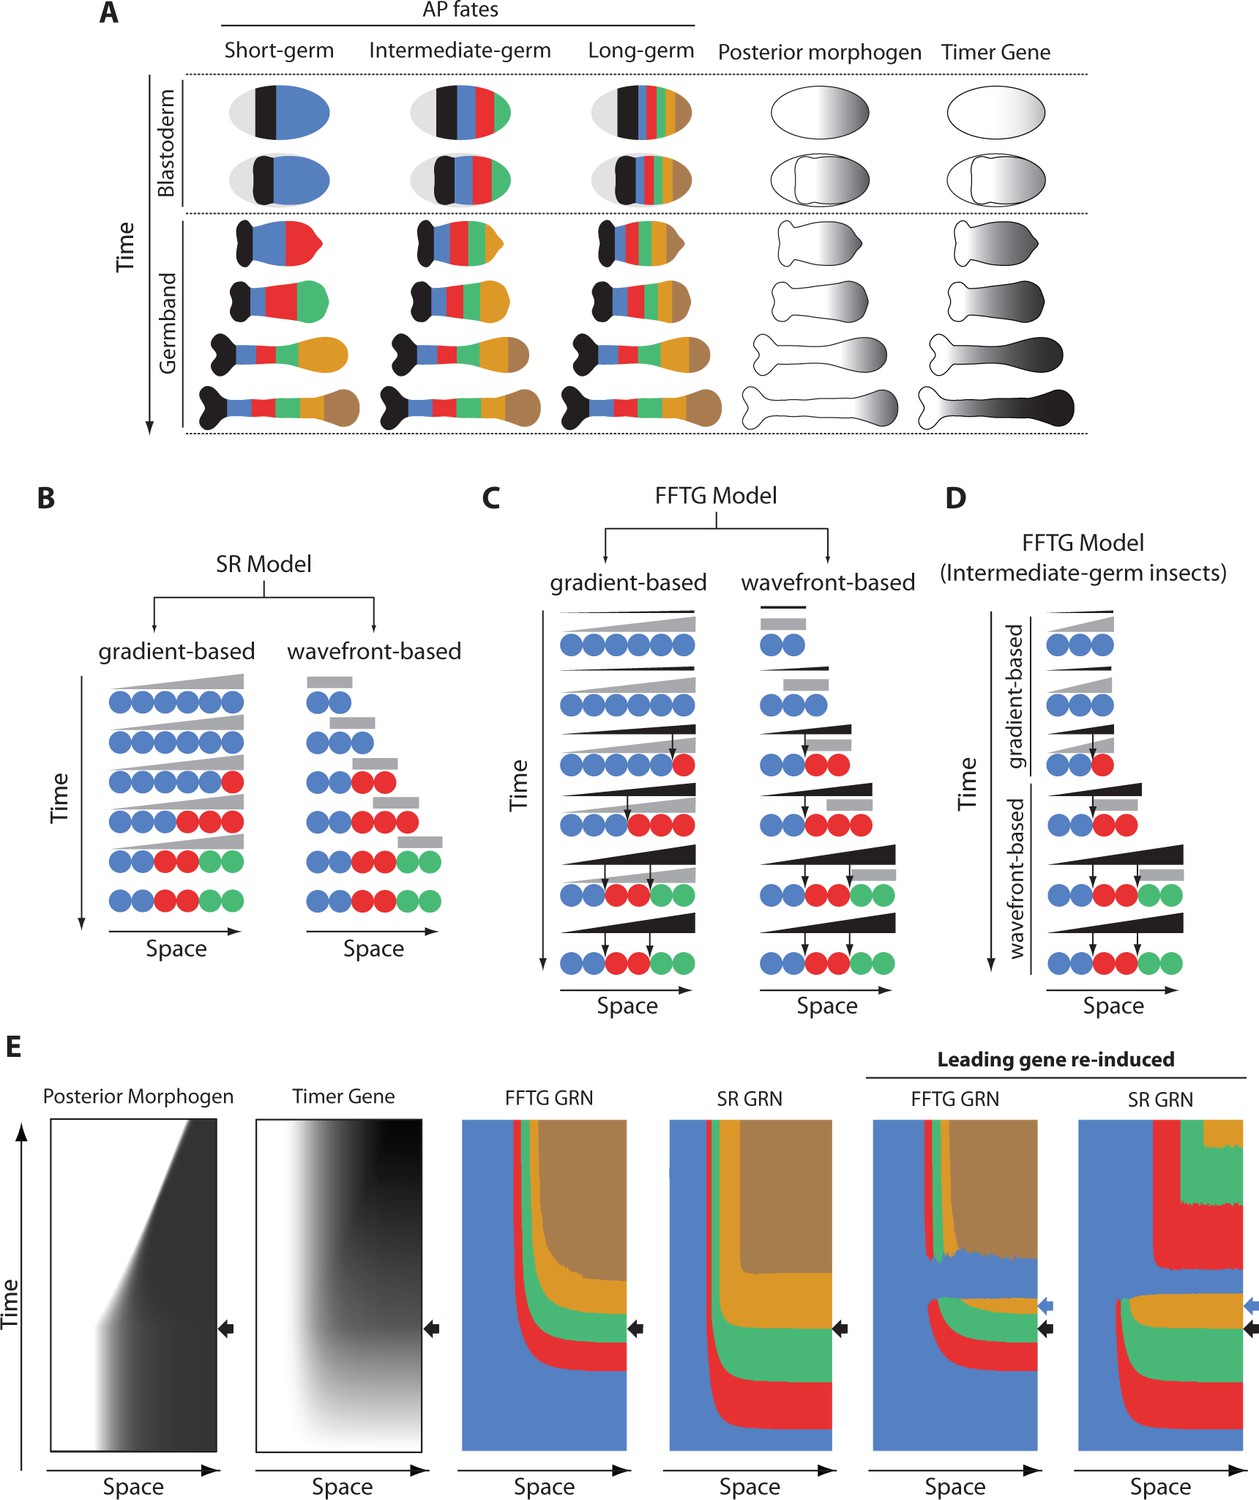
Application of FF and SR model to the problem of insect development and evolution.
(A) Anterior-posterior (AP) fate specification in insects of different germ types: short-, intermediate- and long-germ. Different fates are shown in different colors. In short-germ embryogenesis, most of fates are specified in an elongating embryonic structure called ‘germband’. In long-germ embryongenesis, most of fates are specified in a non-elongating embryonic structure called ‘blastoderm’. In intermediate-germ embryogenesis, anterior fates are specified in the blastoderm, while posterior fates are specified in the germband. A posteriorly-localized morphogen is shown in grey. Timer Gene, as required by French Flag with Timer Gene (FFTG) model is shown in black with different shades (the darker the higher the concentration). (B) The Speed Regulation (SR) model can operate in two modes: gradient-based and wavefront-based. In the gradient-based mode, a static gradient of the speed regulator (grey) is applied to a static field of cells (shown in circles). In the wavefront-based mode, a boundary of the speed regulator retracts along an elongating field of cells. (C) The FFTG model can operate in a gradient-based or a wavefront-based mode as well. The Timer Gene (black) is activated by a posterior morphogen (grey) and suffers little or no decay so that it unfolds into a long-range gradient along the entire AP axis in either the gradient-based or the wavefront-based mode. Different concentrations of the Timer Genes (arrows) set the boundaries between different fates. (D) FFTG model can pattern the AP axis of intermediate-germ insects: acting in the gradient-based mode to pattern anterior fates (during the blastoderm stage) and acting in the wavefront-based mode to pattern posterior fates (during the germband stage). (E) Kymographs of FFTG and SR GRNs when applied to AP patterning of intermediate-germ insects (first four panels; black arrow marks blastoderm-to-germband transition). Panels 5 and 6 show the response of the FFTG and SR GRNs to the re-activation of the leading gene (blue; the time of blue gene re-induction is marked by a blue arrow). In FFTG GRN, normal expression pattern is restored after a brief dominance of the blue gene. In SR GRN, already formed expression is down-regulated and the genetic cascade is reset.
© 2017, PNAS. All rights reserved. Panels A and B are re-produced from (Zhu et al., 2017) under the following license agreement: http://www.pnas.org/sites/default/files/advanced-pages/authorlicense.pdf. They are not available under CC-BY and are exempt from the CC-BY 4.0 license.
Figure 3
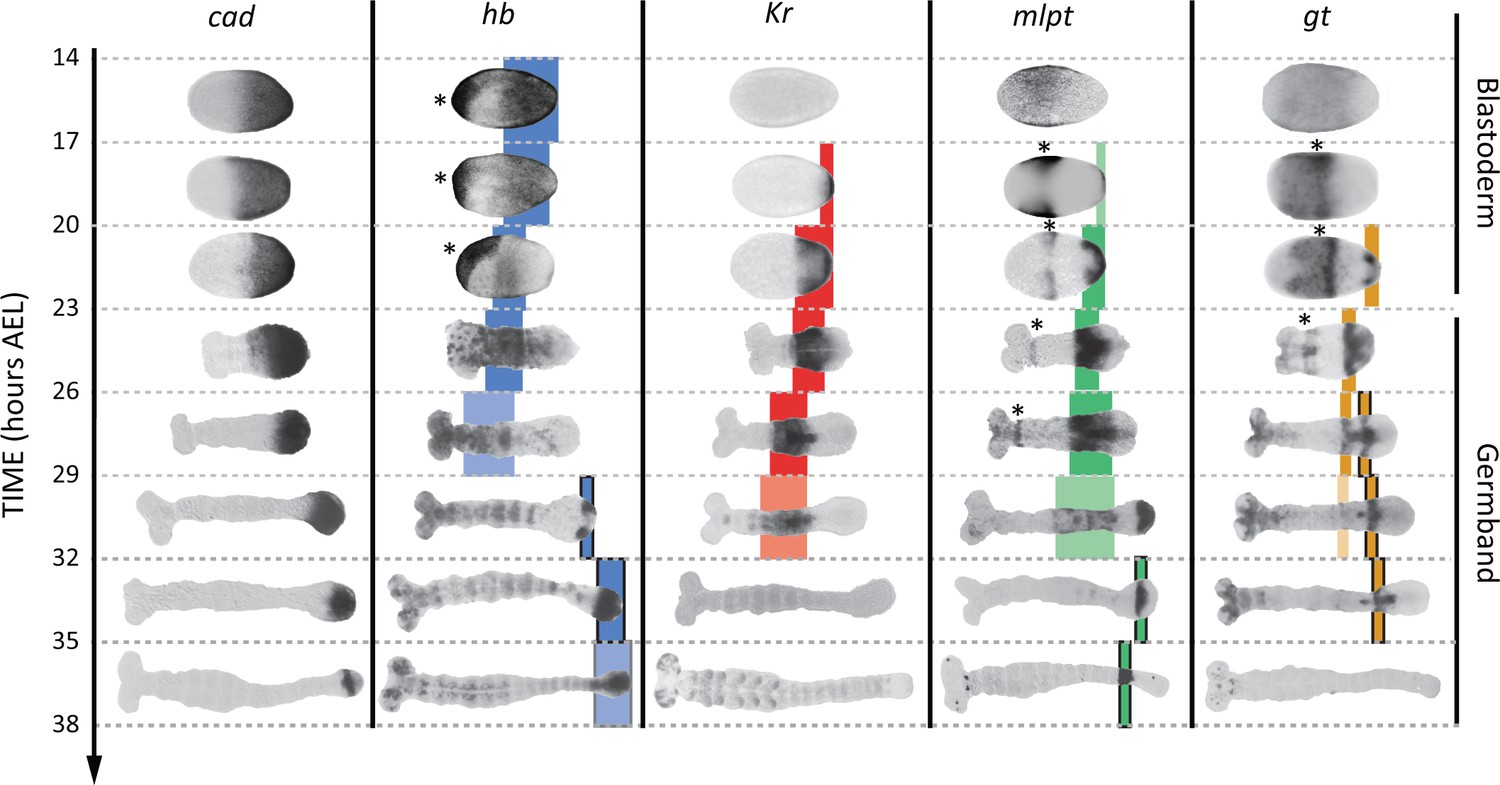
Expression dynamics of caudal and gap genes during AP axis specification in Tribolium.
caudal is expressed in a static (i.e. non-retracting) posterior-to-anterior gradient during the blastoderm stage, while is expressed in a retracting posterior-to-anterior gradient during the germband stage. Gap genes are expressed in sequential waves of gene expressions that propagate from posterior to anterior. Expression of different gap genes are tracked with differed colors: blue for hb, red for Kr, green for mlpt, and gold for gt. The second trunk domains of hb, mlpt and gt are outlined in black. Weak expressions are shown in faint colors. Non-trunk and extraembryonic expressions of gap genes (not considered in our analysis) are marked with asterisks. Posterior to the right in all embryos shown.
Figure 4 with 3 supplements
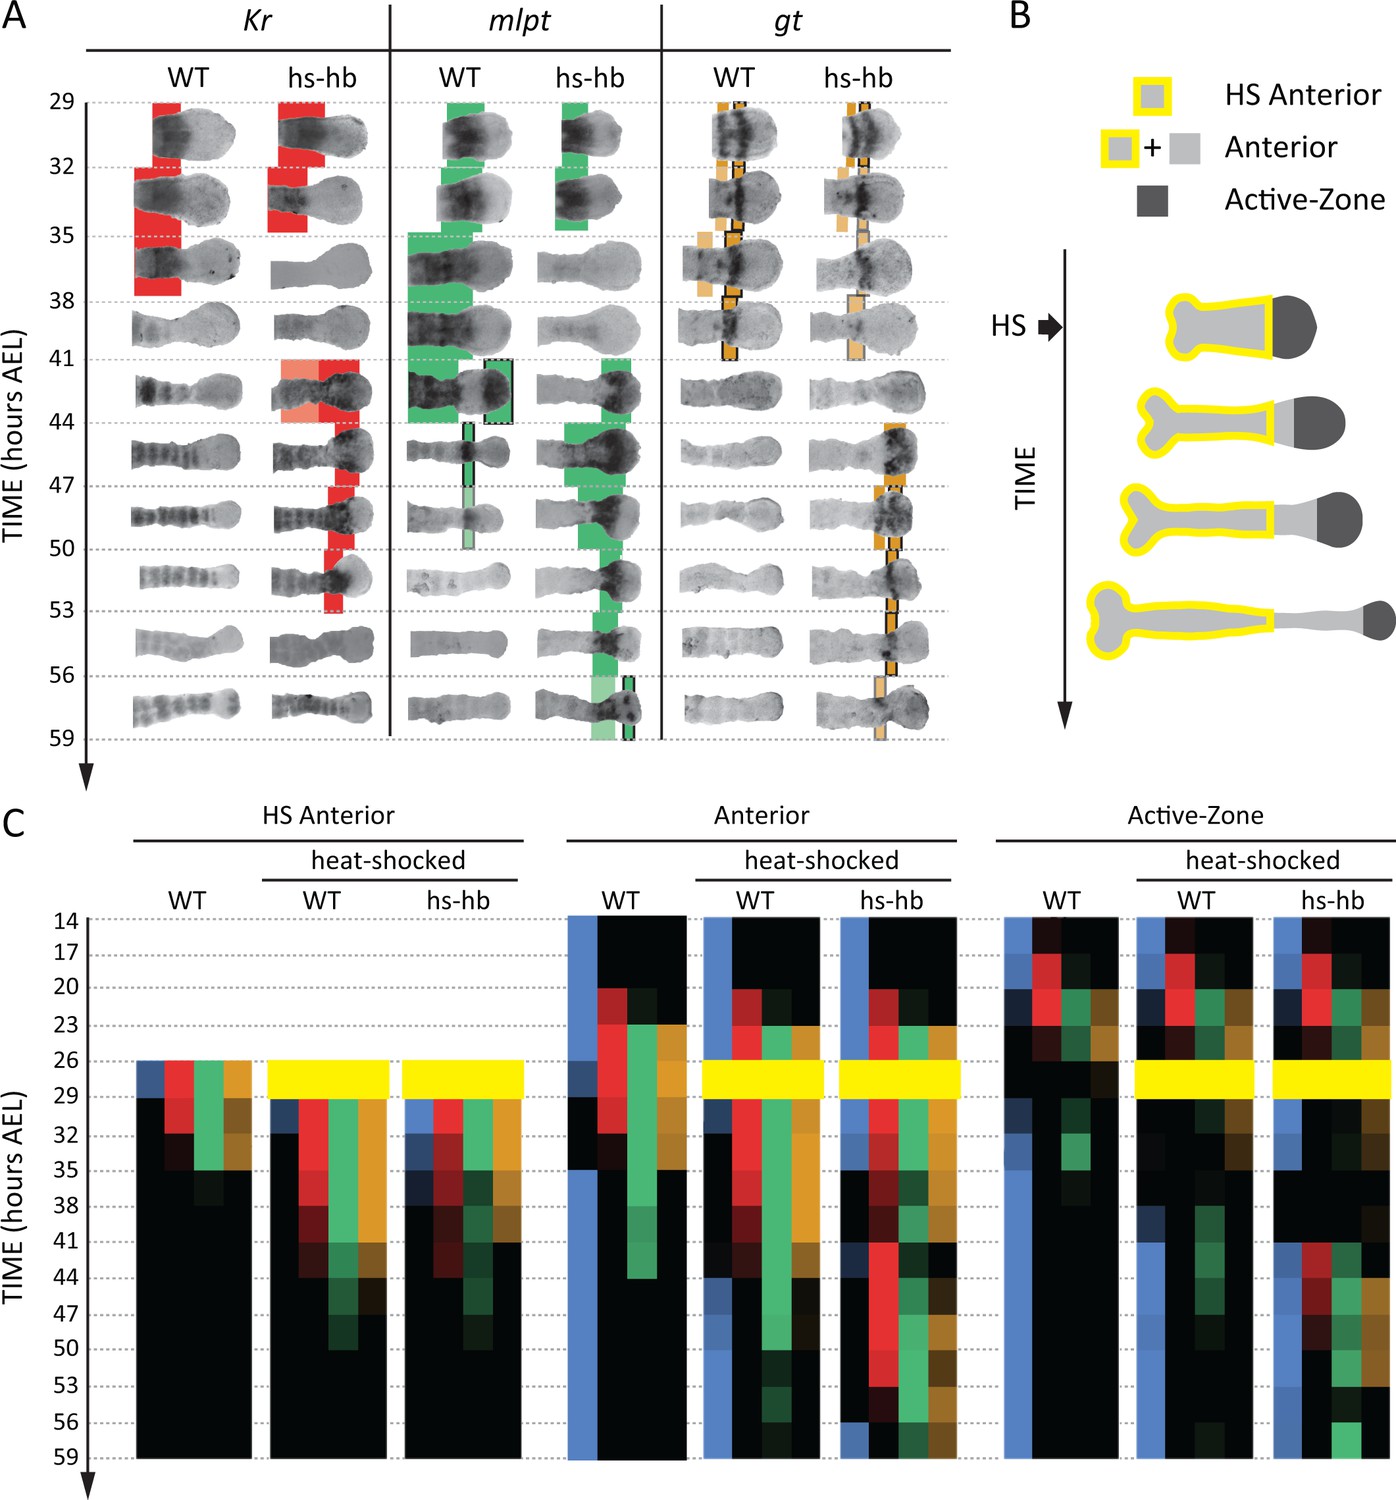
Dual response of Tribolium embryos upon re-inducing hb expression at 26–29 hr AEL.
(A) Expression dynamics of gap genes Kr, mlpt, and gt upon heat-shocking both WT and hs-hb embryos at 26–29 hr AEL. Shown are posterior halves of embryos (see Figure 4—figure supplement 2 for whole embryos). Expression of different gap genes are tracked with differed colors: red for Kr, green for mlpt, and gold for gt. The second trunk domains of mlpt and gt are outlined in black. Weak expressions are shown in faint colors. Posterior to the right in all embryos shown. (B) Dividing heat-shocked Tribolium embryos into three domains: Active-Zone (caudal-expressing zone at the posterior end of the embryo), Anterior (anterior to the Active-Zone), and HS Anterior (anterior to the Active-Zone at the time of applying heat-shock). See Materials and methods for a description of the used morphological landmarks to differentiate between these three regions. (C) Quantification (see Materials and methods) of gap gene expressions in WT, heat-shocked WT, and heat-shocked hs-hb embryos (heat-shocks applied at 26–29 hr AEL). Quantifications are carried out separately for HS Anterior, Anterior, and Active-Zone. While heat-shock application resulted in only a temporal delay in gap gene expression in WT, it resulted in dual response for hs-hb embryos: already established gap gene domains are pre-maturely down-regulated in HS Anterior, while the gap gene sequence is re-activated in Active-Zone. Re-induced gap gene sequence eventually propagates into Anterior. Time-windows where heat-shock is applied are shown in yellow.
-
Figure 4—source data 1
Raw numerical data of quantitative analyses for embryos heat-shocked at 26–29 hr AEL.
Listed are the percentages of embryos with detectable expression found in each region of the embryo (HS Anterior: HS-A, Anterior: A, and Active-Zone: AZ) in each egg collection in our quantitative analyses in Figure 4 (C) and Figure 4—figure supplement 3. Listed also are the numbers of embryos analyzed in each egg collection (n).
- https://doi.org/10.7554/eLife.41208.019
Figure 4—figure supplement 1
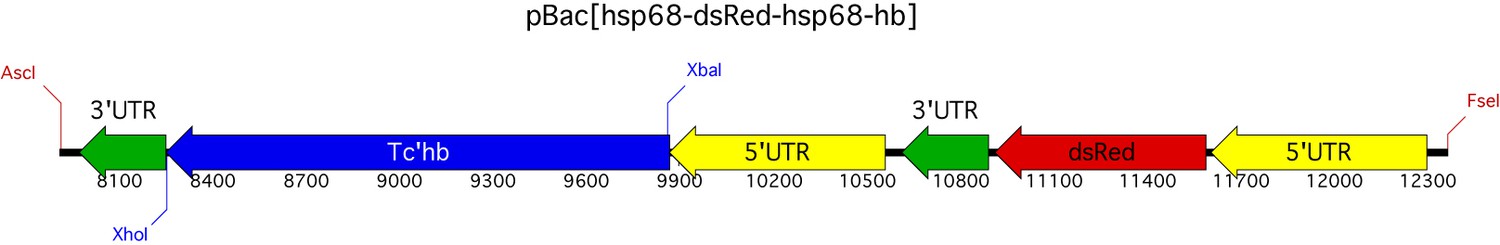
Map of the overexpression vector pBac[hsp68-dsRed-hsp68-hb].
Shown are relevant features of the plasmid pBac[hsp68-dsRed-hsp68-hb]: enzyme restriction sites AscI, FseI, XbaI and XhoI, the 3’ and the 5’ UTRs flanking the full length hb sequence, and the internal control dsRed.
Figure 4—figure supplement 2
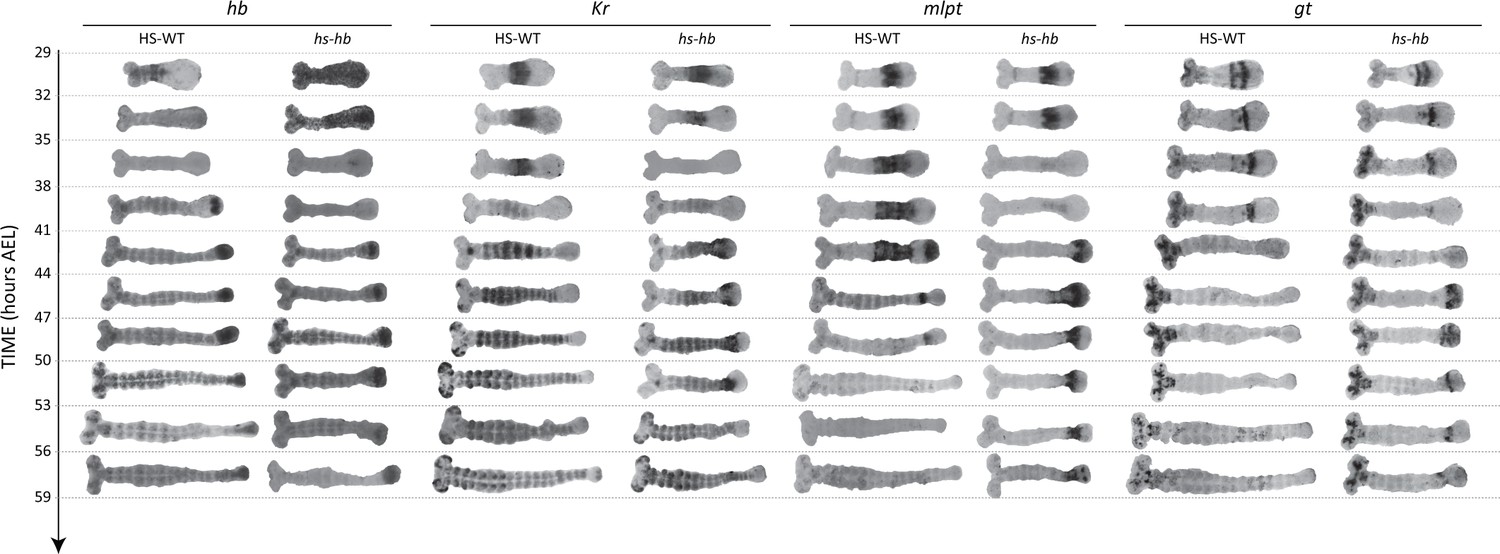
Dual response of Tribolium embryos upon re-inducing hb expression at 26–29 hr AEL.
Expression dynamics of gap genes hb, Kr, mlpt, and gt upon heat-shocking both WT and hs-hb embryos at 26–29 hr AEL. Posterior to the right. HS-WT: heat-shocked WT embryos.
Figure 4—figure supplement 3
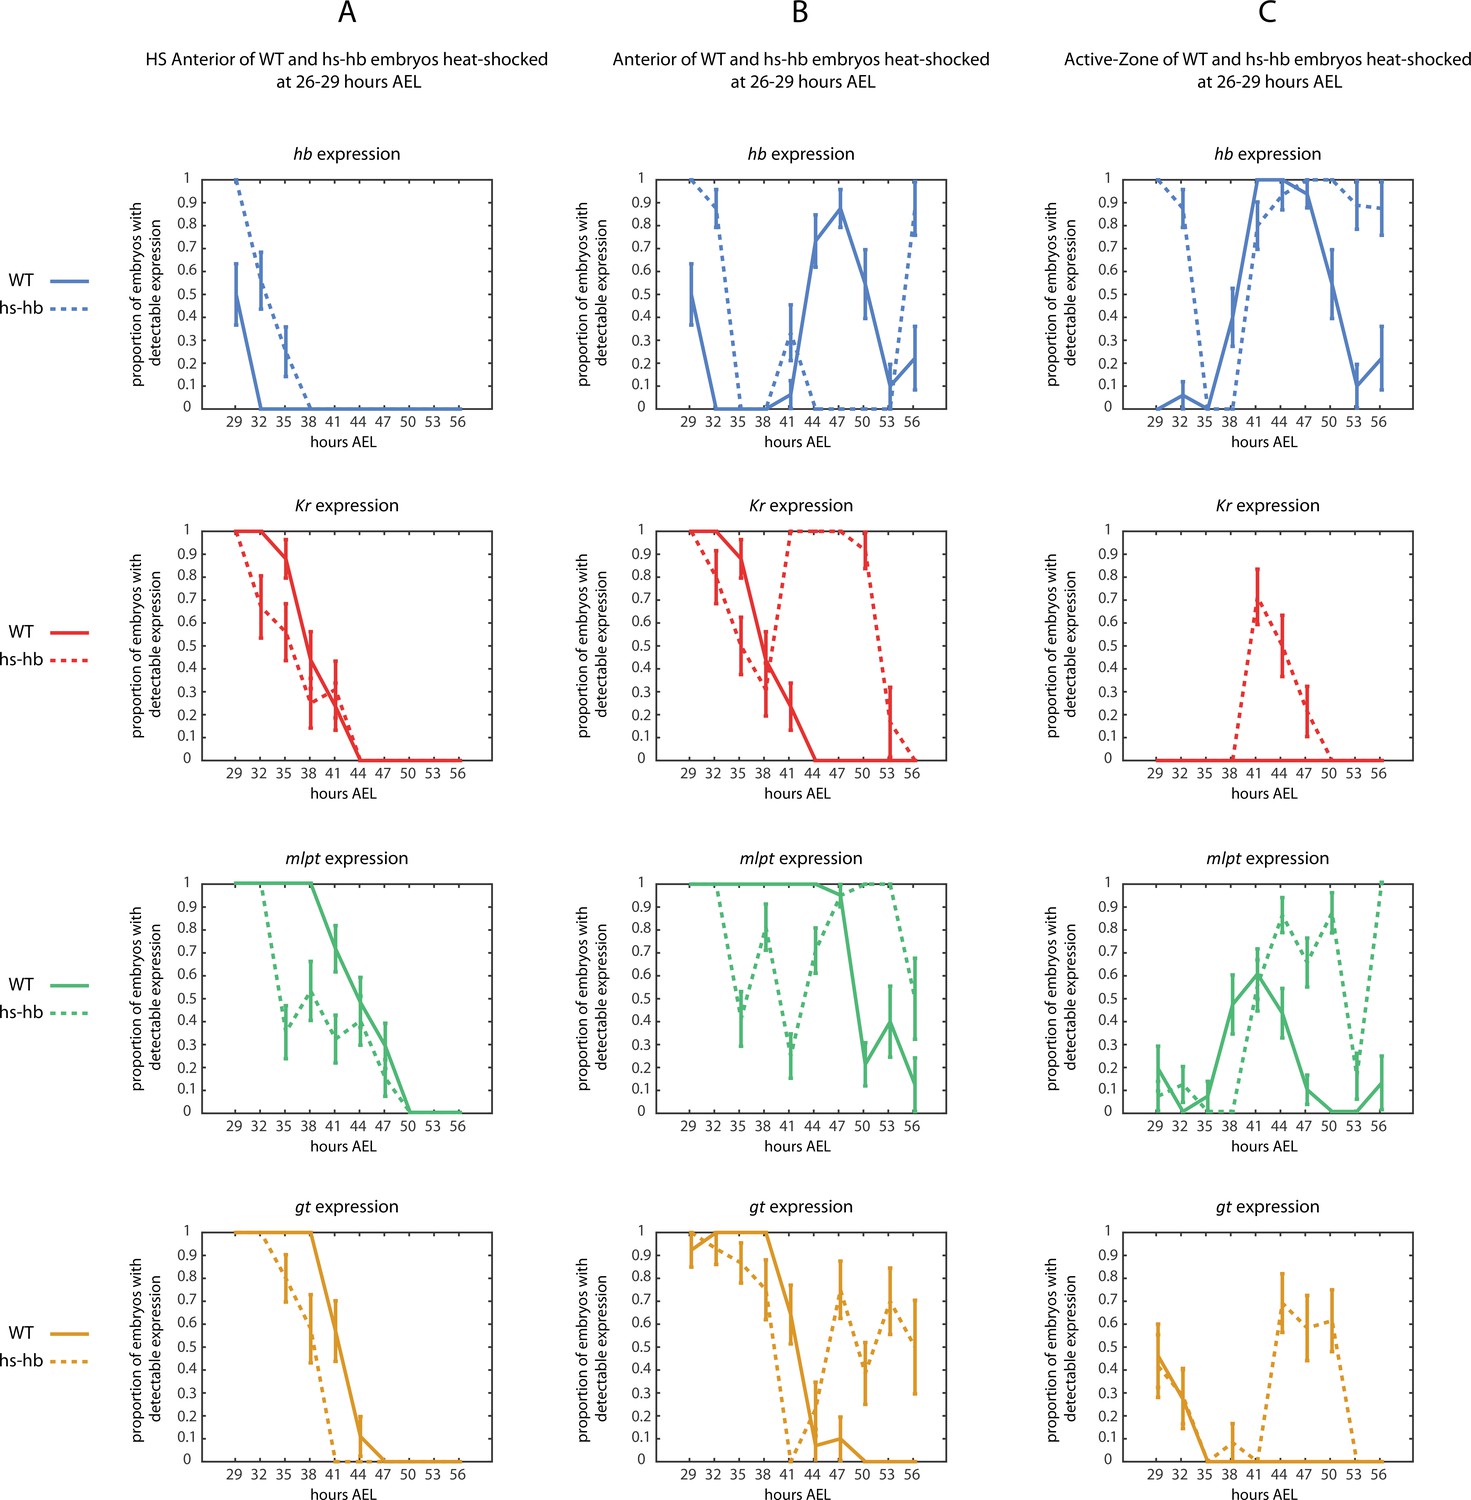
Quantification of the response of Tribolium embryos upon re-inducing hb expression at 26–29 hr AEL.
Quantified expression dynamics of gap genes hb (blue), Kr (red), mlpt (green), and gt (gold) in (A) HS Anterior, (B) Anterior, and (C) Active-Zone (see Materials and methods and Figure 4B for definitions of these regions) upon heat-shocking both WT (solid lines) and hs-hb embryos (dashed lines) at 26–29 hr AEL. y-axis represents proportion of eggs showing detectable gene expression at the designated region of the embryo (either HS Anterior, Anterior, or Active-Zone) within a timed egg collection. x-axis represents consecutive timed egg collections. Error bars represent standard error (see Materials and methods).
Figure 5 with 4 supplements
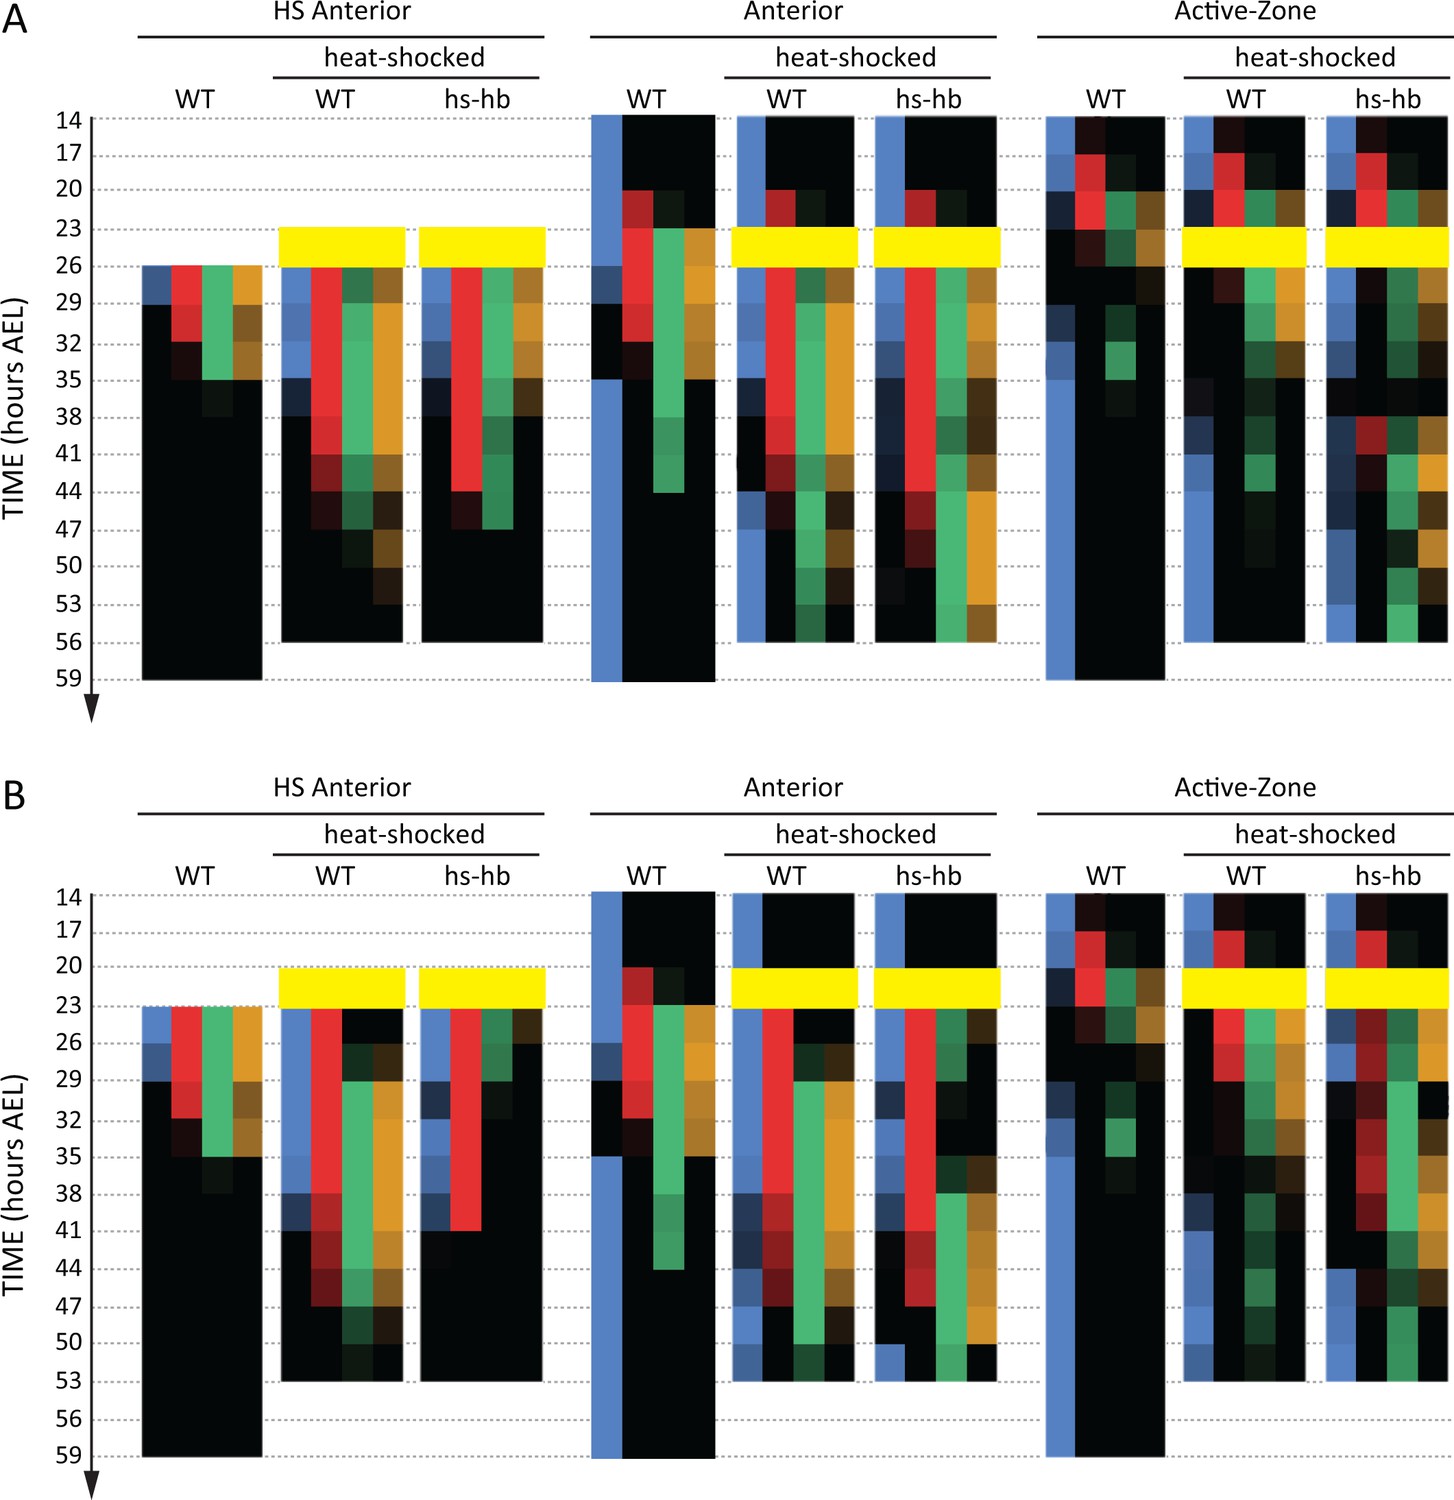
Dual response of Tribolium embryos upon re-inducing hb expression at 23–26 and 20–23 hr AEL.
Quantification (see Materials and methods) of gap gene expressions in WT, heat-shocked WT, and heat-shocked hs-hb embryos. Heat-shocks are applied at 23–26 hr AEL (A) and 20–23 hr AEL (B). Quantifications are carried out separately for HS Anterior, Anterior, and Active-Zone. While heat-shock application resulted in only a temporal delay in gap gene expression in WT, it resulted in dual response for hs-hb embryos: already established gap gene domains are pre-maturely down-regulated in HS Anterior, while the gap gene sequence is re-activated in Active-Zone. Re-induced gap gene sequence eventually propagates into Anterior. Time-windows where heat-shock is applied are shown in yellow.
-
Figure 5—source data 1
Raw numerical data of quantitative analyses for embryos heat-shocked at 23–26 hr AEL.
Listed are the percentages of embryos with detectable expression found in each region of the embryo (HS Anterior: HS-A, Anterior: A, and Active-Zone: AZ) in each egg collection in our quantitative analyses in Figure 5 (A) and Figure 5—figure supplement 2. Listed also are the numbers of embryos analyzed in each egg collection (n).
- https://doi.org/10.7554/eLife.41208.025
-
Figure 5—source data 2
Raw numerical data of quantitative analyses for embryos heat-shocked at 20–23 hr AEL.
Listed are the percentages of embryos with detectable expression found in each region of the embryo (HS Anterior: HS-A, Anterior: A, and Active-Zone: AZ) in each egg collection in our quantitative analyses in Figure 5 (B) and Figure 5—figure supplement 4. Listed also are the numbers of embryos analyzed in each egg collection (n).
- https://doi.org/10.7554/eLife.41208.026
Figure 5—figure supplement 1
Dual response of Tribolium embryos upon re-inducing hb expression at 23–26 hr AEL.
Expression dynamics of gap genes hb, Kr, mlpt, and gt upon heat-shocking both WT and hs-hb embryos at 23–26 hr AEL. Posterior to the right. HS-WT: heat-shocked WT embryos.
Figure 5—figure supplement 2
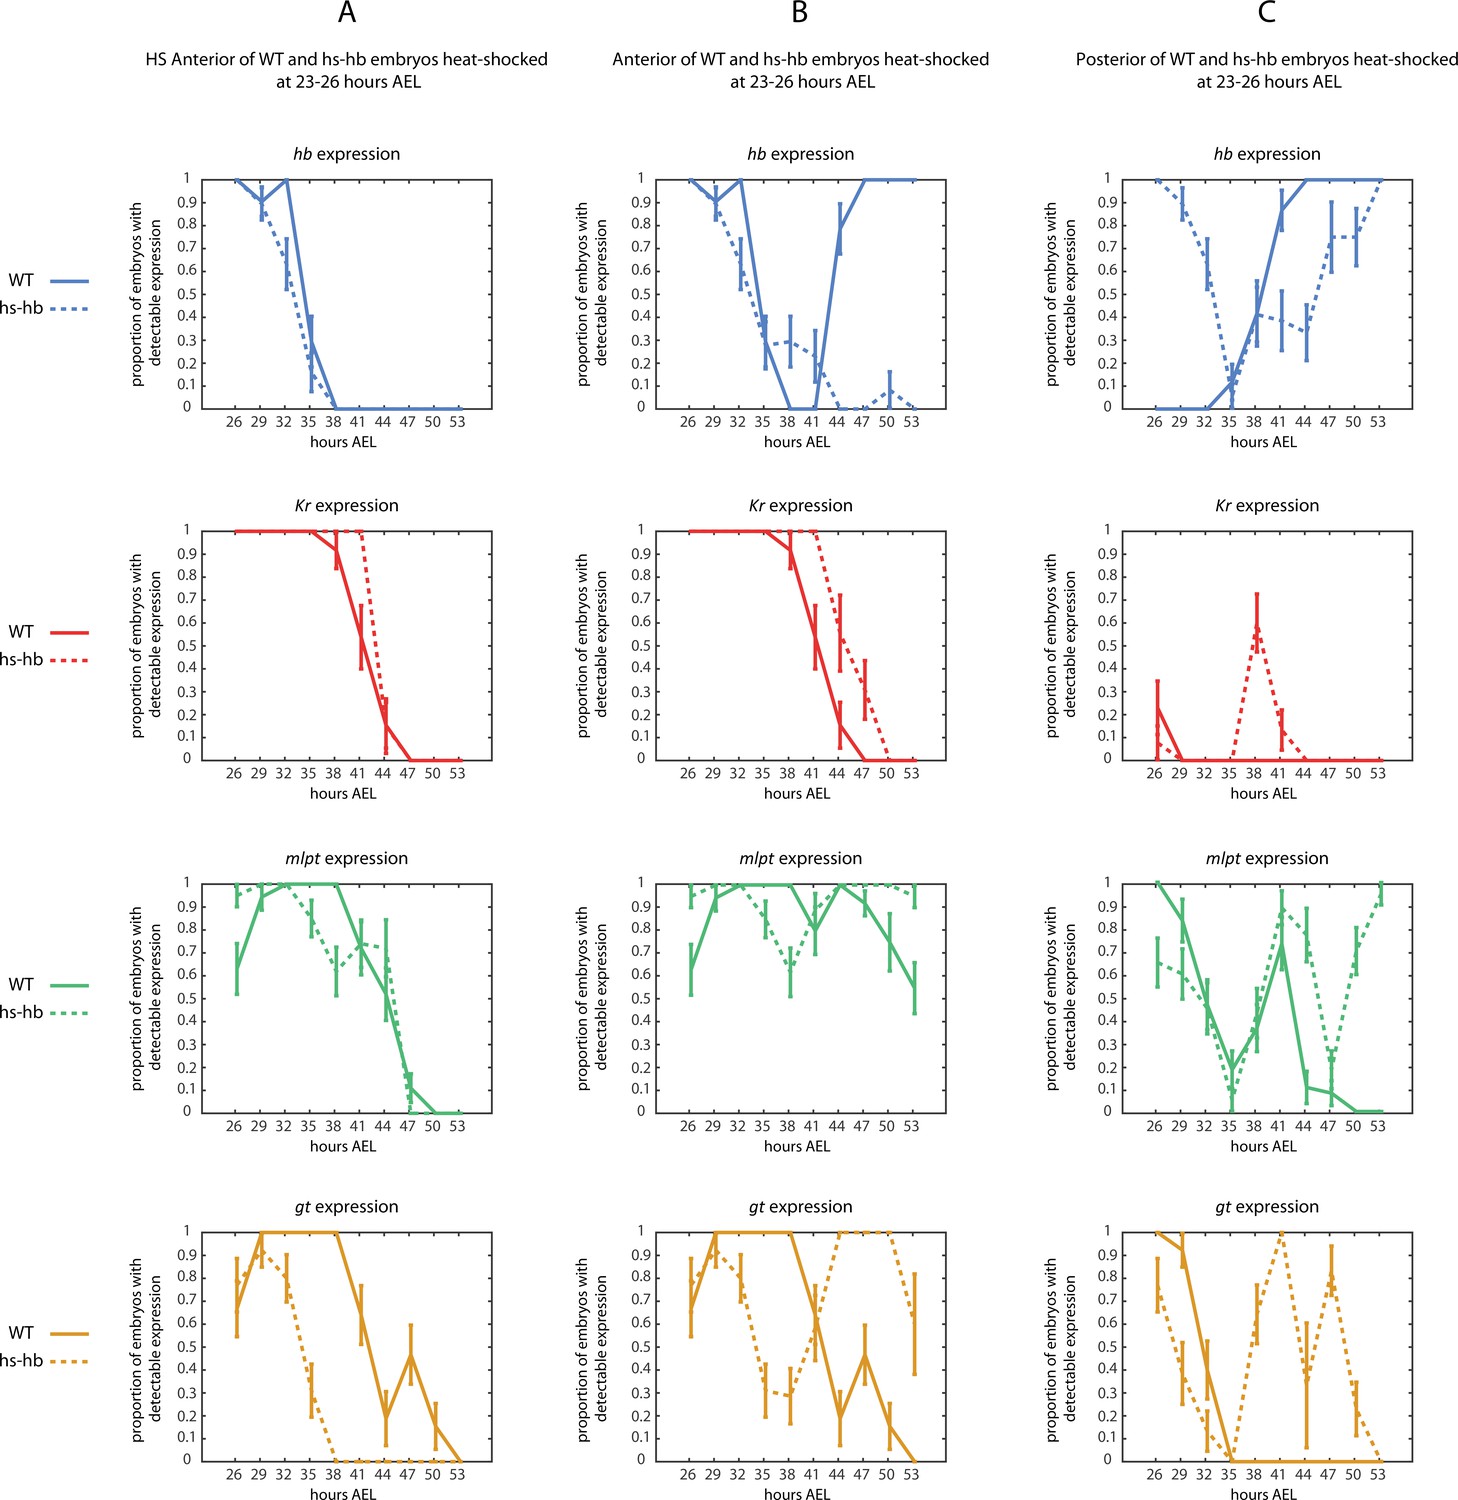
Quantification of the response of Tribolium embryos upon re-inducing hb expression at 23–26 hr AEL.
Quantified expression dynamics of gap genes hb (blue), Kr (red), mlpt (green), and gt (gold) in (A) HS Anterior, (B) Anterior, and (C) Active-Zone (see Materials and methods and Figure 4B for definitions of these regions) upon heat-shocking both WT (solid lines) and hs-hb embryos (dashed lines) at 23–26 hr AEL. y-axis represents the proportion of eggs showing detectable gene expression at the designated region of the embryo (either HS Anterior, Anterior, or Active-Zone) within a timed egg collection. x-axis represents consecutive timed egg collections. Error bars represent standard error (see Materials and methods).
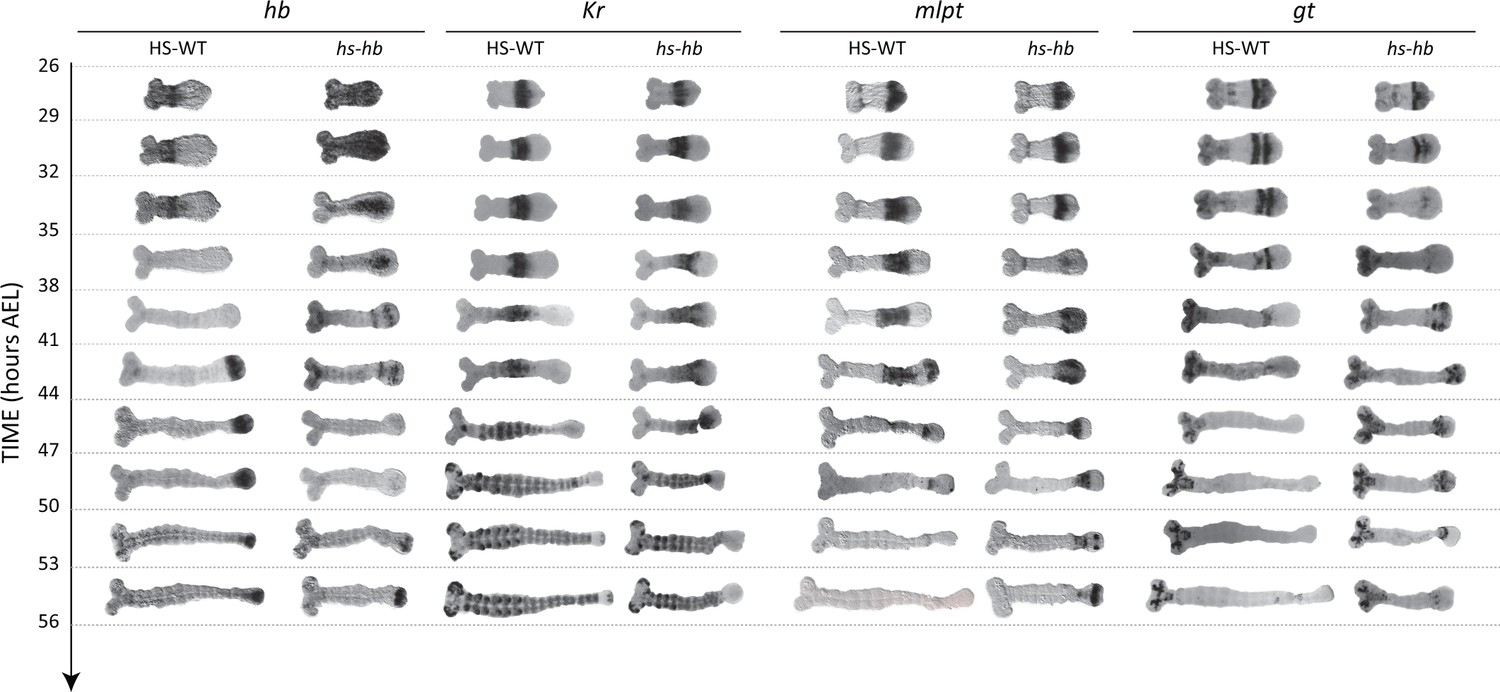
Figure 5—figure supplement 3

Dual response of Tribolium embryos upon re-inducing hb expression at 20–23 hr AEL.
Expression dynamics of gap genes hb, Kr, mlpt, and gt upon heat-shocking both WT and hs-hb embryos at 20–23 hr AEL. Posterior to the right. HS-WT: heat-shocked WT embryos.
Figure 5—figure supplement 4
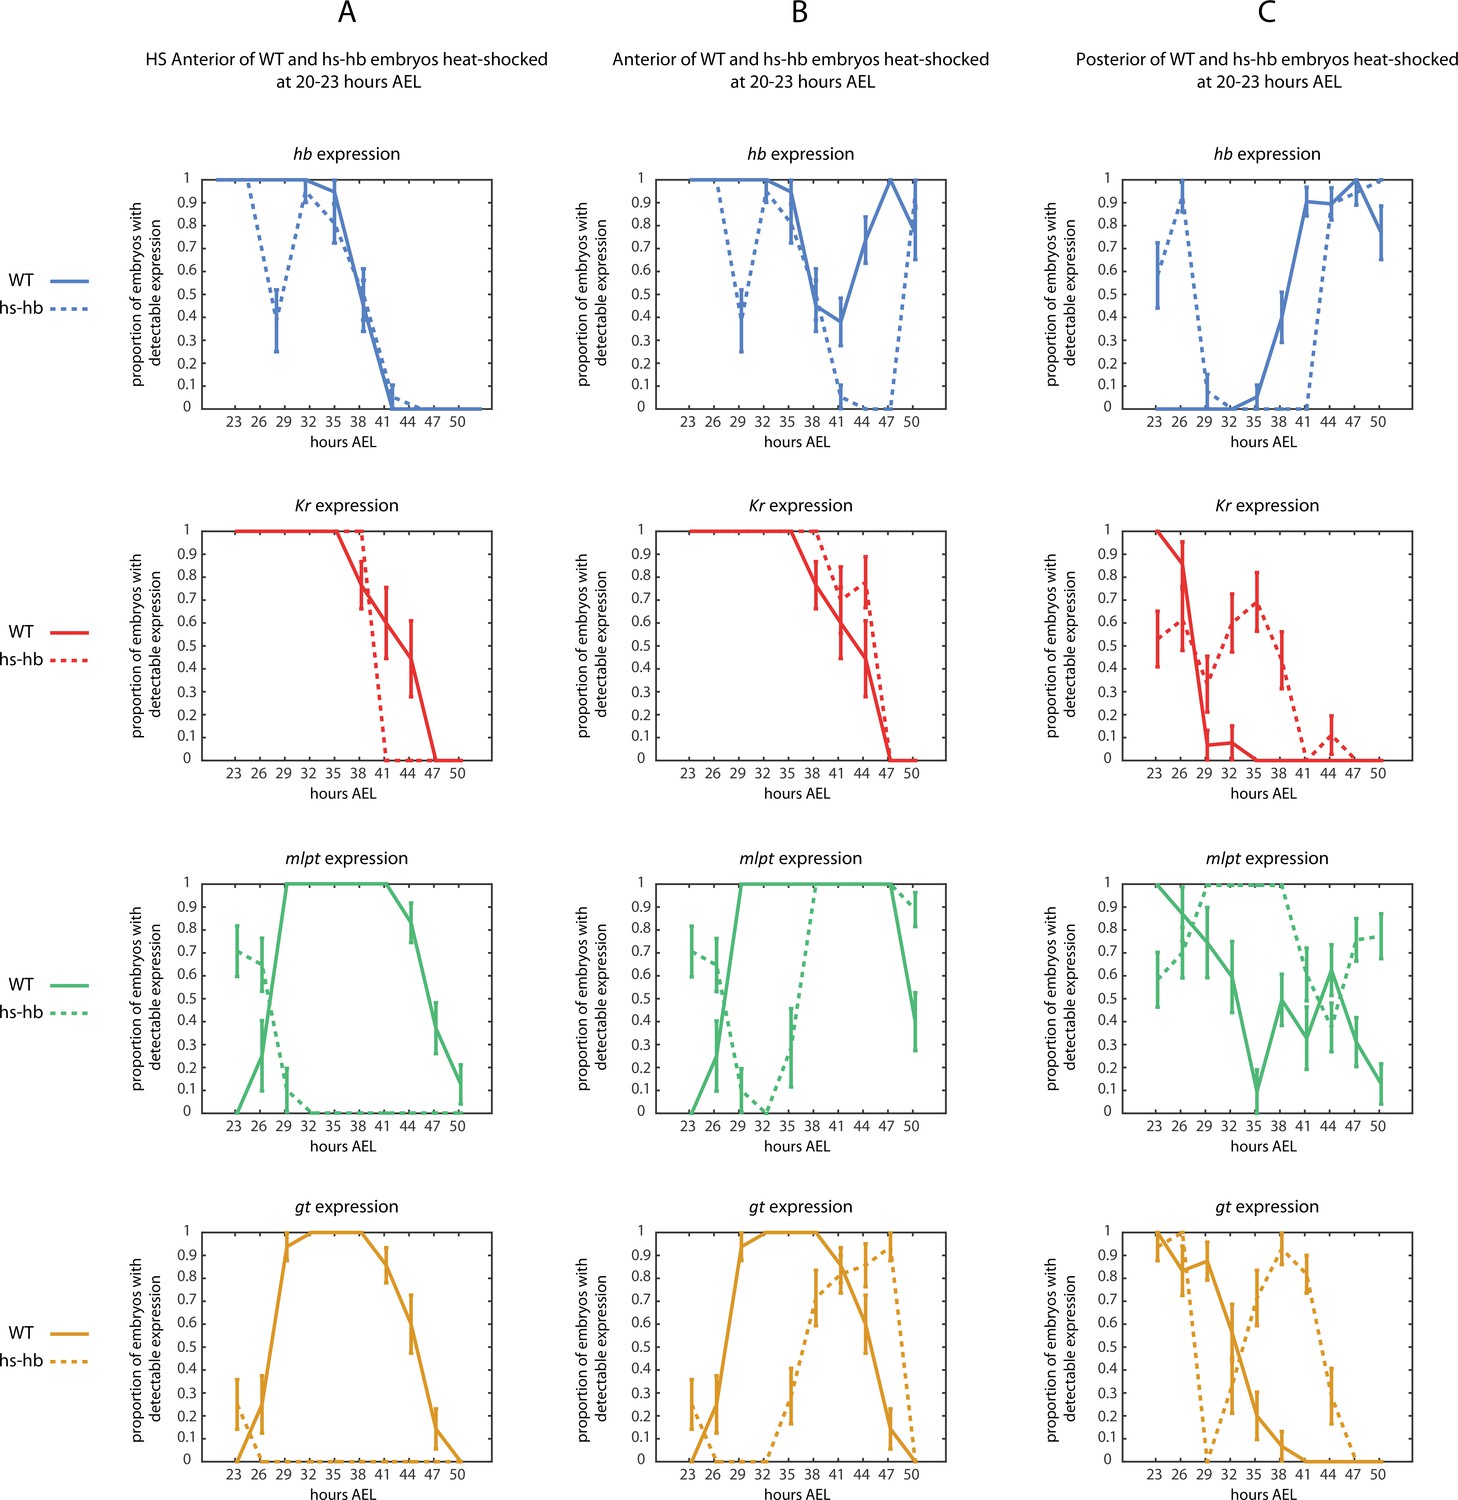
Quantification of the response of Tribolium embryos upon re-inducing hb expression at 20–23 hr AEL.
Quantified expression dynamics of gap genes hb (blue), Kr (red), mlpt (green), and gt (gold) in (A) HS Anterior, (B) Anterior, and (C) Active-Zone (see Materials and methods and Figure 4B for definitions of these regions) upon heat-shocking both WT (solid lines) and hs-hb embryos (dashed lines) at 20–23 hr AEL. y-axis represents the proportion of eggs showing detectable gene expression at the designated region of the embryo (either HS Anterior, Anterior, or Active-Zone) within a timed egg collection. x-axis represents consecutive timed egg collections. Error bars represent standard error (see Materials and methods).
Figure 6 with 1 supplement

Gap gene sequence re-activation upon re-inducing hb is specific to the active-zone.
mlpt expression is re-activated only in the active-zone (posterior cad-expressing region) upon heat-shocking hs-hb embryos (compare WT and hs-hb embryos). Knocking-down axn completely posteriorized Tribolium embryos (axn RNAi) such that nearly the entire embryo becomes a big active-zone (as evident from cad expression; see Figure 6—figure supplement 1), where mlpt expression is very dynamic and propagates across the entire embryo. Upon heat-shocking hs-hb embryos whose mothers had been injected with axn dsRNA (hs-hb; axn RNAi), mlpt expression is first activated at the posterior then propagates to cover the whole embryo, supporting the hypothesis that gap gene re-activation in specific to the cad-expressing domain (the active-zone). mlpt expresssion is tracked in green. The second trunk domain of mlpt is outlined in black. Weak expressions are shown in faint colors. Posterior to the right in all embryos shown.
Figure 6—figure supplement 1

Knocking-down axn by RNAi posteriorizes Tribolium embryos.
In WT germbands, cad is expressed in a posterior-to-anterior gradient that is spatially restricted to the posterior end of the embryo (A; see quantification of the gradient using ImageJ in A’). In axn RNAi embryos, cad gradient extends to cover most of the embryo (B; albeit still expressed in a gradient; see quantification of the gradient using ImageJ in B’). Regions of the embryo used for gradient quantification is enclosed with a yellow box.
Videos
Video 1
Computer simulation of the French Flag GRN.
A computer simulation of a 5-genes French Flag GRN (a 5-genes version of Figure 1A’’). Genes are initially expressed in sequential waves, but their expressions eventually reache a steady state. Patterning genes are shown in blue, red, green, gold, and brown. Morphogen gradient is shown in grey. Horizontal axis is space and vertical axis is gene expression concentration.
Video 2
Computer simulation of the French Flag GRN with gradient buildup dynamics.
A computer simulation of a 5-genes French Flag GRN (a 5-genes version of Figure 1A’’) with gradient buildup dynamics. Wave dynamics are more pronounced due to gradient buildup.
Video 3
Computer simulation of Speed Regulation GRN.
A computer simulation of a 5-genes Speed Regulation GRN (a 5-genes version of Figure 1B’’). Genes are expressed in sequential waves that never stabilize (except for a small region at the low end of the morphogen). Patterning genes are shown in blue, red, green, gold, and brown. Morphogen gradient is shown in grey. Horizontal axis is space and vertical axis is gene expression concentration.
Video 4
Computer simulation of Speed Regulation GRN driven by a decaying morphogen gradient.
A computer simulation of a 5-genes Speed Regulation GRN (a 5-genes version of Figure 1B’’) driven by a continuously decaying morphogen gradient (grey). Genes are expressed in sequential waves that gradually stabilize due to the morphogen gradient decay. Patterning genes are shown in blue, red, green, gold, and brown. Morphogen gradient is shown in grey. Horizontal axis is space, and vertical axis is gene expression concentration.
Video 5
Computer simulation of Speed Regulation GRN driven by a building up then decaying morphogen gradient.
A computer simulation of a 5-genes Speed Regulation GRN (a 5-genes version of Figure 1B’’) driven by a continuously building up then decaying morphogen gradient (grey).
Video 6
Speed Regulation GRN patterning the Anterior-Posterior axis of short-germ, intermediate-germ and long-germ insects.
A computer simulation of fate specification in insects with different germ types using a 5-genes Speed Regulation GRN. (A) In short-germ insects, the posterior morphogen (grey) continuously retracts towards posterior with axis elongation. (B) In intermediate-germ insects, the posterior morphogen is initially expressed in a static gradient that eventually retracts towards posterior with axis elongation. (C) In long-germ insects, the posterior morphogen is expressed in a static gradient throughout the patterning process. Patterning genes are shown in blue, red, green, gold, and brown. Posterior morphogen gradient is shown in grey. Horizontal axis represents the Anterior-Posterior axis. Posterior to the right. Vertical axis is gene expression concentration.
Video 7
French Flag with a Timer Gene GRN patterning the Anterior-Posterior axis of short-germ, intermediate-germ and long-germ insects.
A computer simulation of fate specification in insects with different germ types using a 5-genes French Flag with a Timer Gene GRN. (A) In short-germ insects, the posterior morphogen (grey) continuously retracts towards posterior with axis elongation. (B) In intermediate-germ insects, the posterior morphogen is initially expressed in a static gradient that eventually retracts towards posterior with axis elongation. (C) In long-germ insects, the posterior morphogen is expressed in a static gradient throughout the patterning process. Patterning genes are shown in blue, red, green, gold, and brown. Posterior morphogen gradient is shown in grey. Timer Gene is shown in black. Horizontal axis represents the Anterior-Posterior axis. Posterior to the right. Vertical axis is gene expression concentration.
Video 8
Re-inducing the leading gene in the Speed Regulation GRN during intermediate-germ patterning.
Re-inducing the leading gene (blue) in the Speed Regulation GRN during a simulation of intermediate-germ patterning results in dual response: already established genes in the anterior are down-regulated, while the sequential activation of genes is reset within the expression domain of the posterior morphogen (grey). Patterning genes are shown in blue, red, green, gold, and brown. Posterior morphogen gradient is shown in grey. Horizontal axis represents the Anterior-Posterior axis. Posterior to the right. Vertical axis is gene expression concentration.
Video 9
Re-inducing the leading gene in the French Flag with a Timer Gene GRN during intermediate-germ patterning.
Re-inducing the leading gene (blue) in the French Flag with a Timer Gene GRN during a simulation of intermediate-germ patterning results in a transient dominance of the leading gene, but eventual formation of the normal gene expression pattern. Patterning genes are shown in blue, red, green, gold, and brown. Posterior morphogen gradient is shown in grey. Horizontal axis represents the Anterior-Posterior axis. Posterior to the right. Vertical axis is gene expression concentration.
Video 10
Simulation of GRN realizing the Speed Regulation model by jointly modulating gene activity and gene product decay rates.
A computer simulation of the Speed Regulation model realized by jointly modulating gene activity and gene products decay rates (described in Appendix 1) applied to the problem of patterning the anterior-posterior axis of an intermediate-germ insect. Patterning genes are shown in blue, red, green, gold, and brown. Posterior morphogen gradient is shown in grey. Horizontal axis represents the Anterior-Posterior axis. Posterior to the right. Vertical axis is gene expression concentration.
Video 11
Re-inducing the leading gene in the Speed Regulation GRN realization by jointly modulating gene activity and gene products decay rates during intermediate-germ patterning.
Re-inducing the leading gene (blue) in the Speed Regulation GRN realization by jointly modulating gene activity and gene products decay rates during a simulation of intermediate-germ patterning results resetting the sequential activation of patterning genes within the expression of the posterior morphogen (grey) but leaves the already established gene expression in the anterior intact. Patterning genes are shown in blue, red, green, gold, and brown. Posterior morphogen gradient is shown in grey. Horizontal axis represents the Anterior-Posterior axis. Posterior to the right. Vertical axis is gene expression concentration.
Video 12
Simulation of axn RNAi and hs-hb; axn RNAi phenotypes in Tribolium.
Shown are simulations of the SR model in simulated (A) axn RNAi background and (B) hs-hb; axn RNAi in Tribolium. The axn RNAi phenotype is simulated by not retracting the cad gradient (grey).
Tables
Key resources table
| Reagent type (species) or resource | Designation | Source or reference | Identifiers | Additional information |
|---|---|---|---|---|
| Strain (Tribolium castaneum) | San Bernardino WT (SB) | NA | NA | Most Tribolium labs (including El-Sherif and Klinger labs) |
| Strain background (Tribolium castaneum) | vermilion white v(w) | NA | NA | Most Tribolium labs (including El-Sherif and Klinger labs) |
| Recombinant DNA reagent | pBac[3xP3-v; Tc'hsp68-Tc’hb-Tc'hsp68 3’UTR] | NA | NA | Klingler lab |
Additional files
-
Supplementary file 1
Matlab implementation of models and simulations.
- https://doi.org/10.7554/eLife.41208.032
-
Transparent reporting form
- https://doi.org/10.7554/eLife.41208.033
Download links
A two-part list of links to download the article, or parts of the article, in various formats.
Downloads (link to download the article as PDF)
Open citations (links to open the citations from this article in various online reference manager services)
Cite this article (links to download the citations from this article in formats compatible with various reference manager tools)
A re-inducible gap gene cascade patterns the anterior–posterior axis of insects in a threshold-free fashion
eLife 7:e41208.
https://doi.org/10.7554/eLife.41208


