Dengue genetic divergence generates within-serotype antigenic variation, but serotypes dominate evolutionary dynamics
- Fred Hutchinson Cancer Research Center, United States
- University of Washington, United States
- University of California, Berkeley, United States
- University of Florida, United States
Figures
Figure 1 with 1 supplement
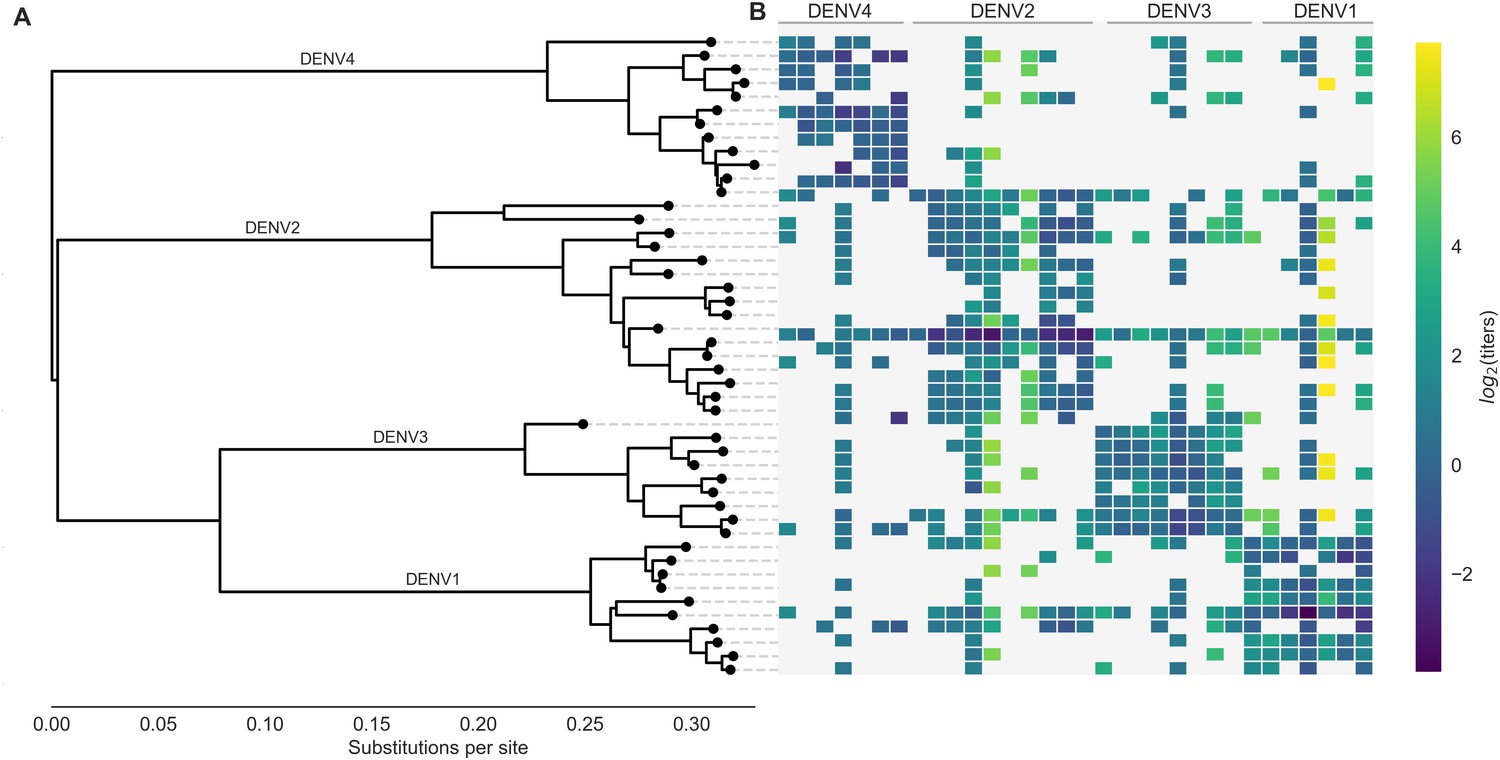
Phylogeny of dengue virus sequences and normalized antigenic distances.
(A) Maximum likelihood phylogeny of the E (envelope) gene from titered dengue viruses. Notably, each of the four serotypes contains substantial genetic diversity. (B) Pairwise antigenic distances were estimated by Katzelnick et al. (2015) using plaque reduction neutralization titers (PRNT50, see Materials and methods). Aggregated titer values are standardized such that the distance between autologous virus-serum pairs is 0, and each titer unit corresponds to a two-fold change in PRNT50 value. Light gray areas represent missing data. Larger values correspond to greater antigenic distance.
Figure 1—figure supplement 1
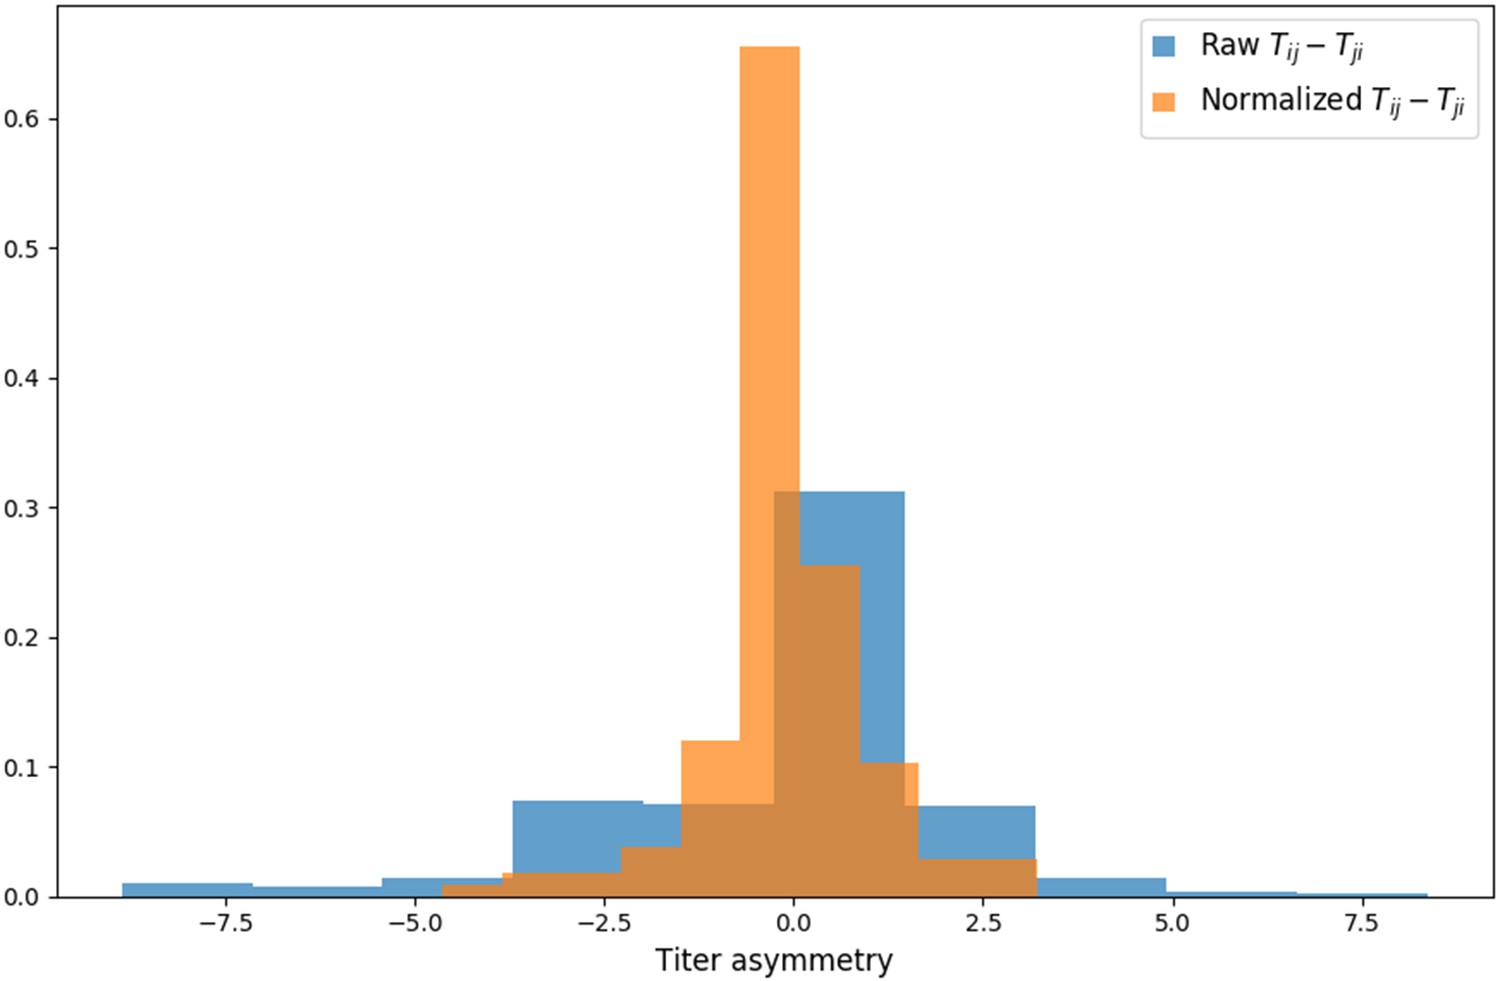
Titer value symmetry.
Some viruses have greater avidity overall, and some sera are more potent overall. We normalize for these row and column effects ( and , respectively) in the titer model. Once overall virus avidity and serum potency are accounted for, titers are roughly symmetric (i.e., ).
Figure 2 with 2 supplements
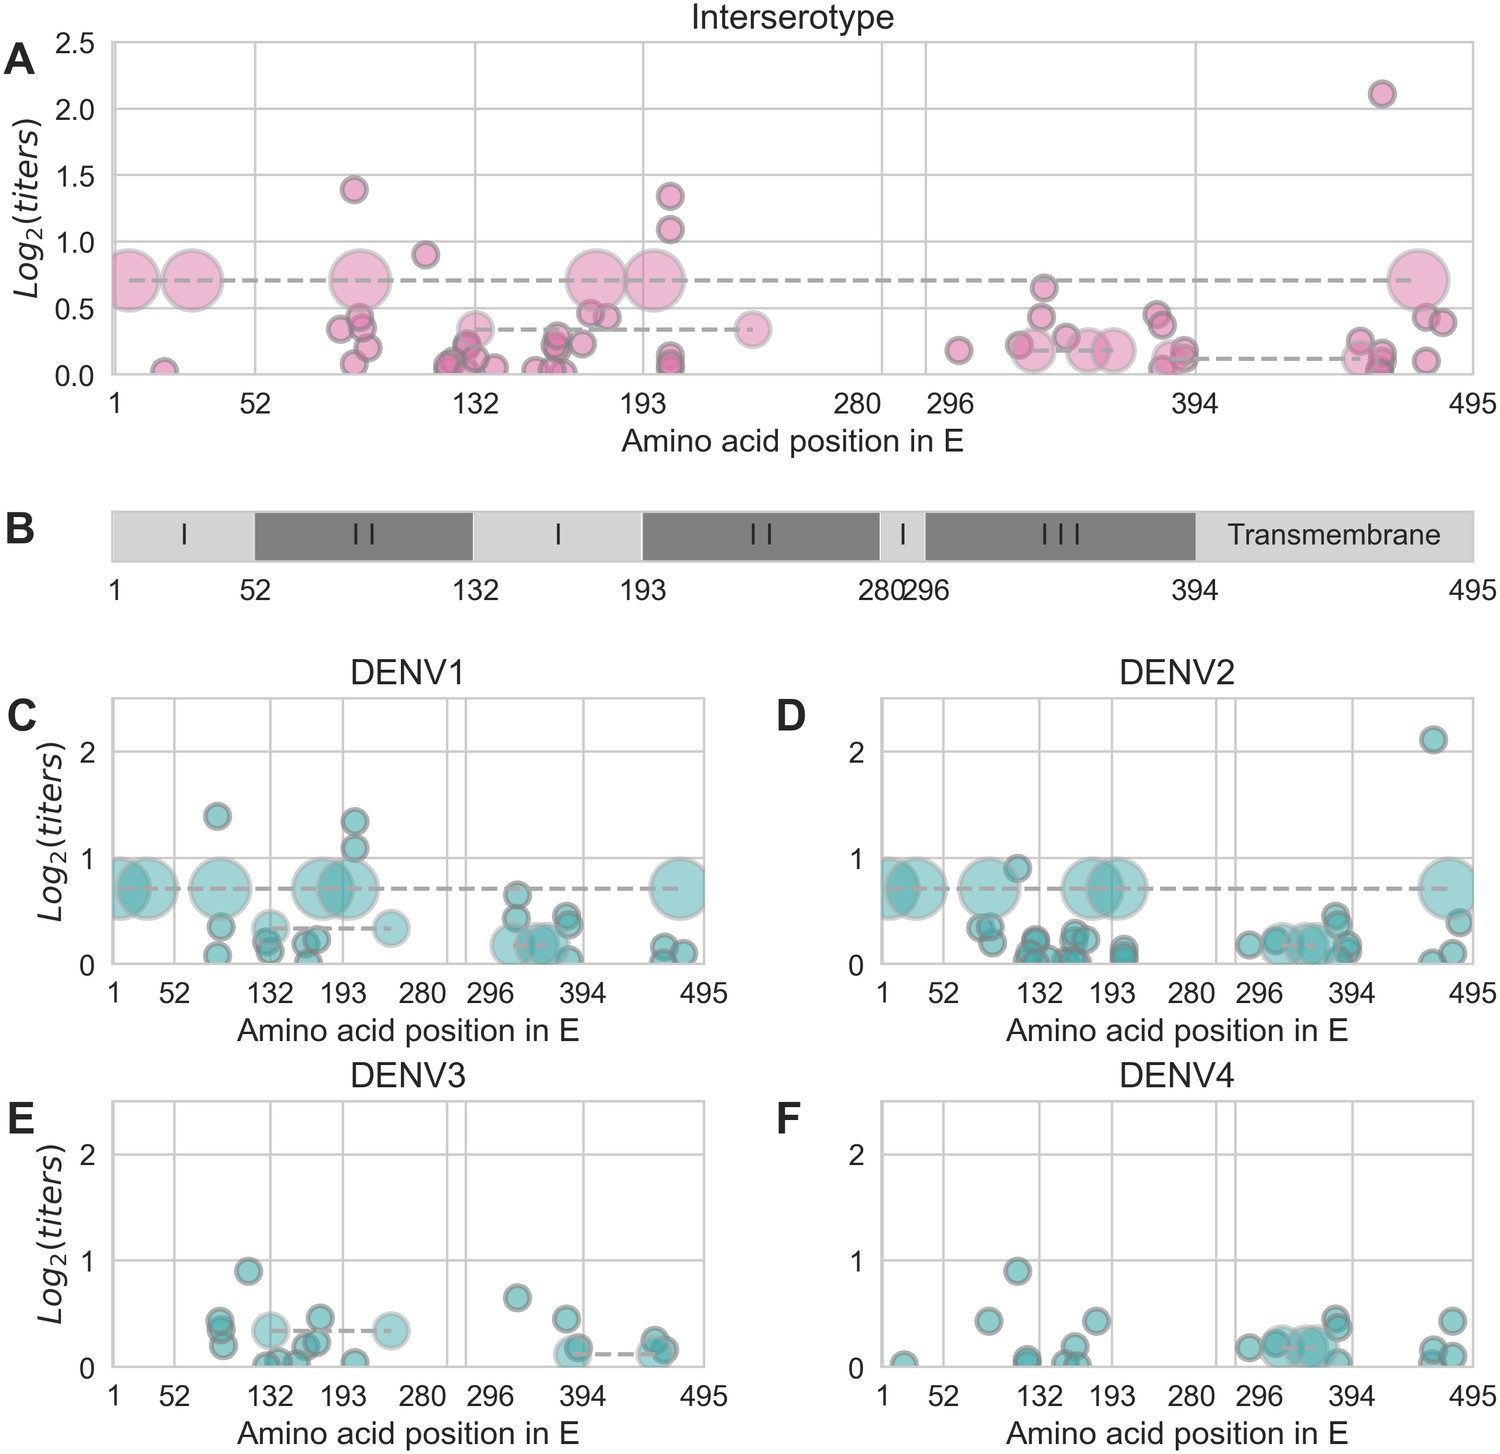
Distribution and effect size of antigenic mutations.
Each point represents one antigenically relevant mutation or colinear mutation cluster. Clustered mutations are connected with dashed lines with point size proportionate to cluster size (N = 2–6). The x axis indicates mutations’ position in E, relative to each functional domain as noted in (B). The y axis indicates antigenic effect size.
Figure 2—figure supplement 1
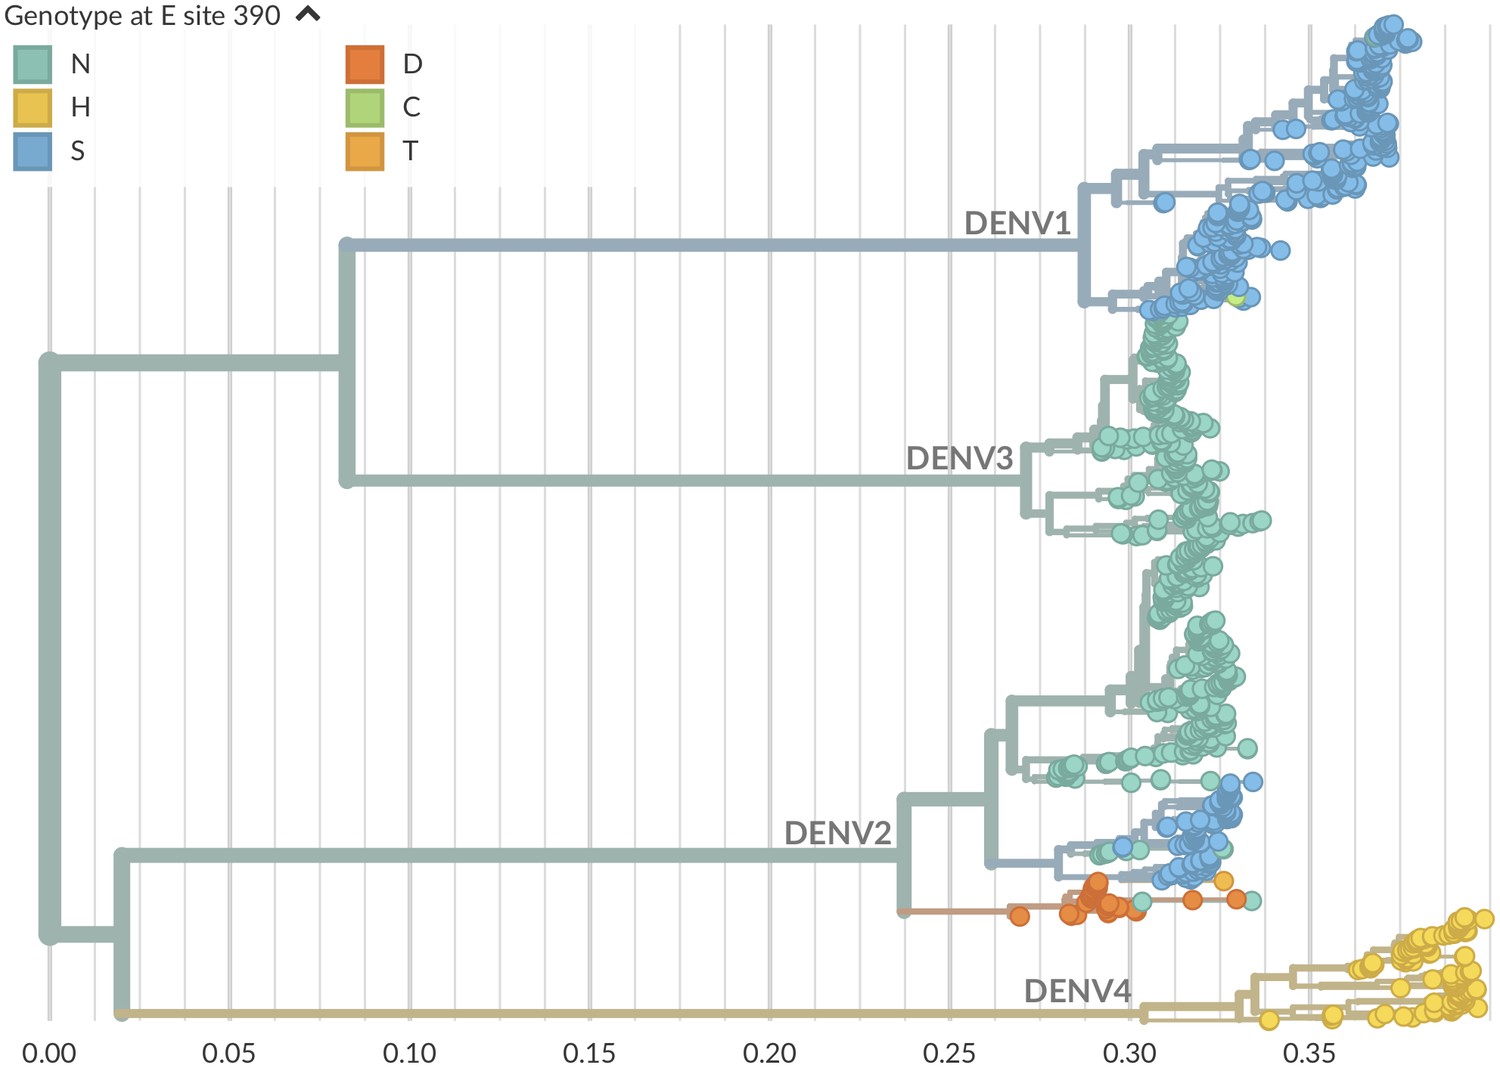
Genotype as site E 390 across dengue phylogeny.
Dengue virus genotypes can be seen on Nextstrain (Hadfield et al., 2018). A live view of this figure is available at nextstrain.org/dengue/.
Figure 2—figure supplement 2
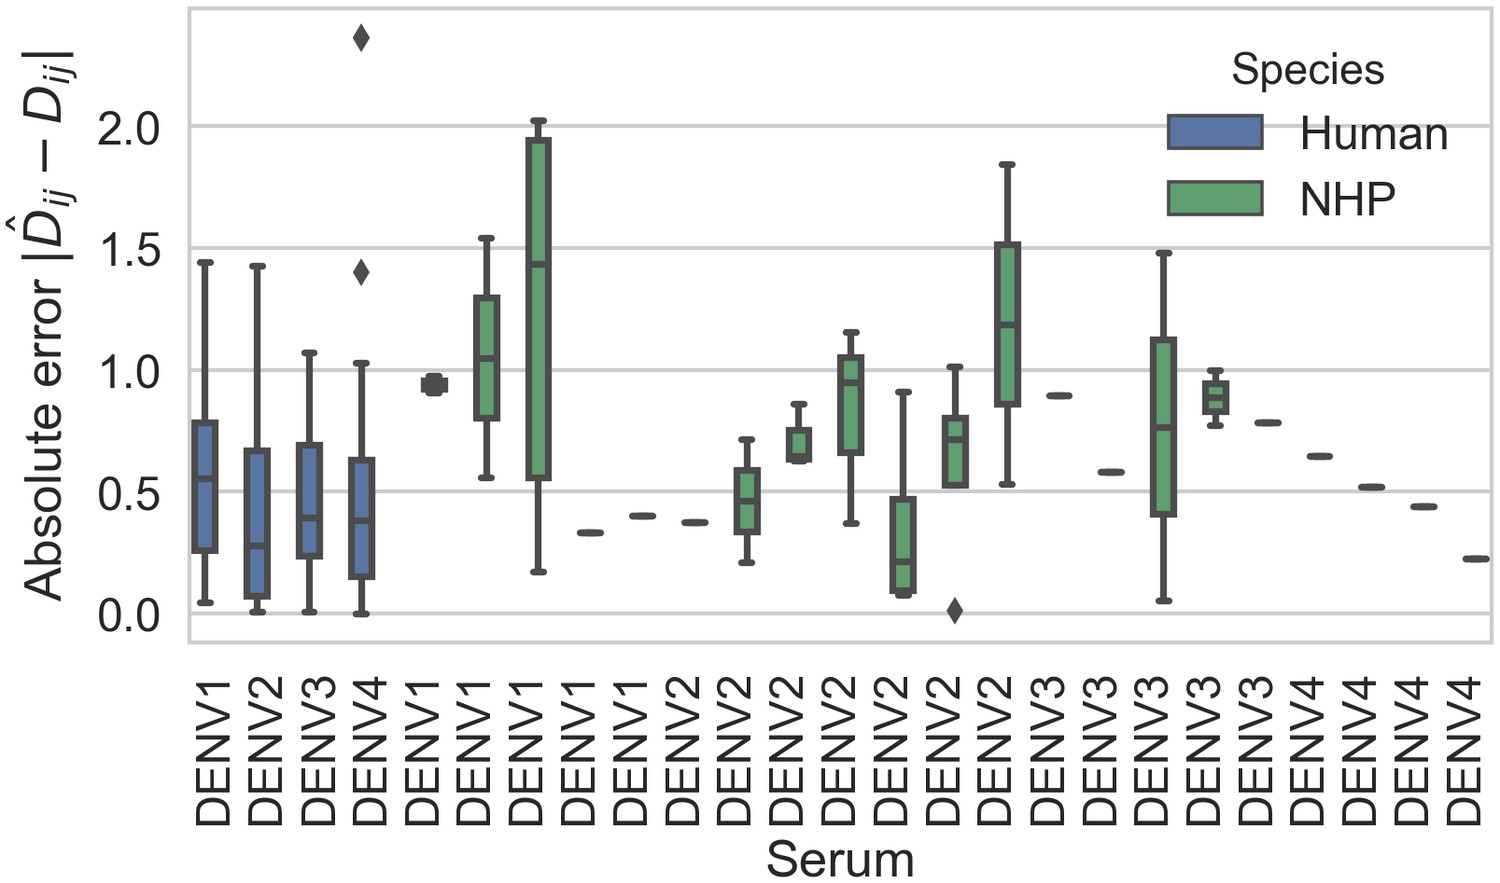
Titer prediction error by serum strain and species.
Human sera was raised against four different virus strains (the monovalent vaccine components); non-human primate (NHP) sera was raised against many different virus strains. Here, we excluded NHP sera raised against the monovalent vaccine components, such that each normalized titer measurement is aggregated across individuals, but not across species. We report the out-of-sample titer prediction error for each serum strain (versus all available test viruses), aggregated across 100-fold Monte Carlo cross-validation.
Figure 3
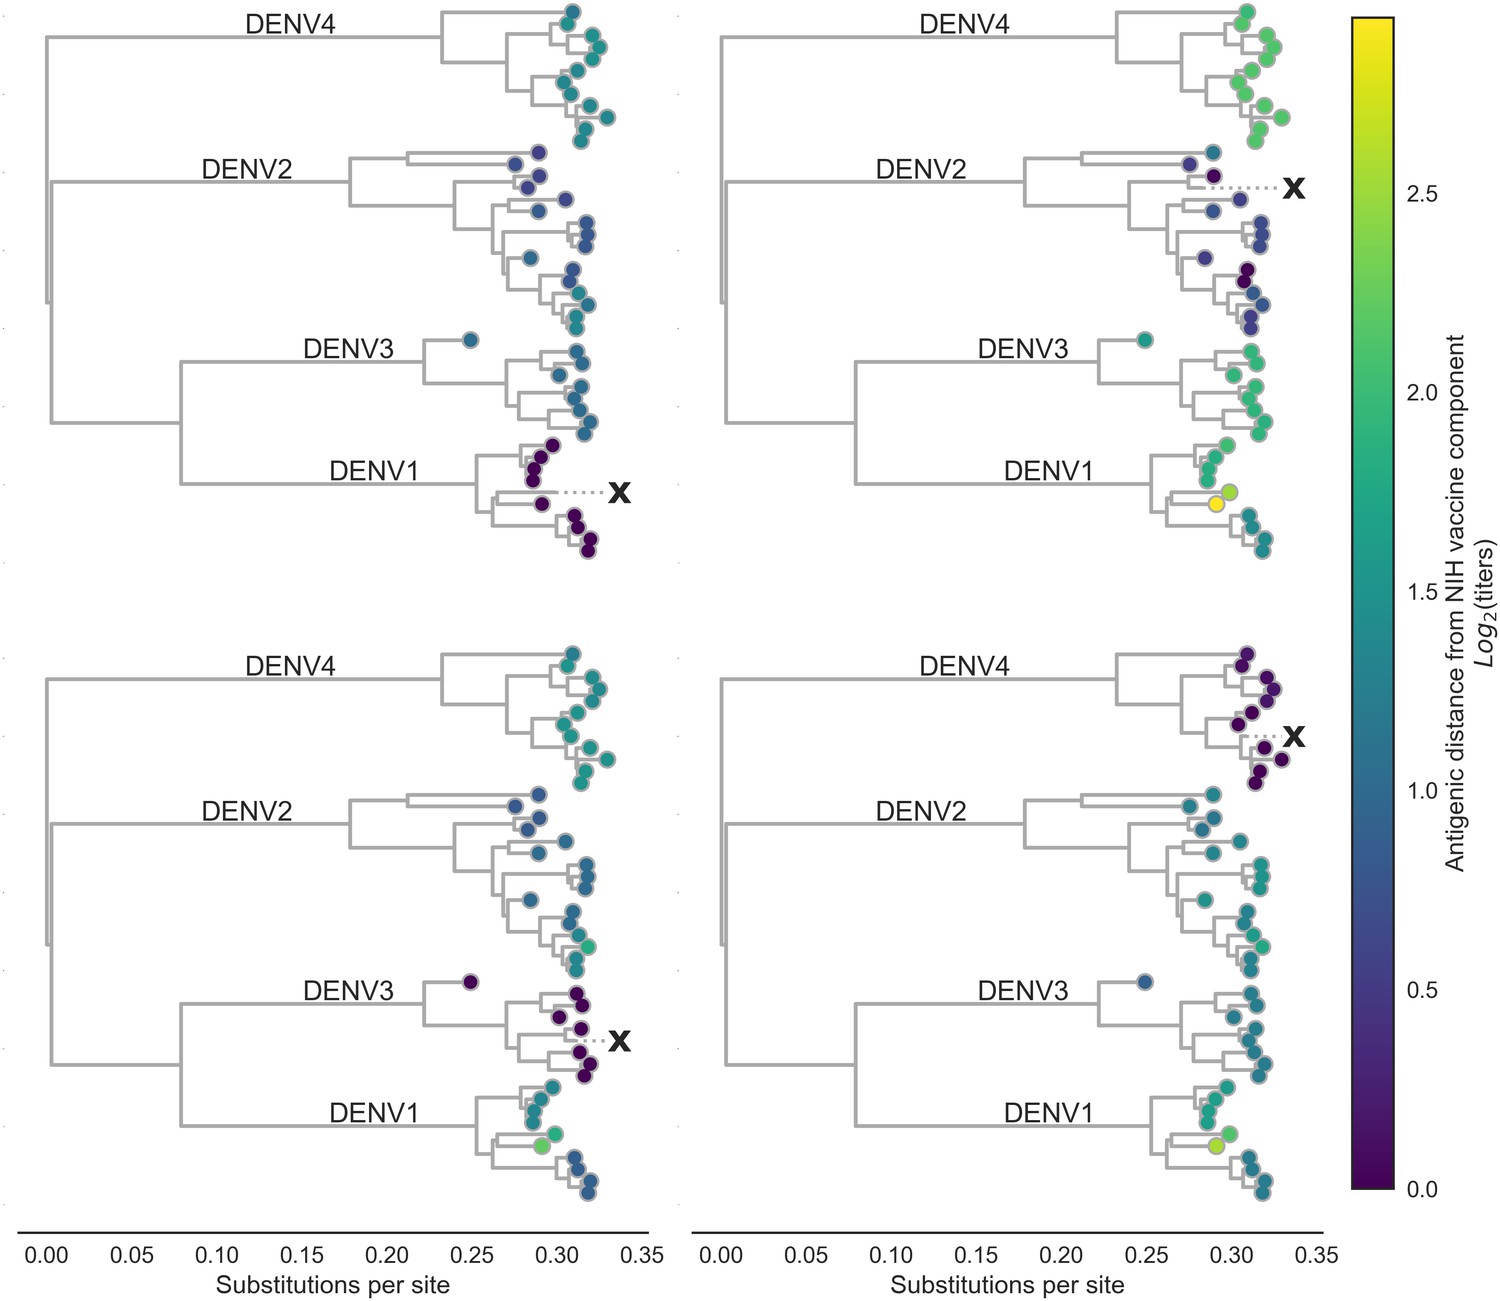
Antigenic distance from NIH vaccine strains.
By assigning a discrete increment of antigenic change to each mutation, we can estimate the asymmetrical antigenic distance between any serum strain and test virus strain based on their genetic differences. Here, we show the estimated antigenic distance between serum raised against each monovalent component of the NIH vaccine candidate (indicated as ‘X’) and each test virus in the tree.
Figure 4
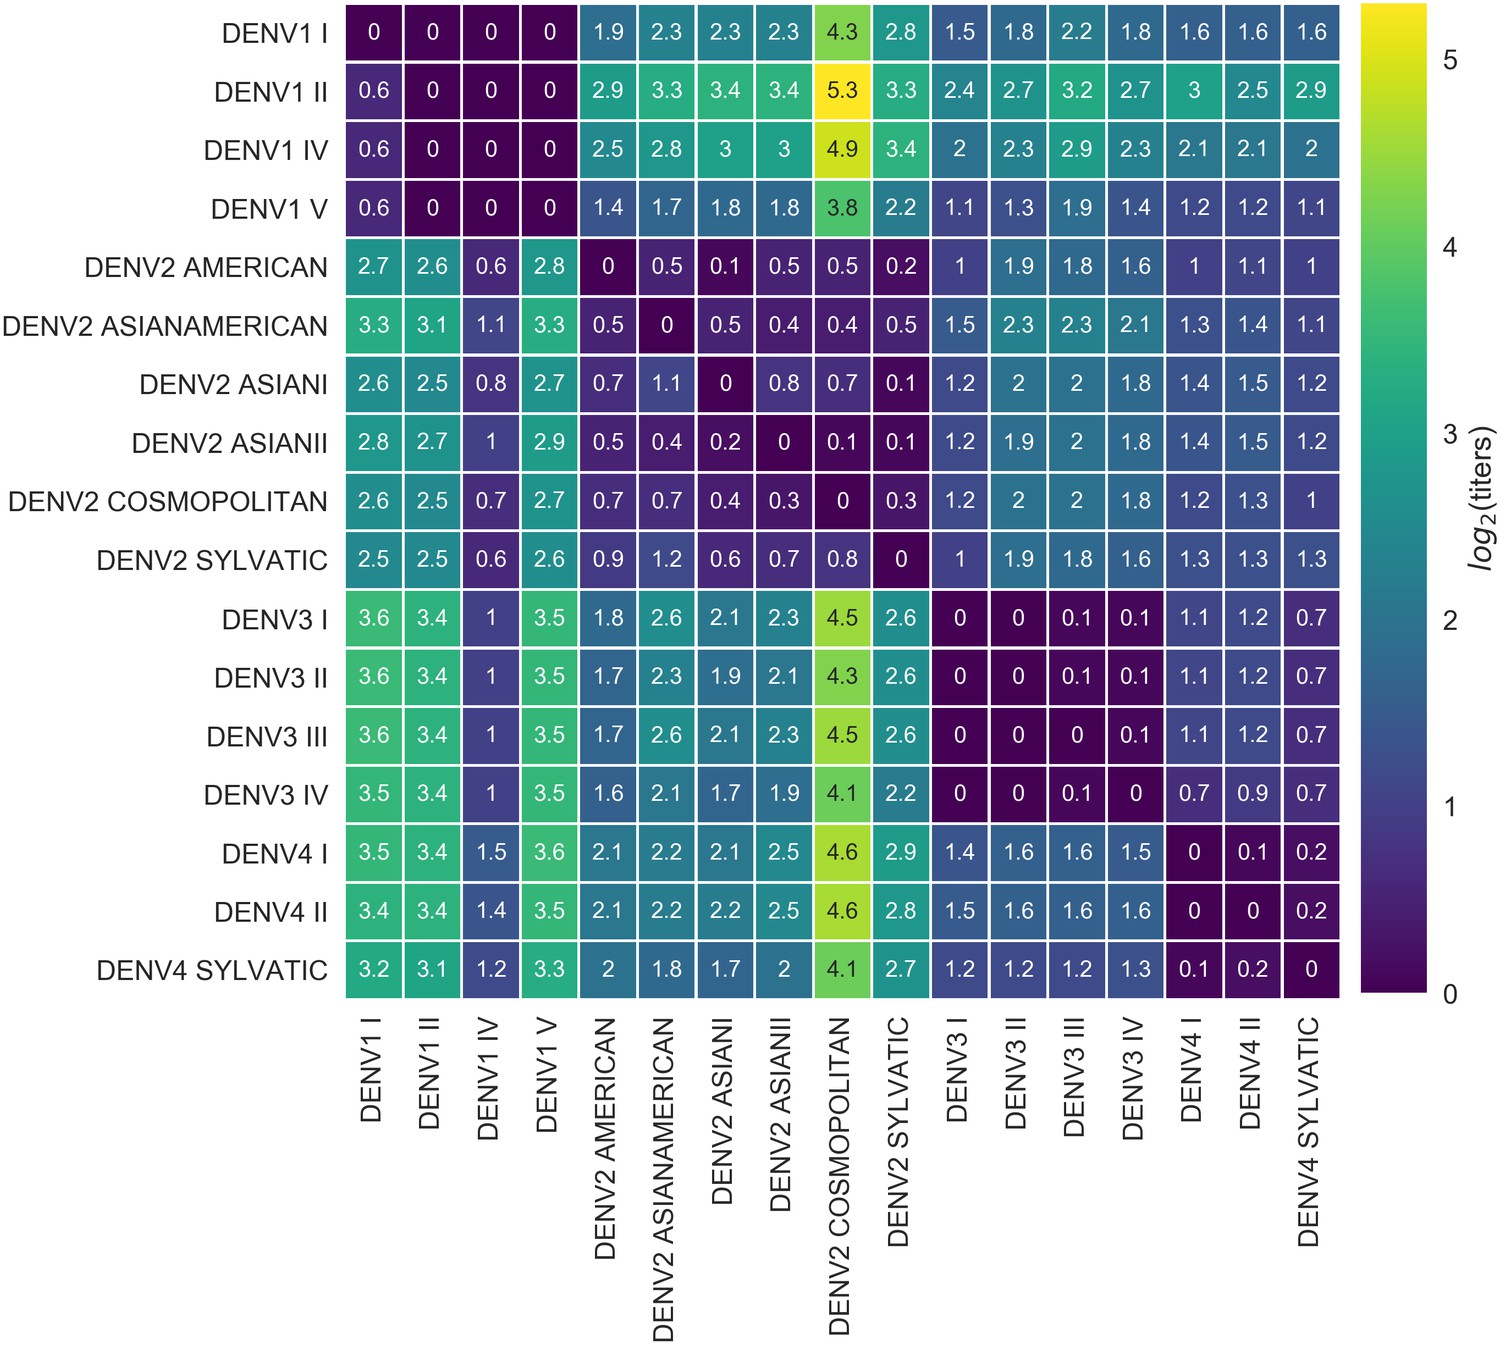
Titer distance by genotype.
Values represent the mean interpolated antigenic distance between canonical dengue genotypes (in standardized log titer units). Columns represent sera; rows represent test viruses.
Figure 5 with 3 supplements
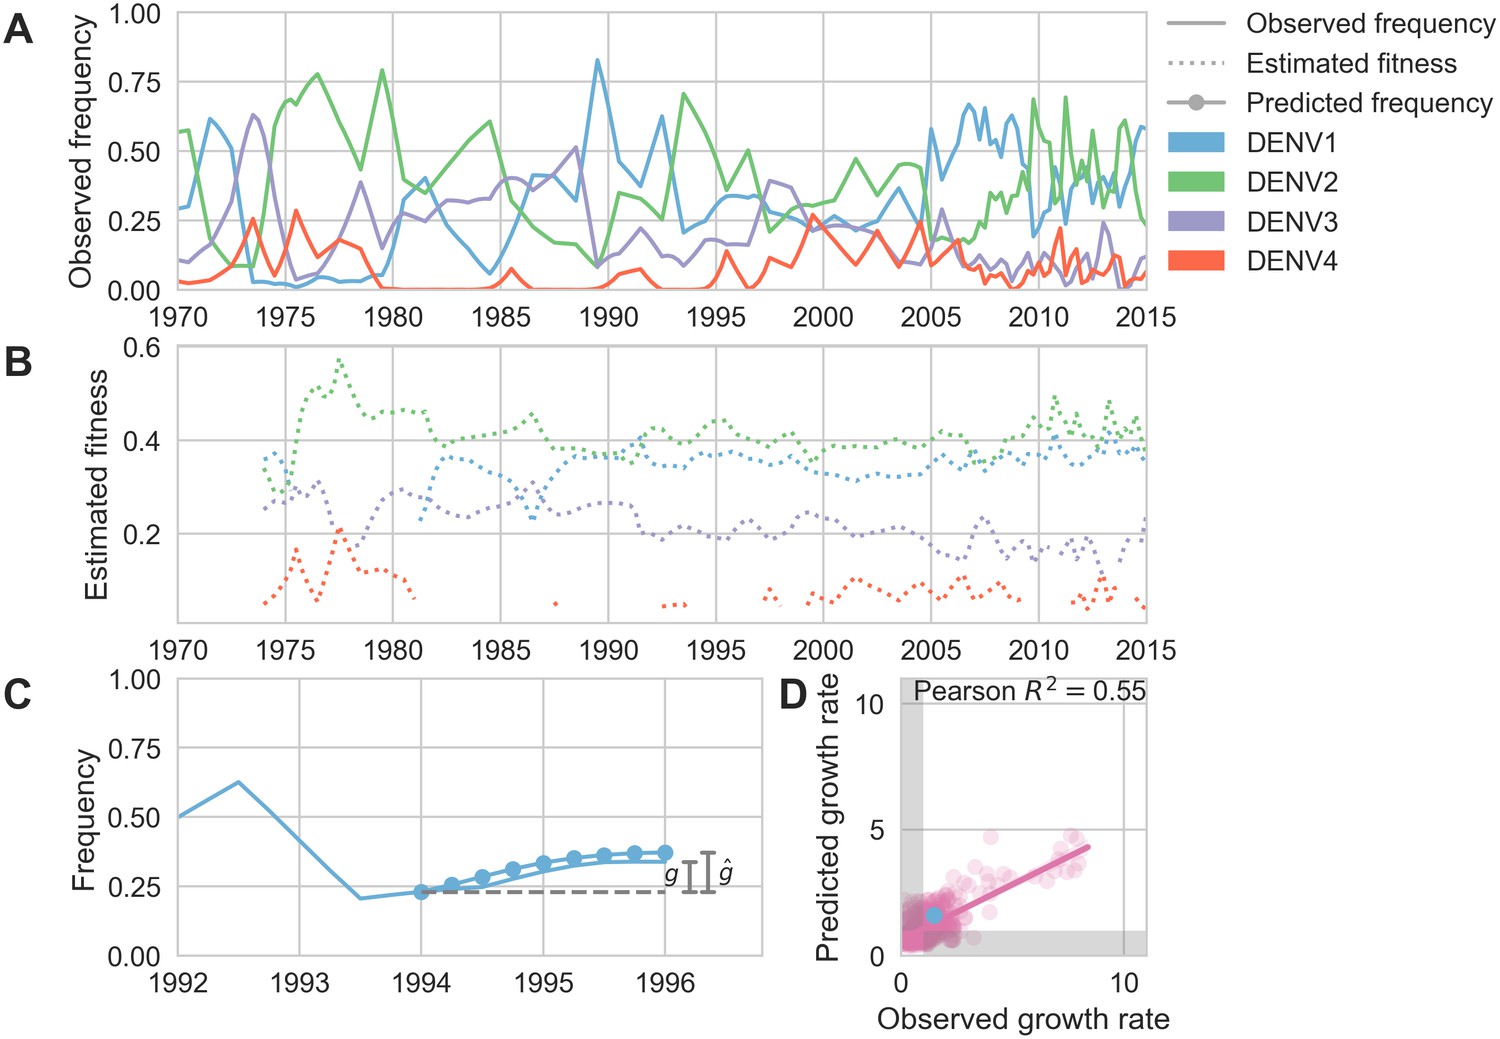
Antigenic novelty predicts serotype success.
(A) The relative frequency of each serotype, , in Southeast Asia estimated every 3 months based on available sequence data. (B) Total fitness of each serotype. We calculate antigenic fitness for each serotype over time as its frequency-weighted antigenic distance from recently circulating viruses. We then add this to a time-invariant intrinsic fitness value to calculate total fitness. (C) DENV1 frequencies between 1994 and 1996 alongside model projection. At each timepoint , we blind the model to all empirical data from timepoints later than and predict each serotype’s future trajectory based on its initial frequency, time-invariant intrinsic fitness, and antigenic fitness at time (Materials and methods, Equation 11). We predict forward in 3-month increments for a total prediction period of years. At each increment, we use the current predicted frequency to adjust our estimates of antigenic fitness on a rolling basis (Materials and methods, Equation 15). (D) Predicted growth rates, , compared to empirically observed growth rates, . Predicted and empirical growth rate of the example illustrated in (C) is shown in (D) as the blue point. Serotype growth versus decline is accurate (i.e. the predicted and actual growth rates are both or both , all points outside the gray area) for 66% of predictions.
Figure 5—figure supplement 1
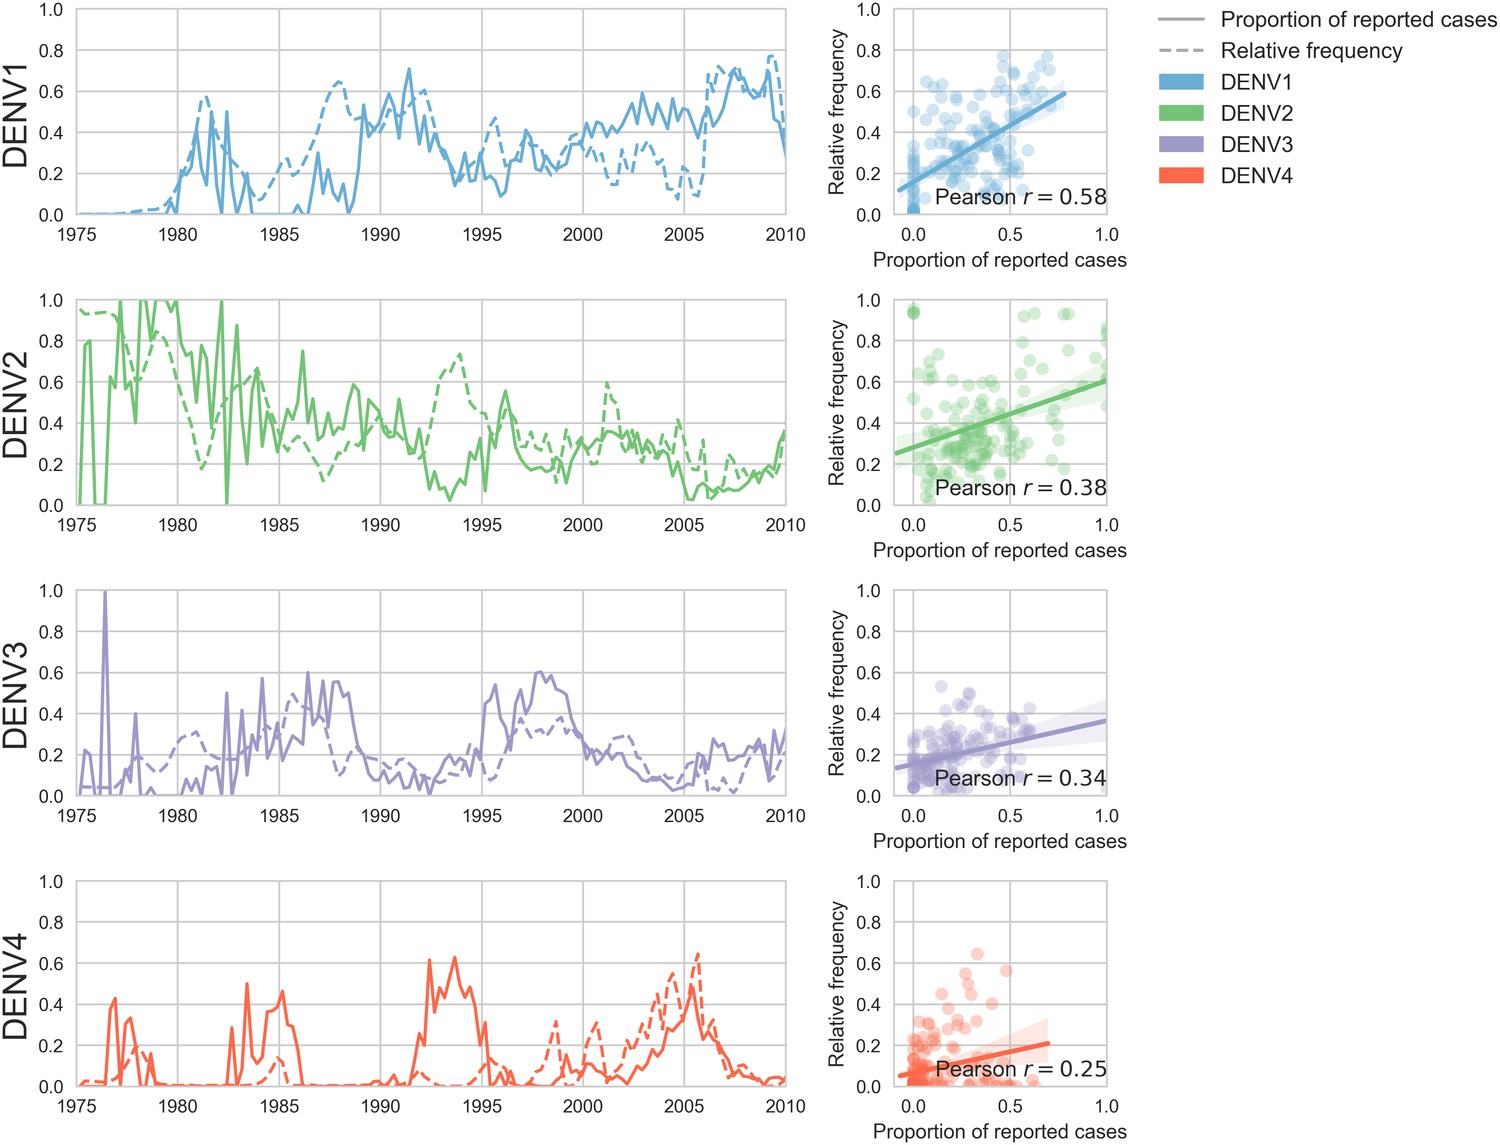
Case counts versus clade frequencies in Thailand.
As described in the Materials and methods, we estimate clade frequencies based on observed relative abundance in the ‘slice’ of the phylogeny at each quarterly timepoint. These frequency estimates are smoothed using a discretized Brownian motion diffusion process. Here, we compare estimated serotype frequencies across Thailand (all available high quality sequences) to case counts from a hospital in Bangkok between 1975–2010 (Reich et al., 2013). Biweekly case counts were aggregated into quarterly timepoints, but were not smoothed. While there are some instances where case counts and frequencies diverge (e.g. DENV4 in the early 1990s), the noisy nature of the unsmoothed case counts artificially deflates estimates of concordance.
Figure 5—figure supplement 2
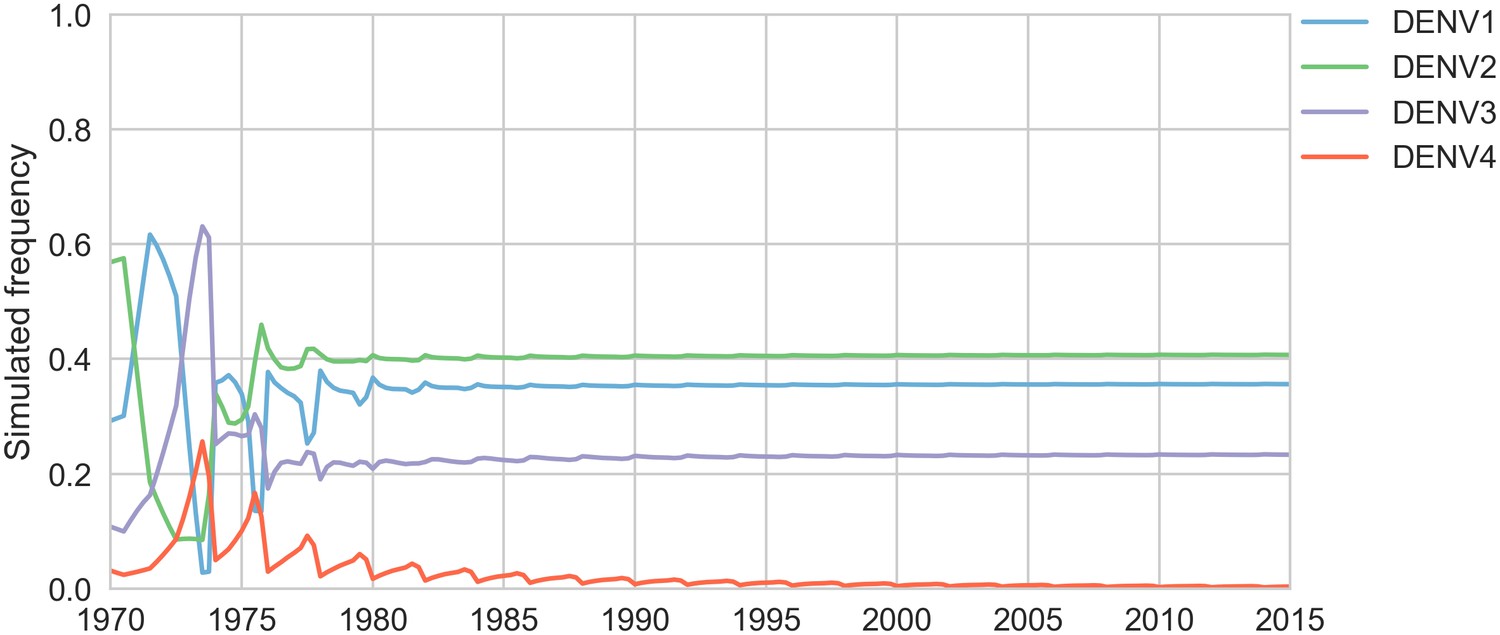
Simulated serotype frequencies (model parameters).
As described in the Materials and methods, we seeded a simulation with two years of empirical frequencies and predicted forward to simulate the remainder of the timecourse. Here, we simulated under the model parameters described in Table 2. This results in damped oscillations around the intrinsic fitness value for each serotype, but these intrinsic fitnesses alone are unable to predict observed clade dynamics (Table 3).
Figure 5—figure supplement 3
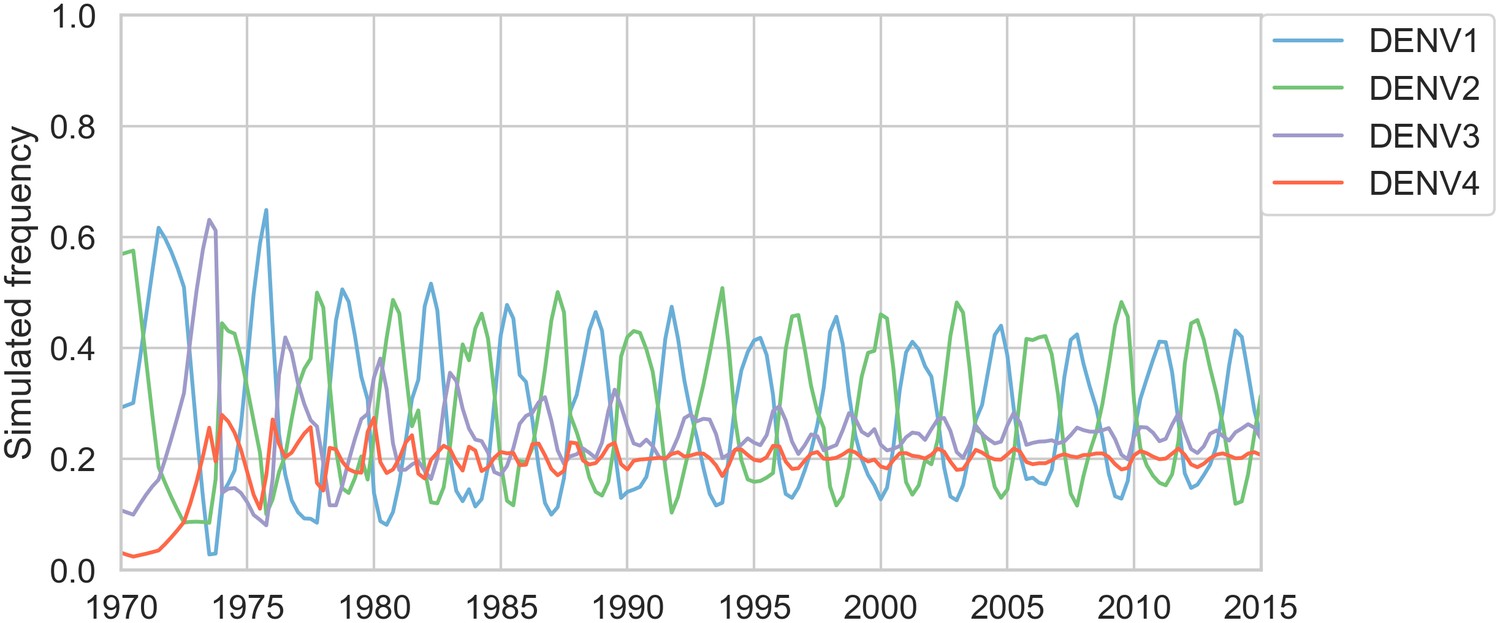
Simulated serotype frequencies.
As described in the Materials and methods, we seeded a simulation with 2 years of empirical frequencies and predicted forward to simulate the remainder of the timecourse. Here, we simulated under the model parameters described in Table 5.
Figure 6
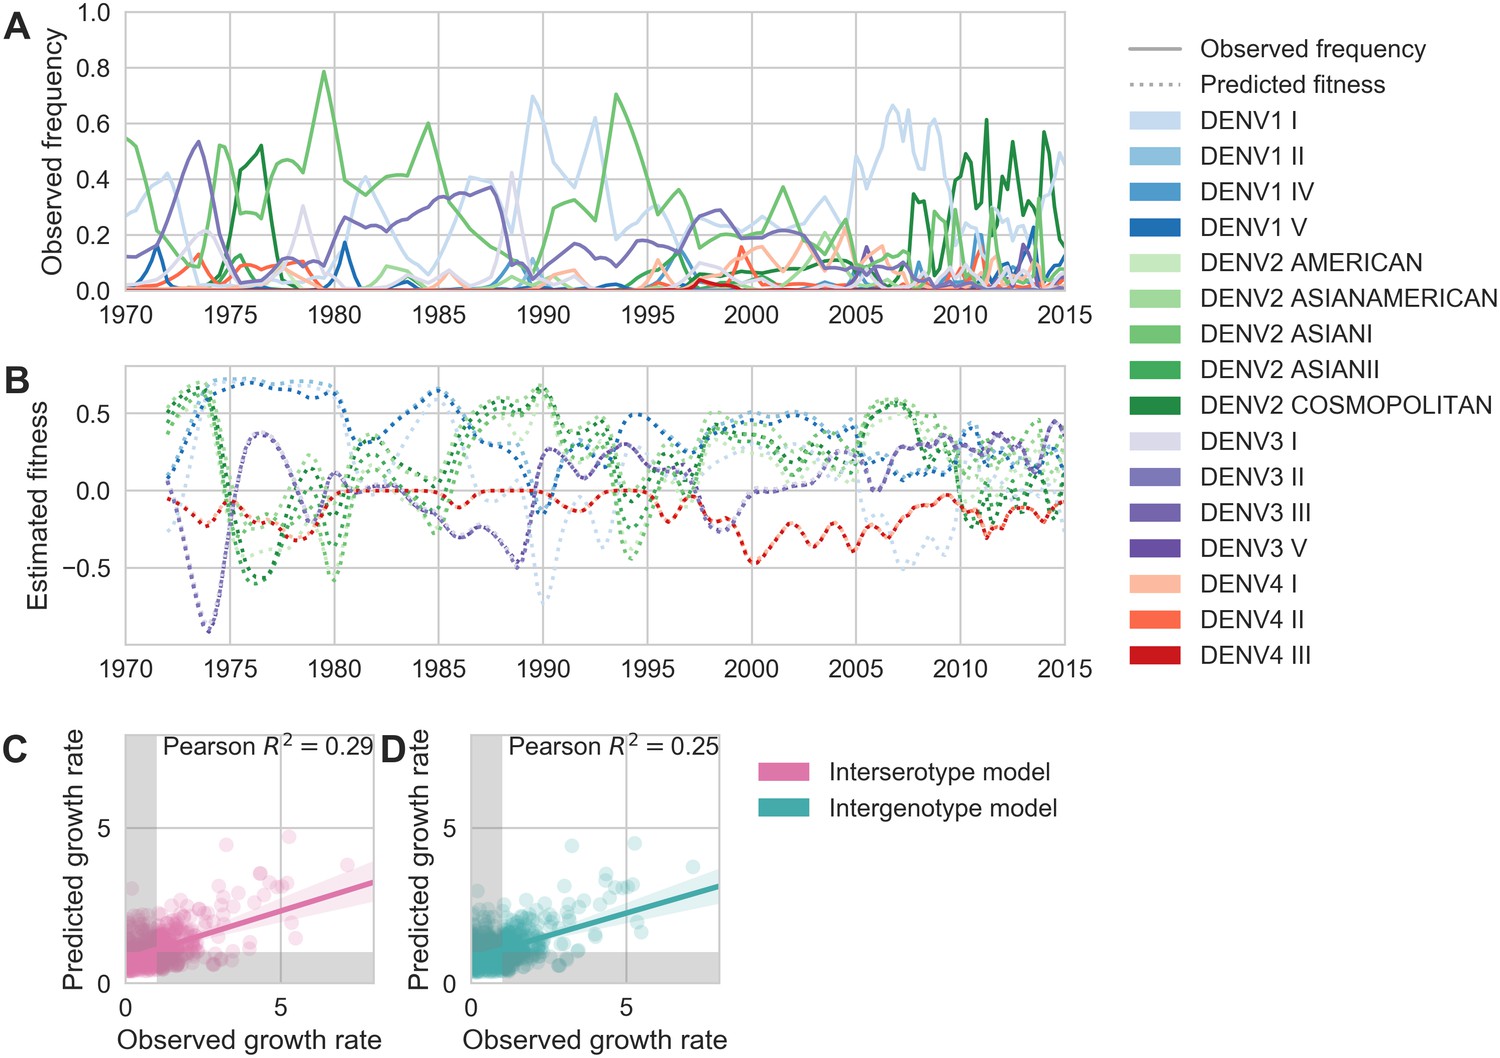
Antigenic novelty partially predicts genotype success.
(A) Relative frequencies of each canonical dengue genotype across Southeast Asia, estimated from available sequence data. (B) Antigenic fitness is calculated for each genotype as its frequency-weighted antigenic distance from recently circulating genotypes. We then add this to a time-invariant, serotype-specific intrinsic fitness value to calculate total fitness (shown here, arbitrary units). We assess antigenic distance at either the ‘intergenotype’ or the ‘interserotype’ resolution. In this panel, we show total fitness over time, incorporating estimates of antigenic fitness derived from the ‘intergenotype’ model. (C, D) Fitness estimates were used to predict clade growth rates over 2 years, compounding immunity every 3 months based on predicted frequency changes (Materials and methods Equation 15). Here, we compare observed vs. predicted growth rates for both formulations of the fitness model (using fitness derived from either ‘interserotype’ or ‘intergenotype’ antigenic distances). Growth versus decline was accurate (predicted and actual growth rates both or both , points outside the gray shaded area) for 67% and 61% of predictions, respectively.
Tables
Table 1
Antigenically relevant mutations.
Each entry represents a mutation (or colinear cluster of mutations) inferred by the titer model to have a non-zero antigenic effect size (shown in parentheses).
| I6V, S29G, F90Y, T176P, V197I, L475M (0.71) | D154E (0.03) | T339I (0.65) |
| A19T (0.02) | K160V (0.03) | V347A (0.28) |
| N83K (0.34) | E161T (0.22) | I380V (0.45) |
| A88K (0.08) | A162I (0.19) | V382A (0.04) |
| A88Q (1.39) | I162A (0.29) | V382I (0.37) |
| Y90F (0.43) | I164V (0.01) | N385K, V454I (0.12) |
| V91I (0.35) | T171S (0.23) | D390S (0.12) |
| K93R (0.20) | V174E (0.46) | N390S (0.18) |
| V114I (0.90) | E180T (0.43) | V454T (0.25) |
| L122S (0.03) | N203E (0.04) | V461F (0.01) |
| S122L (0.07) | N203K (0.08) | F461I (0.03) |
| N124K (0.10) | D203N (0.14) | I462V (0.10) |
| V129I (0.01) | E203N (1.09) | L462I (0.16) |
| I129V (0.21) | E203D (1.34) | V462L (2.11) |
| I129A (0.23) | I308V (0.18) | T478S (0.10) |
| Y132I (0.12) | G330D (0.22) | S478M (0.43) |
| Y132P, R233Q (0.34) | I335V, N355T, P364V(0.18) | V484I (0.39) |
| I139V (0.05) | L338E (0.43) |
Table 2
Optimized fitness model parameters for primary analysis.
https://doi.org/10.7554/eLife.42496.015| Parameter | Value | Description |
|---|---|---|
| 1.02 | Slope of linear relationship between population immunity and viral fitness | |
| 0.83 | Proportion of titers waning each year since primary infection | |
| 0.76 | Slope of linear relationship between titers and probability of protection | |
| 0.74 | Relative intrinsic fitness of DENV1 | |
| 0.84 | Relative intrinsic fitness of DENV2 | |
| 0.50 | Relative intrinsic fitness of DENV3 | |
| 0.00 | Relative intrinsic fitness of DENV4 (fixed) |
Table 3
Fitness model performance comparisons.
Here we compare the performance of the antigenically-informed fitness models to model performance under two null formulations. In the ‘equal’ null model, all clades are assigned equal fitness (i.e. antigenic and intrinsic fitness are set to 0, Equation 17; Equation 18). In the ‘intrinsic’ null model formulation, only the serotype-specific, time-invariant intrinsic fitness values contribute to clade fitness (i.e. antigenic fitness is set to 0, Equation 19; Equation 20). For both formulations of generalized waning, all other parameters were set to the values reported in Table 2 (optimized for RMSE). Parameters for heterotypic waning were optimized separately.
| Resolution | Fitness model | Waning | RMSE | Pearson | Accuracy |
|---|---|---|---|---|---|
| Serotype | Interserotype | Generalized | 0.105 | 0.547 | 0.660 |
| Serotype | Equal fitness null | Generalized | 0.130 | 0.000 | 0.480 |
| Serotype | Intrinsic fitness null | Generalized | 0.140 | 0.042 | 0.510 |
| Genotype | Interserotype | Generalized | 0.062 | 0.286 | 0.666 |
| Genotype | Intergenotype | Generalized | 0.062 | 0.254 | 0.610 |
| Genotype | Equal fitness null | Generalized | 0.070 | 0.000 | 0.440 |
| Genotype | Intrinsic fitness null | Generalized | 0.072 | 0.032 | 0.530 |
| Serotype | Interserotype | Heterotypic | 0.109 | 0.533 | 0.666 |
| Genotype | Interserotype | Heterotypic | 0.063 | 0.291 | 0.661 |
| Genotype | Intergenotype | Heterotypic | 0.063 | 0.203 | 0.599 |
Table 4
Titer model performance comparisons.
We compared performance across several different variations of the titer model. As described in Neher et al. (2016), incremental antigenic change can be assigned to either amino acid substitutions (‘Substitution’ model) or to branches in the phylogeny (‘Tree’ model). For each of these models, we can constrain the model such that antigenic change is allowed to occur only between serotypes (‘Interserotype’) or between AND within serotypes (‘Full’). For the substitution model, we constrain the interserotype model by reconstructing the amino acid sequence of the most recent common ancestor for each serotype and allowing the model to assign antigenic change only to mutations between these ancestral sequences. For the tree model, we constrain the interserotype model by allowing the model to assign antigenic change only to branches in the phylogeny that lie between serotypes. We also assess the impact of the virus avidity and serum potency terms, and . For all models and metrics, we report the mean and 95% confidence interval across 100-fold Monte Carlo cross validation with random 90%:10%, training:test splits.
| Model | Antigenic resolution | And | RMSE | Pearson |
|---|---|---|---|---|
| Substitution | Full | Yes | 0.75 (0.74–0.77) | 0.78 (0.77–0.79) |
| Substitution | Full | No | 1.13 (1.11–1.16) | 0.50 (0.48–0.52) |
| Substitution | Interserotype | Yes | 0.86 (0.85–0.88) | 0.72 (0.70–0.73) |
| Substitution | Interserotype | No | 0.86 (0.84–0.87) | 0.71 (0.70–0.72) |
| Tree | Full | Yes | 0.84 (0.83–0.86) | 0.72 (0.71–0.73) |
| Tree | Full | No | 1.40 (1.38–1.42) | 0.24 (0.23–0.26) |
| Tree | Interserotype | Yes | 0.87 (0.85–0.88) | 0.70 (0.69–0.71) |
| Tree | Interserotype | No | 0.86 (0.84–0.88) | 0.72 (0.71–0.73) |
Table 5
Parameter recovery against simulated data.
https://doi.org/10.7554/eLife.42496.016| Parameter | Input value | Optimized value |
|---|---|---|
| 3.25 | 3.10 | |
| 0.55 | 0.56 | |
| 2.35 | 2.57 | |
| 0.70 | 0.72 | |
| 0.85 | 0.78 | |
| 0.40 | 0.41 |
Additional files
-
Transparent reporting form
- https://doi.org/10.7554/eLife.42496.019
Download links
A two-part list of links to download the article, or parts of the article, in various formats.
Downloads (link to download the article as PDF)
Open citations (links to open the citations from this article in various online reference manager services)
Cite this article (links to download the citations from this article in formats compatible with various reference manager tools)
Dengue genetic divergence generates within-serotype antigenic variation, but serotypes dominate evolutionary dynamics
eLife 8:e42496.
https://doi.org/10.7554/eLife.42496


