Dengue genetic divergence generates within-serotype antigenic variation, but serotypes dominate evolutionary dynamics
Abstract
Dengue virus (DENV) exists as four genetically distinct serotypes, each of which is historically assumed to be antigenically uniform. Recent analyses suggest that antigenic heterogeneity may exist within each serotype, but its source, extent and impact remain unclear. Here, we construct a sequence-based model to directly map antigenic change to underlying genetic divergence. We identify 49 specific substitutions and four colinear substitution clusters that robustly predict dengue antigenic relationships. We report moderate antigenic diversity within each serotype, resulting in genotype-specific patterns of heterotypic cross-neutralization. We also quantify the impact of antigenic variation on real-world DENV population dynamics, and find that serotype-level antigenic fitness is a dominant driver of dengue clade turnover. These results provide a more nuanced understanding of the relationship between dengue genetic and antigenic evolution, and quantify the effect of antigenic fitness on dengue evolutionary dynamics.
https://doi.org/10.7554/eLife.42496.001Introduction
Dengue virus (DENV) is a mosquito-borne flavivirus which consists of four genetically distinct clades, canonically thought of as serotypes (DENV1 – DENV4) (Lanciotti et al., 1997). DENV circulates primarily in South America and Southeast Asia, infecting 400 million people annually. Primary DENV infection is more often mild and is thought to generate lifelong homotypic immunity and temporary heterotypic immunity, which typically wanes over 6 months to 2 years (Sabin, 1952; Reich et al., 2013; Katzelnick et al., 2016). Subsequent heterotypic secondary infection induces broad cross-protection, and symptomatic tertiary and quaternary cases are rare (Gibbons et al., 2007; Olkowski et al., 2013). However, a small subset of secondary infections are enhanced by non-neutralizing, cross-reactive antibodies, resulting in severe disease via antibody-dependent enhancement (ADE) (Halstead, 1979; Katzelnick et al., 2017; Sangkawibha et al., 1984; Salje et al., 2018). Approximately 1–3% of cases progress to severe dengue hemorrhagic fever, causing 9000 deaths each year (Bhatt et al., 2013; Stanaway et al., 2016) and relative risk of severe dengue from secondary heterotypic infection relative to primary infection is estimated to be 24 (Mizumoto et al., 2014). Thus, the antigenic relationships between dengue viruses — describing whether the immune response generated after primary infection results in protection or enhancement of secondary infection — are key drivers of DENV case outcomes and epidemic patterns.
While each serotype is clearly genetically and antigenically distinct, it is not clear how subserotype clades of DENV interact antigenically. Each DENV serotype consists of broad genetic diversity (Figure 1A), including canonical clades termed ‘genotypes’ (Rico-Hesse, 1990; Twiddy et al., 2003). Specific genotypes have been associated with characteristically mild or severe disease, and heterogeneous neutralization titers suggest that the immune response to some genotypes is more cross-protective than others (Gentry et al., 1982; Russell and Nisalak, 1967). Until recently, it has been assumed that these intraserotype differences are minimally important compared to interserotype differences. However, empirical evidence has demonstrated that these genotype-specific differences can drive case outcomes and epidemic severity (reviewed in Holmes and Twiddy, 2003). For example, analysis of a longitudinal cohort study demonstrated that specific combinations of primary infection serotype and secondary infection genotype can mediate individual case outcomes (OhAinle et al., 2011). On a population scale, the DENV1-immune population of Iquitos, Peru, experienced either entirely asymptomatic or very severe epidemic seasons in response to two different genotypes of DENV2 (Kochel et al., 2002).

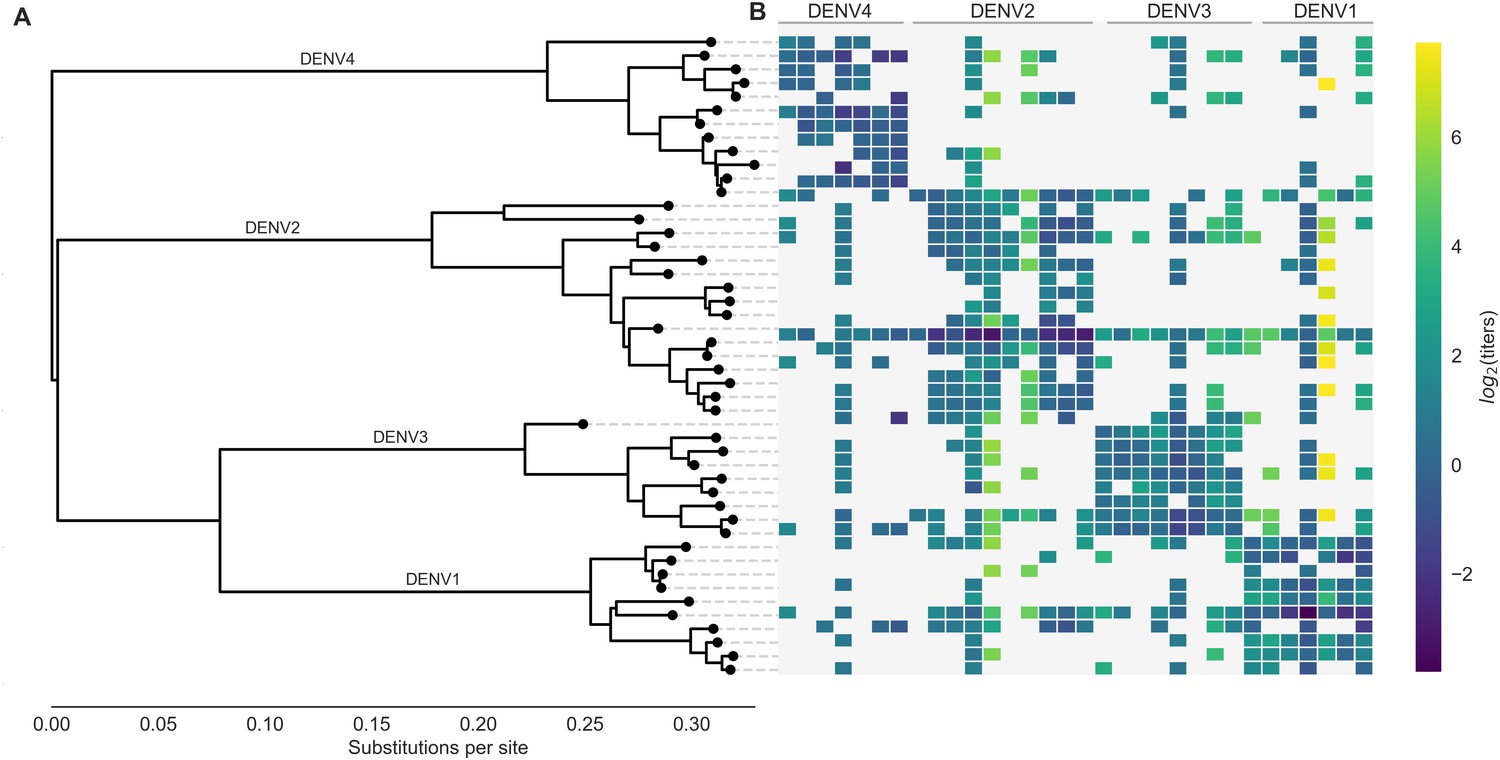
Phylogeny of dengue virus sequences and normalized antigenic distances.
(A) Maximum likelihood phylogeny of the E (envelope) gene from titered dengue viruses. Notably, each of the four serotypes contains substantial genetic diversity. (B) Pairwise antigenic distances were estimated by Katzelnick et al. (2015) using plaque reduction neutralization titers (PRNT50, see Materials and methods). Aggregated titer values are standardized such that the distance between autologous virus-serum pairs is 0, and each titer unit corresponds to a two-fold change in PRNT50 value. Light gray areas represent missing data. Larger values correspond to greater antigenic distance.
One explanation for these and similar observations is that overlooked intraserotype antigenic variation contributes to these genotype-specific case outcomes and epidemic patterns. Recent efforts to antigenically characterize diverse DENV viruses suggests that each serotype may contain antigenic heterogeneity, but the source and impact of this heterogeneity is not clear (Katzelnick et al., 2015). Here, we characterize the evolutionary basis for observed antigenic heterogeneity among DENV clades. We also quantify the impact of within- and between-serotype antigenic variation on real-world DENV population dynamics.
Results
Dengue neutralization titer data
Antigenic distance between a pair of viruses and is experimentally quantified using neutralization titers, which measure how well serum drawn after infection with virus is able to neutralize virus in vitro (Russell and Nisalak, 1967). Throughout the following, we refer to serum raised against virus as serum for brevity. To measure the pairwise antigenic distances for a panel of diverse DENV viruses (Figure 1), Katzelnick et al. (2015) infected naive non-human primates (NHP) with each virus, drew sera at 3 months post-infection, and then titered this sera against a panel of test viruses. To compare patterns of cross-protection in NHP and humans, they also drew sera from 31 study participants 6 weeks after inoculation with a monovalent component of the NIH dengue vaccine candidate. This sera was also titered against a broad panel of DENV viruses. As originally reported, we find generally consistent patterns of neutralization between the NHP and human sera data; see Katzelnick et al. (2015) for a detailed comparison. In total, our dataset consists of 454 NHP sera titers spanning the breadth of DENV diversity, and 728 human sera titers providing deep coverage of a small subset of viruses.
To normalize these measurements, we take the log of each value, such that one antigenic unit corresponds to a two-fold drop in neutralization, and we define antigenic distance between autologous serum-virus pairs (i.e. virus and serum ) as zero. Normalized antigenic distance between virus and serum is thus calculated as , such that a higher value of indicates that serum is less effective at neutralizing virus , implying greater antigenic distance between viruses and . For brevity, these normalized titer values are hereafter referred to simply as log(titers).
The full dataset of standardized titer values is shown in Figure 1B. Here, we see that homotypic virus-serum pairs are more closely related antigenically than heterotypic pairs. However, we also observe large variance around this trend, both within and between serotypes. This suggests that treating each serotype as antigenically uniform potentially overlooks important antigenic heterogeneity across viruses within each serotype.
Dengue antigenic evolution corresponds to genetic divergence
Titer measurements are prone to noise, and there is a limited amount of available titer data. If the antigenic heterogeneity observed in the raw data is truly the result of an underlying evolutionary process, we expect that differences in antigenic phenotype correspond to underlying mutations in surface proteins. Dengue has two surface proteins, prM (membrane) and E (envelope). While previous studies have identified epitopes on both prM and E, it is believed that antibodies involved in ADE primarily target prM, while neutralizing antibodies primarily target E (de Alwis et al., 2014). The assay used to generate this titer dataset captures neutralization, but does not capture the effects of ADE; we thus focus our analysis on the E gene.
To fully map the relationship between DENV genetic and antigenic evolution, we adapt a substitution-based model originally developed for influenza (Neher et al., 2016). Conceptually, this model predicts titer values through three steps. First, we align E gene sequences from titered dengue viruses and catalog the amino acid mutations between each serum strain and test virus strain in our dataset. Next, we infer how much antigenic change is attributable to specific mutations by constructing a parsimonious model that links normalized antigenic distances to observed mutations. This assigns each mutation an antigenic effect size, ; forward and reverse mutations are assigned separate values of . With this in hand, we estimate the asymmetrical antigenic distance between all pairs of sera and test viruses by summing over for all mutations observed between the serum and the test virus (Materials and methods, Equation 2).
To learn these values of , we first split our dataset into training (random 90% of measurements) and test data (the remaining 10% of values). We take the training data and fit for each mutation that is observed two or more times, subject to regularization as follows (also detailed in Materials and methods, Equation 3). Parsimoniously, we expect that antigenic change is more likely to be incurred by a few key mutations than by many mutations; correspondingly, our prior expectation of values of is exponentially distributed such that most values of . This is directly analogous to lasso regression to identify a few parameters with positive weights and set other parameters to 0 (Tibshirani, 1996). Additionally, some viruses have greater binding avidity, and some sera are more potent than others (Figure 1—figure supplement 1); these ‘row’ and ‘column’ effects, respectively, are normally distributed and are taken into account when training the model. The model uses convex optimization to learn the values of that minimize the sum of squared errors (SSE) between observed and predicted titers in the training data. We thus learn model parameters from the training data, and then use those parameters to predict test data values. We assess model performance by comparing the predicted test titer values to the actual values, aggregated across 100-fold Monte Carlo cross validation.
This model formulation is an effective tool for estimating antigenic relationships between viruses based on their genetic sequences. On average across cross-validation replicates, this model yields a root mean squared error (RMSE) of 0.75 when predicting titers relative to their true value (95% CI 0.74–0.77, RMSE), and explains 78% of the observed variation in neutralization titers overall (95% CI 0.77–0.79, Pearson ). This is comparable to the model error from a cartography-based characterization of the same dataset (RMSE 0.65–0.8 log titer units) (Katzelnick et al., 2015). Prediction error was comparable between human and non-human primate sera, indicating that these genetic determinants of antigenic phenotypes are not host species-specific (Figure 2—figure supplement 2).
The 48 strains included in the titer dataset (as serum strains, test virus strains, or both) are 25.7% divergent on average (amino acid differences in E). Pairwise comparisons of all serum strains and test viruses yields 1534 unique mutations that are observed at least twice. Our parsimonious model attributes antigenic change to a total of 49 specific mutations and four colinear mutation clusters (each consisting of 2–6 co-occurring mutations) (Figure 2, Table 1). Each of these mutations confers 0.01–2.11 (median 0.19) log titer units of antigenic change; 27 mutations or mutation clusters have . These mutations span all domains of E, and most occur both between and within serotypes (Figure 2).

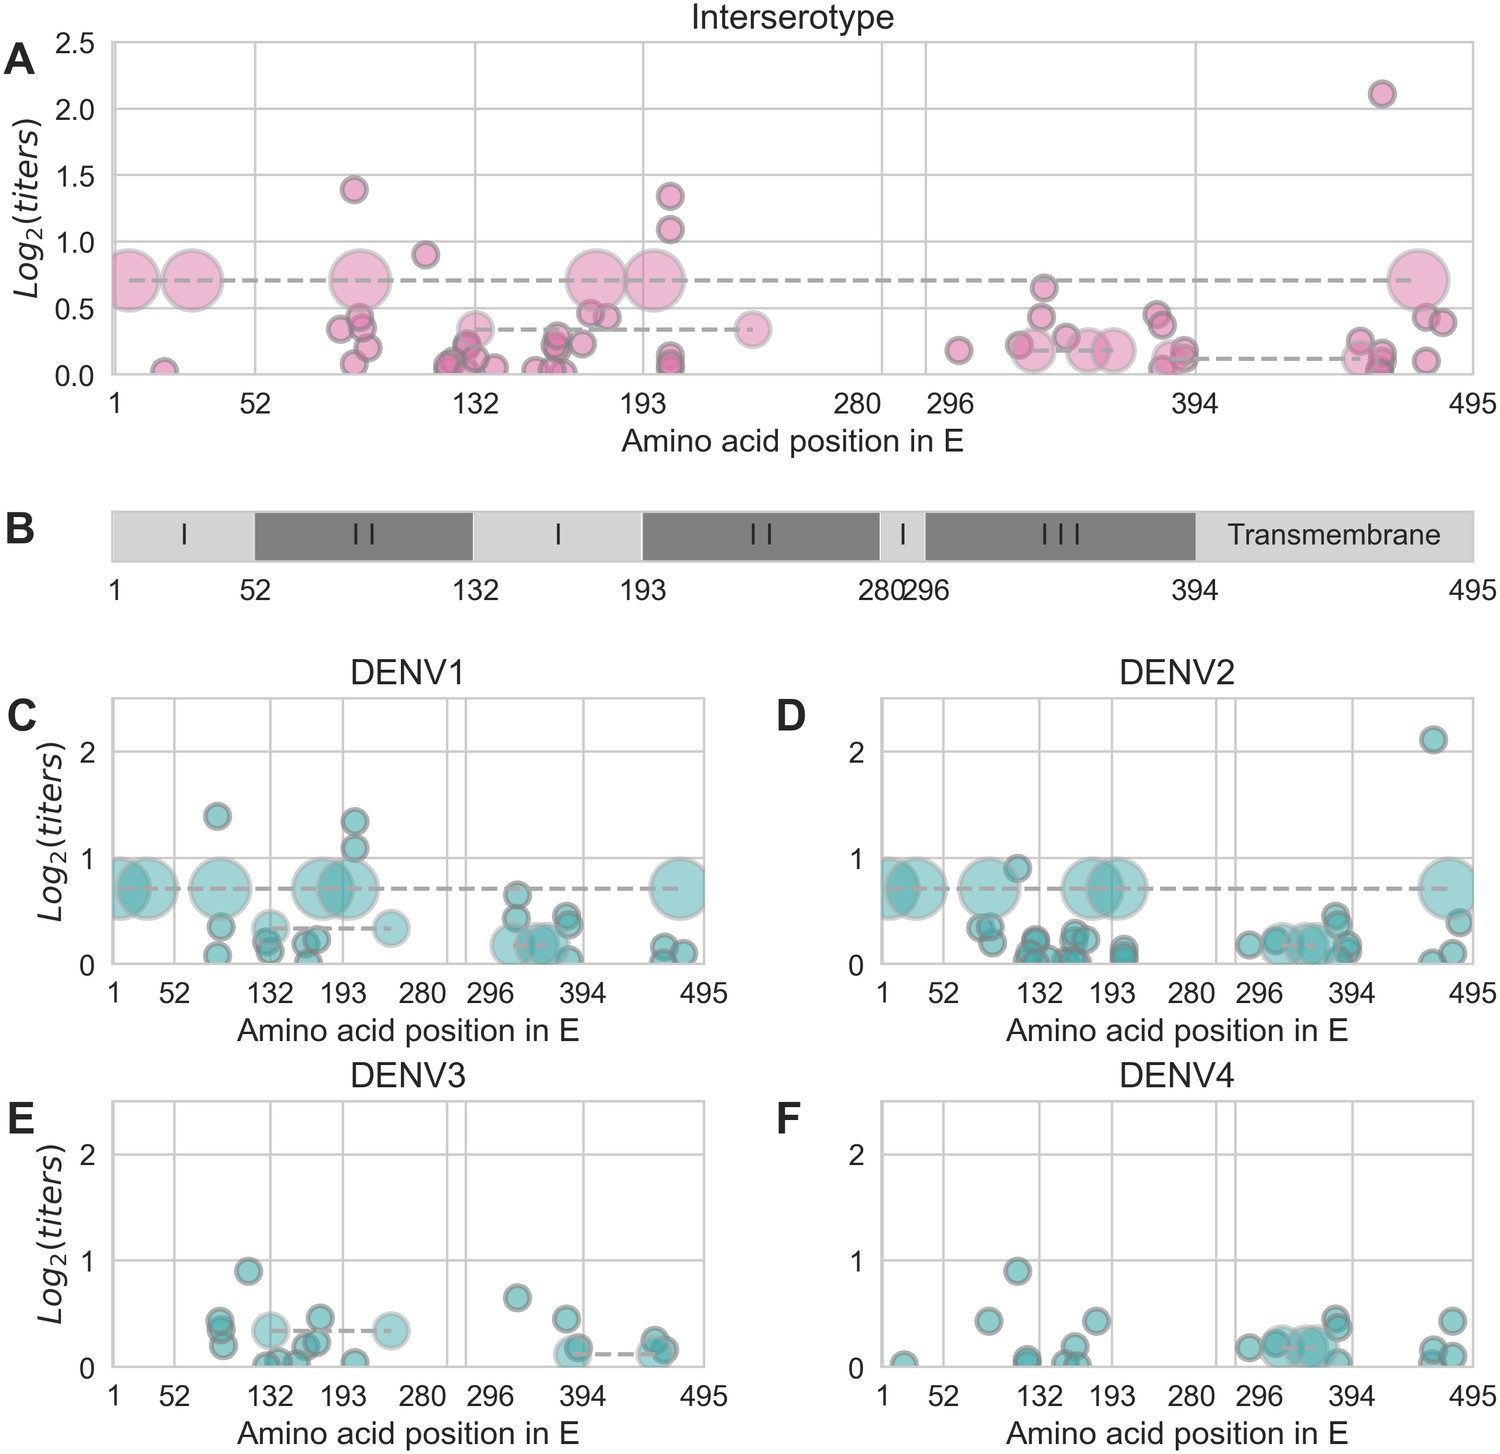
Distribution and effect size of antigenic mutations.
Each point represents one antigenically relevant mutation or colinear mutation cluster. Clustered mutations are connected with dashed lines with point size proportionate to cluster size (N = 2–6). The x axis indicates mutations’ position in E, relative to each functional domain as noted in (B). The y axis indicates antigenic effect size.
Antigenically relevant mutations.
Each entry represents a mutation (or colinear cluster of mutations) inferred by the titer model to have a non-zero antigenic effect size (shown in parentheses).
I6V, S29G, F90Y, T176P, V197I, L475M (0.71) | D154E (0.03) | T339I (0.65) |
A19T (0.02) | K160V (0.03) | V347A (0.28) |
N83K (0.34) | E161T (0.22) | I380V (0.45) |
A88K (0.08) | A162I (0.19) | V382A (0.04) |
A88Q (1.39) | I162A (0.29) | V382I (0.37) |
Y90F (0.43) | I164V (0.01) | N385K, V454I (0.12) |
V91I (0.35) | T171S (0.23) | D390S (0.12) |
K93R (0.20) | V174E (0.46) | N390S (0.18) |
V114I (0.90) | E180T (0.43) | V454T (0.25) |
L122S (0.03) | N203E (0.04) | V461F (0.01) |
S122L (0.07) | N203K (0.08) | F461I (0.03) |
N124K (0.10) | D203N (0.14) | I462V (0.10) |
V129I (0.01) | E203N (1.09) | L462I (0.16) |
I129V (0.21) | E203D (1.34) | V462L (2.11) |
I129A (0.23) | I308V (0.18) | T478S (0.10) |
Y132I (0.12) | G330D (0.22) | S478M (0.43) |
Y132P, R233Q (0.34) | I335V, N355T, P364V(0.18) | V484I (0.39) |
I139V (0.05) | L338E (0.43) |
Each serotype of dengue contains moderate antigenic heterogeneity
By linking antigenic change to specific mutations, we are able to estimate unmeasured antigenic distances between any pair of viruses in the dataset based on their genetic differences. As an example, we estimated the antigenic distance between serum raised against each monovalent component of the NIH vaccine candidate and all other viruses in the dataset. As shown in Figure 3, vaccine-elicited antibodies result in strong homotypic neutralization, but heterotypic cross-neutralization varies widely between specific strains. This has important ramifications for vaccine design and trial evaluation.

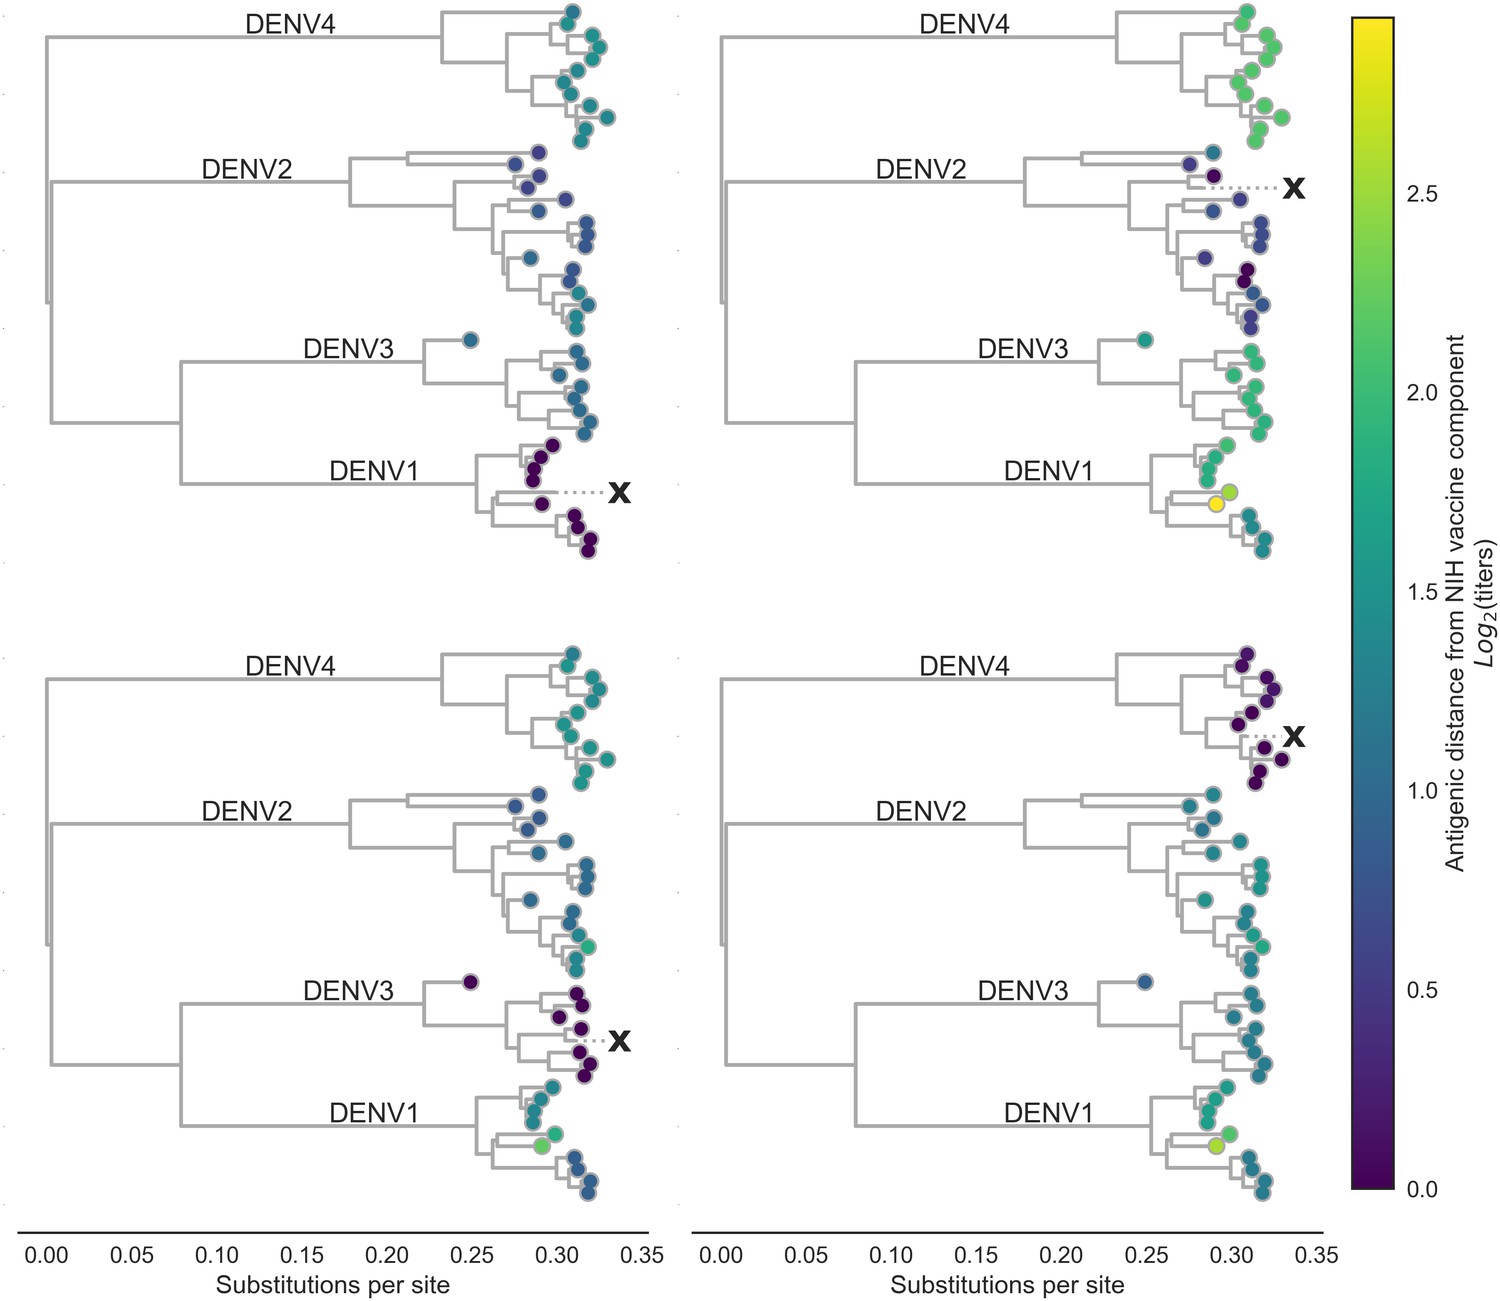
Antigenic distance from NIH vaccine strains.
By assigning a discrete increment of antigenic change to each mutation, we can estimate the asymmetrical antigenic distance between any serum strain and test virus strain based on their genetic differences. Here, we show the estimated antigenic distance between serum raised against each monovalent component of the NIH vaccine candidate (indicated as ‘X’) and each test virus in the tree.
We also observe antigenic heterogeneity at the genotype level. On average, heterotypic genotypes are separated by 6.9 antigenic mutations (or colinear mutation clusters) and 2.18 log titers. Homotypic genotypes are separated by a mean of 1.9 antigenic mutations, conferring a total of 0.30 log titers of antigenic distance (Figure 4). Notably, the titer dataset spans the breadth of canonical DENV genotypes, but in most cases lacks the resolution to detect within-genotype antigenic diversity. We thus expect that these results represent a lower bound on the true extent of DENV intraserotype antigenic diversity.

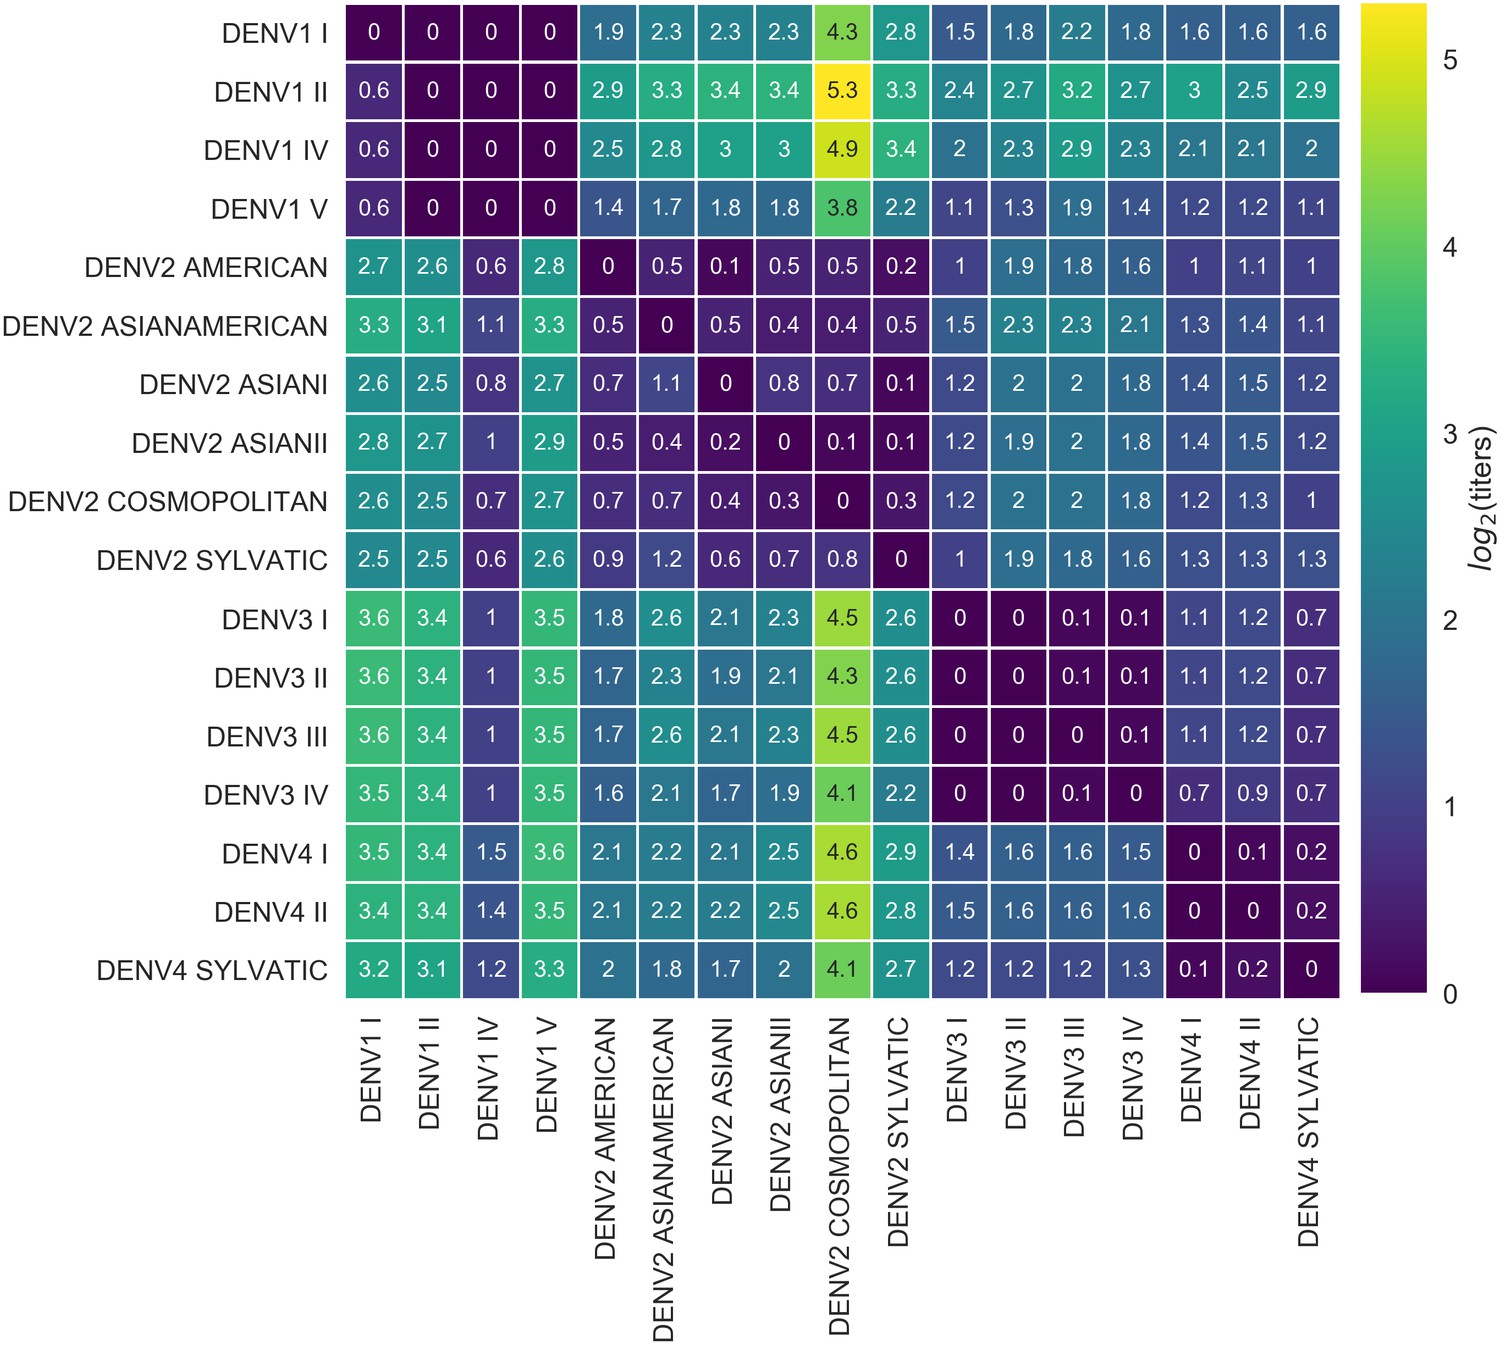
Titer distance by genotype.
Values represent the mean interpolated antigenic distance between canonical dengue genotypes (in standardized log titer units). Columns represent sera; rows represent test viruses.
In summary, we have identified a small number of antigenically relevant mutations that explain most of the observed antigenic heterogeneity in dengue, as indicated by neutralization titers. These mutations occur both between and within serotypes, suggesting that dengue antigenic evolution is an ongoing, although gradual, process. This results in strain-specific and genotype-level antigenic variation, although the scale of this variation is small compared to serotype-level differences. From this, we conclude that there is antigenic variation within each serotype of DENV, and that this is driven by underlying genetic divergence.
Antigenic novelty predicts serotype success
From the titer model, we find evidence that homotypic genotypes of DENV vary in their ability to escape antibody neutralization. However, antibody neutralization is only one of many factors that shape epidemic patterns. We investigate whether the observed antigenic diversity influences dengue population dynamics in the real world.
The size of the viral population (i.e. prevalence, commonly analyzed using SIR models as reviewed in Lourenço et al., 2018) is determined by many complex factors, and reliable values for population prevalence are largely unavailable. Contrastingly, the composition of the viral population (i.e. the relative frequency of each viral clade currently circulating) can be estimated over time by examining historical sequence data (Lee et al., 2018; Neher et al., 2016), and is primarily driven by viral fitness (Bedford et al., 2011).
In meaningfully antigenically diverse viral populations, antigenic novelty (relative to standing population immunity) contributes to viral fitness: as a given virus circulates in a population, the proportion of the population that is susceptible to infection with –and other viruses antigenically similar to –decreases over time as more people acquire immunity (Bedford et al., 2012; Luksza and Lässig, 2014). Antigenically novel viruses that are able to escape this population immunity are better able to infect hosts and sustain transmission chains, making them fitter than the previously circulating viruses (Zhang et al., 2005; Bedford et al., 2012; Gupta et al., 1998; Wearing and Rohani, 2006; Lourenço and Recker, 2013). Thus, if antigenic novelty constitutes a fitness advantage for DENV, then we would expect greater antigenic distance from recently circulating viruses to correlate with higher growth rates.
To test this hypothesis, we examine the composition of the dengue virus population in Southeast Asia from 1970 to 2015. We estimate the relative population frequency of each DENV serotype at three month intervals, (Figure 5A), based on their observed relative abundance in the ‘slice’ of the phylogeny corresponding to each timepoint (N = 8644 viruses; see Materials and methods, Equations 4-5). While there is insufficient data to directly compare these estimated frequencies to regional case counts, we see good qualitative concordance between frequencies similarly estimated for Thailand and previously reported case counts from Bangkok (Figure 5—figure supplement 1).

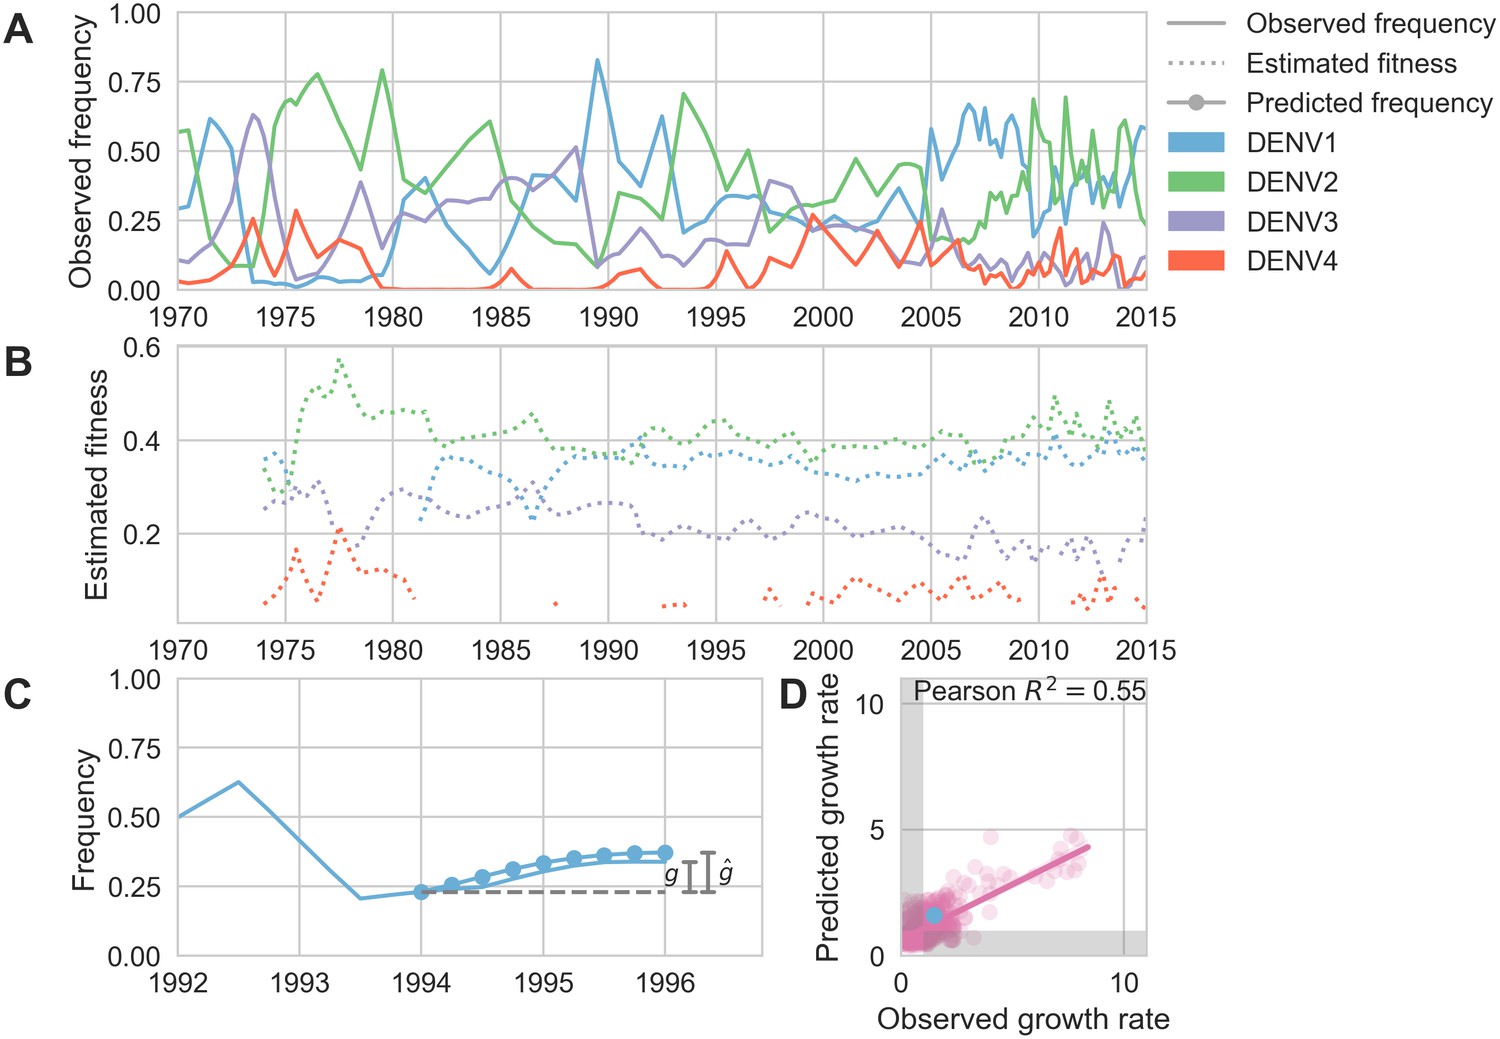
Antigenic novelty predicts serotype success.
(A) The relative frequency of each serotype, , in Southeast Asia estimated every 3 months based on available sequence data. (B) Total fitness of each serotype. We calculate antigenic fitness for each serotype over time as its frequency-weighted antigenic distance from recently circulating viruses. We then add this to a time-invariant intrinsic fitness value to calculate total fitness. (C) DENV1 frequencies between 1994 and 1996 alongside model projection. At each timepoint , we blind the model to all empirical data from timepoints later than and predict each serotype’s future trajectory based on its initial frequency, time-invariant intrinsic fitness, and antigenic fitness at time (Materials and methods, Equation 11). We predict forward in 3-month increments for a total prediction period of years. At each increment, we use the current predicted frequency to adjust our estimates of antigenic fitness on a rolling basis (Materials and methods, Equation 15). (D) Predicted growth rates, , compared to empirically observed growth rates, . Predicted and empirical growth rate of the example illustrated in (C) is shown in (D) as the blue point. Serotype growth versus decline is accurate (i.e. the predicted and actual growth rates are both or both , all points outside the gray area) for 66% of predictions.
Optimized fitness model parameters for primary analysis.
https://doi.org/10.7554/eLife.42496.015Parameter | Value | Description |
---|---|---|
1.02 | Slope of linear relationship between population immunity and viral fitness | |
0.83 | Proportion of titers waning each year since primary infection | |
0.76 | Slope of linear relationship between titers and probability of protection | |
0.74 | Relative intrinsic fitness of DENV1 | |
0.84 | Relative intrinsic fitness of DENV2 | |
0.50 | Relative intrinsic fitness of DENV3 | |
0.00 | Relative intrinsic fitness of DENV4 (fixed) |
Fitness model performance comparisons.
Here we compare the performance of the antigenically-informed fitness models to model performance under two null formulations. In the ‘equal’ null model, all clades are assigned equal fitness (i.e. antigenic and intrinsic fitness are set to 0, Equation 17; Equation 18). In the ‘intrinsic’ null model formulation, only the serotype-specific, time-invariant intrinsic fitness values contribute to clade fitness (i.e. antigenic fitness is set to 0, Equation 19; Equation 20). For both formulations of generalized waning, all other parameters were set to the values reported in Table 2 (optimized for RMSE). Parameters for heterotypic waning were optimized separately.
Resolution | Fitness model | Waning | RMSE | Pearson | Accuracy |
---|---|---|---|---|---|
Serotype | Interserotype | Generalized | 0.105 | 0.547 | 0.660 |
Serotype | Equal fitness null | Generalized | 0.130 | 0.000 | 0.480 |
Serotype | Intrinsic fitness null | Generalized | 0.140 | 0.042 | 0.510 |
Genotype | Interserotype | Generalized | 0.062 | 0.286 | 0.666 |
Genotype | Intergenotype | Generalized | 0.062 | 0.254 | 0.610 |
Genotype | Equal fitness null | Generalized | 0.070 | 0.000 | 0.440 |
Genotype | Intrinsic fitness null | Generalized | 0.072 | 0.032 | 0.530 |
Serotype | Interserotype | Heterotypic | 0.109 | 0.533 | 0.666 |
Genotype | Interserotype | Heterotypic | 0.063 | 0.291 | 0.661 |
Genotype | Intergenotype | Heterotypic | 0.063 | 0.203 | 0.599 |
Fitter virus clades increase in frequency over time, such that . It follows that these clades have a growth rate—defined as the fold-change in frequency over time—greater than one: . To isolate the extent to which antigenic fitness contributes to clade success and decline, we extend work by Luksza and Lässig (2014) to build a simple model that attempts to predict clade growth rates based on two variables: the antigenic fitness of the clade at time , and a time-invariant-free parameter representing the intrinsic fitness of the serotype the clade belongs to. We estimate the antigenic fitness of clade at time as a function of its antigenic distance from each viral clade that has circulated in the same population over the previous 2 years, weighted by the relative frequency of and adjusted for waning population immunity (Figure 5B; Materials and methods, Equation 6-10). Growth rates are estimated based on a 2-year sliding window (Figure 5C).
This simple model explains 54.7% of the observed variation in serotype growth rates, and predicts serotype growth vs. decline correctly for 66.0% of predictions (Figure 5D). This suggests that antigenic fitness is a major driver of serotype population dynamics. This also demonstrates that this model captures key components of dengue population dynamics; examining the formulation of this model in more detail can yield insights into how antigenic relationships influence DENV population composition. The fitness model includes six free parameters that are optimized such that the model most accurately reproduces the observed fluctuations in DENV population composition (minimizing the RMSE of frequency predictions, see Materials and methods). We find that serotype fluctuations are consistent with a model wherein population immunity wanes linearly over time, with the probability of protection dropping by about 63% per year for the first 2 years after primary infection. This model assumes no fundamental difference between homotypic and heterotypic reinfection; rather, homotypic immunity is assumed to wane at the same rate as heterotypic immunity, but starts from a higher baseline of protection based on closer antigenic distances. We also find that these dynamics are best explained by intrinsic fitness that moderately varies by serotype (Table 2); we are not aware of any literature that directly addresses this observation via competition experiments. However, intrinsic fitness alone is unable to predict serotype dynamics (Table 3) and relative strength of antigenic fitness and intrinsic fitness are approximately matched in determining overall serotype fitness.
Antigenic novelty also partially predicts genotype success
To estimate how well antigenic fitness predicts genotype dynamics, we used the same model to predict genotype success and decline. As before, fitness of genotype is based on the intrinsic fitness of the serotype belongs to, and the antigenic distance between and each other genotype, , that has recently circulated (Equation 6-10). For genotypes, we can calculate antigenic distance between and at either the serotype level or the genotype level. In the ‘interserotype model’, we treat each serotype as antigenically uniform, and assign the mean serotype-level antigenic distances to all pairs of constituent genotypes. In the ‘intergenotype model’, we incorporate the observed within-serotype heterogeneity, and use the mean genotype-level antigenic distances (as shown in Figure 4). If within-serotype antigenic heterogeneity contributes to genotype fitness, then we would expect estimates of antigenic fitness based on the ‘intergenotype model’ to better predict genotype growth rates.
We find that antigenic fitness contributes to genotype turnover, although it explains less of the observed variation than for serotypes. As for serotypes, intrinsic fitness alone was unable to predict genotype turnover (Table 3). When antigenic distance is estimated from the ‘interserotype model’, we find that our model of antigenic fitness explains approximately 28.6% of the observed variation in genotype growth rates, and correctly predicts genotype growth vs. decline 66.6% of the time (Figure 6C). Perhaps surprisingly, more precise estimates of antigenic distance between genotypes from the ‘intergenotype model’ does not improve our predictions of genotype success (, 61.0% accuracy; Figure 6D, Table 3). This suggests that although we find strong evidence that genotypes vary in their ability to escape neutralizing antibodies, these differences are subtle enough that they do not impact broad-scale regional dynamics over time.

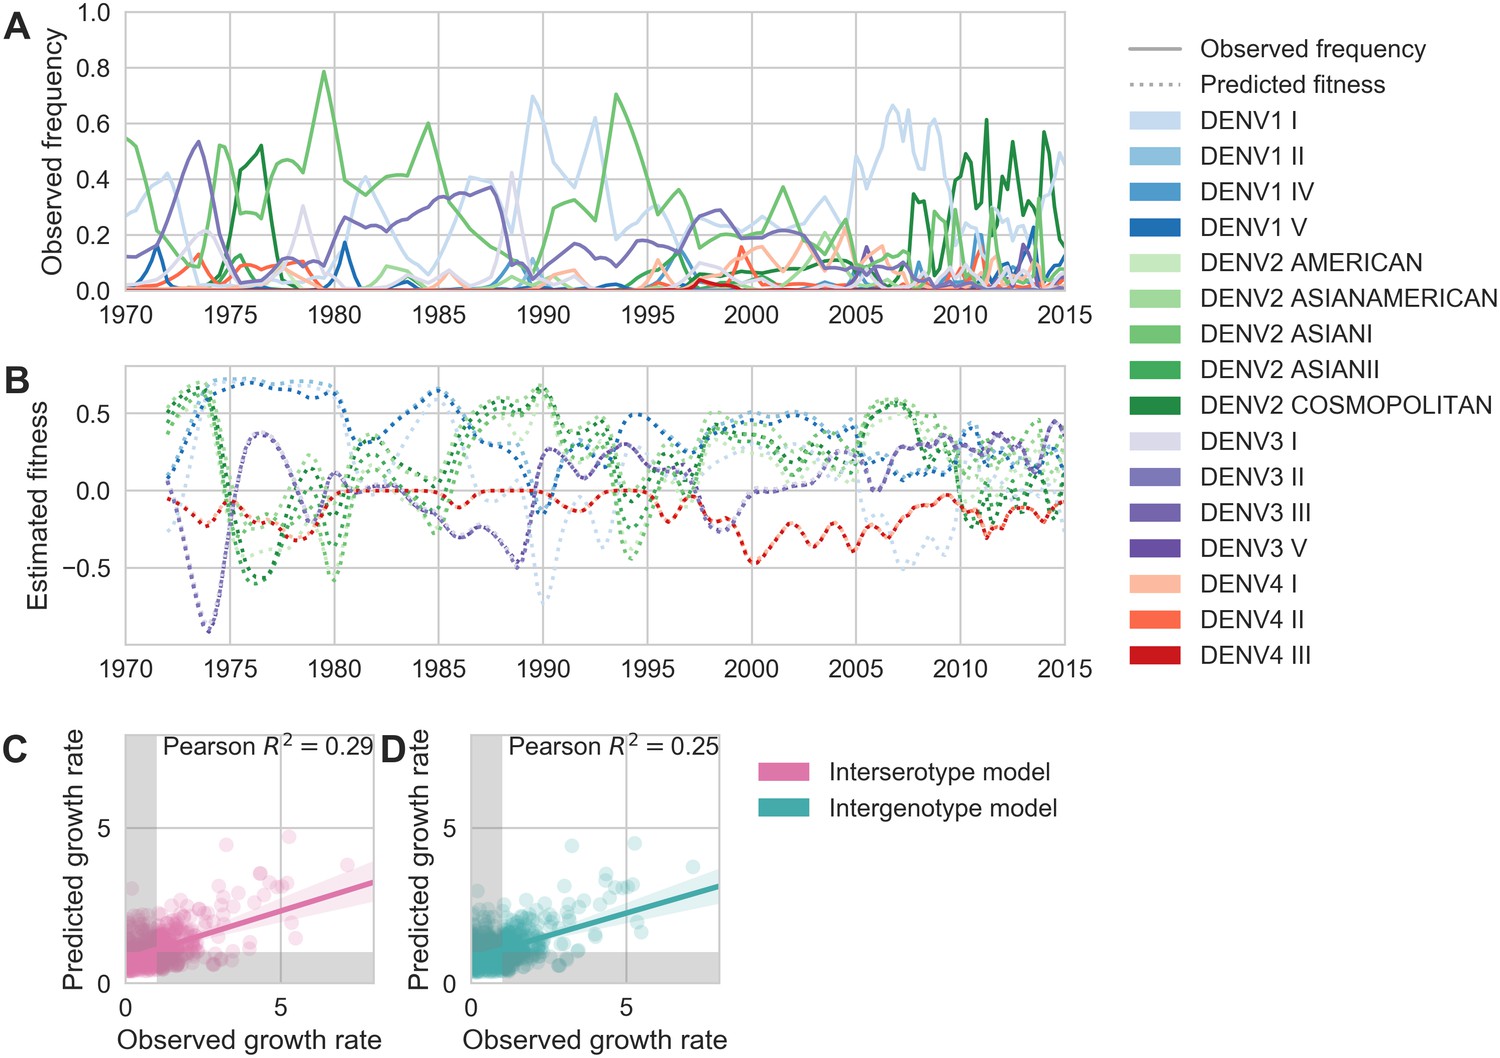
Antigenic novelty partially predicts genotype success.
(A) Relative frequencies of each canonical dengue genotype across Southeast Asia, estimated from available sequence data. (B) Antigenic fitness is calculated for each genotype as its frequency-weighted antigenic distance from recently circulating genotypes. We then add this to a time-invariant, serotype-specific intrinsic fitness value to calculate total fitness (shown here, arbitrary units). We assess antigenic distance at either the ‘intergenotype’ or the ‘interserotype’ resolution. In this panel, we show total fitness over time, incorporating estimates of antigenic fitness derived from the ‘intergenotype’ model. (C, D) Fitness estimates were used to predict clade growth rates over 2 years, compounding immunity every 3 months based on predicted frequency changes (Materials and methods Equation 15). Here, we compare observed vs. predicted growth rates for both formulations of the fitness model (using fitness derived from either ‘interserotype’ or ‘intergenotype’ antigenic distances). Growth versus decline was accurate (predicted and actual growth rates both or both , points outside the gray shaded area) for 67% and 61% of predictions, respectively.
Discussion
Within-serotype antigenic heterogeneity
We show that mapping antigenic change to specific mutations and interpolating across the DENV alignment is able to explain a large majority of the observed variation in antigenic phenotypes, as measured by neutralization titers. We identify 49 specific mutations and 4 colinear mutation clusters that contribute to antigenic variation, of which 27 mutations or mutation clusters have an antigenic impact of 0.20 log titers or greater. These mutations span all major domains of E, and occur both within and between serotypes. This demonstrates that DENV antigenic divergence is closely coupled to genetic divergence. We use these mutations to infer unmeasured antigenic relationships between viruses, revealing substantial within-serotype antigenic variation. For comparison, we reconstructed the ancestral sequence of each serotype and constrained the model to only permit antigenic change to be attributed to these serotype-level differences. While this interserotype-only model predicts titers to a reasonable degree, we find that it has higher error (RMSE = 0.86) than the full model which accounts for within-serotype heterogeneity (RMSE = 0.79; Table 4). This supports and expands upon previous reports (Katzelnick et al., 2015; Forshey et al., 2016; Waggoner et al., 2016) that the null hypothesis of antigenically uniform serotypes is inconsistent with observed patterns of cross-protection and susceptibility.
Titer model performance comparisons.
We compared performance across several different variations of the titer model. As described in Neher et al. (2016), incremental antigenic change can be assigned to either amino acid substitutions (‘Substitution’ model) or to branches in the phylogeny (‘Tree’ model). For each of these models, we can constrain the model such that antigenic change is allowed to occur only between serotypes (‘Interserotype’) or between AND within serotypes (‘Full’). For the substitution model, we constrain the interserotype model by reconstructing the amino acid sequence of the most recent common ancestor for each serotype and allowing the model to assign antigenic change only to mutations between these ancestral sequences. For the tree model, we constrain the interserotype model by allowing the model to assign antigenic change only to branches in the phylogeny that lie between serotypes. We also assess the impact of the virus avidity and serum potency terms, and . For all models and metrics, we report the mean and 95% confidence interval across 100-fold Monte Carlo cross validation with random 90%:10%, training:test splits.
Model | Antigenic resolution | And | RMSE | Pearson |
---|---|---|---|---|
Substitution | Full | Yes | 0.75 (0.74–0.77) | 0.78 (0.77–0.79) |
Substitution | Full | No | 1.13 (1.11–1.16) | 0.50 (0.48–0.52) |
Substitution | Interserotype | Yes | 0.86 (0.85–0.88) | 0.72 (0.70–0.73) |
Substitution | Interserotype | No | 0.86 (0.84–0.87) | 0.71 (0.70–0.72) |
Tree | Full | Yes | 0.84 (0.83–0.86) | 0.72 (0.71–0.73) |
Tree | Full | No | 1.40 (1.38–1.42) | 0.24 (0.23–0.26) |
Tree | Interserotype | Yes | 0.87 (0.85–0.88) | 0.70 (0.69–0.71) |
Tree | Interserotype | No | 0.86 (0.84–0.88) | 0.72 (0.71–0.73) |
Consistent with the relatively long timescale of dengue evolution, we observe many sites in the dengue phylogeny to have mutated multiple times. These represent instances of parallelism, reversion and homoplasy. For example, we observe that site 390 is consistently S in DENV1, N in DENV3 and H in DENV4, while DENV2 genotypes show a mixture of D, N and S (Figure 2—figure supplement 1). We estimate an antigenic impact of 0.18 log titers of the N390S mutation. Our model predicts that the parallel N390S mutations in DENV1 and DENV2 Cosmopolitan makes these viruses slightly more antigenically similar rather than more antigenically distinct. Along these lines, we compared the ‘substitution’ model to a similar model formulation (termed the ‘tree’ model) which assigns values to individual branches in the phylogeny, rather than to individual mutations, so that each branch with a positive value increases antigenic distance between strains (Neher et al., 2016). As expected from the high degree of homoplasy across the dengue phylogeny, we observe that the ‘substitution’ model outperforms the ‘tree’ model in predicting titers in validation datasets (Table 3).
To investigate the impact of this observed variation, we examine patterns of neutralization in response to vaccination with each monovalent component of the NIH vaccine candidate (Figure 3). Here, we see that each monovalent component elicits broad homotypic protection, but levels of heterotypic cross protection vary widely between heterotypic genotypes. This is consistent with previous reports of genotype-specific interactions between standing population immunity and subsequent heterotypic epidemics as modulating epidemic severity (OhAinle et al., 2011; Kochel et al., 2002). We hypothesize that this observed within-serotype variation primarily effects heterotypic secondary infection outcomes, rather than modulating homotypic immunity. Although we note that Juraska et al. (2018) demonstrate that vaccine efficacy decreases with increasing amino acid divergence of breakthrough infections from the vaccine insert.
Overall, we expect that these antigenic phenotypes represent a lower bound on the extent, magnitude, and nature of antigenic heterogeneity with DENV. Our current titer dataset spans the breadth of DENV diversity, but due to small sample size, it lacks the resolution to detect most sub-genotype antigenic variation. The appearance of the deep antigenic divergence of the four serotypes, and the more recent antigenic divergences within each serotype, suggest that DENV antigenic evolution is likely an ongoing, although gradual, process. We therefore expect that future studies with richer datasets will find additional antigenic variation within each genotype. This dataset also contains many left-censored titer values, where we know two viruses are at least titer units apart, but do not know exactly how far apart. If we knew the true value of these censored titers, many of them would indicate larger antigenic distances than the reported values, , which are used to train the model. Thus, it is likely that our model systematically underestimates the magnitude of titer distances.
Finally, antibody neutralization and escape (as measured by PRNT titers) is only one component of the immune response to DENV. Although analysis of a longitudinal cohort study shows that these neutralization titers correlate with protection from severe secondary infection, it is unclear how PRNT titers correspond to antibody-dependent enhancement (Katzelnick et al., 2016). It is also important to note that DENV case outcomes are partially mediated by interactions with innate and T-cell immunity, the effects of which are not captured in neutralization titers (Green et al., 2014). Overall, while richer datasets and the development of more holistic assays will be required in order to fully characterize the extent of DENV antigenic diversity, it is clear that the four-serotype model is insufficient to explain DENV antigenic evolution.
Viral clade dynamics
We use these inferred antigenic relationships to directly quantify the impact of antigenic fitness on DENV population composition. To do so, we measure serotype frequencies across Southeast Asia over time and construct a model to estimate how they will fluctuate (Materials and methods, Equation 6-16). This model places a fitness value on each serotype that derives from a constant intrinsic component alongside a time-dependent antigenic component. Antigenic fitness declines with population immunity, which is accumulated via the recent circulation of antigenically similar viruses. Our primary model parameterization assumes that both heterotypic and homotypic immunity wane linearly over time at the same rate, with homotypic immunity starting from a higher baseline of protection based on closer antigenic distances. We compared this to a secondary model parameterization with only heterotypic waning (see Materials and methods), under which we observe similar model performance (Table 3).
We find that antigenic fitness is able to explain much of the observed variation in serotype growth and decline (Figure 5). Forward simulations under the optimized parameter set display damped oscillations around the serotype-specific ‘set points’ determined by intrinsic fitnesses, but intrinsic fitness alone is unable to explain serotype fluctuations (; Table 3, Figure 5—figure supplement 2). This demonstrates that although intrinsic fitness plays an important role in dictating long-term dynamics, wherein particular serotypes tend to circulate at low frequency (e.g. DENV4) and others at high frequency (e.g. DENV1 and DENV2), antigenic fitness plays out on shorter-term time scales, dictating circulation over several subsequent years.
We similarly use this model to quantify the effect of within-serotype antigenic variation on the success and decline of canonical DENV genotypes (Figure 6). As above, genotype antigenic fitness declines with population immunity. Here, we estimate population immunity based on antigenic distance from recently circulating genotypes, using distances that are either genotype-specific or based only on the serotype that each genotype belongs to. We then directly compare how strongly these coarser serotype-level versus specific genotype-level antigenic relationships impact DENV population dynamics. Overall, we find that antigenic fitness explains a moderate portion of the observed variation in genotype growth and decline. Surprisingly, however, we find that incorporating within-serotype antigenic differences does not improve our predictions (Figure 6C–D). We suggest two possible explanations for this observation.
First, it may be that although genotypes are antigenically diverse, these differences do not influence large-scale regional dynamics over time. We may then hypothesize that within-serotype antigenic heterogeneity mediates disease severity, but does not influence infection or onward transmission. This hypothesis is consistent with the findings of Nagao and Koelle (2008), who demonstrated that dengue epidemiological dynamics are compatible with a model wherein immunity confers protection against severe symptoms, but not asymptomatic infection. This is also consistent with Ten Bosch et al. (2018)’s findings that asymptomatic dengue infections contribute to onward transmission.
Alternatively, this lack of signal could be methodologically explained if either (A) genotype-level frequency trajectories estimated from public data are overly noisy for this application or (B) our model of antigenic fitness based on PRNT assay data does not match reality, due to either PRNT assay data not well reflecting human immunity or due to our particular model formulation that parameterizes immunity from titer distances (Equation 6-10). In the present analysis, we are not able to firmly resolve these disparate possibilities.
These observations are also subject to caveats imposed by the available data and model assumptions. Our estimates of antigenic fitness are informed by the antigenic distances inferred by the substitution model; thus, as above, we are unable to account for nuanced antigenic differences between sub-genotype clades of DENV due to limited titer data. We estimate DENV population composition over time based on available sequence data, pooled across all of Southeast Asia (Materials and methods, Equation 4). As the vast majority of cases of DENV are asymptomatic, sequenced viruses likely represent a biased sample of more severe cases from urban centers where patients are more likely to seek and access care. We also assume that Southeast Asia represents a closed viral population with homogeneous mixing. However, increasing globalization likely results in some amount of viral importation that is not accounted for in this model (Allicock et al., 2012). Finally, although Southeast Asia experiences hyperendemic DENV circulation, the majority of DENV transmissions are hyper-local (Salje et al., 2017), and viral populations across this broad region may not mix homogeneously each season. Thus, it is possible that these sub-serotype antigenic differences impact finer-scale population dynamics, but we lack the requisite data to examine this hypothesis.
Conclusions
We find that within-serotype antigenic evolution helps explain observed patterns of cross-neutralization among dengue genotypes. We also find that serotype-level population immunity is a strong determinant of viral clade dynamics across Southeast Asia. As richer datasets become available, future studies that similarly combine viral genomics, functional antigenic characterization, and population modeling have great potential to improve our understanding of how DENV evolves antigenically and moves through populations.
Model sharing and extensions
We have provided all source code, configuration files and datasets at https://github.com/blab/dengue-antigenic-dynamics (copy archived at https://github.com/elifesciences-publications/dengue-antigenic-dynamics), and wholeheartedly encourage other groups to adapt and extend this framework for further investigation of DENV antigenic evolution and population dynamics.
Materials and methods
Data
Titers
Request a detailed protocolAntigenic distance between pairs of viruses and is experimentally measured using a neutralization titer, which measures how well serum drawn after infection with virus is able to neutralize virus in vitro (Russell and Nisalak, 1967). Briefly, two-fold serial dilutions of serum are incubated with a fixed concentration of virus . Titers represent the lowest serum concentration able to neutralize 50% of virus, and are reported as the inverse dilution. We used two publicly available plaque reduction neutralization titer (PRNT50) datasets generated by Katzelnick et al. (2015). The primary dataset was generated by infecting each of 36 non-human primates with a unique strain of DENV. NHP sera was drawn after 12 weeks and titered against the panel of DENV viruses. The secondary dataset was generated by vaccinating 31 human trial participants with a monovalent component of the NIH DENV vaccine. Sera was drawn after 6 weeks and titered against the same panel of DENV viruses. As discussed in Katzelnick et al., these two datasets show similar patterns of antigenic relationships between DENV viruses. In total, our dataset includes 1182 measurements across 48 virus strains: 36 of these were used to generate serum, and 47 were used as test viruses.
Sequences
Request a detailed protocolFor the titer model analysis, we used the full sequence of E (envelope) from the 48 strains in the titer dataset.
For the clade frequencies analysis, we downloaded all dengue genome sequences available from the Los Alamos National Lab Hemorrhagic Fever Virus Database as of March 7, 2018, that contained at least the full coding sequence of E (envelope) (total N = 12,645) (Kuiken et al., 2012). We discarded sequences which were putative recombinants, duplicates, lab strains, or which lacked an annotated sampling location and/or sampling date. We selected all remaining virus strains that were annotated as a Southeast Asian isolate (total N = 8,644).
For both datasets, we used the annotated reference dataset from Pyke et al. (2016) to assign sequences to canonical genotypes.
Alignments and trees
Request a detailed protocolWe used MAFFT v7.305b to align nucleotide E gene sequences for each strain before translating the aligned sequences (no frame-shift indels were present) (Katoh and Standley, 2013). All maximum likelihood phylogenies were constructed with IQ-TREE version 1.6.8 and the GTR + I + G15 nucleotide substitution model (Nguyen et al., 2015).
Titer model
Request a detailed protocolWe compute standardized antigenic distance between virus and serum (denoted ) from measured titers relative to autologous titers , such that
We then average normalized titers across individuals. To predict unmeasured titers, we employ the ‘substitution model’ from Neher et al. (2016) and implemented in Nextstrain (Hadfield et al., 2018), which assumes that antigenic evolution is driven by underlying genetic evolution.
In the substitution model, observed titer drops are mapped to mutations between each serum and test virus strain after correcting for overall virus avidity, , and serum potency, (‘row’ and ‘column’ effects, respectively), so that
where is the titer drop assigned to each mutation, , between serum and virus , and iterates over mutations. We randomly withhold 10% of titer measurements as a test set. We use the remaining 90% of titer measurements as a training set to learn values for virus avidity, serum potency, and mutation effects. As in Neher et al. (2016), we formulate this as a convex optimization problem and solve for these parameter values to minimize the cost function
We used , , and to minimize test error. Respectively, these terms represent the squared training error; an L1 regularization term on mutation effects, such that most values of ; and L2 regularization terms on virus avidities and serum potencies, such that they are normally distributed. These parameter values are then used to predict the antigenic distance between all pairs of viruses, and . We assess performance by comparing predicted to known titer values in our test data set, and present test error (aggregated from 100-fold Monte Carlo cross-validation) throughout the manuscript.
Viral clade dynamics
Empirical clade frequencies
Request a detailed protocolAs discussed in Neher et al. (2016) and Lee et al. (2018), we estimate empirical clade frequencies from 1970 to 2015 based on observed relative abundances of each clade in the ‘slice’ of the phylogeny corresponding to each quarterly timepoint.
Briefly, the frequency trajectory of each clade in the phylogeny is modeled according to a Brownian motion diffusion process discretized to 3-month intervals. Relative to a simple Brownian motion, the expectation includes an ‘inertia’ term that adds velocity to the diffusion and the variance includes a term to scale variance according to frequency following a Wright-Fisher population genetic process. This results in the diffusion process
with ‘volatility’ parameter and inertia parameter . The term is the increment in the previous timestep, so that . We used and to maximize fit to empirical trajectory behavior.
We also include an Bernoulli observation model for clade presence/absence among sampled viruses at timestep . This observation model follows
where represents the set of viruses that belong to the clade and represents the set of viruses that do not belong to the clade. Each frequency trajectory is estimated by simultaneously maximizing the likelihood of the process model and the likelihood of the observation model via adjusting frequency trajectory .
Population immunity
Request a detailed protocolFor antigenically diverse pathogens, antigenic novelty represents a fitness advantage (Lipsitch and O'Hagan, 2007). This means that viruses that are antigenically distinct from previously circulating viruses are able to access more susceptible hosts, allowing the antigenically novel lineage to expand. We adapt a simple deterministic model from Luksza and Lässig (2014) to directly quantify dengue antigenic novelty and its impact on viral fitness. We quantify population immunity to virus at time , , as a function of which clades have recently circulated in the past years, and how antigenically similar each of these clades is to virus , so that
where is the antigenic distance between and each non-overlapping clade , is the number of years since exposure, and is the relative frequency of at year . Waning immunity is modeled as a non-negative linear function of time following
The relationship between antigenic distance and the probability of protection, , is also assumed to be non-negative and linear with slope , such that
In addition to this primary analysis, we conducted a secondary analysis with a different parameterization of immunity that removes waning of homotypic immunity while allowing waning of heterotypic immunity. In this case, we assume the relationship between antigenic distance and the probability of protection, , to be 50% at antigenic distance and to wane based on years since infection modified by following
We model the effects of population immunity, , on viral antigenic fitness, , as
where and are fit parameters representing the slope of the linear relationship between immunity and fitness, and the intrinsic relative fitness of each serotype, respectively.
Frequency predictions
Request a detailed protocolSimilar to the model implemented in Luksza and Lässig (2014), we estimate predicted clade frequencies at time as
for short-term predictions (where year).
We do not attempt to predict future frequencies for clades with .
For long-term predictions, we must account for immunity accrued at each intermediate timepoint between and . We divide the interval between and into 3 month timepoints, , such that . We then compound immunity based on predicted clade frequencies at each intermediate timepoint following
We then calculate clade growth rates, defined as the fold-change in relative clade frequency between time and time
Null models
Request a detailed protocolTo quantify the impact of antigenic fitness on DENV clade success, we compare our antigenically-informed model to two null models.
Under the ‘equal fitness null’ model, all viruses have equal total fitness (antigenic and intrinsic fitness) at all timepoints
Under the ‘intrinsic fitness null’ model, all viruses have equal antigenic fitness but serotype-specific intrinsic fitness at all timepoints
Model performance assessment and parameter fitting
Request a detailed protocolWe assess predictive power as the root mean squared error between predicted and empirical clade frequencies. To assess both the final frequency predictions and the predicted clade trajectories, this RMSE includes error for each clade, for each starting timepoint , and for each intermediate predicted timepoint .
Our frequency prediction model has a total of six free parameters. We jointly fit these parameters to minimize RMSE of serotype frequency predictions via the Nelder-Mead algorithm as implemented in SciPy v.1.0.0 (Table 2) (Jones et al., 2001; Gao and Han, 2012). We use years of previous immunity that contribute to antigenic fitness and project years in the future when predicting clade frequencies.
Simulations
Request a detailed protocolTo ensure the model machinery functions correctly, we seeded a forward simulation of clade dynamics with 2 years of empirical frequencies and simulated predicted dynamics over the remainder of the time course (Figure 5—figure supplement 3). We then fit model parameters as described above, and obtained parameter values that well recover input values (Table 5).
Parameter recovery against simulated data.
https://doi.org/10.7554/eLife.42496.016Parameter | Input value | Optimized value |
---|---|---|
3.25 | 3.10 | |
0.55 | 0.56 | |
2.35 | 2.57 | |
0.70 | 0.72 | |
0.85 | 0.78 | |
0.40 | 0.41 |
Data and software availability
Request a detailed protocolSequence and titer data, as well as all source code used for analyses and figure generation, is publicly available at https://github.com/blab/dengue-antigenic-dynamics (copy archived at https://github.com/elifesciences-publications/dengue-antigenic-dynamics). Our work relies upon many open source Python packages and software tools, including iPython (Perez and Granger, 2007), Matplotlib (Hunter, 2007), Seaborn (Waskom, 2017), Pandas (McKinney, 2010), CVXOPT (Andersen et al., 2013), NumPy (van der Walt et al., 2011; Gao and Han, 2012), Biopython (Cock et al., 2009), SciPy (Jones et al., 2001), Statsmodels (Seabold and Perktold, 2010), Nextstrain (Hadfield et al., 2018), MAFFT (Katoh and Standley, 2013), and IQ-TREE (Nguyen et al., 2015). Package versions are documented in the GitHub repository.
Data availability
All data, code, model implementations, analyses and figures are available via our online repository at github.com/blab/dengue-antigenic-dynamics (copy archived athttps://github.com/elifesciences-publications/dengue-antigenic-dynamics).
References
-
Phylogeography and population dynamics of dengue viruses in the americasMolecular Biology and Evolution 29:1533–1543.https://doi.org/10.1093/molbev/msr320
-
SoftwareCVXOPT: a Python package for convex optimizationAbel Ee Ucla Edu/cvxopt.
-
Strength and tempo of selection revealed in viral gene genealogiesBMC Evolutionary Biology 11:220.https://doi.org/10.1186/1471-2148-11-220
-
Incomplete protection against dengue virus type 2 Re-infection in peruPLOS Neglected Tropical Diseases 10:e0004398.https://doi.org/10.1371/journal.pntd.0004398
-
Implementing the Nelder-Mead simplex algorithm with adaptive parametersComputational Optimization and Applications 51:259–277.https://doi.org/10.1007/s10589-010-9329-3
-
Identification of distinct antigenic determinants on dengue-2 virus using monoclonal antibodiesThe American Journal of Tropical Medicine and Hygiene 31:548–555.https://doi.org/10.4269/ajtmh.1982.31.548
-
Analysis of repeat hospital admissions for dengue to estimate the frequency of third or fourth dengue infections resulting in admissions and dengue hemorrhagic fever, and serotype sequencesThe American Journal of Tropical Medicine and Hygiene 77:910–913.https://doi.org/10.4269/ajtmh.2007.77.910
-
Innate immunity to dengue virus infection and subversion of antiviral responsesJournal of Molecular Biology 426:1148–1160.https://doi.org/10.1016/j.jmb.2013.11.023
-
Nextstrain: real-time tracking of pathogen evolutionBioinformatics 34:4121–4123.https://doi.org/10.1093/bioinformatics/bty407
-
In vivo enhancement of dengue virus infection in rhesus monkeys by passively transferred antibodyJournal of Infectious Diseases 140:527–533.https://doi.org/10.1093/infdis/140.4.527
-
The origin, emergence and evolutionary genetics of dengue virusInfection, Genetics and Evolution 3:19–28.https://doi.org/10.1016/S1567-1348(03)00004-2
-
Matplotlib: a 2D graphics environmentComputing in Science & Engineering 9:90–95.https://doi.org/10.1109/MCSE.2007.55
-
SciPy: Open source scientific tools for PythonSciPy: Open source scientific tools for Python, http://www.scipy.org/.
-
MAFFT multiple sequence alignment software version 7: improvements in performance and usabilityMolecular Biology and Evolution 30:772–780.https://doi.org/10.1093/molbev/mst010
-
The LANL hemorrhagic fever virus database, a new platform for analyzing biothreat virusesNucleic Acids Research 40:D587–D592.https://doi.org/10.1093/nar/gkr898
-
Molecular evolution and phylogeny of dengue-4 virusesJournal of General Virology 78:2279–2284.https://doi.org/10.1099/0022-1317-78-9-2279
-
Patterns of antigenic diversity and the mechanisms that maintain themJournal of the Royal Society Interface 4:787–802.https://doi.org/10.1098/rsif.2007.0229
-
Challenges in dengue research: a computational perspectiveEvolutionary Applications 11:516–533.https://doi.org/10.1111/eva.12554
-
Natural, persistent oscillations in a spatial multi-strain disease system with application to denguePLOS Computational Biology 9:e1003308.https://doi.org/10.1371/journal.pcbi.1003308
-
ConferenceData structures for statistical computing in PythonProceedings of the 9th Python in Science Conference. pp. 51–56.
-
On the risk of severe dengue during secondary infection: a systematic review coupled with mathematical modelingJournal of Vector Borne Diseases 51:153.
-
IQ-TREE: a fast and effective stochastic algorithm for estimating maximum-likelihood phylogeniesMolecular Biology and Evolution 32:268–274.https://doi.org/10.1093/molbev/msu300
-
Dynamics of dengue disease severity determined by the interplay between viral genetics and serotype-specific immunityScience Translational Medicine 3:114ra128.https://doi.org/10.1126/scitranslmed.3003084
-
Reduced risk of disease during postsecondary dengue virus infectionsThe Journal of Infectious Diseases 208:1026–1033.https://doi.org/10.1093/infdis/jit273
-
IPython: a system for interactive scientific computingComputing in Science & Engineering 9:21–29.https://doi.org/10.1109/MCSE.2007.53
-
Interactions between serotypes of dengue highlight epidemiological impact of cross-immunityJournal of the Royal Society Interface 10:20130414.https://doi.org/10.1098/rsif.2013.0414
-
Dengue virus identification by the plaque reduction neutralization testJournal of Immunology 99:291–296.
-
Research on dengue during world war IIThe American Journal of Tropical Medicine and Hygiene 1:30–50.https://doi.org/10.4269/ajtmh.1952.1.30
-
Risk factors in dengue shock syndrome: a prospective epidemiologic study in Rayong, Thailand. I. the 1980 outbreakAmerican Journal of Epidemiology 120:653–669.https://doi.org/10.1093/oxfordjournals.aje.a113932
-
ConferenceStatsmodels: econometric and statistical modeling with Python9th Python in Science Conference.
-
The global burden of dengue: an analysis from the global burden of disease study 2013The Lancet Infectious Diseases 16:712–723.https://doi.org/10.1016/S1473-3099(16)00026-8
-
Regression shrinkage and selection via the lassoJournal of the Royal Statistical Society: Series B (Methodological) 58:267–288.https://doi.org/10.1111/j.2517-6161.1996.tb02080.x
-
Inferring the rate and time-scale of dengue virus evolutionMolecular Biology and Evolution 20:122–129.https://doi.org/10.1093/molbev/msg010
-
The NumPy array: a structure for efficient numerical computationComputing in Science & Engineering 13:22–30.https://doi.org/10.1109/MCSE.2011.37
-
Homotypic dengue virus reinfections in nicaraguan childrenJournal of Infectious Diseases 214:986–993.https://doi.org/10.1093/infdis/jiw099
Decision letter
-
Neil M FergusonReviewing Editor; Imperial College London, United Kingdom
-
Diethard TautzSenior Editor; Max-Planck Institute for Evolutionary Biology, Germany
-
José LourençoReviewer; University of Oxford, United Kingdom
In the interests of transparency, eLife includes the editorial decision letter and accompanying author responses. A lightly edited version of the letter sent to the authors after peer review is shown, indicating the most substantive concerns; minor comments are not usually included.
Thank you for submitting your article "Dengue antigenic relationships predict evolutionary dynamics" for consideration by eLife. Your article has been reviewed by Diethard Tautz as the Senior Editor, a Reviewing Editor, and three reviewers. The following individual involved in the review of your submission has agreed to reveal his identity: José Lourenço (Reviewer #3).
The reviewers have discussed the reviews with one another and the Reviewing Editor has drafted this decision to help you prepare a revised submission.
Summary:
In this manuscript, Bell and colleagues analyse antibody titer measurements from a non-human primate study and a monovalent vaccine study in humans to determine (a) whether and to what extent antigenic variation is present within dengue's 4 serotypes, DENV 1-4; and (b) whether the within-serotype antigenic variation that they find contributes to/is informative of dengue virus population dynamics.
Essential revisions:
First half of manuscript:
1) Demonstrate more effectively that the within-serotype antigenic differences are robust by:a) performing the analysis on each of the two datasets separately, indicating whether and to what extent the antigenic differences found by each of the two datasets are consistent with one another;b) providing a list of amino acid substitutions that occur on every branch with a positive inferred db value using the results derived from the use of the two datasets simultaneously.
Second half of manuscript:
2) Demonstrate the appropriateness of using strain frequencies as a proxy for serotype prevalence through a comparison with available epidemiological data.
3) Provide a demonstration on simulated data that this fitness model approach would be/would not be able to recover the "true" input model. The simulated data presumably should be at the same resolution and depth as the empirical data.
4) Given that the intrinsic fitness differences inferred are so large between the serotypes, perform an analysis that demonstrates that this null model does not do as well as the serotype-level antigenic differences (+ intrinsic fitness differences) model. Further, are these intrinsic fitness differences supported by existing epidemiological and/or virological data?
5) Incorporate uncertainty in provided estimates.
Reviewer #1:
In this manuscript, Bell and colleagues analyze titer measurements from a non-human primate study and a monovalent vaccine study in humans to determine (a) whether and to what extent antigenic variation is present within dengue's 4 serotypes, DENV 1-4; and (b) whether the within-serotype antigenic variation that they find contributes to/is informative of dengue virus population dynamics. The presented work uses a number of different approaches that have been previously developed elsewhere and applied mostly to influenza viruses. By applying these approaches to dengue, Bell and colleagues find evidence for within-serotype antigenic differences. These intra-serotypic antigenic differences, however, do not appear to provide better predictive power in terms of dengue's population dynamics.
Specific comments:
1) I think the authors do a good job at convincing the reader that there is antigenic variation present within dengue serotypes. However, is there already evidence for this finding based on Katzelnick's previous work using antigenic maps? If so, why is this finding novel here? I understand that a different (phylogeny-based) approach is used here, and that, for several reasons, this phylogenetic approach might be preferable over an antigenic map approach. Are the key biological results the same across these studies, though? More text on this is necessary to convince the reader that this work constitutes a major, novel result.
2) The authors infer antigenic distances based on two very different datasets: a non-human primate dataset and a human dataset. The NHP dataset uses experimental challenges with DENV, with sera being drawn 3 months post-infection. The human dataset uses sera from a monovalent vaccine study, with sera drawn after 6 weeks. Due to the difference in host species, time at which sera are drawn, and the identity of the virus (vaccine strain vs. unattenuated strain), it would be interesting to infer the antigenic relationships for each dataset separately and compare across the datasets using the phylogeny-based approach. Consistent findings across the two datasets would substantiate the results. I recognize that Katzelnick et al., 2015 compared these datasets, but they did not use the phylogeny-based approach.
3) The authors conclude that between-serotype antigenic differences are important for accurately predicting dengue dynamics, but that incorporating within-serotype antigenic variation does not provide greater prediction accuracy. Since the differences in the intrinsic fitness values of the 4 serotypes are very large (Table S1 and Figure 6), to demonstrate convincingly that antigenic differences at the between-serotype level matter, I think what must be shown is the prediction accuracy under the assumption of no antigenic variation at all. From Figure 6, it seems that intrinsic fitness differences between the 4 serotypes might account for the overwhelming majority of prediction accuracy. The authors provide a null model with no intrinsic fitness differences in the supplemental section (equations 16-19), but never report on the findings of this null model, as far as I can see. Including it in Table S1, and in text in the main manuscript, I think is important.
4) Is there a relationship between intrinsic fitnesses that are inferred in the second half of the paper and 'row and column' effects inferred in the first half of the paper? It seemed like this might be a possibility.
5) Subsection “Antigenic evolution occurs within serotypes: inference of db/lasso regression. Instead of showing Figure 5 and Figure 5—figure supplement 1, could you just show the phylogeny again (e.g. Figure 1A), with all non-zero db values that were inferred labeled on the tree? This would be a nicer, more clear visualization, I think. Along with this, could you add a table that contains, for every branch that carries a non-zero db value, the list of amino acid changes that were inferred on that branch? This should be easily do-able using Nextstrain, and it would be informative. If many of the branches with inferred non-zero db values havs no amino acid changes in env, this would also indicate possible issues with the results.
Reviewer #2:
The manuscript by Bell et al., performs analyses that seek to describe the structure of antigenic variation in dengue virus and to demonstrate its significance for epidemiological dynamics. The analysis of epidemiological dynamics is performed on data from Southeast Asia and considers antigenic groupings at the level of conventional serotype designations for dengue virus and also at one level below that, which are the same as conventional dengue virus genotype groupings and come out to three antigenically distinct groups below the level of each serotype. The latter set of groupings is supported by analyses presented here. One pair of these groupings below the level of serotype are consistent with a limited set of findings from dengue vaccine trials about differential efficacy by DENV-4 genotype. In terms of the influence of the antigenic groupings identified here on epidemiological dynamics, the authors found support for conventional serotype groupings being associated with patterns of serotype turnover across years. Below the level of conventional serotypes, results about the influence of antigenic groupings on epidemiological dynamics were more equivocal.
The approach used to define antigenic groupings has a direct correspondence to genetic groupings obtained through phylogenetic analysis. The estimation of how antigenic profile evolved along this phylogeny was then performed secondarily, with rates of antigenic evolution on different branches allowed to vary such that antigenic distances between available sample pairs could then be explained by summing rates of antigenic evolution across the lineages separating a given pair. This approach yielded the strongest results of the manuscript, which show that the inferred patterns of antigenic evolution along the dengue virus phylogeny explain a considerable amount of variation in antigenic distances among sample pairs (Pearson correlation = 0.86). Interestingly, this result compares favorably to a related analysis that limited antigenic evolution up to the point of the most recent common ancestor of each serotype (Pearson correlation = 0.79). As the authors acknowledge, most antigenic variation is still explained by conventional serotype groupings, but that is to be expected. And there is still a considerable amount of variation explained below the level of serotype. The use of 10-fold cross-validation is a notable strength of this analysis.
The other major component of the results pertained to the influence of antigenic evolution on epidemiological dynamics.
First, it should be noted that the basis for this analysis was a reconstruction of serotype and genotype dynamics estimated through an approach that made use of the number of lineages of a given type at each time point in the time series. Although clever, a major limitation of such an approach is that the estimated dynamics of the different types could be extremely sensitive to which samples were used to estimate the phylogeny; e.g., more samples of a given type at different times could lead to different results, and there is no guarantee that the samples were collected in some sort of representative fashion. Sampling issues such as these are major issues for many phylogenetic analyses, and I see no reason why this analysis would be exempt from that type of concern. Although there are precious few data sets that can be used to inform historical patterns of dengue serotypes, there are some based on clinical incidence that could at least be used as an independent comparison against the historical dynamics reconstructed here. Were there to be some level of agreement between these estimates of historical patterns of dengue serotypes, that could help assuage some of these concerns about sampling issues to at least some extent. One possibility is a data set from Thailand described in Reich et al.,(2013).
Second, there are two sets of results that derive from this analysis. The first is at the level of serotype, and it shows that antigenic novelty is associated with short-term changes in relative frequencies of serotypes. The second is at the level of the twelve antigenic groupings identified in the first portion of this manuscript, and it shows that resolution in antigenic variation below the level of conventional serotypes does not provide any additional power to explain short-term changes in relative frequencies of these sub-serotype groupings. In terms of the significance and implications of these two results, the first seems consistent with existing knowledge of dengue virus serotype dynamics, and the second leaves the hypothesis that sub-serotype antigenic variation affects epidemiological dynamics either unresolved (if you assume there was too much noise for this approach to work) or perhaps even refuted (if you assume that this was a fair test of that hypothesis). In light of the issues raised in my first comment about this analysis (among others), my interpretation is that there was simply not enough of a signal in the sub-serotype data to come to any firm conclusion one way or another. Truthfully, I would prefer for an analysis such as this to not even be attempted without greater confidence going into it that a valid result could be obtained (which could be demonstrated through simulation studies, for example).
Reviewer #3:
Summary:
The research in this manuscript describes and tries to understand immunity to / of genetic variants (genotypes) of dengue serotypes. Critically, I believe that the main questions addressed in this study could be the answer to puzzles yet to be solved on the population biology and epidemiology of dengue viruses. The results presented could not fully measure / discern the population-level impact of the newly identified 12 antigenic phenotypes versus the canonical 4, but it should motivate the community to pursue this important line of research. I found the article well written, with clear presentation of results and method explanation. I am generally happy with the results and inclined to agree with what has been demonstrated. Although I feel the results are of general interest to eLife readers, a wider discussion should take place on whether the manuscript is, methodologically and / or relating to data, offering enough to fit the remit of the journal. I have some specific comments, mainly related to waning, intrinsic fitness, and data / method details that I ask to be addressed by the authors.
Specific comments:
The first sentence of the Conclusions is an overstatement (an exception compared to the rest of the text, generally fair on the results presented). 'We find that within-sero antigenic evolution is necessary to explain observed patterns of cross-immunity and susceptibility…'- given the results presented, it is not true that it is 'necessary'. Perhaps a fairer statement is that '… evolution helps explain observed patterns of cross-neutralization among genotypes'. Note that cross-immunity and susceptibility are never attempted to be explained.
From the methods it seems that empirical clade frequencies were estimated from the phylogeny in Figure 1 (although not explicit), which is from a subsample (N=2563) of the entire database (N=12649). Should the frequencies be estimated from the largest set? This is important in the context of conclusion / discussion that (future) 'richer datasets' may help fill in the gaps of this study. Please clarify if only the smallest set was used and why using the largest would not have changed results of Figure 6A and Figure 7A.
The authors refer to using sequences with 'full coding sequence of E'. It is not clear to me if this means that phylogenies are based solely on ENV? (not full genome?). If so, authors should defend this decision and potentially discuss implications.
It’s important that credit is given to studies that have previously suggested that 'the null hypothesis of antigenically uniform serotypes is inconsistent with observed patterns of cross-protection and susceptibility…' (in Discussion section). The authors refer to previous study Katzelnick et al., 2015 only, but others exist, e.g. Forshey et al., 2016; Waggoner et al., 2016.
At the end of the first paragraph of the Discussion section, authors make reference to DENV4-specific and genotype dependent CYD-TDV efficacies. It isn't clear why only this example is given. E.g. it is important for the reader to know if CYD-TDV efficacies presented no differences between other genotypes, or if these were simply not measured in the trials.
Waning immunity: In the context of Figure 6, with genetic resolution and antigenic resolution at serotype and interserotype (respectively, Table S1), waning immunity (γ) can be interpreted as serotype-associated temporary transcending immunity. This is, I assume, why the estimation of fast waning makes biological sense. But in that case, I ask the authors to clarify what the interpretation of γ should be when the genetic resolution is genotype (and antigenic resolution is either interserotype or full tree; note that Table S1 has γ fixed across all models). From the definition of expression 7, does it imply that between genotype waning is as fast as between serotype waning? If so, waning exists at all (data) resolutions and is generally both transcending and temporary? This feels like a major result, but it is not discussed.
Intrinsic fitness differences (estimated values): estimations in Table S1 present significant differences between serotypes. This is not discussed in the main text and it feels like a result that should be supported by previous work. For example, are there in vitro, in vivo or population-based measures suggesting that intrinsic fitness follows the general rule DENV1 >= DENV2 >> DENV3 >> DENV4?
Intrinsic fitness differences (necessity of): the authors include the possibility of (model) intrinsic fitness differences between the serotypes. This is a reasonable assumption given the clear differences observed in empirical clade frequencies (Figure 6A), which generally follow the rule of 'success' in order DENV1 >= DENV2 >> DENV3 >> DENV4 (in fact, I believe this is an ubiquitous world trend). I would like to suggest to the authors an alternative / complementary factor that arises from the results presented (Figure 5, Figure 5—figure supplement 1). It seems that antigenic phenotypes of DENV4 are the most closely related, followed by DENV3, and DENV1-2 (visually, from branch distances between them). Could this be hinting on the fact that the higher success (empirical clade frequencies) of DENV1-2 is related to the fact that clades can more easily co-circulate given that herd-immunity escape is 'easier'? (in other words, reinfection with DENV1-2 genotypes is more common). In contrast, DENV4 would be less successful, because any clade will find high resistance to transmission (herd-immunity from other clades / antigenic phenotypes). I think it is important for the authors to consider this possibility, since the current assumption / estimation of very high differences in intrinsic fitness between serotypes may not be supported by the literature (see my other comment on Intrinsic fitness differences).
Results section: 'However, we find that accounting for within-serotype antigenic evolution substantially improves our ability to explain dengue antigenic phenotypes'. Please clarify if a more correct statement is instead: 'However, we find that accounting for within-serotype antigenic evolution substantially improves our ability to explain cross-genotype neutralization data'.
NHP versus human data: Figure 2 presents the data for 3-month post infection of NHPs. Just before the figure, this NHP data set is explained (linked to Figure 1A), but human data is also mentioned. As far as I understand the human data set is not included in this study? This is only clear when checking Figure 1A.
NHP dataset: the original data set in Katzelnick et al., 2015 (Table S4) appears to contain a larger number of sera and virus entries than presented in Figure 2 (I believe S4 is the correct dataset?). These are the discrepancies I found for virus (rows): DENV2 13 versus 16 (Figure 2, Table S4, respectively), DENV3 8 verus 9, DENV 4 9 versus 11. For sera (columns): DENV1 6 versus 8 (Figure 2, Table S4, respectively), DENV2 9 versus 12, DENV4 7 versus 8. Please clarify if I got this wrong, or if some of the data was not used in the current study.
In Figure 5, the antigenic phenotypes of sequences in Figure 1 are presented. It seems that some of the genotypes in Figure 1 are missing in the legend of Figure 5. For instance, DENV2 ASIANI, ASIANII, DENV1 II, DENV1 IV, DENV4III, etc. I understand that antigenically uniform clades have been collapsed, but the legend should include all original genotypes. Also, DENV4 sylvatic is stated, but its use and / or results associated with it have not been mentioned elsewhere in the text?
[Editors' note: further revisions were requested prior to acceptance, as described below.]
Thank you for resubmitting your work entitled "Dengue antigenic relationships predict evolutionary dynamics" for further consideration at eLife. Your revised article has been favorably evaluated by Diethard Tautz (Senior Editor), a Reviewing Editor, and two reviewers.
The manuscript has been improved but there are some remaining issues that need to be addressed before acceptance, as outlined below:
Title
The title must be revised. It focuses on the portion of your analysis having to do with viral clade dynamics, and the content of the statement made in this title is only supported at the serotype level. By focusing on this portion of their results – which in our opinion is secondary in its significance compared to the rest about the genetics underlying antigenic differences etc. – and not including words such as "at the serotype level". This title has great potential to be very misleading and widely misunderstood.
Abstract
"We find that antigenic fitness mediates fluctuations in DENV clade frequencies, although this appears to be primarily explained by coarser serotype-level antigenic differences." should be revised to "We find that antigenic fitness mediates fluctuations in DENV clade frequencies, but only at the serotype level."
"These results provide a more nuanced understanding of dengue antigenic evolution…" Is that really true? We suggest this statement be made more precise.
Author summary
"We find that antigenic fitness is a key determinant of DENV population turnover, although this appears to be driven by coarser serotype-level antigenic differences." should be revised to "We find that antigenic fitness is a key determinant of DENV population turnover, but only at the serotype level."
Discussion section
We wonder if there might be a third hypothesis C. Perhaps the variable cross-reactivity that they see below the serotype level impacts disease severity (as suggested in the case they built up in the introduction) but does not impair infection and subsequent transmission (which are what really have to do with viral fitness that should have been picked up on in the clade dynamics analysis). Recent work by ten Bosch et al. (PloS Pathogens, 2018) estimated that asymptomatic and mild infections are still relatively transmissible compared to more severe infections, which is consistent with this possibility.
Conclusion
"We also find that population immunity is a strong determinant of the composition of the DENV population across Southeast Asia, although this is putatively driven by coarser, serotype-level antigenic differences." should be revised to "We also find that population immunity is a strong determinant of the composition of the DENV population across Southeast Asia, but only at the serotype level."
https://doi.org/10.7554/eLife.42496.021Author response
Summary:
In this manuscript, Bell and colleagues analyse antibody titer measurements from a non-human primate study and a monovalent vaccine study in humans to determine (a) whether and to what extent antigenic variation is present within dengue's 4 serotypes, DENV 1-4; and (b) whether the within-serotype antigenic variation that they find contributes to/is informative of dengue virus population dynamics.
Essential revisions:
First half of manuscript:
1) Demonstrate more effectively that the within-serotype antigenic differences are robust by: a) performing the analysis on each of the two datasets separately, indicating whether and to what extent the antigenic differences found by each of the two datasets are consistent with one another;
This raises a key question of whether the identified antigenic differences between dengue viruses are relevant only for infection of non-human primates. While we agree it would be interesting to do a head-to-head comparison between the results from each dataset independently, the human dataset consists of only four serum strains. This does not provide sufficient resolution to map antigenic change to specific substitutions or branches based on the human data alone. To address the underlying question of whether these antigenic differences are species-specific, we instead examine the error distribution of out-of-sample titer predictions, stratified by serum species (Figure 2—figure supplement 1). If these inferred antigenic differences were driven by one host species, we would expect to see systematic differences in predictive power between serum isolated from each species. We observe comparable prediction error for both species, suggesting that these differences in viral antigenic phenotype are independent of host species and serum from both human and NHP fit equally well into a joint model.
b) providing a list of amino acid substitutions that occur on every branch with a positive inferred db value using the results derived from the use of the two datasets simultaneously.
As described in the cover letter, this suggestion was particularly fruitful; thank you! We now map antigenic change to substitutions, instead of branches in the phylogeny. We identify 49 specific substitutions and four colinear substitution clusters that are antigenically relevant. We report these substitutions and the magnitude of their contributions to antigenic change in Table S1 and visualize these mutations and their magnitude in new Figure 2. As described in the cover letter, properly addressing mutations lead us to switch to a “substitution” model rather than a “tree” model as primary model to estimate antigenic distances from titer data. Switching to the substitution model improved model fit over tree model (Table S2).
Second half of manuscript:
2) Demonstrate the appropriateness of using strain frequencies as a proxy for serotype prevalence through a comparison with available epidemiological data.
We thank reviewer #2 for helpfully pointing us to the case count dataset from Reich et al.,2013, which consists of serotype-specific biweekly case counts for a children’s hospital in Bangkok from 1973–2010. We binned these counts into quarterly timepoints to estimate the proportion of reported cases per serotype, per quarter from 1975–2010.
We then assembled a dataset of Thai dengue sequences and estimated serotype frequencies over the same time period as described in the Methods (Equations 4–5).
We show a head-to-head comparison of these two estimates of serotype frequency in Figure 1—figure supplement 1.
As evident in the time series plots, we see generally good concordance between the two measures, although there are some time periods where our estimated frequencies do not capture all of the dengue diversity circulating (e.g., this metric ‘misses’ the early 1990s Bangkok outbreak of dengue 4 that is suggested by the case counts). We believe this is primarily due to the mismatch in sampling frame, where some of the hyperlocal transmission within Bangkok is not captured by the country-level comparison dataset.
Importantly, our estimates of serotype frequency estimates are smoothed, whereas the case counts oscillate from one time point to the next. We believe this artificially deflates correlation coefficients between the two measures.
3) Provide a demonstration on simulated data that this fitness model approach would be/would not be able to recover the "true" input model. The simulated data presumably should be at the same resolution and depth as the empirical data.
This was a very helpful suggestion. We seeded a simulation with two years of empirical serotype frequencies and then simulated forward to generate frequency values over the remainder of the time course. We then fit parameters to this simulated data as described in the Materials and methods section and were able to recover the true input parameters (Table 2, Figure 5—figure supplement 1).
4) Given that the intrinsic fitness differences inferred are so large between the serotypes, perform an analysis that demonstrates that this null model does not do as well as the serotype-level antigenic differences (+ intrinsic fitness differences) model. Further, are these intrinsic fitness differences supported by existing epidemiological and/or virological data?
In the antigenically informed model, clade fitness is additively determined by antigenic fitness (i.e., frequency-weighted antigenic distance from recently circulating clades) and intrinsic fitness (a time-invariant, serotype-specific, fit parameter).
For both serotypes and genotypes, we now also report model performance under two null formulations. In the ‘equal fitness null’ model, all clades are assigned equal total fitness. In the ‘intrinsic fitness null’, clade fitness is determined only by intrinsic fitness. As shown in Table S3, these null models all have higher prediction error than the antigenically-informed model for both serotypes and genotypes. These null models are particularly poor at predicting clade growth rates, with R2 ≤ 0.04. From this, it is clear that intrinsic fitness alone is a poor predictor of serotype and genotype population dynamics.
We investigated the literature and could not find data addressing these sort of intrinsic fitness differences via competition assays. We’ve made a note of this in the text:
“We also find that these dynamics are best explained by intrinsic fitness that moderately varies by serotype; we are not aware of any literature that directly addresses this observation via competition experiments.”
5) Incorporate uncertainty in provided estimates.
To assess model error, we can ask two related questions about how well it predicts the dynamics of each clade, at each starting time point:
- How well does the model predict the frequency trajectory (i.e., the change in frequency from time t → t + 0.25 → t + 0.5 … → t + dt) of each clade? To quantify this, we calculate the root mean squared error of frequency predictions, incorporating all stepwise predictions (of all clades, for all starting timepoints).
- How well does the model predict overall clade growth or decline (i.e., the fold-change in frequency from t → t + dt)?
To quantify this, we report accuracy (i.e., the proportion of predictions for which the predicted and observed growth rate were both > 1 or both < 1) and the correlation coefficient of predicted vs observed growth rates.
These values are now reported for all model variations in Table S3.
Reviewer #1:
In this manuscript, Bell and colleagues analyze titer measurements from a non-human primate study and a monovalent vaccine study in humans to determine (a) whether and to what extent antigenic variation is present within dengue's 4 serotypes, DENV 1-4; and (b) whether the within-serotype antigenic variation that they find contributes to/is informative of dengue virus population dynamics. The presented work uses a number of different approaches that have been previously developed elsewhere and applied mostly to influenza viruses. By applying these approaches to dengue, Bell and colleagues find evidence for within-serotype antigenic differences. These intra-serotypic antigenic differences, however, do not appear to provide better predictive power in terms of dengue's population dynamics.
Specific comments:
1) I think the authors do a good job at convincing the reader that there is antigenic variation present within dengue serotypes. However, is there already evidence for this finding based on Katzelnick's previous work using antigenic maps? If so, why is this finding novel here? I understand that a different (phylogeny-based) approach is used here, and that, for several reasons, this phylogenetic approach might be preferable over an antigenic map approach. Are the key biological results the same across these studies, though? More text on this is necessary to convince the reader that this work constitutes a major, novel result.
The reviewer is correct that the original publication of this dataset also reported some degree of within-serotype antigenic heterogeneity. However, the models presented here add additional evidence that this observed antigenic heterogeneity is the result of an underlying evolutionary process, rather than technical noise, and that these antigenic dynamics have a significant impact on dengue evolution and population turnover. We also report a parsimonious list of substitutions that measurably impact dengue antigenic phenotypes.
2) The authors infer antigenic distances based on two very different datasets: a non-human primate dataset and a human dataset. The NHP dataset uses experimental challenges with DENV, with sera being drawn 3 months post-infection. The human dataset uses sera from a monovalent vaccine study, with sera drawn after 6 weeks. Due to the difference in host species, time at which sera are drawn, and the identity of the virus (vaccine strain vs. unattenuated strain), it would be interesting to infer the antigenic relationships for each dataset separately and compare across the datasets using the phylogeny-based approach. Consistent findings across the two datasets would substantiate the results. I recognize that Katzelnick et al., 2015 compared these datasets, but they did not use the phylogeny-based approach.
We agree that this is an important issue. Please see essential revisions response 1a.
3) The authors conclude that between-serotype antigenic differences are important for accurately predicting dengue dynamics, but that incorporating within-serotype antigenic variation does not provide greater prediction accuracy. Since the differences in the intrinsic fitness values of the 4 serotypes are very large (Table S1 and Figure 6), to demonstrate convincingly that antigenic differences at the between-serotype level matter, I think what must be shown is the prediction accuracy under the assumption of no antigenic variation at all. From Figure 6, it seems that intrinsic fitness differences between the 4 serotypes might account for the overwhelming majority of prediction accuracy. The authors provide a null model with no intrinsic fitness differences in the supplemental section (equations 16-19), but never report on the findings of this null model, as far as I can see. Including it in Table S1, and in text in the main manuscript, I think is important.
We agree that this is an important issue. Please see essential revisions response 4.
4) Is there a relationship between intrinsic fitnesses that are inferred in the second half of the paper and 'row and column' effects inferred in the first half of the paper? It seemed like this might be a possibility.
No, these are separate parameters. Virus avidity and serum potency are parameters modulating antigenic similarity between strains, separate from intrinsic fitness which affects clade success outside of antigenicity. Additionally, the ‘row and column’ effects from the first half of the paper correspond to the overall viral avidity and serum potency of specific strains. The intrinsic fitnesses in the second half of the paper are fit parameters that are time-invariant and correspond to serotypes. We apologize for the lack of clarity, and have updated the text accordingly.
5) Subsection “Antigenic evolution occurs within serotypes: inference of db/lasso regression. Instead of showing Figure 5 and Figure 5—figure supplement 1, could you just show the phylogeny again (e.g. Figure 1A), with all non-zero db values that were inferred labeled on the tree? This would be a nicer, more clear visualization, I think. Along with this, could you add a table that contains, for every branch that carries a non-zero db value, the list of amino acid changes that were inferred on that branch? This should be easily do-able using Nextstrain, and it would be informative. If many of the branches with inferred non-zero db values havs no amino acid changes in env, this would also indicate possible issues with the results.
We agree that these visualizations are more descriptive, and have added the requested table (Table S1). Please see the essential revisions response 1, as well as new Figure 2, Figure 3 and Figure 4.
Reviewer #2:
The manuscript by Bell et al., performs analyses that seek to describe the structure of antigenic variation in dengue virus and to demonstrate its significance for epidemiological dynamics. The analysis of epidemiological dynamics is performed on data from Southeast Asia and considers antigenic groupings at the level of conventional serotype designations for dengue virus and also at one level below that, which are the same as conventional dengue virus genotype groupings and come out to three antigenically distinct groups below the level of each serotype. The latter set of groupings is supported by analyses presented here. One pair of these groupings below the level of serotype are consistent with a limited set of findings from dengue vaccine trials about differential efficacy by DENV-4 genotype. In terms of the influence of the antigenic groupings identified here on epidemiological dynamics, the authors found support for conventional serotype groupings being associated with patterns of serotype turnover across years. Below the level of conventional serotypes, results about the influence of antigenic groupings on epidemiological dynamics were more equivocal.
The approach used to define antigenic groupings has a direct correspondence to genetic groupings obtained through phylogenetic analysis. The estimation of how antigenic profile evolved along this phylogeny was then performed secondarily, with rates of antigenic evolution on different branches allowed to vary such that antigenic distances between available sample pairs could then be explained by summing rates of antigenic evolution across the lineages separating a given pair. This approach yielded the strongest results of the manuscript, which show that the inferred patterns of antigenic evolution along the dengue virus phylogeny explain a considerable amount of variation in antigenic distances among sample pairs (Pearson correlation = 0.86). Interestingly, this result compares favorably to a related analysis that limited antigenic evolution up to the point of the most recent common ancestor of each serotype (Pearson correlation = 0.79). As the authors acknowledge, most antigenic variation is still explained by conventional serotype groupings, but that is to be expected. And there is still a considerable amount of variation explained below the level of serotype. The use of 10-fold cross-validation is a notable strength of this analysis.
The other major component of the results pertained to the influence of antigenic evolution on epidemiological dynamics.
First, it should be noted that the basis for this analysis was a reconstruction of serotype and genotype dynamics estimated through an approach that made use of the number of lineages of a given type at each time point in the time series. Although clever, a major limitation of such an approach is that the estimated dynamics of the different types could be extremely sensitive to which samples were used to estimate the phylogeny; e.g., more samples of a given type at different times could lead to different results, and there is no guarantee that the samples were collected in some sort of representative fashion. Sampling issues such as these are major issues for many phylogenetic analyses, and I see no reason why this analysis would be exempt from that type of concern. Although there are precious few data sets that can be used to inform historical patterns of dengue serotypes, there are some based on clinical incidence that could at least be used as an independent comparison against the historical dynamics reconstructed here. Were there to be some level of agreement between these estimates of historical patterns of dengue serotypes, that could help assuage some of these concerns about sampling issues to at least some extent. One possibility is a data set from Thailand described in Reich et al., (2013).
Thank you very much for pointing us to this dataset! We have done a head-to-head comparison as you suggested; please see essential revisions response 2.
Second, there are two sets of results that derive from this analysis. The first is at the level of serotype, and it shows that antigenic novelty is associated with short-term changes in relative frequencies of serotypes. The second is at the level of the twelve antigenic groupings identified in the first portion of this manuscript, and it shows that resolution in antigenic variation below the level of conventional serotypes does not provide any additional power to explain short-term changes in relative frequencies of these sub-serotype groupings. In terms of the significance and implications of these two results, the first seems consistent with existing knowledge of dengue virus serotype dynamics, and the second leaves the hypothesis that sub-serotype antigenic variation affects epidemiological dynamics either unresolved (if you assume there was too much noise for this approach to work) or perhaps even refuted (if you assume that this was a fair test of that hypothesis). In light of the issues raised in my first comment about this analysis (among others), my interpretation is that there was simply not enough of a signal in the sub-serotype data to come to any firm conclusion one way or another. Truthfully, I would prefer for an analysis such as this to not even be attempted without greater confidence going into it that a valid result could be obtained (which could be demonstrated through simulation studies, for example).
We share the reviewer’s frustration and thank them for the comment. We simulated frequencies over time and fit model parameters as described, demonstrating that the model is able to recover the true input parameters. The inability of a null result to distinguish between lack of evidence and lack of effect is a classic scientific challenge.
We’ve revised the text to highlight this exact issue:
“Overall, we find that antigenic fitness explains a moderate portion of the observed variation in genotype growth and decline. Surprisingly, however, we find that incorporating within-serotype antigenic differences does not improve our predictions (Figure 6C-D). This suggests that although genotypes are antigenically diverse, these differences do not appear to influence large-scale regional dynamics over time. This lack of signal could be explained by either (A) genotype- level frequency trajectories estimated from public data are overly noisy for this application or (B) our model of antigenic fitness based on PRNT assay data does not match reality, due to either PRNT assay data not well reflecting human immunity or due to our particular model formulation that parameterizes immunity from titer distances (Eq. 6–9). In the present analysis, we are not able to firmly resolve these disparate possibilities.”
We’ve tried to be as honest as possible with our attempt to tackle within-serotype dengue heterogeneity. We believe that there are real PRNT differences between genotypes within a serotype, where we have extended Katzelnick et al., (2015) results in showing an agreement between titers and genetic relations among viruses. We did our best to construct a model of clade dynamics that incorporates antigenic relationships. We believe presenting the null result here (caveated as it is) is the most honest thing we can do in this situation. But we agree there’s ample opportunity to improve a fitness model of clade dynamics. We’ve provided all source code in effort to encourage other groups to attempt this.
Reviewer #3:
Summary:
The research in this manuscript describes and tries to understand immunity to / of genetic variants (genotypes) of dengue serotypes. Critically, I believe that the main questions addressed in this study could be the answer to puzzles yet to be solved on the population biology and epidemiology of dengue viruses. The results presented could not fully measure / discern the population-level impact of the newly identified 12 antigenic phenotypes versus the canonical 4, but it should motivate the community to pursue this important line of research. I found the article well written, with clear presentation of results and method explanation. I am generally happy with the results and inclined to agree with what has been demonstrated. Although I feel the results are of general interest to eLife readers, a wider discussion should take place on whether the manuscript is, methodologically and / or relating to data, offering enough to fit the remit of the journal. I have some specific comments, mainly related to waning, intrinsic fitness, and data / method details that I ask to be addressed by the authors.
Specific comments:
The first sentence of the Conclusions is an overstatement (an exception compared to the rest of the text, generally fair on the results presented). 'We find that within-sero antigenic evolution is necessary to explain observed patterns of cross-immunity and susceptibility…'- given the results presented, it is not true that it is 'necessary'. Perhaps a fairer statement is that '… evolution helps explain observed patterns of cross-neutralization among genotypes'. Note that cross-immunity and susceptibility are never attempted to be explained.
We agree that the original paragraph was an overstatement. We’ve made the suggested change.
From the methods it seems that empirical clade frequencies were estimated from the phylogeny in Figure 1 (although not explicit), which is from a subsample (N=2563) of the entire database (N=12649). Should the frequencies be estimated from the largest set? This is important in the context of conclusion / discussion that (future) 'richer datasets' may help fill in the gaps of this study. Please clarify if only the smallest set was used and why using the largest would not have changed results of Figure 6A and Figure 7A.
This was a good suggestion. As explained in the cover letter, we now use a dataset of all available Southeast Asian sequences in our frequency estimations and report similar results.
The authors refer to using sequences with 'full coding sequence of E'. It is not clear to me if this means that phylogenies are based solely on ENV? (not full genome?). If so, authors should defend this decision and potentially discuss implications.
It’s important that credit is given to studies that have previously suggested that 'the null hypothesis of antigenically uniform serotypes is inconsistent with observed patterns of cross-protection and susceptibility…' (in Discussion). The authors refer to previous study Katzelnick et al., 2015 only, but others exist, e.g. Forshey et al., 2016; Waggoner et al., 2016.
Thank you for catching this! We have added these references as suggested.
At the end of the first paragraph of the Discussion, authors make reference to DENV4-specific and genotype dependent CYD-TDV efficacies. It isn't clear why only this example is given. E.g. it is important for the reader to know if CYD-TDV efficacies presented no differences between other genotypes, or if these were simply not measured in the trials.
We agree this was confusing. We no longer reference the genotype analyses of the CYD-TDV trials, and instead provide a nuanced picture of predicted cross-protection based on each of the four monovalent components of the NIH vaccine candidate in new Figure 3. We felt this was a more useful discussion of the potential impact of antigenic variation on vaccine efficacy, given that these strains are in our dataset and can be examined directly.
Waning immunity: In the context of Figure 6, with genetic resolution and antigenic resolution at serotype and interserotype (respectively, Table S1), waning immunity (γ) can be interpreted as serotype-associated temporary transcending immunity. This is, I assume, why the estimation of fast waning makes biological sense. But in that case, I ask the authors to clarify what the interpretation of γ should be when the genetic resolution is genotype (and antigenic resolution is either interserotype or full tree; note that Table S1 has γ fixed across all models). From the definition of expression 7, does it imply that between genotype waning is as fast as between serotype waning? If so, waning exists at all (data) resolutions and is generally both transcending and temporary? This feels like a major result, but it is not discussed.
We originally fit model parameters separately for each clade and antigenic resolution. However, upon further reflection, we think it is more appropriate to compare model performance across the same set of parameters. We now fit parameters to serotype clade dynamics and use these parameters throughout.
The reviewer is correct that our primary model assumes no fundamental difference between homotypic reinfection and heterotypic reinfection; everything is based on PRNT titer, wherein homotypic infections tend to be more antigenically similar than heterotypic infections according to PRNT. Our model of waning would indeed imply that homotypic waning is as fast as heterotypic waning but starts from a higher baseline of immunity. This is consistent with dynamics reported in (Katzelnick et al., 2018, Figure 1C).
We now compare the performance of this model to a variant wherein homotypic immunity does not wane, but heterotypic immunity wanes exponentially. We find approximately equal model performance under these two formulations of waning (Table 2).
We’ve made a note in the text highlighting this assumption of the primary model and the comparison between the two variants:
Results section
“This model assumes no fundamental difference between homotypic and heterotypic reinfection; rather, homotypic immunity is assumed to wane at the same rate as heterotypic immunity, but starts from a higher baseline of protection based on closer antigenic distances.”
Discussion section
“Our primary model parameterization assumes that both heterotypic and homotypic immunity wane linearly over time at the same rate, with homotypic immunity starting from a higher baseline of protection based on closer antigenic distances. We compared this to a secondary model parameterization with only heterotypic waning (see Materials and methods), under which we observe similar model performance (Table 2).”
Intrinsic fitness differences (estimated values): estimations in Table S1 present significant differences between serotypes. This is not discussed in the main text and it feels like a result that should be supported by previous work. For example, are there in vitro, in vivo or population-based measures suggesting that intrinsic fitness follows the general rule DENV1 >= DENV2 >> DENV3 >> DENV4?
Please see essential revisions response 4.
Intrinsic fitness differences (necessity of): the authors include the possibility of (model) intrinsic fitness differences between the serotypes. This is a reasonable assumption given the clear differences observed in empirical clade frequencies (Figure 6A), which generally follow the rule of 'success' in order DENV1 >= DENV2 >> DENV3 >> DENV4 (in fact, I believe this is an ubiquitous world trend). I would like to suggest to the authors an alternative / complementary factor that arises from the results presented (Figure 5, Figure 5—figure supplement 1). It seems that antigenic phenotypes of DENV4 are the most closely related, followed by DENV3, and DENV1-2 (visually, from branch distances between them). Could this be hinting on the fact that the higher success (empirical clade frequencies) of DENV1-2 is related to the fact that clades can more easily co-circulate given that herd-immunity escape is 'easier'? (in other words, reinfection with DENV1-2 genotypes is more common). In contrast, DENV4 would be less successful, because any clade will find high resistance to transmission (herd-immunity from other clades / antigenic phenotypes). I think it is important for the authors to consider this possibility, since the current assumption / estimation of very high differences in intrinsic fitness between serotypes may not be supported by the literature (see my other comment on Intrinsic fitness differences).
This is an interesting hypothesis! We noticed the same trend in empirical clade frequencies. We believe this hypothesis makes intuitive sense, given what we observe in new Figure 4, where DENV2 has the most within serotype diversity. Although we’d note that DENV1 and DENV3 appear similar to have similar amount of within serotype antigenic diversity as DENV4 according to PRNT titers. More importantly, the fitness model provides exactly this possibility. Differences in antigenic phenotype among DENV2 genotypes should promote coexistence. This can be seen in new Figure 5 where the spike in DENV2 Asian I frequency in 1994 does not uniformly crash DENV2 fitness across genotypes. But despite this, we still observe improved model performance when including a serotype-specific fitness effect.
Results section: 'However, we find that accounting for within-serotype antigenic evolution substantially improves our ability to explain dengue antigenic phenotypes'. Please clarify if a more correct statement is instead: 'However, we find that accounting for within-serotype antigenic evolution substantially improves our ability to explain cross-genotype neutralization data'.
Thank you for the suggestion; we have removed this sentence.
NHP versus human data: Figure 2 presents the data for 3-month post infection of NHPs. Just before the figure, this NHP data set is explained (linked to Figure 1A), but human data is also mentioned. As far as I understand the human data set is not included in this study? This is only clear when checking Figure 1A.
We use both NHP and human monovalent data in our study. We have clarified the figure legend and the Results section ‘Dengue neutralization titer data’.
NHP dataset: the original data set in Katzelnick et al., 2015 (Table S4) appears to contain a larger number of sera and virus entries than presented in Figure 2 (I believe S4 is the correct dataset?). These are the discrepancies I found for virus (rows): DENV2 13 versus 16 (Figure 2, Table S4, respectively), DENV3 8 verus 9, DENV 4 9 versus 11. For sera (columns): DENV1 6 versus 8 (Figure 2, Table S4, respectively), DENV2 9 versus 12, DENV4 7 versus 8. Please clarify if I got this wrong, or if some of the data was not used in the current study.
We have edited the Materials and methods section on titer data to clarify that we first normalize all titer measurements and then average across individuals to yield one value of antigenic distance for each pair of (virus strain, serum strain).
In Figure 5, the antigenic phenotypes of sequences in Figure 1 are presented. It seems that some of the genotypes in Figure 1 are missing in the legend of Figure 5. For instance, DENV2 ASIANI, ASIANII, DENV1 II, DENV1 IV, DENV4III, etc. I understand that antigenically uniform clades have been collapsed, but the legend should include all original genotypes. Also, DENV4 sylvatic is stated, but its use and / or results associated with it have not been mentioned elsewhere in the text?
This figure has been replaced by new Figure 3 and Figure 4, as suggested by reviewer #2, and genotypes directly labeled in Figure 4.
[Editors' note: further revisions were requested prior to acceptance, as described below.]
The manuscript has been improved but there are some remaining issues that need to be addressed before acceptance, as outlined below:
Title
The title must be revised. It focuses on the portion of your analysis having to do with viral clade dynamics, and the content of the statement made in this title is only supported at the serotype level. By focusing on this portion of their results – which in our opinion is secondary in its significance compared to the rest about the genetics underlying antigenic differences etc. – and not including words such as "at the serotype level". This title has great potential to be very misleading and widely misunderstood.
We now see the concern that the title could be misinterpreted (certainly not our intention), and greatly appreciate the reviewer’s suggestion. We have revised the title to be more specific.
Abstract
"We find that antigenic fitness mediates fluctuations in DENV clade frequencies, although this appears to be primarily explained by coarser serotype-level antigenic differences." should be revised to "We find that antigenic fitness mediates fluctuations in DENV clade frequencies, but only at the serotype level."
We agree this sentence was unclear. We have revised it to emphasize that we find evidence that serotype-level antigenic fitness is a driver of clade dynamics:
“…and find that serotype-level antigenic fitness is a key determinant of DENV clade turnover.”
We appreciate the reviewer’s contribution of suggested wording and their preservation of sentence structure. However, we thought it was unclear whether “serotype-level” modified “antigenic fitness” or “clade frequencies,” and have slightly modified the suggested wording throughout. We appreciate and welcome any further suggestions.
"These results provide a more nuanced understanding of dengue antigenic evolution…" Is that really true? We suggest this statement be made more precise.
We agree that this sentence needed to be more specific, and have revised it accordingly:
“By leveraging both molecular data and real-world population dynamics, these results provide a more nuanced understanding of the relationship between dengue genetic and antigenic evolution, and quantify the effect of antigenic fitness on dengue evolutionary dynamics.”
Author summary
"We find that antigenic fitness is a key determinant of DENV population turnover, although this appears to be driven by coarser serotype-level antigenic differences." should be revised to "We find that antigenic fitness is a key determinant of DENV population turnover, but only at the serotype level."
We have revised this sentence to read:
“We find that serotype-level antigenic fitness is a key determinant of DENV population turnover.”
Discussion section
We wonder if there might be a third hypothesis C. Perhaps the variable cross-reactivity that they see below the serotype level impacts disease severity (as suggested in the case they built up in the introduction) but does not impair infection and subsequent transmission (which are what really have to do with viral fitness that should have been picked up on in the clade dynamics analysis). Recent work by ten Bosch et al. (PLoS Pathogens, 2018) estimated that asymptomatic and mild infections are still relatively transmissible compared to more severe infections, which is consistent with this possibility.
This is an interesting hypothesis! We note that this is also consistent with the observations of Nagao and Koelle (PNAS, 2008) that dengue epidemiological dynamics are consistent with a model wherein immunity confers protection from symptomatic infection but does not inhibit asymptomatic infection or onward transmission. We have added a paragraph to the Discussion section:
“….Surprisingly, however, we find that incorporating within-serotype antigenic differences does not improve our predictions (Figure~\ref{genotype_fitness}C-D). We suggest two possible explanations for this observation.
First, it may be that although genotypes are antigenically diverse, these differences do not influence large-scale regional dynamics over time. We may then hypothesize that within-serotype antigenic heterogeneity mediates disease severity, but does not influence infection or onward transmission. This hypothesis is consistent with the findings of \citet{nagao2008decreases}, who demonstrated that dengue epidemiological dynamics are compatible with a model wherein immunity confers protection against severe symptoms, but not asymptomatic infection. This is also consistent with \citet{tenBosch2018contributions}'s findings that asymptomatic dengue infections contribute to onward transmission.”
Conclusion
"We also find that population immunity is a strong determinant of the composition of the DENV population across Southeast Asia, although this is putatively driven by coarser, serotype-level antigenic differences." should be revised to "We also find that population immunity is a strong determinant of the composition of the DENV population across Southeast Asia, but only at the serotype level."
We have revised this sentence to:
“We also find that serotype-level population immunity is a strong determinant of viral clade dynamics across Southeast Asia.”
https://doi.org/10.7554/eLife.42496.022Article and author information
Author details
Funding
National Science Foundation (DGE-1256082)
- Sidney M Bell
Pew Charitable Trusts
- Trevor Bedford
National Institute of General Medical Sciences (R35GM119774-01)
- Trevor Bedford
National Institute of Allergy and Infectious Diseases (R01AI114703-01)
- Leah Katzelnick
National Institute of Allergy and Infectious Diseases (P01AI106695)
- Leah Katzelnick
The funders had no role in study design, data collection and interpretation, or the decision to submit the work for publication.
Acknowledgements
We thank Richard Neher, John Huddleston, Andrew Rambaut, Molly OhAinle, David Shaw, Paul Edlefsen, Michal Juraska, and all members of the Bedford Lab for useful discussion and advice. SB is a Graduate Research Fellow and is supported by NSF DGE-1256082. TB is a Pew Biomedical Scholar and is supported by NIH R35 GM119774-01. LK is supported by NIH awards R01AI114703-01 and P01AI106695. Our work depends on open data sharing and many open source software tools. We gratefully acknowledge the authors and developers who make our work possible.
Senior Editor
- Diethard Tautz, Max-Planck Institute for Evolutionary Biology, Germany
Reviewing Editor
- Neil M Ferguson, Imperial College London, United Kingdom
Reviewer
- José Lourenço, University of Oxford, United Kingdom
Version history
- Received: October 2, 2018
- Accepted: August 5, 2019
- Accepted Manuscript published: August 6, 2019 (version 1)
- Version of Record published: September 6, 2019 (version 2)
- Version of Record updated: April 5, 2023 (version 3)
Copyright
© 2019, Bell et al.
This article is distributed under the terms of the Creative Commons Attribution License, which permits unrestricted use and redistribution provided that the original author and source are credited.
Metrics
-
- 3,020
- Page views
-
- 444
- Downloads
-
- 25
- Citations
Article citation count generated by polling the highest count across the following sources: Crossref, PubMed Central, Scopus.
Download links
Downloads (link to download the article as PDF)
Open citations (links to open the citations from this article in various online reference manager services)
Cite this article (links to download the citations from this article in formats compatible with various reference manager tools)
Further reading
-
- Evolutionary Biology
Changes in an organism’s environment, genome, or gene expression patterns can lead to changes in its metabolism. The metabolic phenotype can be under selection and contributes to adaptation. However, the networked and convoluted nature of an organism’s metabolism makes relating mutations, metabolic changes, and effects on fitness challenging. To overcome this challenge, we use the long-term evolution experiment (LTEE) with E. coli as a model to understand how mutations can eventually affect metabolism and perhaps fitness. We used mass spectrometry to broadly survey the metabolomes of the ancestral strains and all 12 evolved lines. We combined this metabolic data with mutation and expression data to suggest how mutations that alter specific reaction pathways, such as the biosynthesis of nicotinamide adenine dinucleotide, might increase fitness in the system. Our work provides a better understanding of how mutations might affect fitness through the metabolic changes in the LTEE and thus provides a major step in developing a complete genotype–phenotype map for this experimental system.
-
- Ecology
- Evolutionary Biology
Temperature determines the geographical distribution of organisms and affects the outbreak and damage of pests. Insects seasonal polyphenism is a successful strategy adopted by some species to adapt the changeable external environment. Cacopsylla chinensis (Yang & Li) showed two seasonal morphotypes, summer-form and winter-form, with significant differences in morphological characteristics. Low temperature is the key environmental factor to induce its transition from summer-form to winter-form. However, the detailed molecular mechanism remains unknown. Here, we firstly confirmed that low temperature of 10 °C induced the transition from summer-form to winter-form by affecting the cuticle thickness and chitin content. Subsequently, we demonstrated that CcTRPM functions as a temperature receptor to regulate this transition. In addition, miR-252 was identified to mediate the expression of CcTRPM to involve in this morphological transition. Finally, we found CcTre1 and CcCHS1, two rate-limiting enzymes of insect chitin biosyntheis, act as the critical down-stream signal of CcTRPM in mediating this behavioral transition. Taken together, our results revealed that a signal transduction cascade mediates the seasonal polyphenism in C. chinensis. These findings not only lay a solid foundation for fully clarifying the ecological adaptation mechanism of C. chinensis outbreak, but also broaden our understanding about insect polymorphism.