A combination of transcription factors mediates inducible interchromosomal contacts
- University of Washington, United States
- Howard Hughes Medical Institute, United States
- Brotman Baty Institute for Precision Medicine, United States
Figures
Figure 1 with 5 supplements
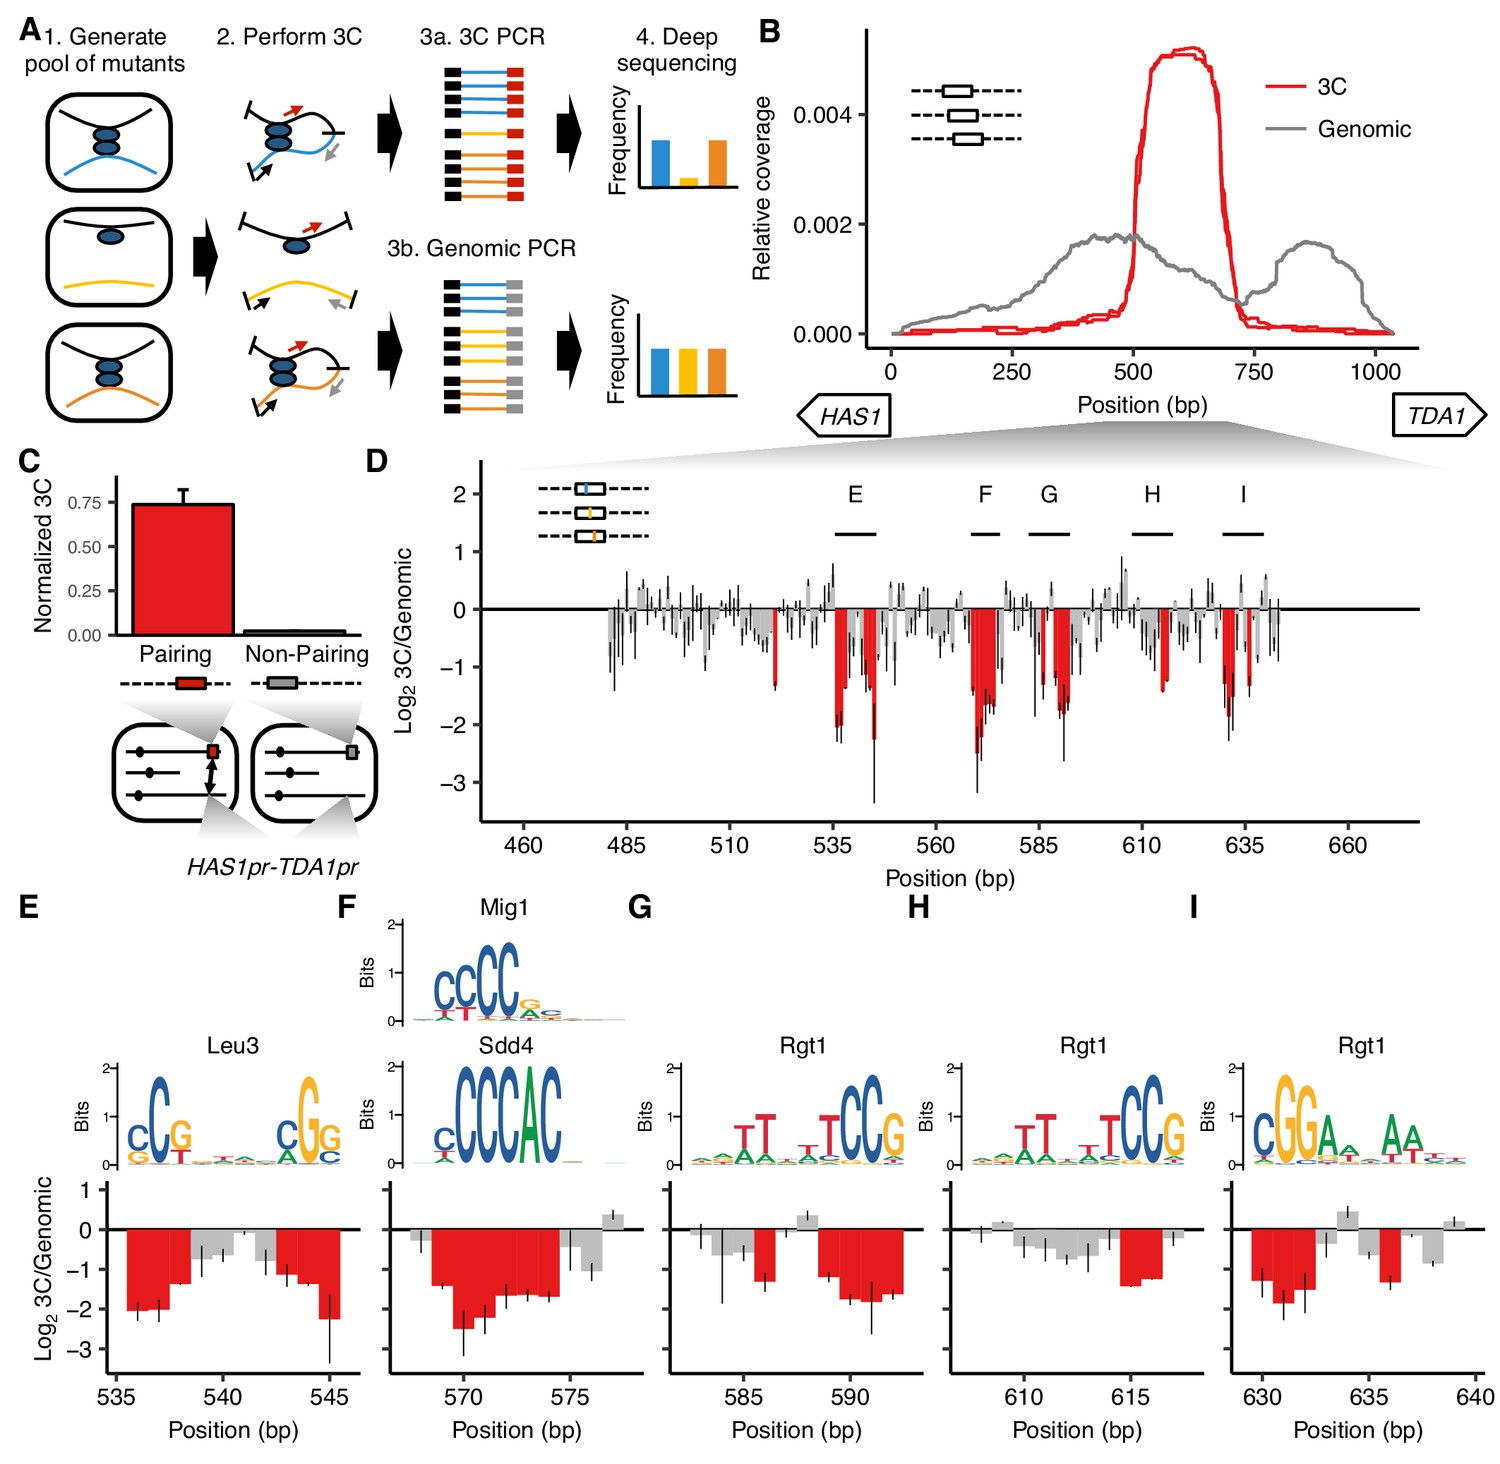
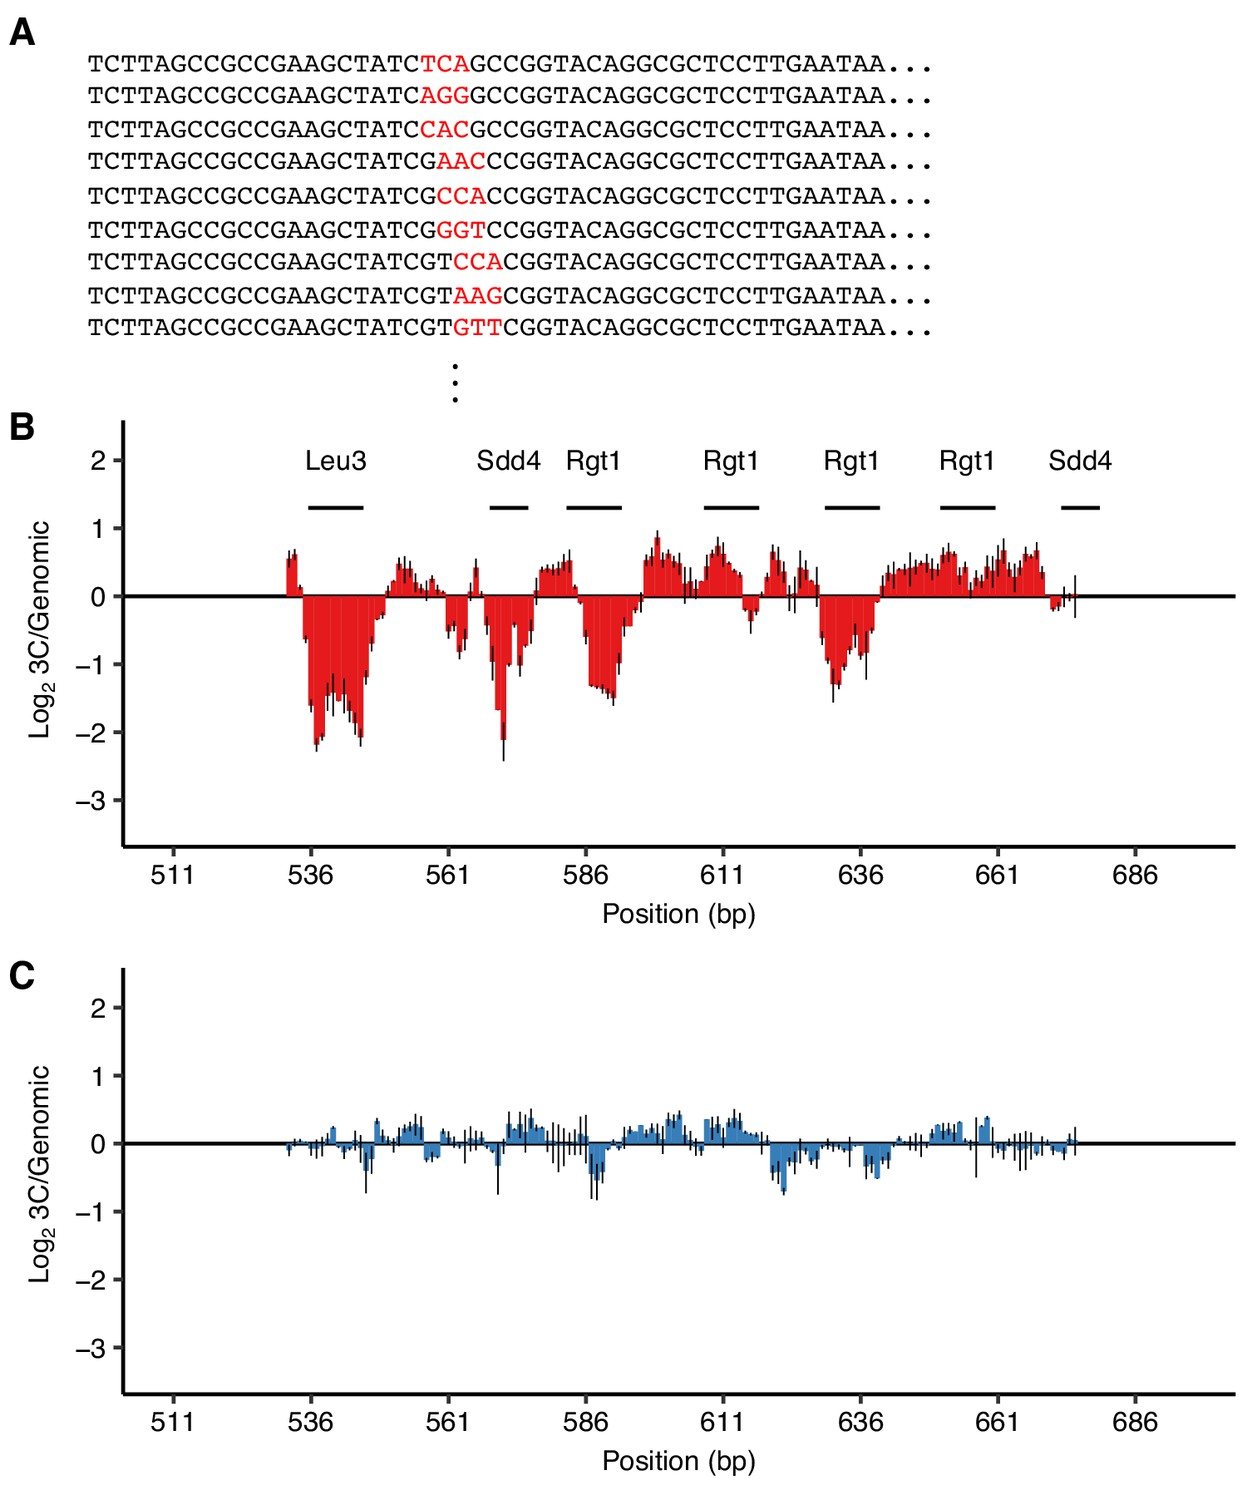
MAP-C identifies DNA sequences necessary and sufficient for inducible pairing between HAS1pr-TDA1pr alleles.
(A) In the cis MAP-C method, mutations in a ~ 250 bp segment of the genome are assessed for their effect on a specific 3D contact of that segment. Colored lines indicate mutant DNA sequences, and thin arrows indicate primers. (B) A ~ 150 bp region is sufficient for interchromosomal pairing. cis MAP-C was used to test 178 bp subsequences from the S. cerevisiae HAS1pr-TDA1pr region for pairing with the S. uvarum HAS1pr-TDA1pr. Shown are read coverage of the 3C (red) and genomic (gray) libraries, normalized to sum to 1. The two lines for each color represent technical replicates. Start positions and orientations of HAS1 and TDA1 coding sequences are shown on x-axis. (C) A minimal pairing region is sufficient for ectopic pairing. Shown are contact frequencies between HAS1pr-TDA1pr and a pairing (red) or non-pairing (gray) sequence (coordinates shown in Figure 1—figure supplement 1C) integrated at the FIT1 locus in haploid S. cerevisiae, as measured by 3C, normalized to contacts between FIT1 and HLR1 10 kb away. Bars indicate mean ± s.d. of technical triplicates. (D) Base-pairs necessary for pairing, shown as ratio of the total substitution frequency at each position in the 3C library compared to the genomic library. Error bars indicate the two technical replicates. Positions most strongly required for pairing (log23C/Genomic < −1.1) are highlighted in red. (E–I) Selected regions from panel D are highlighted, with sequence logos for matching transcription factor motifs. See Figure 1—figure supplements 2 and 3 for full set of overlapping motifs.
Figure 1—figure supplement 1
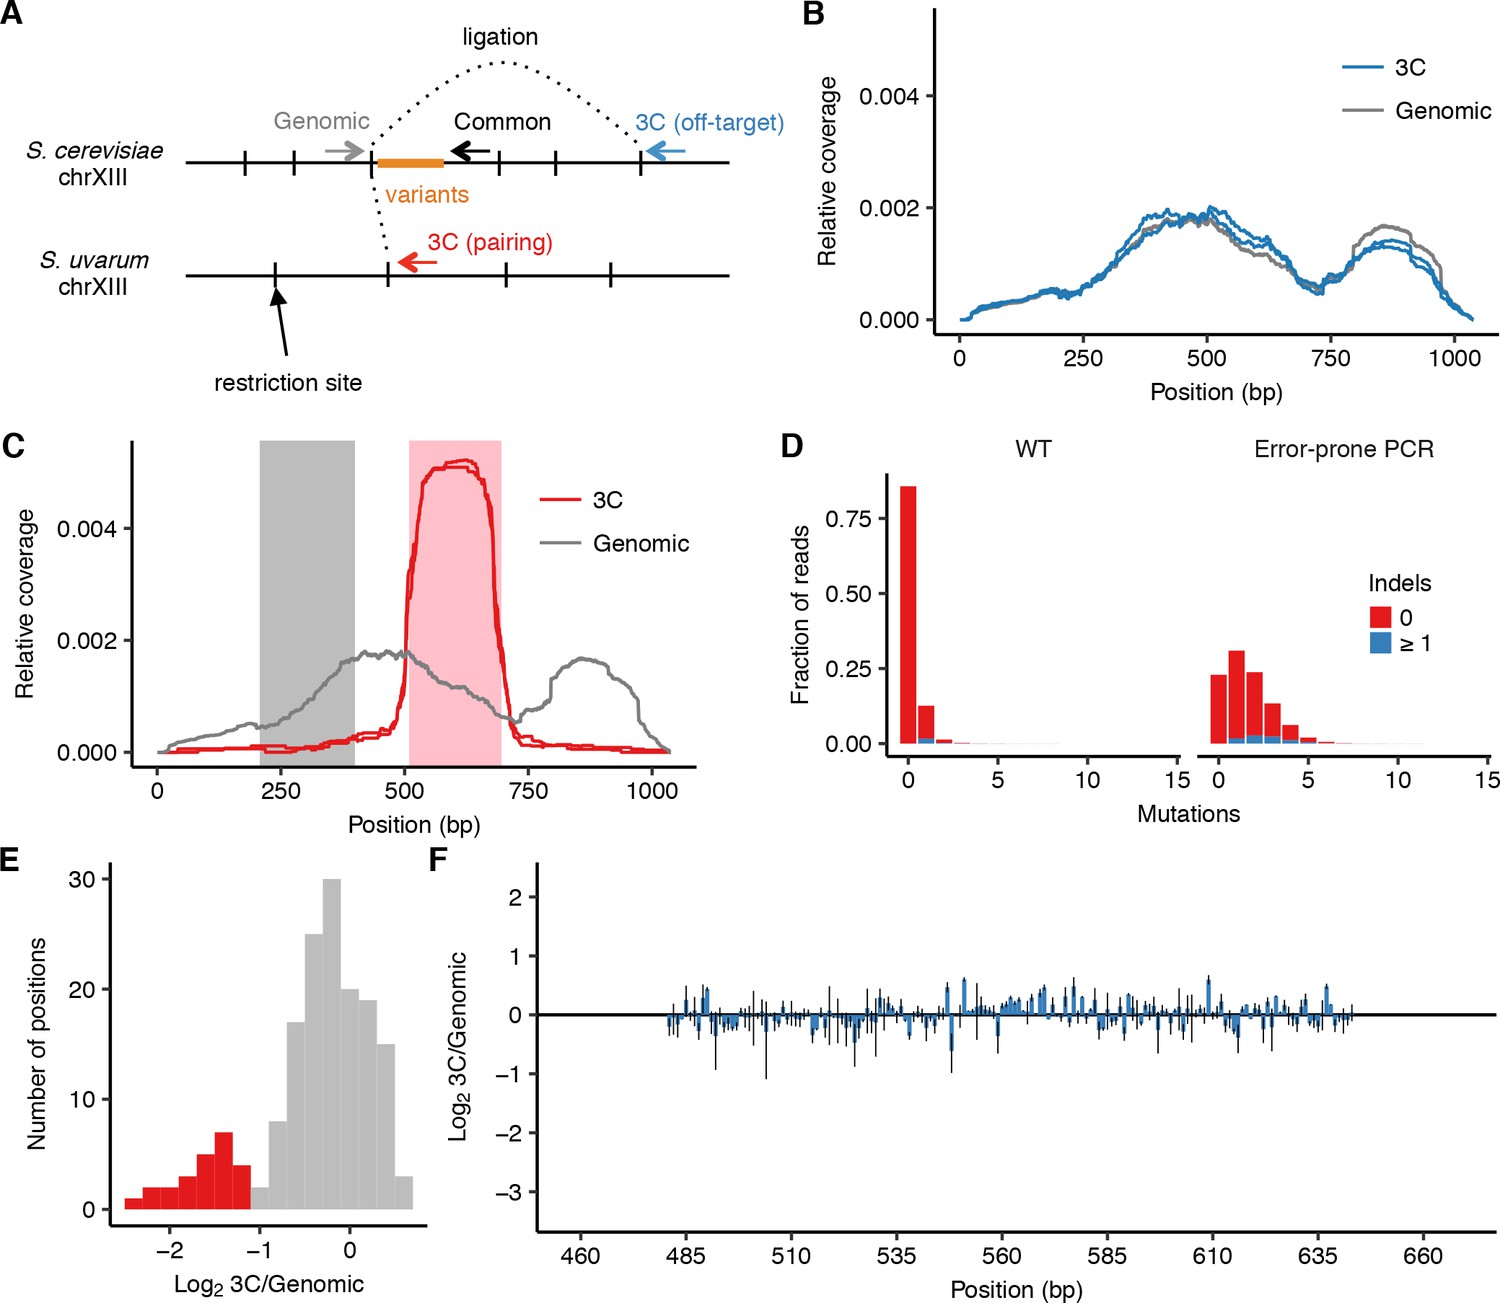
Design and controls for using cis MAP-C to dissect HAS1pr-TDA1pr pairing.
(A) Schematic (not to scale) of primer locations for cis MAP-C experiments. (B) Off-target control results for 178 bp subsequences of S. cerevisiae HAS1pr-TDA1pr, shown as read coverage for 3C and genomic libraries. Each line represents a technical replicate. (C) Regions of HAS1pr-TDA1pr used for testing ectopic pairing. Pairing sequence shown in pink, and non-pairing control shown in gray. (D) Distribution of the number of mutations in the wild type and error-prone PCR genomic libraries. (E) Distribution of relative mutation frequency in 3C libraries. Positions most strongly required for pairing and highlighted in red in Figure 1D–I are also shown here in red; other positions are in gray. (F) Off-target control results for error-prone PCR mutagenesis of central S. cerevisiae HAS1pr-TDA1pr, shown as ratio of the total substitution frequency at each position in the 3C library compared to the genomic library. Error bars indicate the two technical replicates.
Figure 1—figure supplement 2
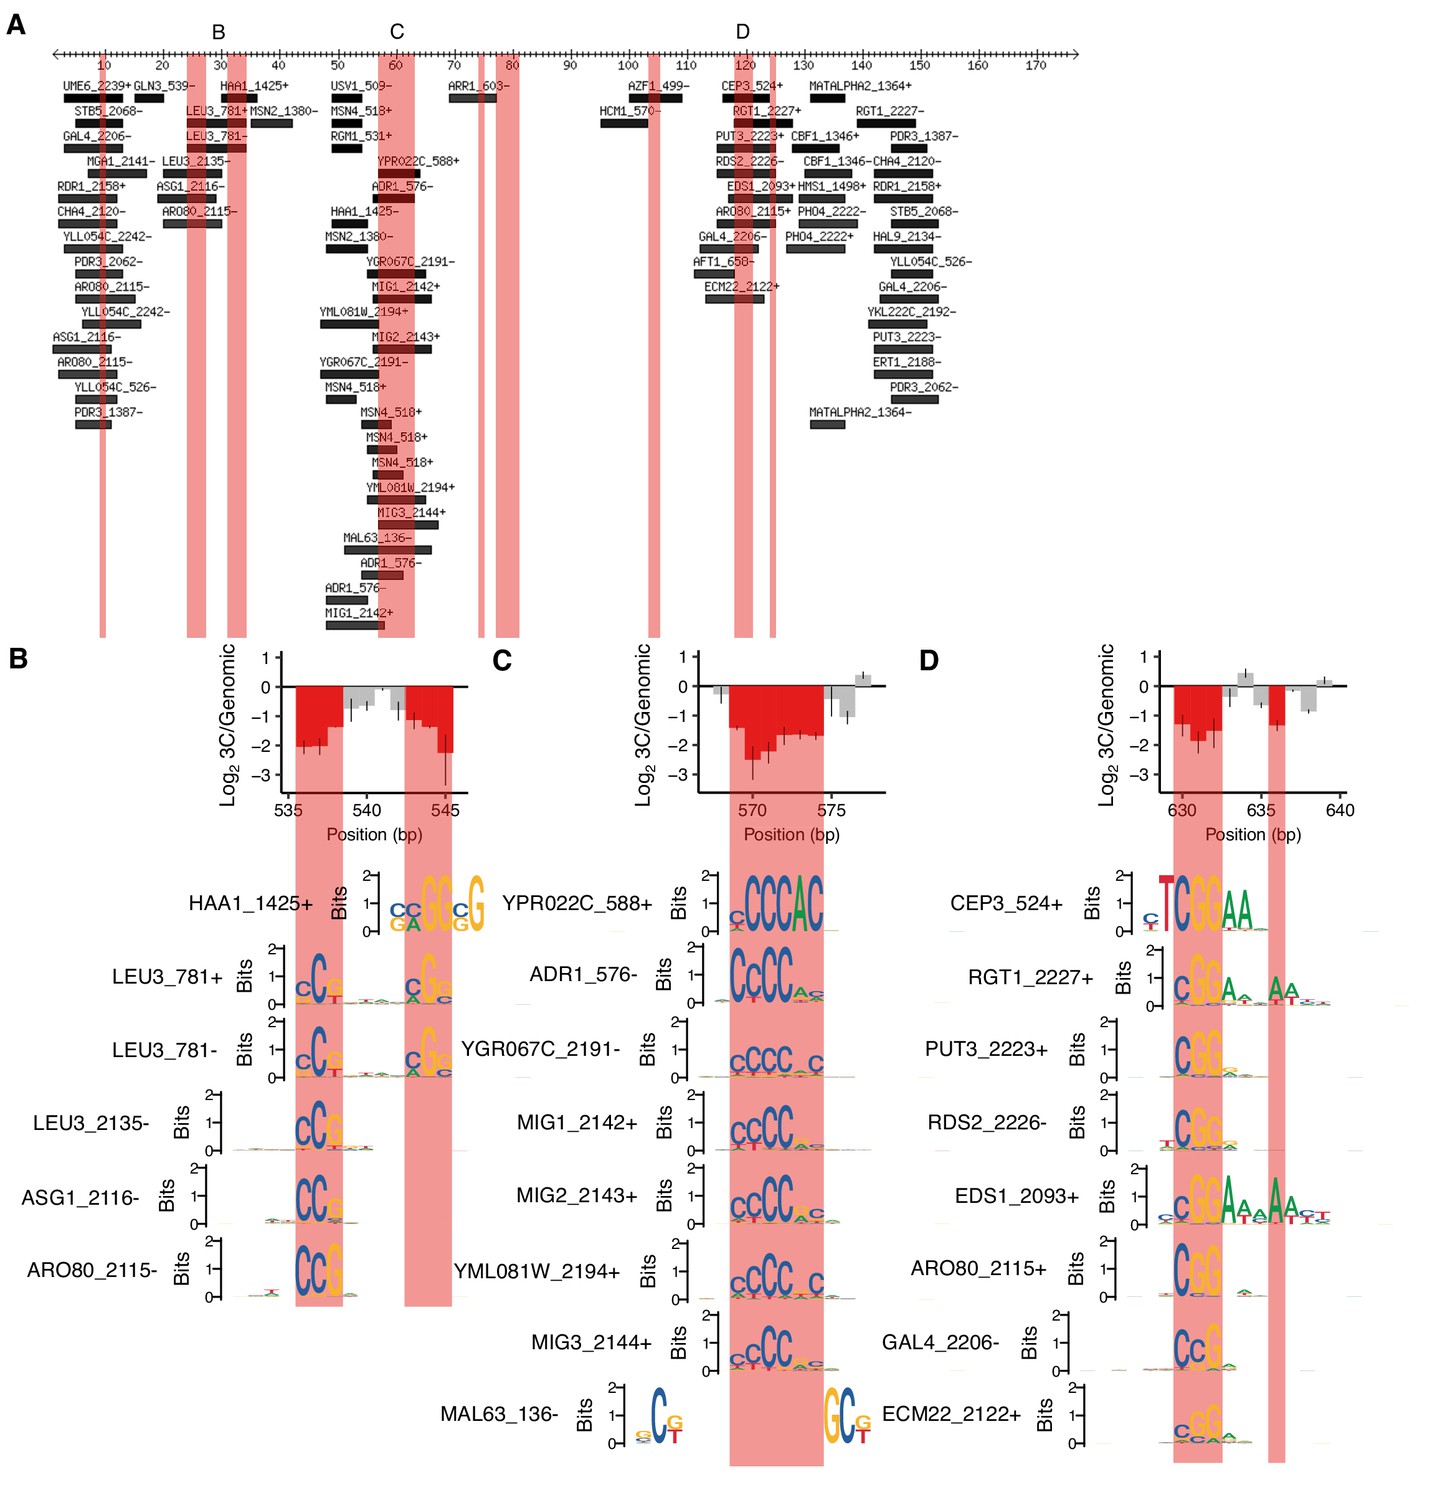
Motifs overlapping positions required for HAS1pr-TDA1pr pairing.
(A) Motifs overlapping region of HAS1pr-TDA1pr containing positions required for pairing. Coordinates are relative to 511 bp upstream of the HAS1 coding sequence in S. cerevisiae (sacCer3). All ‘expert-curated no dubious’ motifs from YeTFaSCo (de Boer and Hughes, 2012) scoring at least 75% of the maximum possible score are shown. B, C, and D indicate regions highlighted in other panels. Pink regions indicate positions required for HAS1pr-TDA1pr pairing (same as in Figure 1D). (B–D) Sequence logos of motifs spanning the cluster(s) of positions required for pairing are shown aligned relative to the error-prone PCR cis MAP-C data from Figure 1E,F and I, in the same vertical order as in A.
Figure 1—figure supplement 3
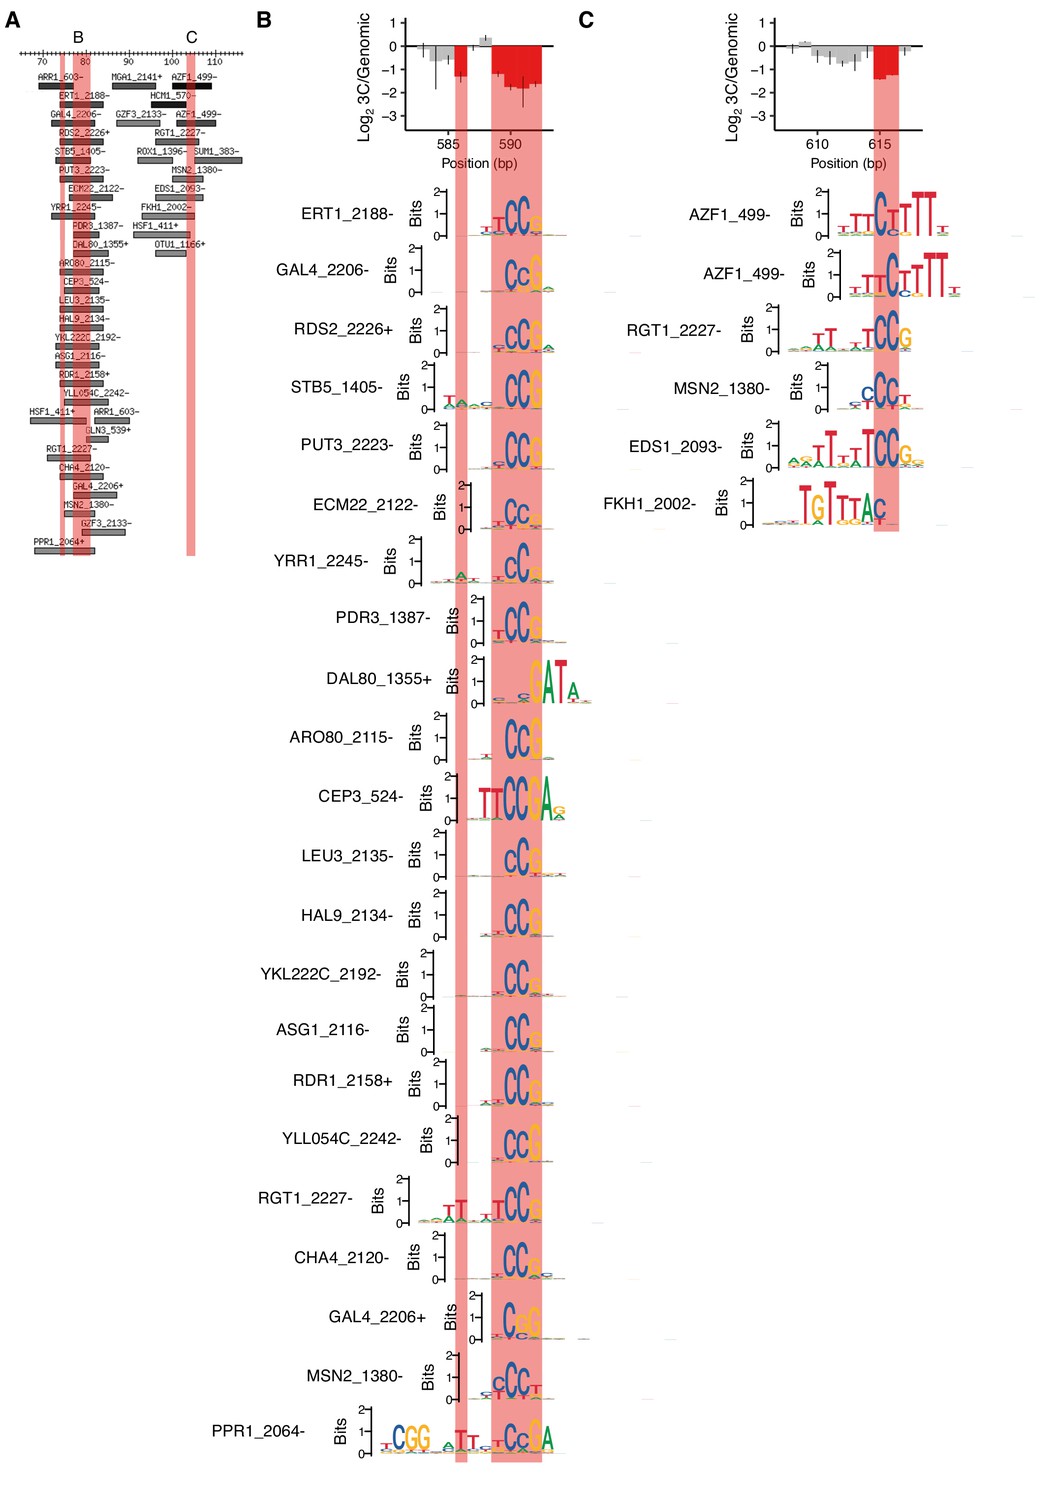
Lower-scoring motifs matching positions required for HAS1pr-TDA1pr pairing.
(A) Motifs overlapping region of HAS1pr-TDA1pr containing positions required for pairing, zooming into the clusters of positions not shown in Figure 1—figure supplement 2. Coordinates are relative to 511 bp upstream of the HAS1 coding sequence in S. cerevisiae (sacCer3). All ‘expert-curated no dubious’ motifs from YeTFaSCo (de Boer and Hughes, 2012) scoring at least 45% of the maximum possible score are shown. B and C indicate regions highlighted in other panels. Pink regions indicate positions required for HAS1pr-TDA1pr pairing (same as in Figure 1D). (B–C) Sequence logos of motifs spanning the cluster of positions required for pairing are shown aligned relative to the error-prone PCR cis MAP-C data from Figure 1G and H, in the same vertical order as in panel A.
Figure 1—figure supplement 4
Validation of TF motifs required for HAS1pr-TDA1pr pairing with a 3 bp substitution mutant library.
(A) Library design. Examples of mutant sequences, with mutations in red. Each set of 3 bp was replaced with three random 3 bp sequences so that every nucleotide was switched to every other nucleotide. (B–C) Ratio of the total substitution frequency at each position in the 3C library compared to the genomic library, for contacts between S. cerevisiae HAS1pr-TDA1pr and the S. uvarum homolog (B) or S. cerevisiae LCB1, an off-target control (C). Horizontal line segments indicate the positions of TF motif matches.
Figure 1—figure supplement 5
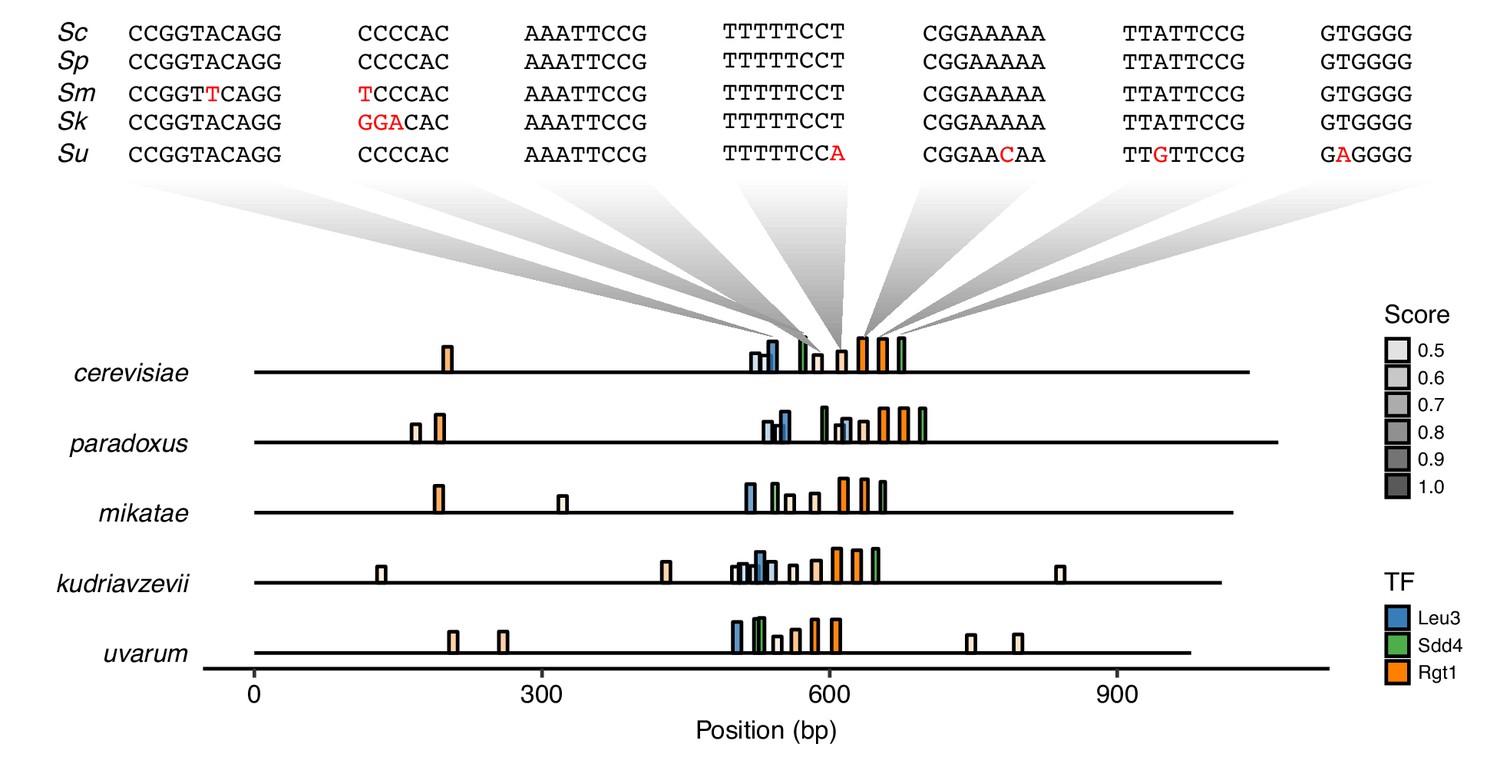
Conservation of TF motifs in HAS1pr-TDA1pr.
Position of Leu3, Sdd4, and Rgt1 motifs (at least 45% of maximum possible score, using high score position weight matrix from YeTFaSCo [de Boer and Hughes, 2012]) in the intergenic region between HAS1 and TDA1 in Saccharomyces sensu stricto yeasts S. cerevisiae, S. paradoxus, S. mikatae, S. kudriavzevii, and S. uvarum (order of divergence from S. cerevisiae). Bar height and transparency both represent motif score (as fraction of maximum possible score). Above, the sequences of the regions aligning to the S. cerevisiae motifs are shown in the same vertical order, with mismatches in red.
Figure 2 with 4 supplements
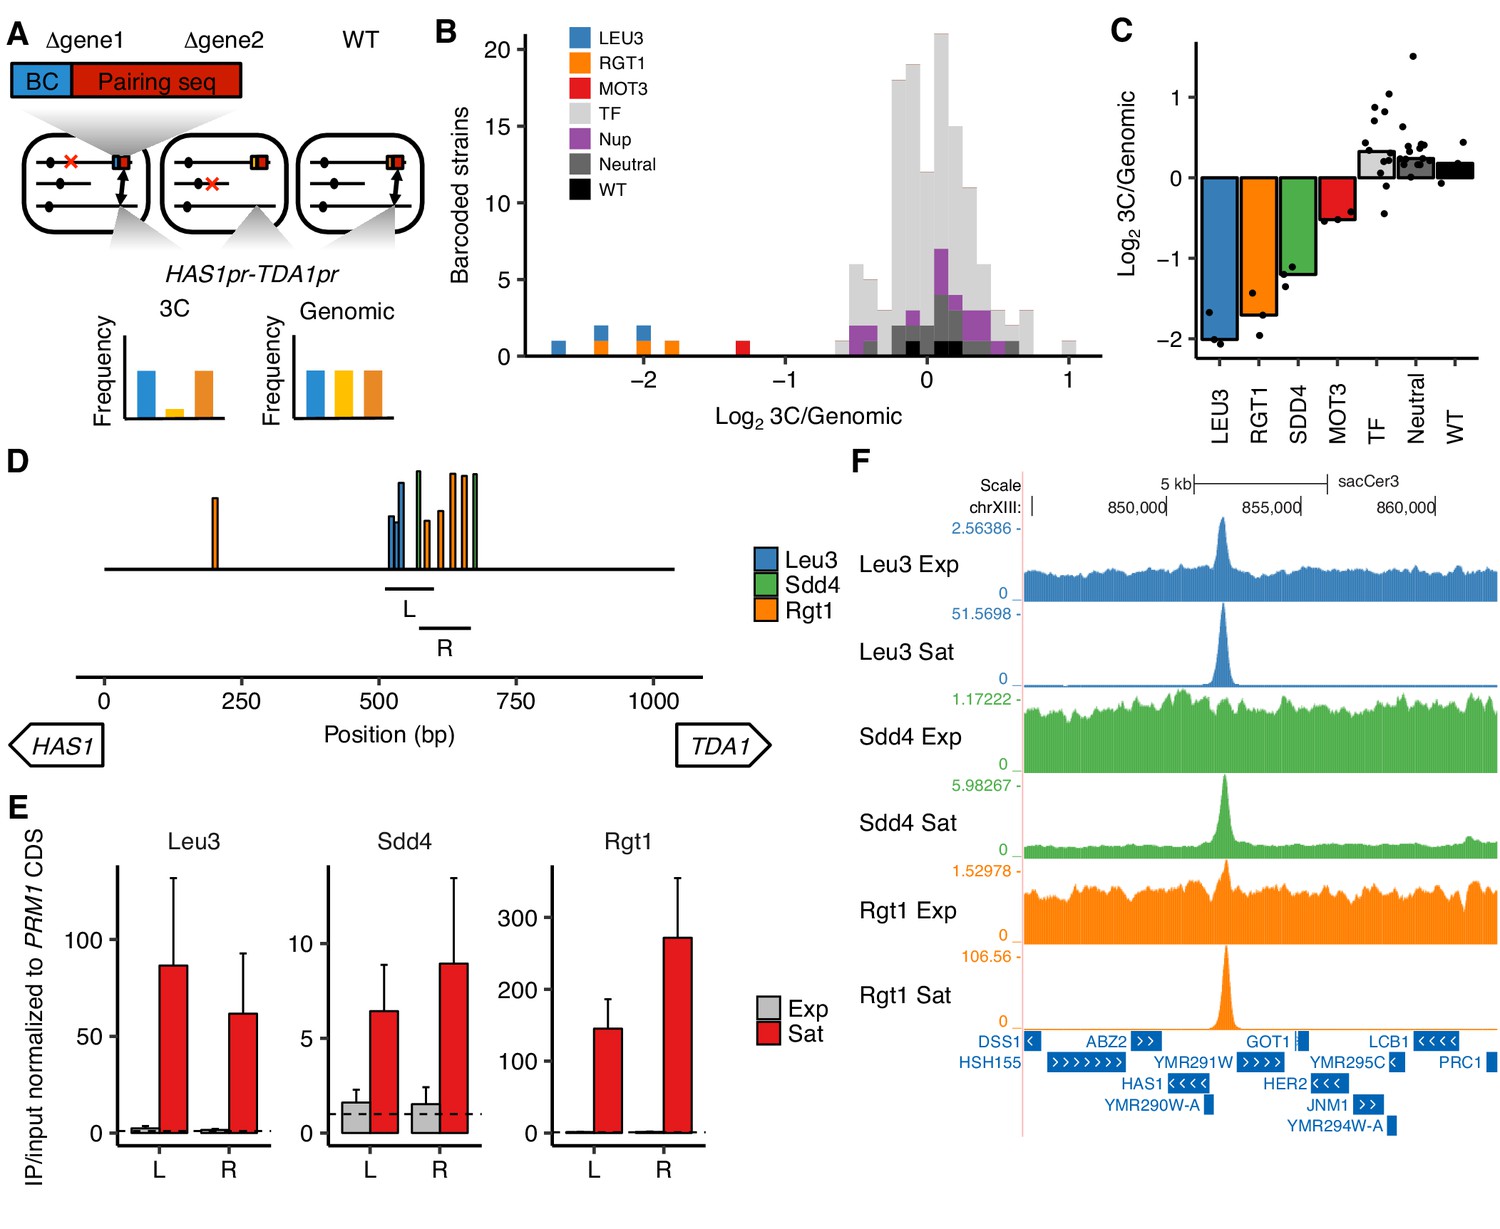
Transcription factors Leu3, Sdd4, and Rgt1 mediate HAS1pr-TDA1pr pairing.
(A) In trans MAP-C, the effect of TF knockouts or variants are assessed for their effect on a specific 3D contact by association with barcodes. Barcoded versions of the minimal pairing sequence were ectopically integrated and assessed for pairing with the native HAS1pr-TDA1pr in haploid S. cerevisiae. Red Xs indicate gene knockouts; red boxes indicate pairing sequence (Figure 1—figure supplement 1C); BC indicates barcode; double-headed arrows indicate the presence of chromosomal contacts. (B) Full TF knockout screen identifies Leu3 and Rgt1 as trans requirements for pairing. Histogram of relative abundance of each barcoded gene knockout strain in 3C library compared to the genomic library, excluding strains below a frequency of 0.3% of the pool. Barcode replicates are shown as separate squares in histogram. LEU3, RGT1, and MOT3 are highlighted individually; TF indicates other transcription factors; Nup indicates nuclear pore complex components; Neutral indicates fitness-neutral negative controls (Figure 2—figure supplement 2A). (C) Validation TF knockout screen confirms that Leu3, Sdd4, and Rgt1 are required for pairing. Bar plot of median relative abundance in 3C library compared to the genomic library, with overlaid scatter plot of individual barcoded strains. TF includes MIG1, VHR1, CBF1, and YGR067C. (D) Regions tested by ChIP-qPCR for TF binding. Bars show Leu3, Sdd4, and Rgt1 motif matches in S. cerevisiae HAS1pr-TDA1pr, and lines indicate regions (L and R) used for qPCRs in panel E. Bar heights indicate motif score as fraction of maximum possible score; all motifs with a score of at least 0.45 shown. (E) TFs bind HAS1pr-TDA1pr more strongly in saturated conditions. Chromatin immunoprecipitation qPCR results in exponentially growing (Exp) and saturated (Sat) cultures, normalized by input and to a negative control locus in the PRM1 coding sequence. L and R indicate two primer sets as shown in panel D. Bars indicate mean ± s.e.m. of biological triplicates. Dashed lines indicate a value of 1 (background enrichment). (F). Chromatin immunoprecipitation sequencing data near the HAS1pr-TDA1pr locus (coordinates chrXIII:844,705–862,314 in sacCer3 reference), shown as fold enrichment in IPs over input.
Figure 2—figure supplement 1
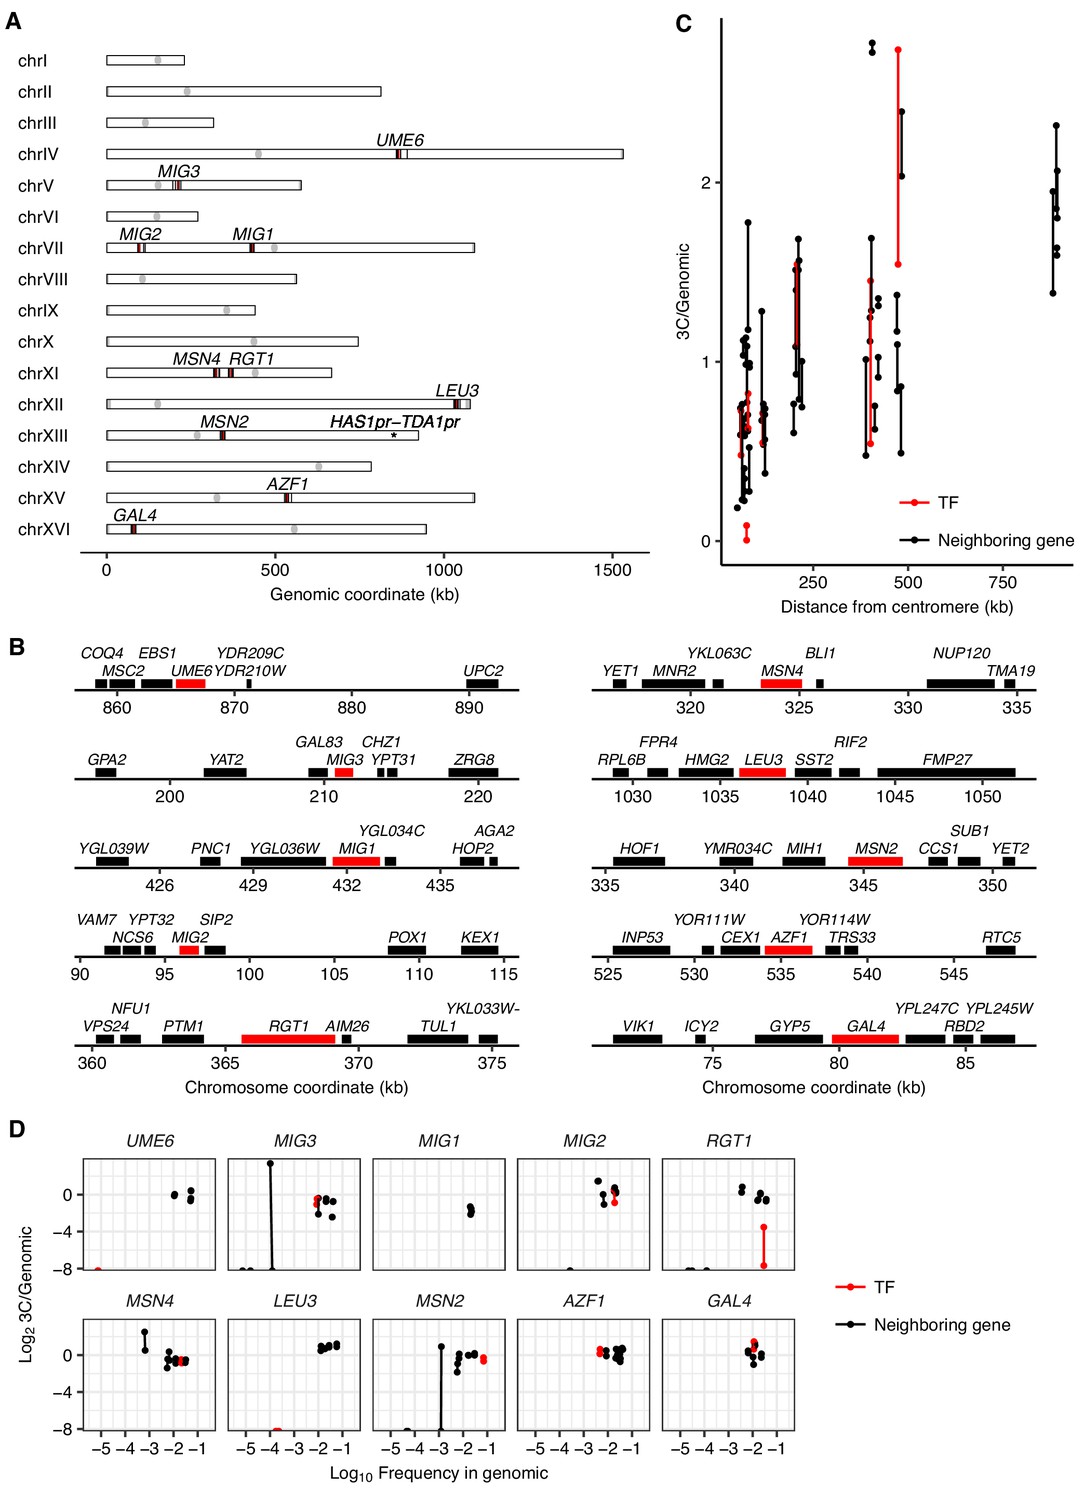
A pilot TF gene knockout screen for HAS1pr-TDA1pr pairing.
(A) Genomic locations of the tested TF gene knockouts (in red) and tested genomic neighbors (in black). (B) Zoom-in to tested TF gene knockouts (in red) and tested genomic neighbors (in black). (C) Effect of centromeric distance on ectopic HAS1pr-TDA1pr pairing in haploid S. cerevisiae. Each pair of connected dots represents two technical replicates. (D) Pilot TF knockout screen results, with each TF grouped with its genomic neighbors. Scatter plot of barcoded strain abundance in 3C library normalized to genomic library (y-axis) vs. abundance in genomic library (x-axis) for each of 10 tested TF gene knockouts (in red, separate panel per TF), along with genomic neighbors (in black). As in panel C, each pair of connected dots represents two technical replicates.
Figure 2—figure supplement 2
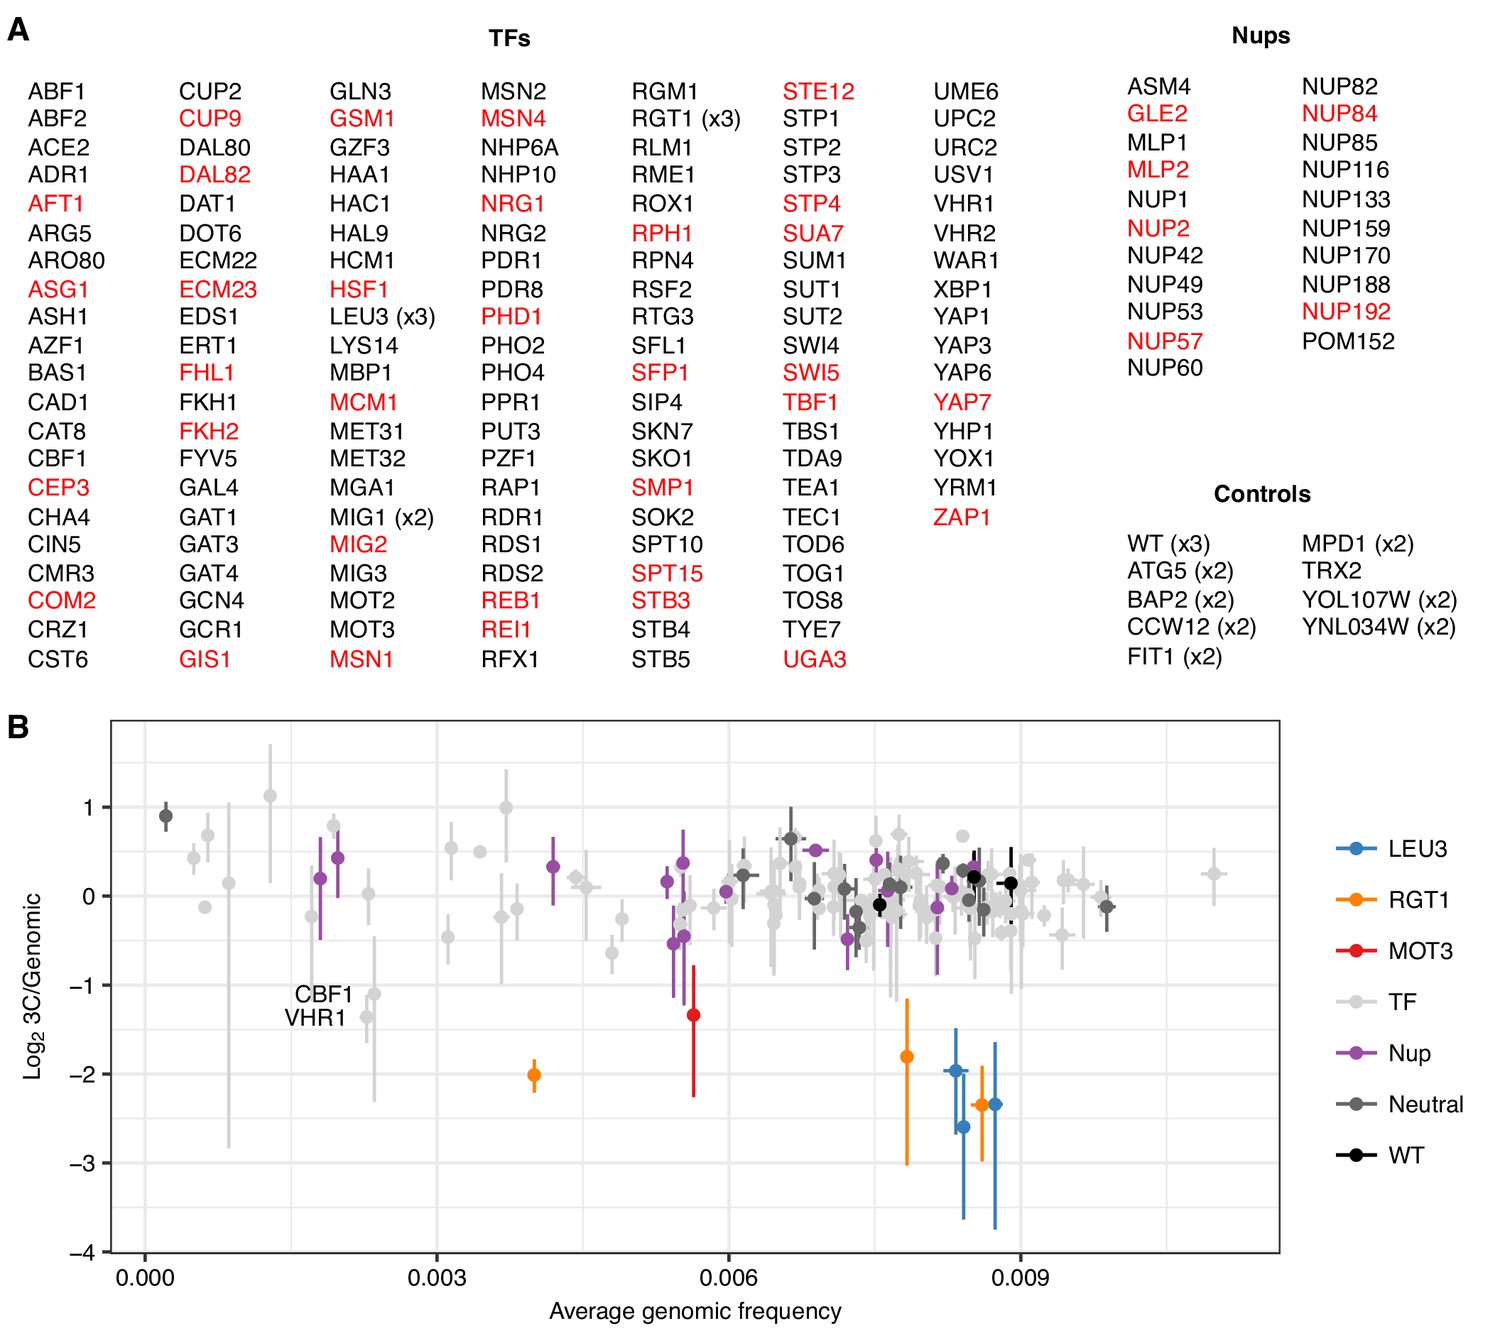
An expanded trans knockout screen for HAS1pr-TDA1pr pairing.
(A) List of tested gene knockouts. Strains that dropped out of the pool during library construction are shown in red. (B) Scatter plot of each barcoded strain’s abundance in the genomic library vs. ratio of abundance in the 3C library compared to the genomic library. Center values indicate mean; error bars indicate s.d. of three technical replicates.
Figure 2—figure supplement 3
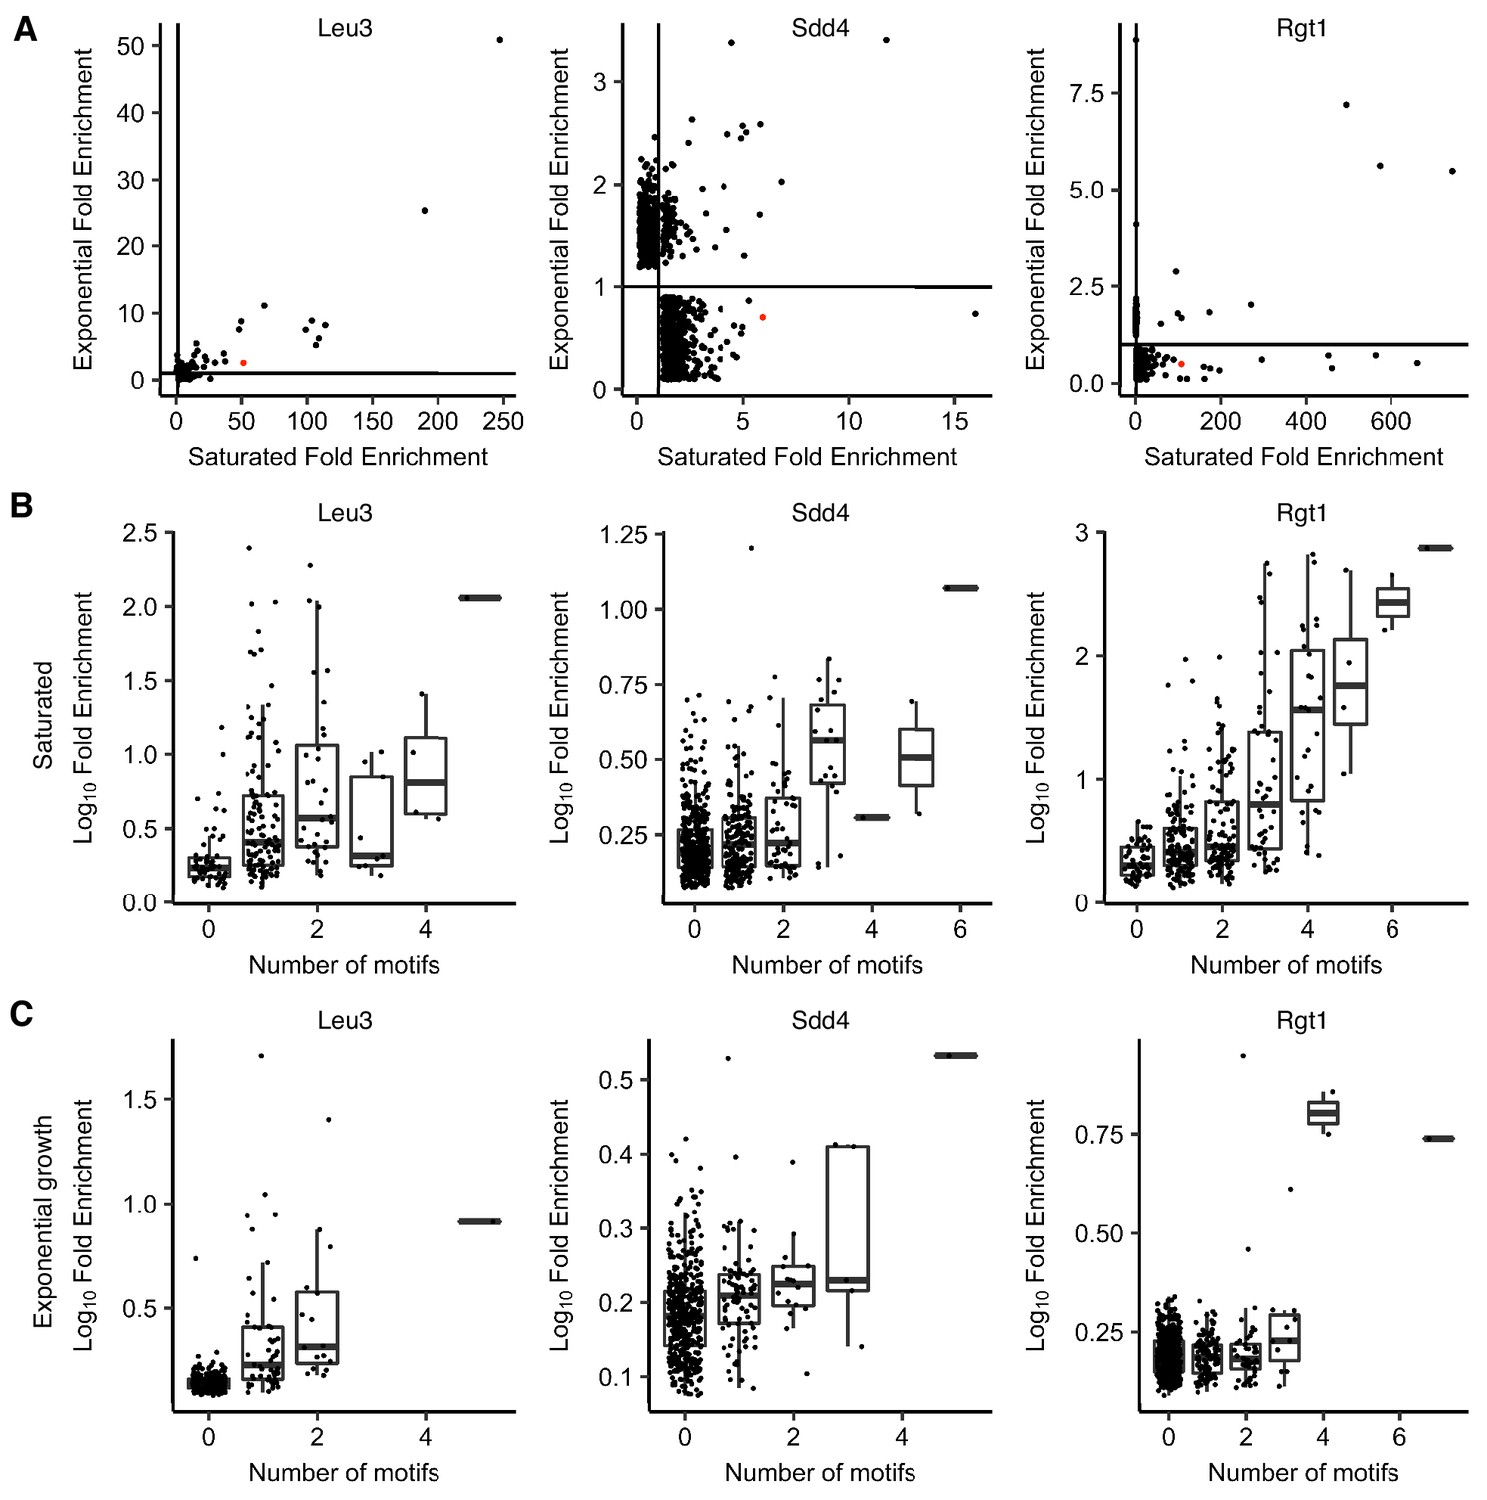
ChIP-seq of Leu3, Sdd4, and Rgt1 shows stronger motif-driven binding in saturated conditions.
(A) Scatter plot of ChIP-seq peak fold enrichment in saturated cultures vs. exponentially growing cultures, with HAS1pr-TDA1pr shown in red. Peaks with no overlapping significant peak in the other condition are shown with a random fold enrichment of 0.1–0.9, to prevent overplotting. Lines indicate fold enrichment of 1. (B) Boxplot of ChIP-seq peak log10 fold enrichment in saturated conditions, by number of motifs (p-value<0.001 in FIMO) within 100 bp of the peak summit. Boxplot indicates median and interquartile range. (C) Same as panel B for exponential growth conditions.
Figure 2—figure supplement 4
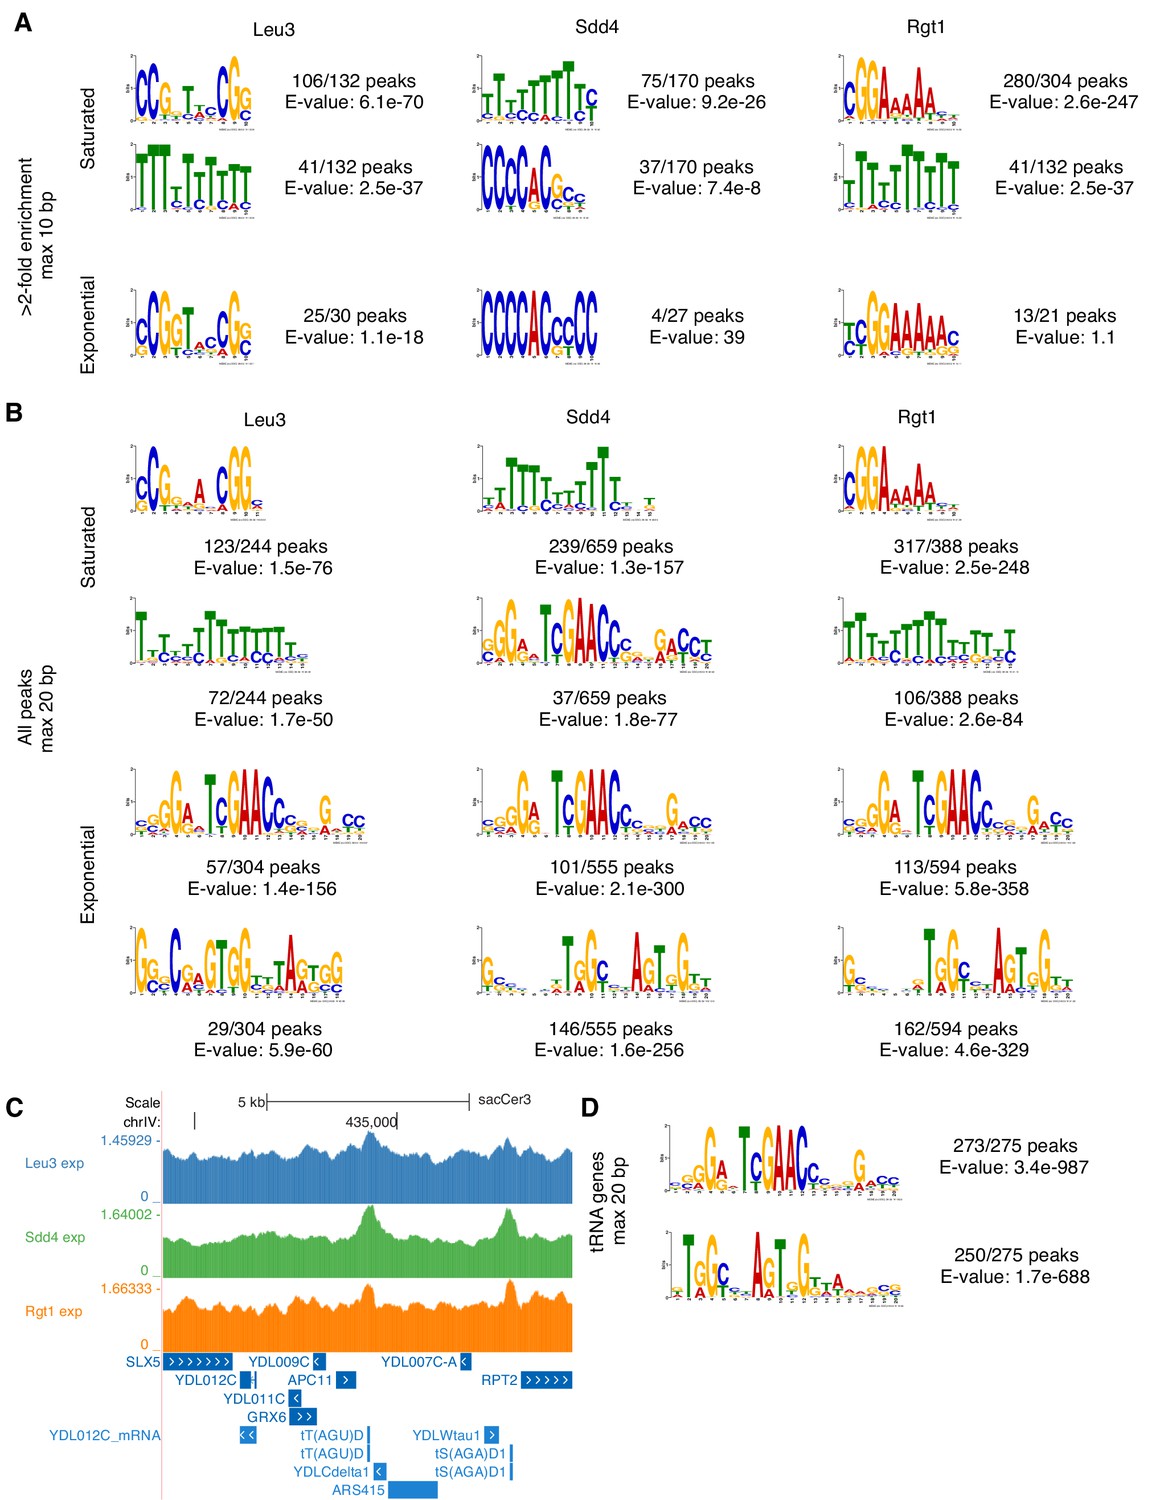
De novo motif discovery reveals ChIP-seq enrichment of known motifs, poly-T tracts enriched in promoters, and tRNA genes.
(A) Expected TF motifs and poly(dA-dT) tracts, which are common in yeast promoters and activate transcription via their intrinsic nucleosome depletion (Iyer and Struhl, 1995; Struhl, 1985), are enriched in top ChIP-seq peaks. Motifs were discovered using MEME (E-value < 0.1, or top motif if none below threshold) (Bailey et al., 2006) on all ChIP-seq peaks with at least 2-fold enrichment, allowing motifs of up to 10 bp. Motifs are shown in the orientations that match known motifs. (B) Low-enrichment ChIP-seq peaks contain a long unexpected motif. As in panel A, motifs discovered using MEME (top two motifs) but on all ChIP-seq peaks, allowing motifs of up to 20 bp. (C) Low-enrichment ChIP-seq peaks at tRNA genes. Example of exponential growth ChIP-seq data at two tRNA gene loci. Coordinates (sacCer3 reference): chrIV:434220–434320. (D) tRNA genes contain motifs matching those from low-enrichment ChIP-seq peaks. Motifs discovered using MEME (top two motifs) on tRNA genes.
Figure 3 with 4 supplements
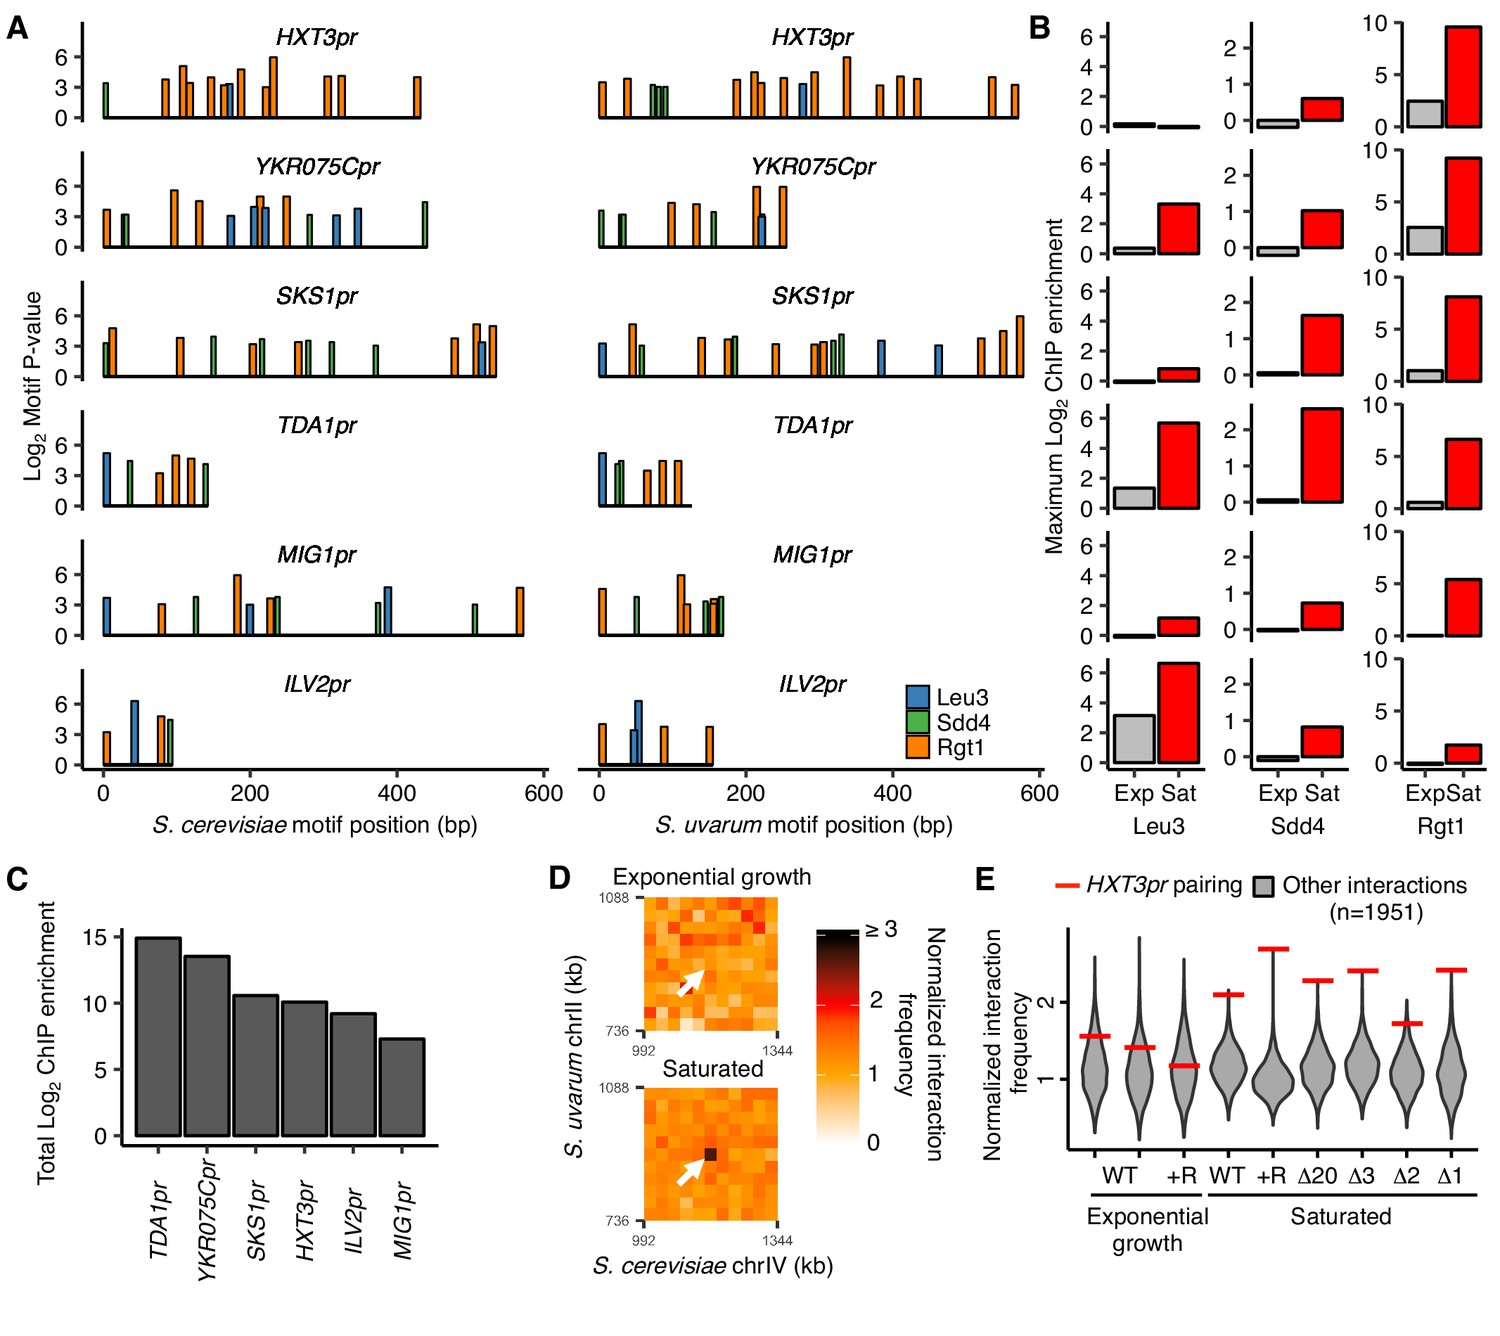
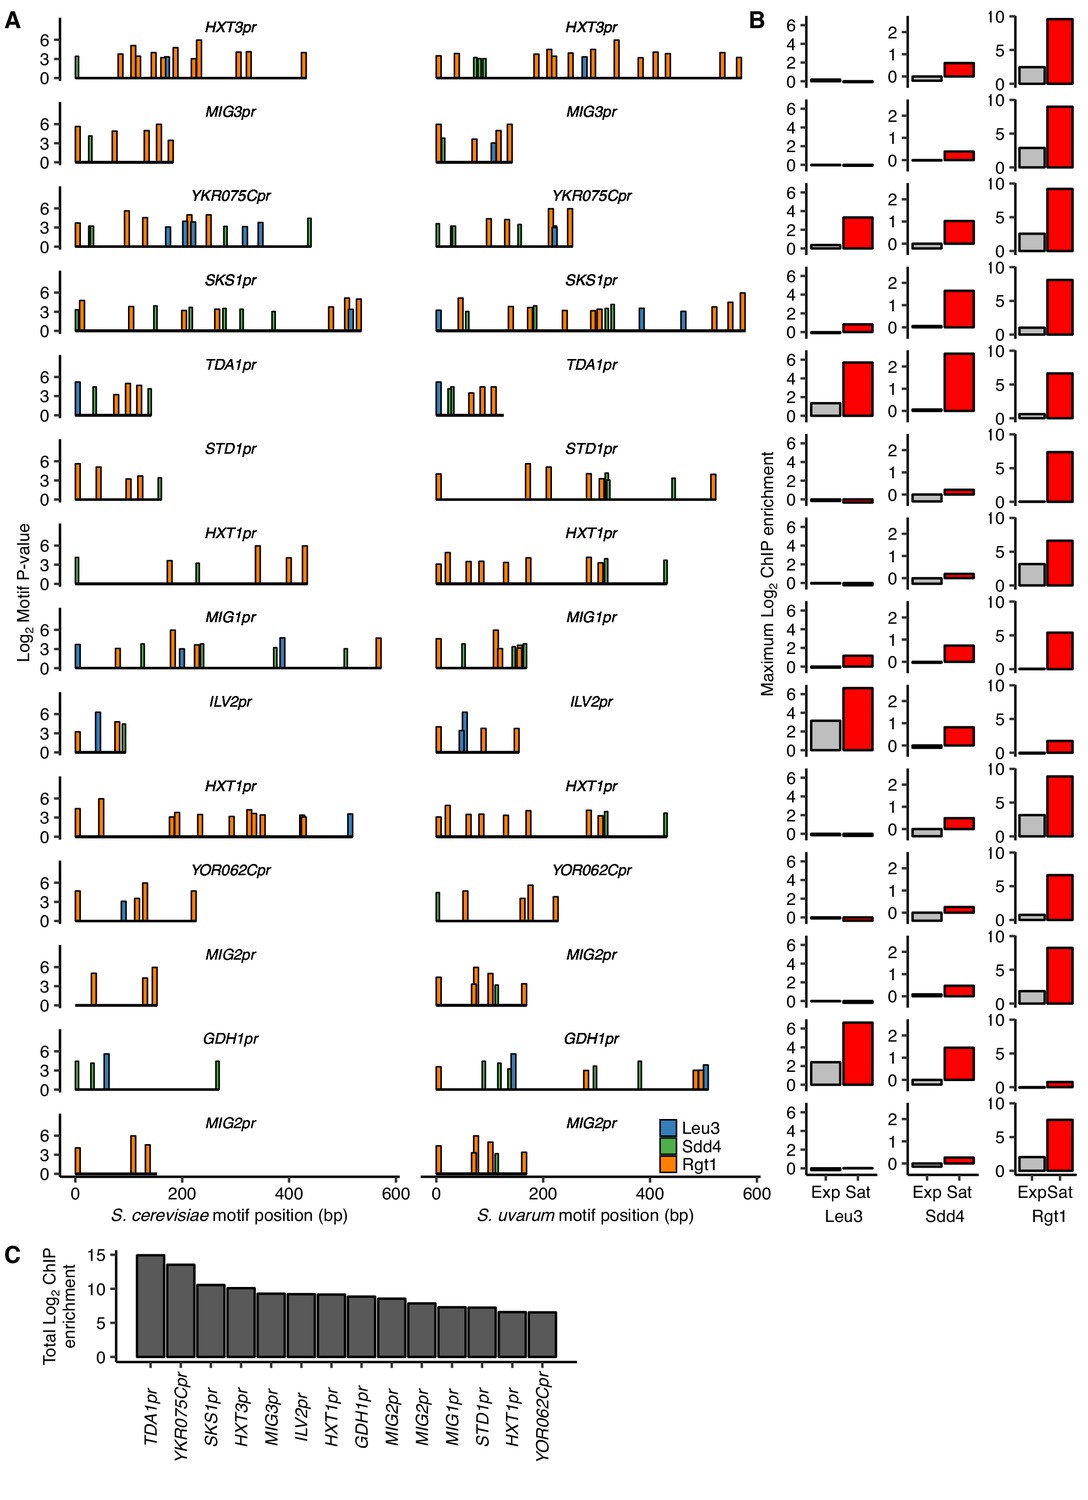
Combinatorial TF binding specifies inducible homolog pairing.
(A) Top clusters of Leu3, Sdd4, and Rgt1 motifs in homologous loci of both S. cerevisiae and S. uvarum genomes containing all three motifs in S. cerevisiae, in order of lowest P-value from top to bottom. (B) Not all motif clusters are bound by all three TFs. ChIP-seq data for exponentially growing (Exp) and saturated (Sat) S. cerevisiae corresponding to motif clusters in panel A. (C) Combined TF binding is strongest at TDA1pr. Shown are the sum of the ChIP log2 fold enrichments over inputs in saturated conditions for motif clusters in panel A. (D) HXT3pr also exhibits inducible homolog pairing. Hi-C contact maps of interactions between regions centered on S. cerevisiae HXT3 and S. uvarum HXT3 at 32 kb resolution in exponentially growing and saturated cultures of a S. cerevisiae x S. uvarum hybrid strain (YMD3920). White arrows indicate interactions between homologous HXT3 promoters. (E) Strength of HXT3 promoter pairing across conditions and strain backgrounds, at 32 kb resolution (red lines) compared to similar interactions (gray violin plots; i.e. interactions between an S. cerevisiae locus and an S. uvarum locus, where both loci are ≥ 15 genomic bins from a centromere and ≥ 2 bins from a telomere, ≥ 2 bins from HAS1pr-TDA1pr, and not both on chrXII). WT represents strain ILY456 (YMD3259).+R indicates a restriction site added upstream of HAS1 (YMD3920), ∆20 indicates a 20 kb deletion centered at S. cerevisiae HAS1 (YMD3266), ∆3 indicates a 3 kb deletion centered at S. cerevisiae HAS1 (YMD3267), ∆2 indicates a 2 kb deletion of the S. cerevisiae HAS1 coding sequence (YMD3268), and ∆1 indicates a 1 kb deletion of the S. cerevisiae HAS1pr-TDA1pr intergenic region (YMD3269).
Figure 3—figure supplement 1
HAS1pr-TDA1pr exhibits uniquely strong combinatorial binding of Leu3, Sdd4, and Rgt1.
(A) Top clusters of Leu3, Sdd4, and Rgt1 motifs in homologous loci containing Leu3 and Rgt1 motifs in both S. cerevisiae and S. uvarum genomes as in Figure 3, but without requiring all three motifs in S. cerevisiae, in order of lowest P-value from top to bottom. (B) ChIP-seq data for exponentially growing (Exp) and saturated (Sat) S. cerevisiae corresponding to motif clusters in panel A. (C) The sum of the log2 fold enrichments in saturated conditions for motif clusters in panel A.
Figure 3—figure supplement 2
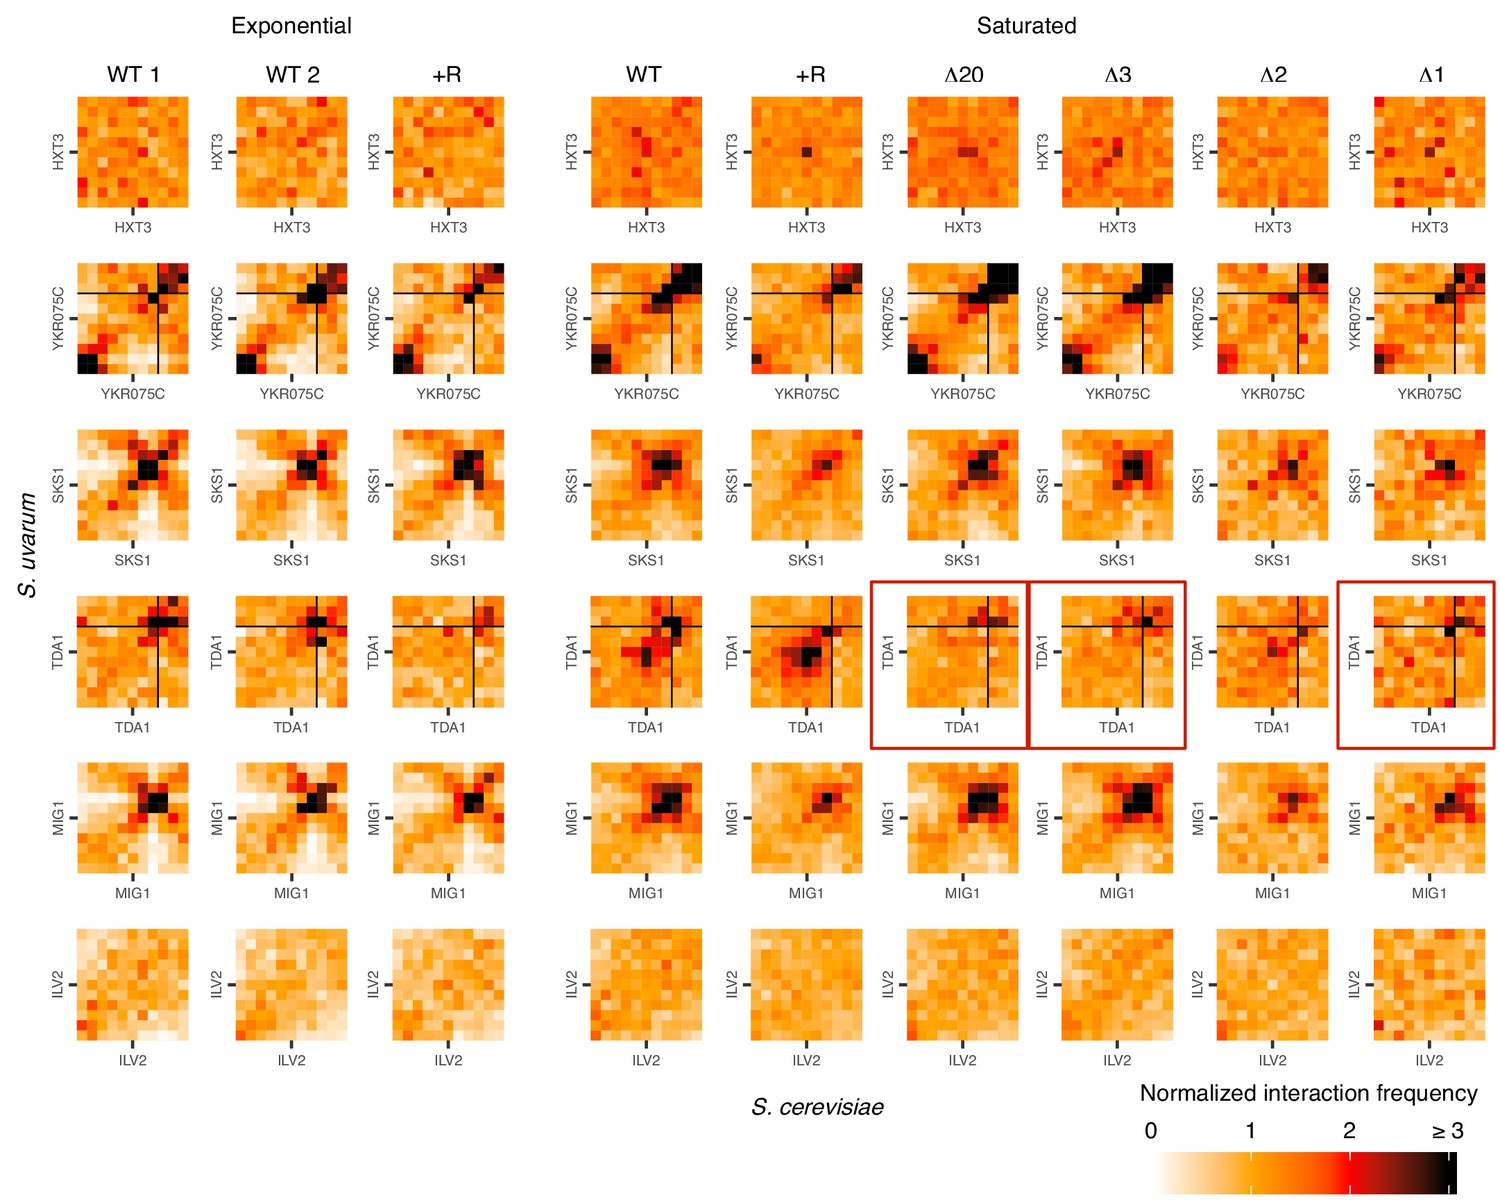
Hi-C evidence of inducible homolog pairing at TDA1 and HXT3.
Hi-C contact maps of interactions between homologous regions centered on motif clusters in Figure 3A, at 32 kb resolution in exponentially growing and saturated cultures. WT represents strain ILY456 (YMD3259).+R indicates a restriction site added upstream of HAS1 (YMD3920), ∆20 indicates a 20 kb deletion centered at S. cerevisiae HAS1 (YMD3266), ∆3 indicates a 3 kb deletion centered at S. cerevisiae HAS1 (YMD3267), ∆2 indicates a 2 kb deletion of the S. cerevisiae HAS1 coding sequence (YMD3268), and ∆1 indicates a 1 kb deletion of the S. cerevisiae HAS1pr-TDA1pr intergenic region (YMD3269). Red boxes indicate the deletion strains where pairing between TDA1 alleles should not occur. Black lines indicate chromosome starts/ends.
Figure 3—figure supplement 3
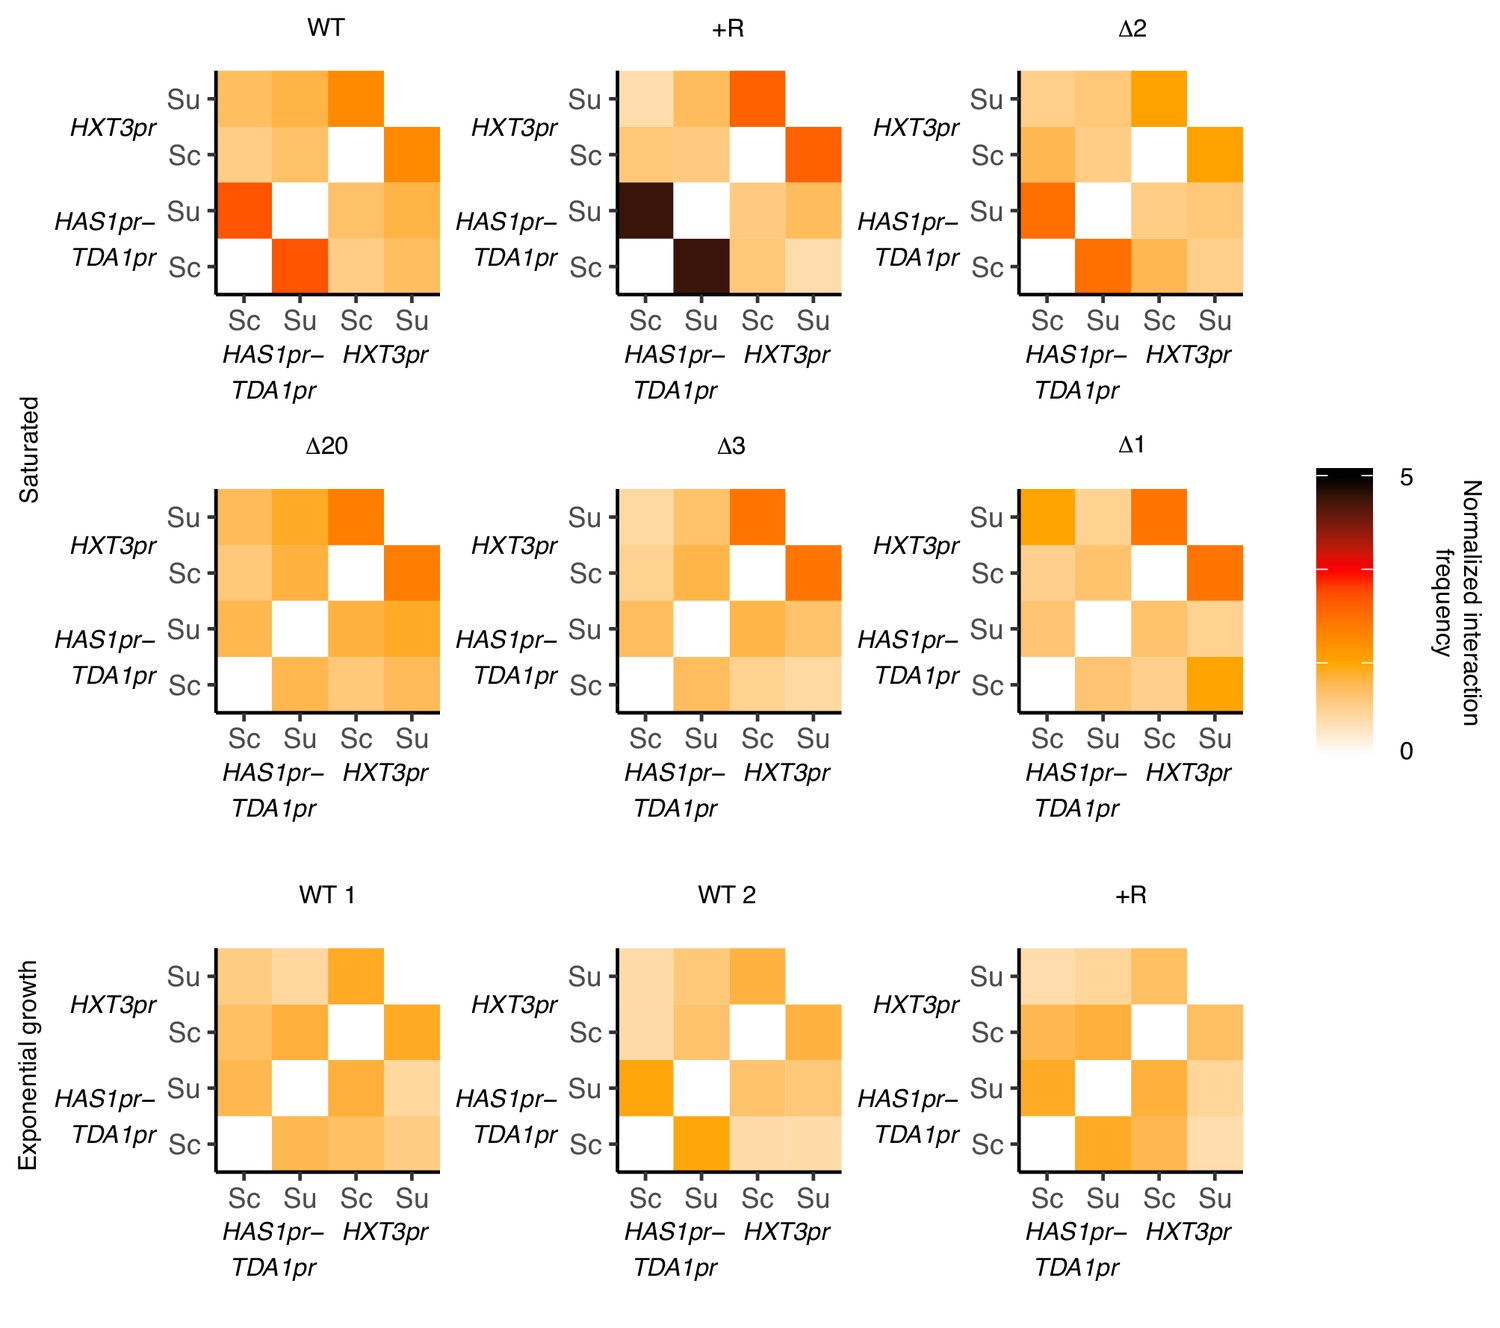
HAS1pr-TDA1pr and HXT3pr pairing are independent.
Hi-C interaction frequencies among the S. cerevisiae and S. uvarum copies of HAS1pr-TDA1pr and HXT3pr, at 32 kb resolution, across strains in pairing (saturated) and non-pairing (exponential growth) conditions. Sc indicates S. cerevisiae, and Su indicates S. uvarum. WT represents strain ILY456 (YMD3259).+R indicates a restriction site added upstream of HAS1 (YMD3920), ∆20 indicates a 20 kb deletion centered at S. cerevisiae HAS1 (YMD3266), ∆3 indicates a 3 kb deletion centered at S. cerevisiae HAS1 (YMD3267), ∆2 indicates a 2 kb deletion of the S. cerevisiae HAS1 coding sequence (YMD3268), and ∆1 indicates a 1 kb deletion of the S. cerevisiae HAS1pr-TDA1pr intergenic region (YMD3269).
Figure 3—figure supplement 4
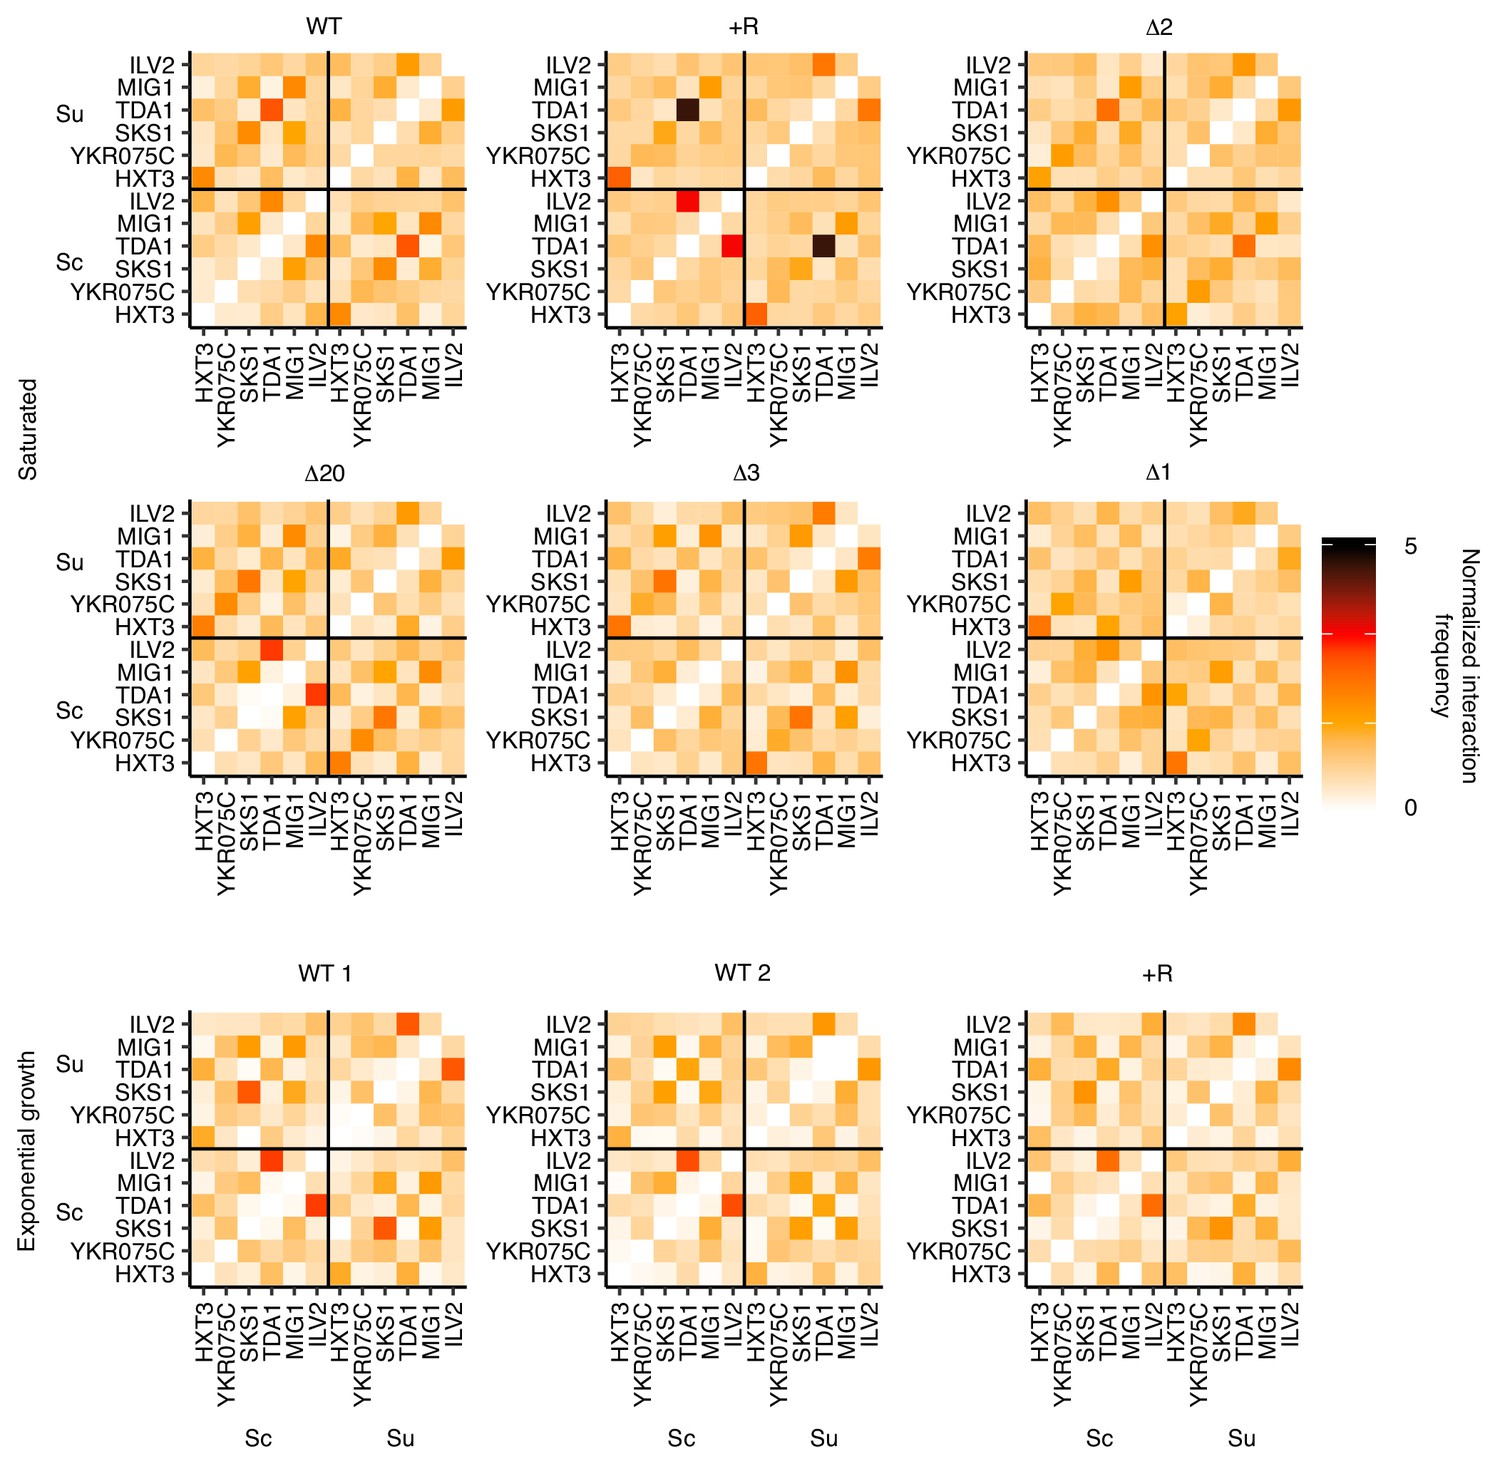
Lack of nonhomologous pairing between clusters of Leu3, Sdd4, and Rgt1 motifs.
Hi-C interaction frequencies among the S. cerevisiae and S. uvarum copies of motif clusters in Figure 3, at 32 kb resolution, across strains in pairing (saturated) and non-pairing (exponential growth) conditions. Sc indicates S. cerevisiae, and Su indicates S. uvarum. WT represents strain ILY456 (YMD3259).+R indicates a restriction site added upstream of HAS1 (YMD3920), ∆20 indicates a 20 kb deletion centered at S. cerevisiae HAS1 (YMD3266), ∆3 indicates a 3 kb deletion centered at S. cerevisiae HAS1 (YMD3267), ∆2 indicates a 2 kb deletion of the S. cerevisiae HAS1 coding sequence (YMD3268), and ∆1 indicates a 1 kb deletion of the S. cerevisiae HAS1pr-TDA1pr intergenic region (YMD3269). Note that ILV2 and TDA1 are both on chrXIII, and are the only pair of motif clusters on the same chromosome.
Figure 4 with 2 supplements
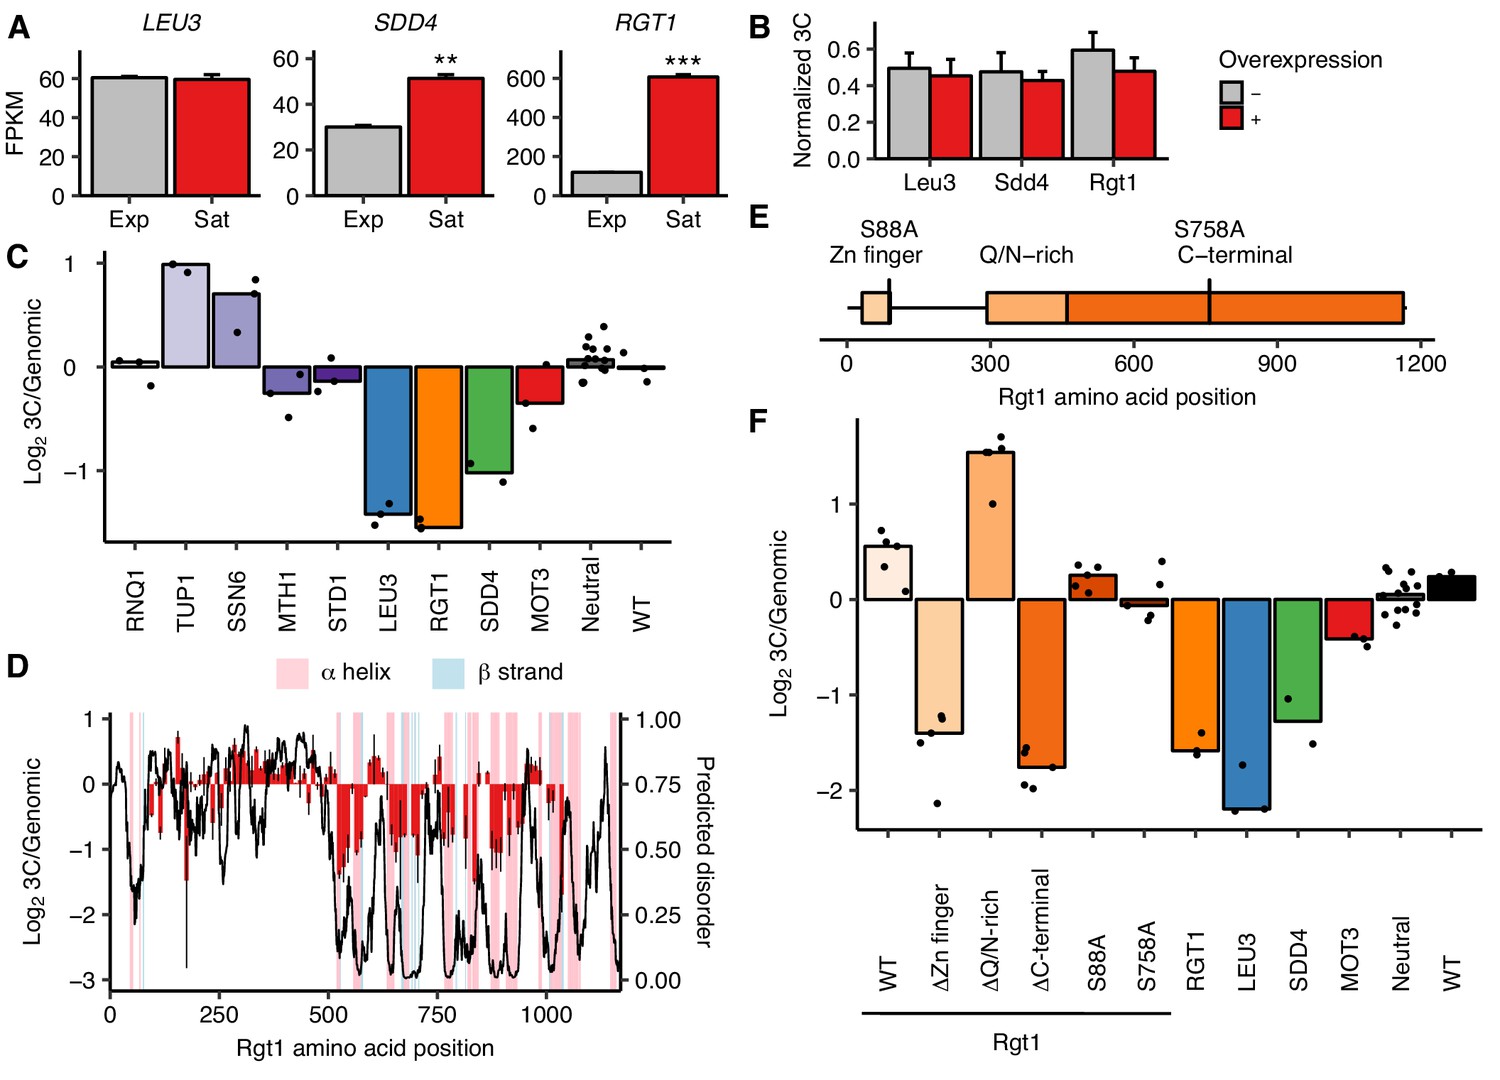
Rgt1 expression, interaction partners, and competing domains regulate HAS1pr-TDA1pr pairing.
(A) RGT1 and SDD4 are upregulated in saturated cultures. RNA-seq expression levels for LEU3, SDD4, RGT1 in exponentially growing (Exp) and saturated (Sat) cultures. FPKM = fragments per kilobase per million read pairs. Bars indicate mean ± s.e.m. of biological triplicates. **p<0.01, ***p<0.001 (Student’s t-test). (B) Individual TF overexpression is insufficient for pairing. Shown are HAS1pr-TDA1pr homolog pairing frequencies with and without estradiol-induced overexpression of LEU3, SDD4, RGT1 in S. cerevisiae x S. uvarum hybrids during exponential growth, measured by 3C and normalized to contacts between HAS1pr-TDA1pr and LCB1 on S. cerevisiae chrXIII. Bars indicate mean ± s.d. of technical triplicates. (C) Effects of Rgt1 interaction partner deletions on ectopic HAS1pr-TDA1pr pairing in saturated conditions. Bar plot of median relative abundance in 3C library compared to the genomic library, with overlaid scatter plot of individual barcoded deletion strains. Retested controls are shown in same colors as in Figure 2; potential interaction partners are shown in shades of purple. (D) Regions of Rgt1 necessary for pairing in saturated culture conditions, with overlaid predicted disorder (black line, right y-axis) and secondary structure (pink and blue highlights). Each bar represents the ratio of the frequency of each 10 amino acid deletion in the 3C library compared to the genomic library. Error bars indicate the two biological replicates. (E) Domain deletions and phosphorylation site mutations tested in panel F. (F) Effects of Rgt1 domain deletions and phosphorylation site mutations on ectopic HAS1pr-TDA1pr pairing in saturated cultures, plotted as in panel C. Rgt1 indicates the strains with an ectopic wild-type (WT) or mutant copy of Rgt1 in addition to a deletion of the endogenous RGT1 locus.
Figure 4—figure supplement 1
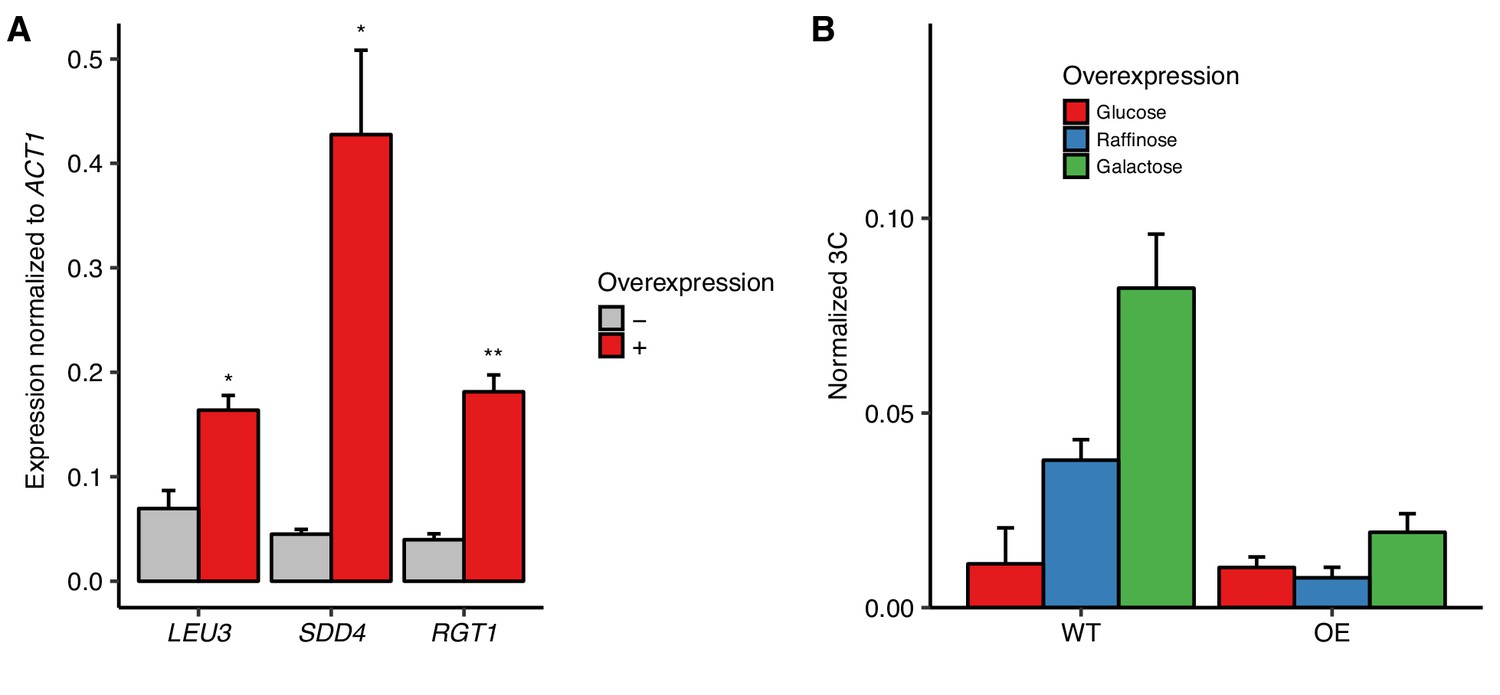
Overexpression of RGT1 is not sufficient for HAS1pr-TDA1pr pairing.
(A) Estradiol-induced overexpression of TF genes. Bars show RNA levels of S. cerevisiae LEU3, SDD4, and RGT1 with (red) and without (gray) estradiol-induced overexpression in S. cerevisiae x S. uvarum hybrids, measured by reverse transcription qPCR (RT-qPCR) and normalized to S. cerevisiae ACT1 expression. Bars indicate mean ± s.e.m. of technical triplicates. *p<0.05, **p<0.01 (Student’s t-test). (B) RGT1 overexpression does not result in increased pairing. Frequency of contacts between HAS1pr-TDA1pr alleles as measured by 3C, normalized to the frequency of contacts between S. cerevisiae HAS1pr-TDA1pr and S. cerevisiae LCB1 in S. cerevisiae x S. uvarum hybrids (strain YMD3920) with (OE) or without (WT) a plasmid carrying a copy of epitope-tagged RGT1-6xHis-HA-3C-pA under a GAL1 promoter, grown in glucose (red), raffinose (blue), or galactose (green). Bars indicate mean ± s.d. of technical triplicates.
Figure 4—figure supplement 2
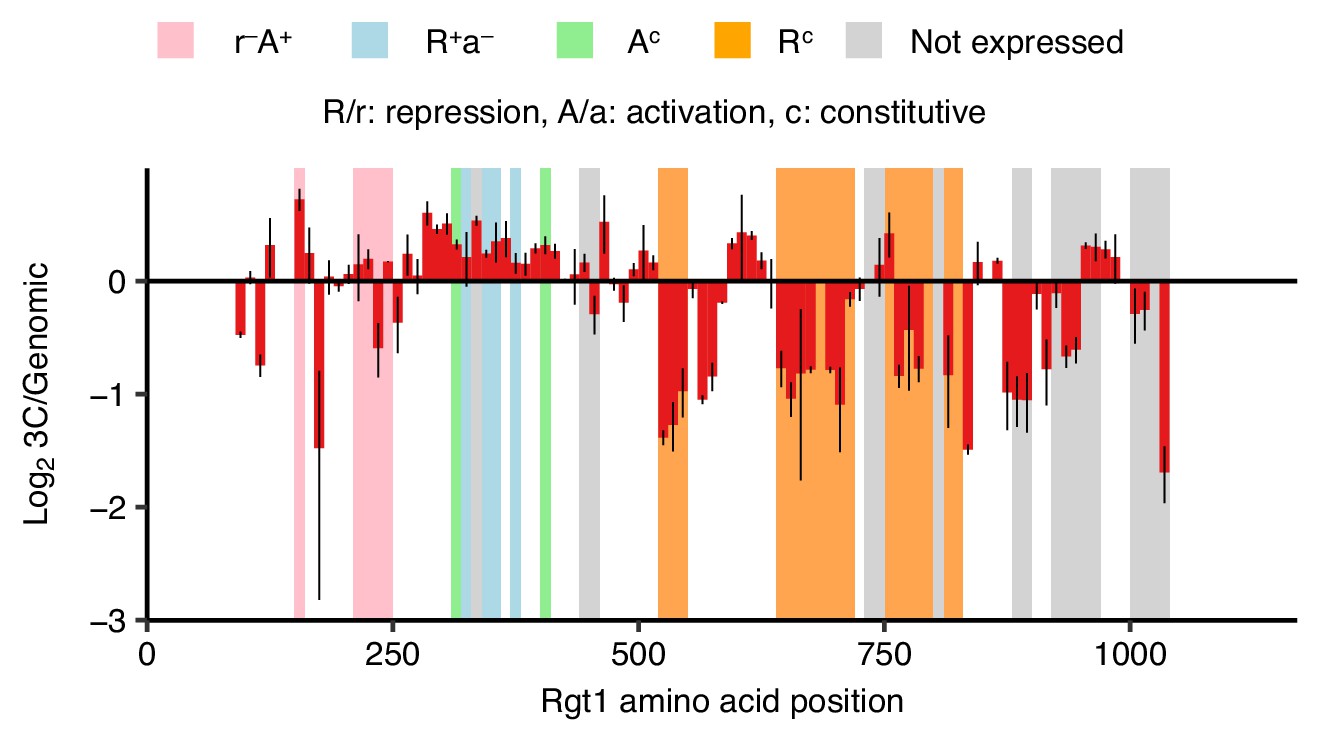
Regions of Rgt1 required for pairing correspond to regulatory domains.
Regions of Rgt1 necessary for HAS1pr-TDA1pr pairing in saturated conditions, as in Figure 4D, shown as ratio of the frequency of each 10 amino acid deletion in the 3C library compared to the genomic library. Error bars indicate the two biological replicates. Highlighted regions indicate the previously mapped functional domains of Rgt1 (Polish et al., 2005).
Figure 5 with 2 supplements
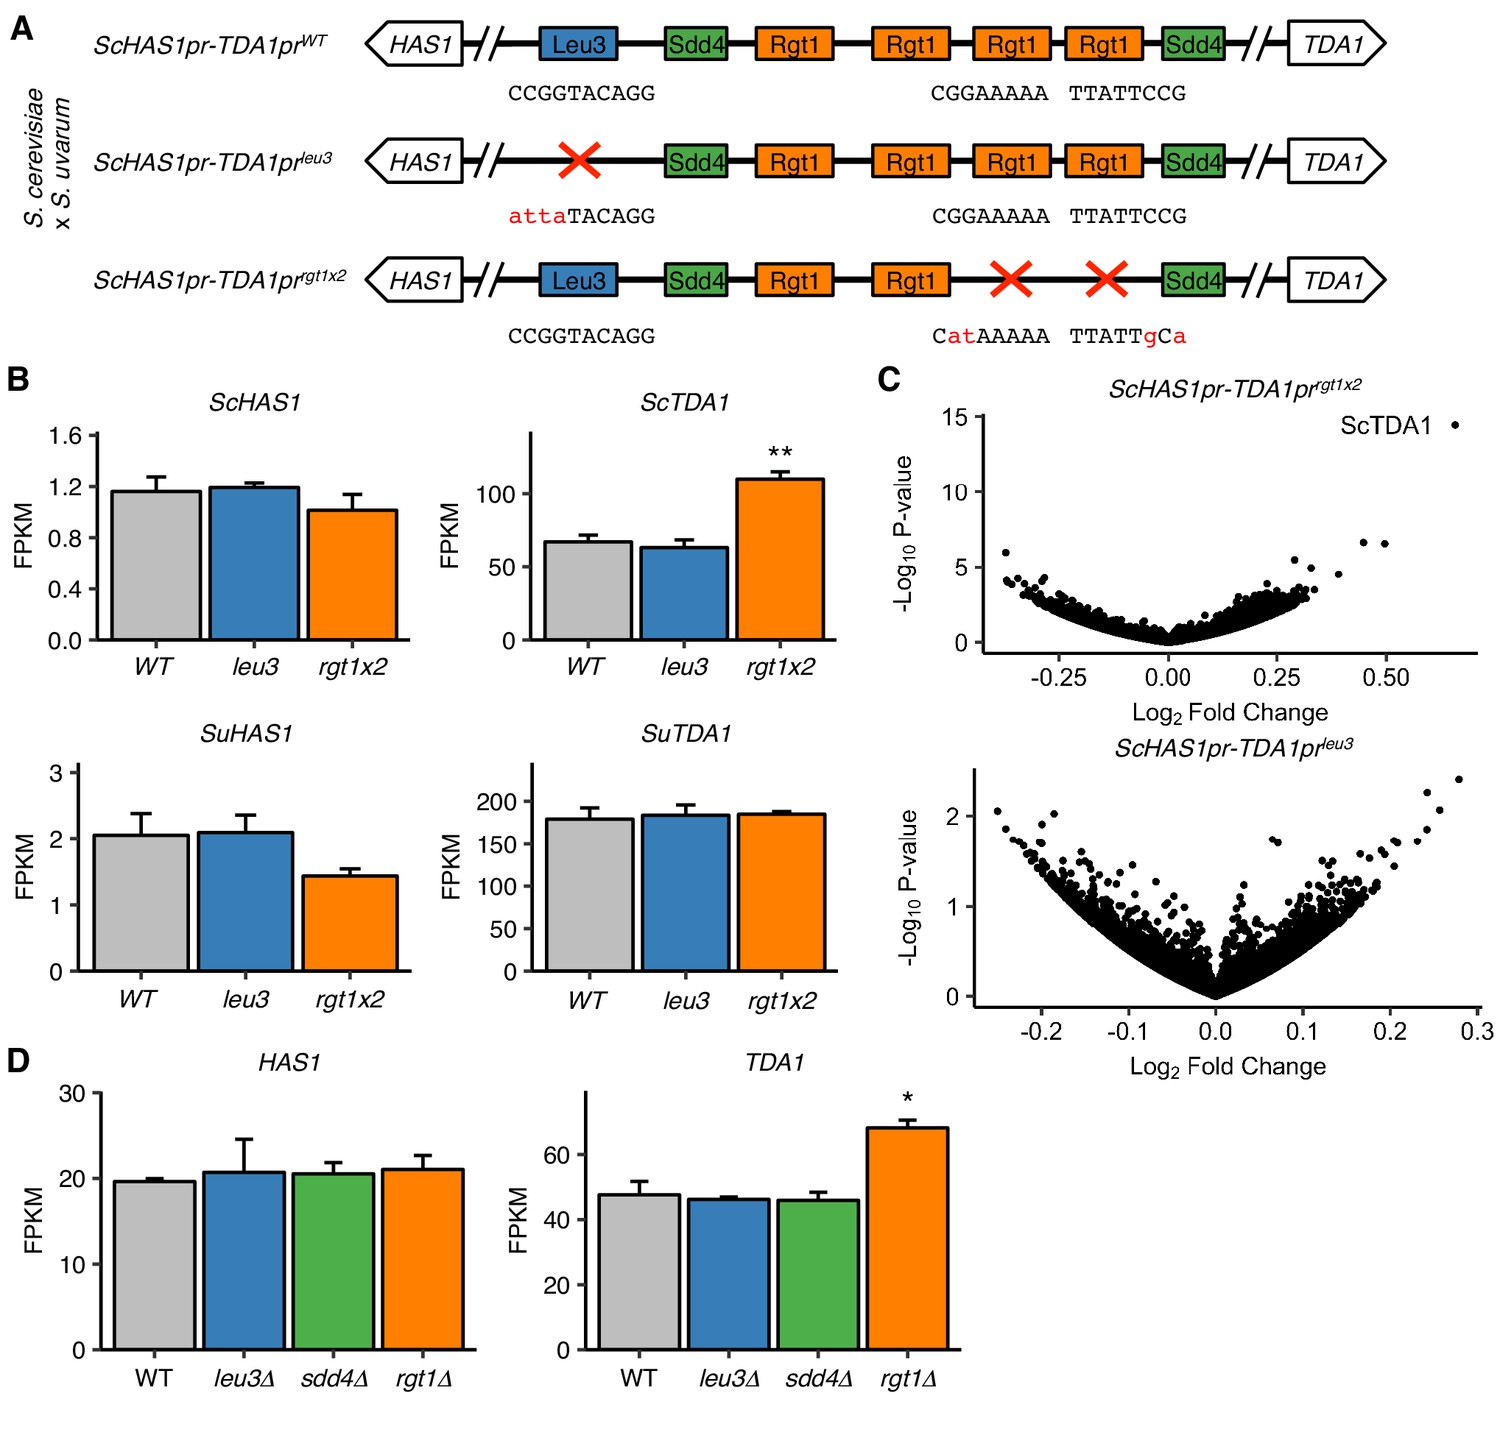
Pairing TFs play a minimal role in transcriptional regulation of the HAS1-TDA1 locus.
(A) Mutations in S. cerevisiae HAS1pr-TDA1pr tested for transcriptional effects in S. cerevisiae x S. uvarum hybrids. Colored boxes indicate TF motifs. Wild type and mutated sequences are shown below boxes, with mutated bases in lowercase, red letters. (B) Rgt1 regulates TDA1 expression in cis. RNA-seq expression levels for S. cerevisiae (Sc) and S. uvarum (Su) copies of HAS1 and TDA1 in saturated cultures of strains shown in panel A. FPKM = fragments per kilobase per million read pairs. Bars indicate mean ± s.e.m. of biological triplicates. **p<0.01 (Student’s t-test). (C) Mutations in pairing region cause few transcriptional changes. Volcano plot of fold change vs. p-value in mutant strains compared to wild type, shown in (A). (D) RNA-seq expression levels for HAS1 and TDA1 in saturated cultures of wild type haploid S. cerevisiae and gene deletion strains. Bars indicate mean ± s.e.m. of biological triplicates. *p<0.05 (Student’s t-test).
Figure 5—figure supplement 1
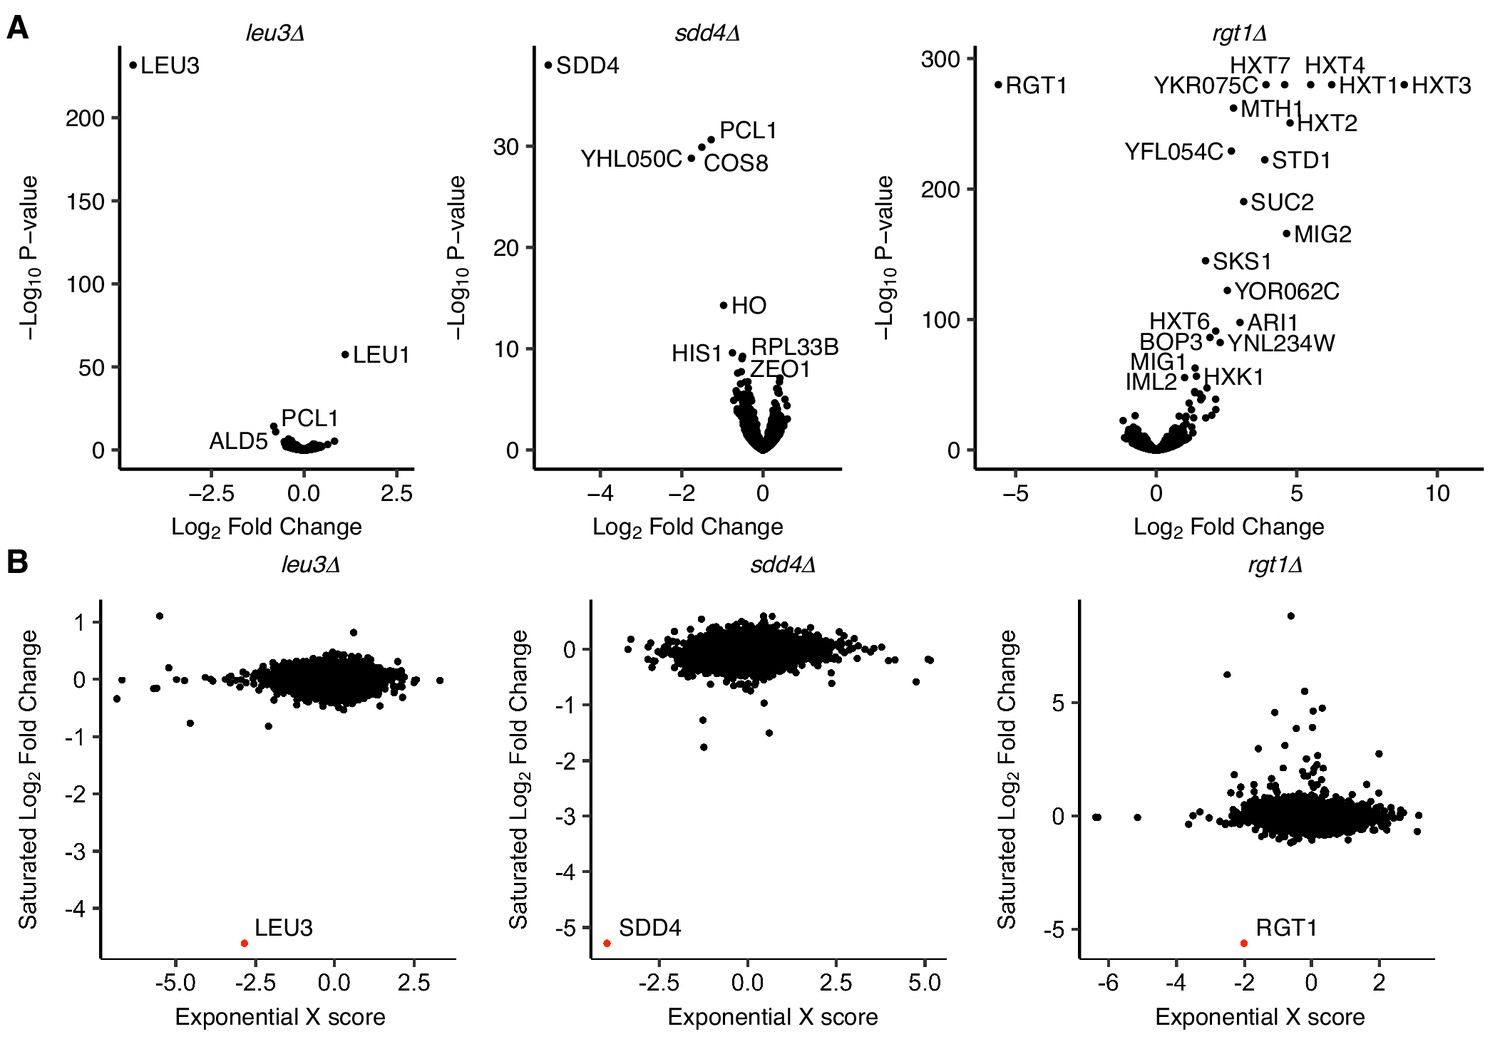
Transcriptional effects of TF deletion in saturated culture and exponential growth.
(A) Volcano plots of differentially expressed genes in TF deletion strains compared to a wild-type control in saturated culture conditions, by RNA-seq. (B) Comparison of log2 fold change from RNA-seq in saturated culture conditions to gene expression microarray ‘X scores’ (normalized, confidence-weighted log ratios) in exponential growth (Hu et al., 2007), with deleted gene highlighted in red.
Figure 5—figure supplement 2
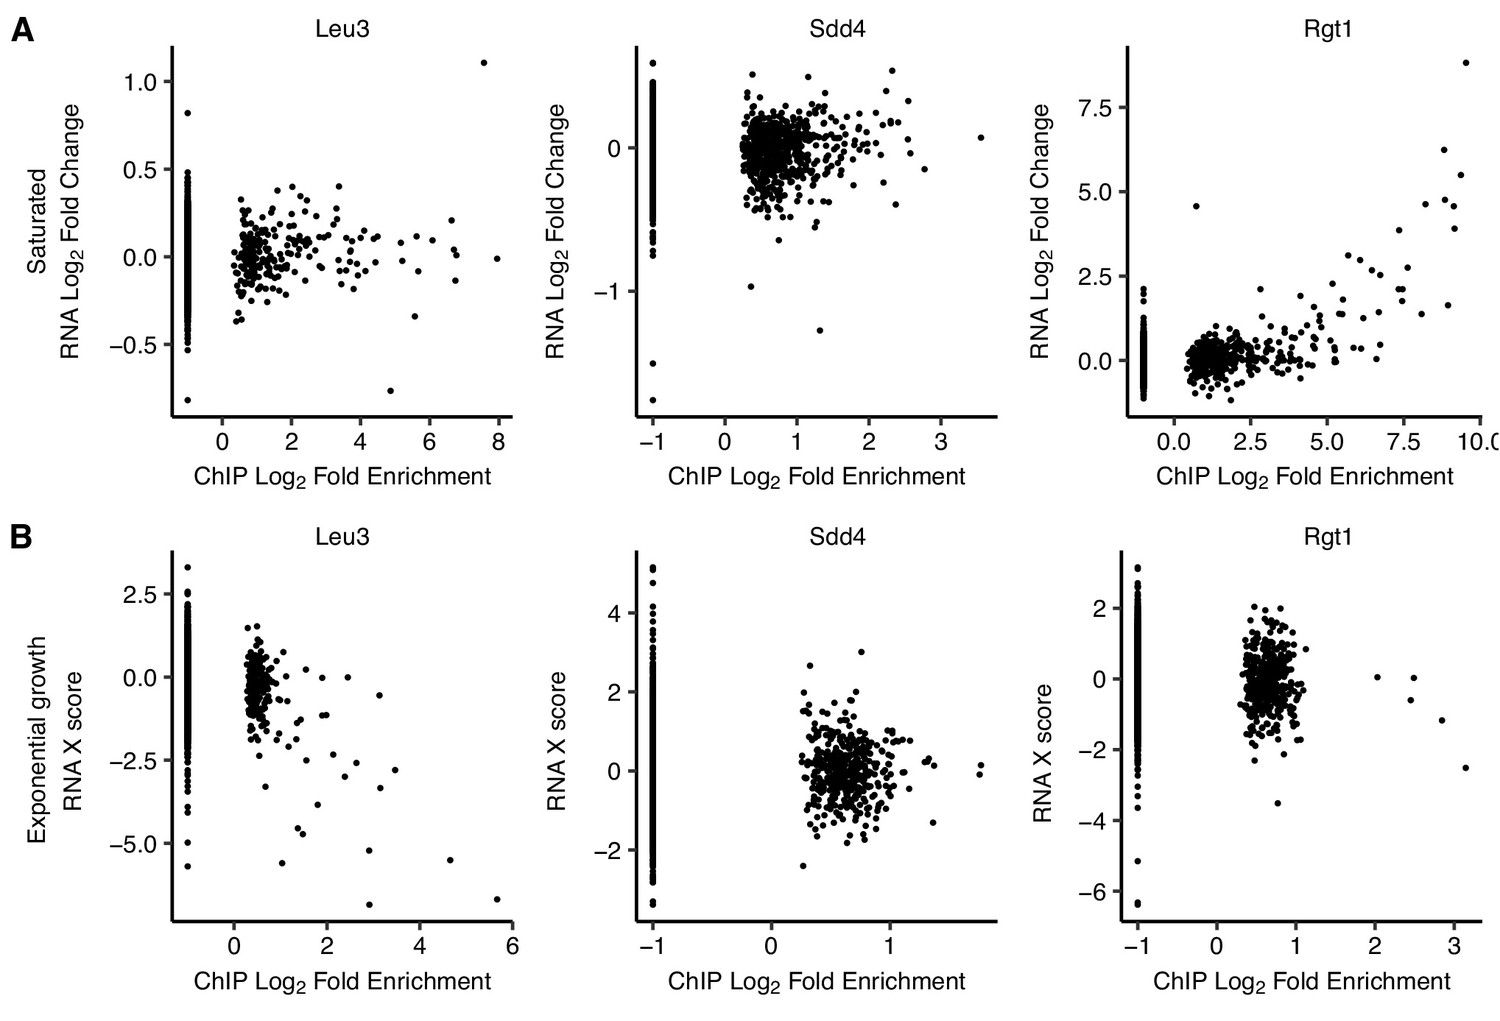
Comparison of TF binding targets and differentially expressed genes upon TF deletion.
(A) Genes with upstream Rgt1 ChIP-seq peaks in saturated cultures are upregulated upon RGT1 deletion. Scatter plots of log2 ChIP-seq peak fold enrichment vs. log2 fold change in RNA expression for downstream genes, excluding the deleted TF gene, in saturated culture. (B) Genes with upstream Leu3 ChIP-seq peaks in exponential growth are downregulated upon LEU3 deletion. Same as panel A but for exponential growth, using microarray ‘X scores’ (normalized, confidence-weighted log ratios) for differential gene expression (Hu et al., 2007).
Additional files
-
Supplementary file 1
Oligonucleotide sequences used in this study.
- https://doi.org/10.7554/eLife.42499.025
-
Supplementary file 2
MAP-C libraries.
- https://doi.org/10.7554/eLife.42499.026
-
Supplementary file 3
96-well yeast transformation protocol.
- https://doi.org/10.7554/eLife.42499.027
-
Supplementary file 4
Key resources table.
- https://doi.org/10.7554/eLife.42499.028
-
Transparent reporting form
- https://doi.org/10.7554/eLife.42499.029
Download links
A two-part list of links to download the article, or parts of the article, in various formats.
Downloads (link to download the article as PDF)
Open citations (links to open the citations from this article in various online reference manager services)
Cite this article (links to download the citations from this article in formats compatible with various reference manager tools)
A combination of transcription factors mediates inducible interchromosomal contacts
eLife 8:e42499.
https://doi.org/10.7554/eLife.42499


