Live cell imaging of meiosis in Arabidopsis thaliana
- University of Hamburg, Germany
- Wageningen University, The Netherlands
- Wageningen University and Research, The Netherlands
Figures
Figure 1 with 1 supplement
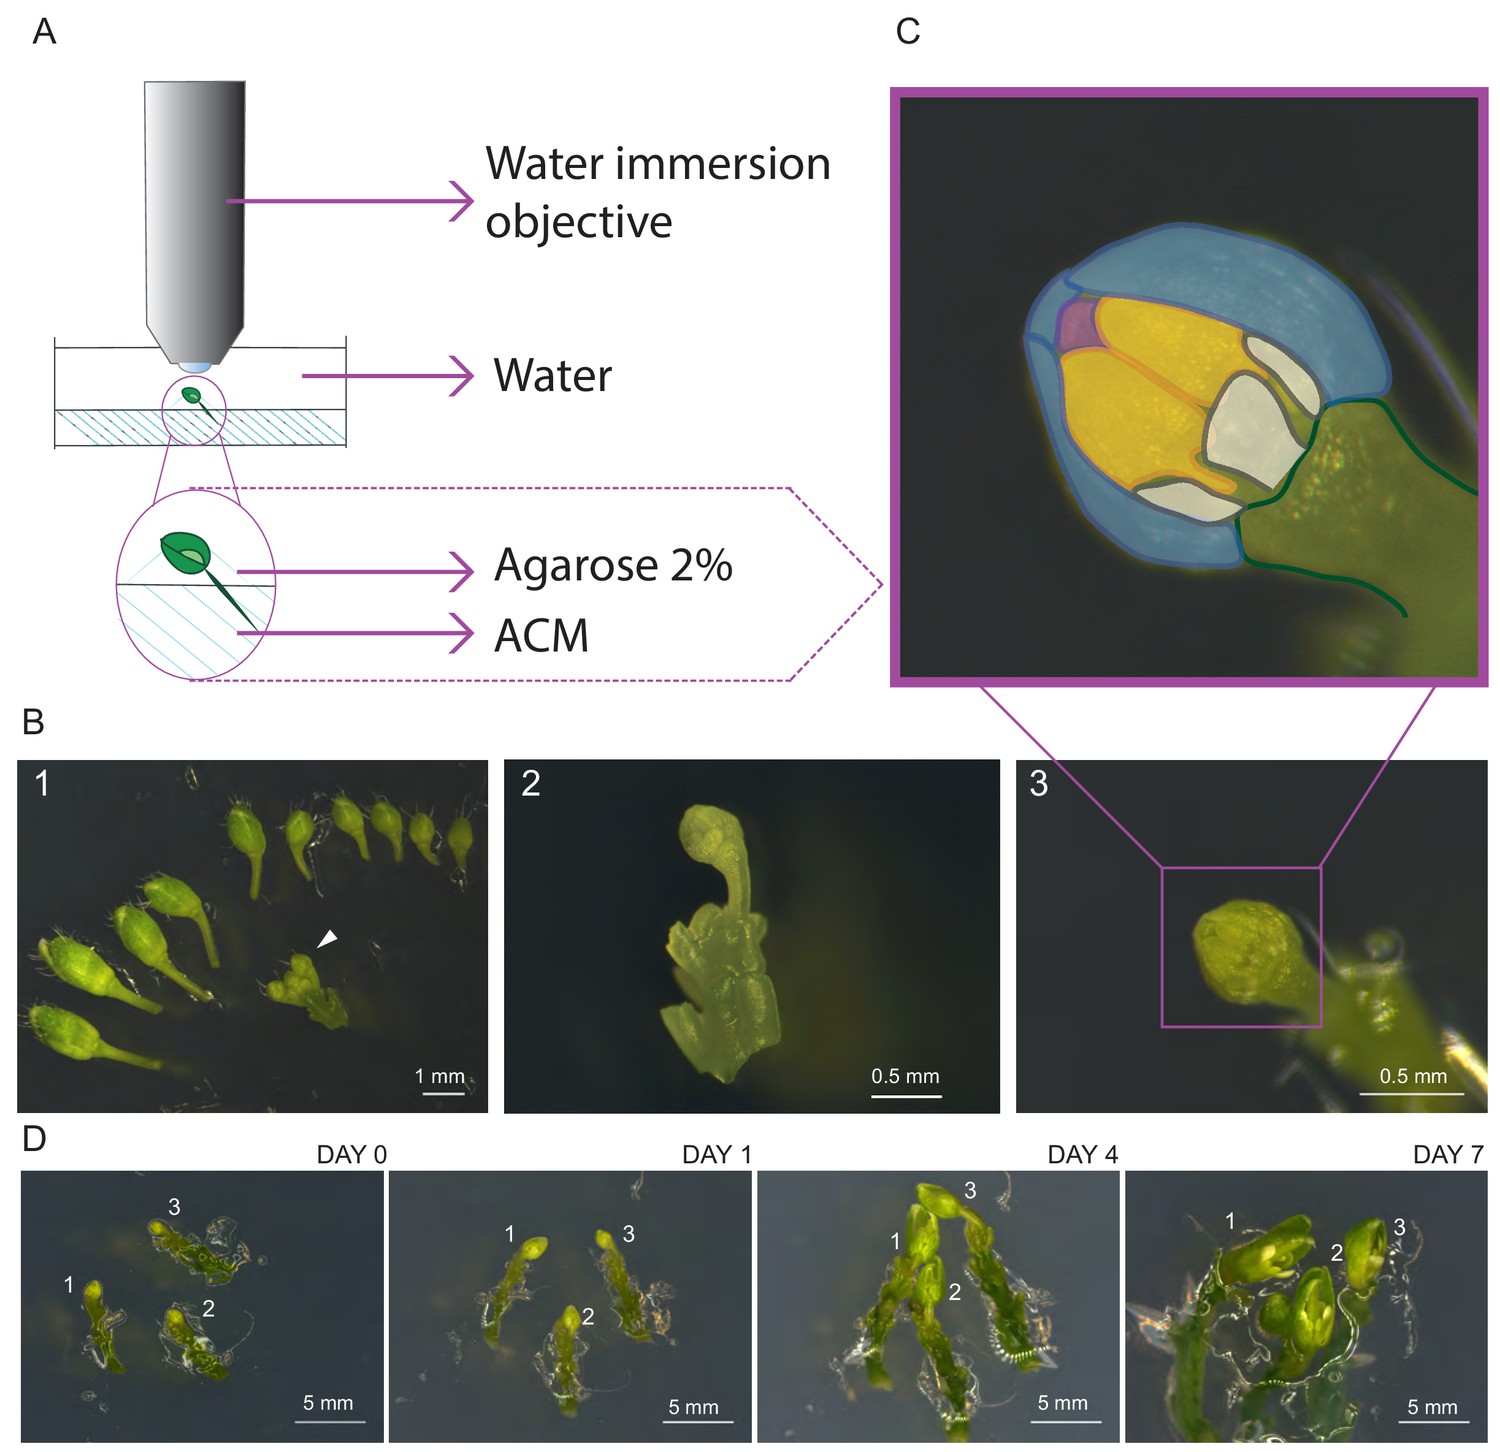
Establishment of life cell imaging of male meiocytes.
(A) Microscope set-up for live cell imaging. An isolated flower bud is mounted on a small petri dish in ACM medium, stabilized with a drop of 2% agarose and submerged in sterile water. The objective is directly dipped into the water. (B) Steps of sample preparation. A flower bud of 0.4–0.6 mm length is selected (white arrow-head, B1). The upper-most sepal of this flower and all other flowers are removed from the stem (B2). The flower is anchored in the medium with the anthers exposed to the top (B3). (C) Magnification of the sample shown in B3. The two exposed anthers are highlighted in yellow, petals in white, the three remaining sepals in blue, and the tip of the stigma in pink. (D) Flower buds can be kept alive and growing for up to 1 week. Numbers 1, 2 and 3 mark the same flower buds over time.
Figure 1—figure supplement 1
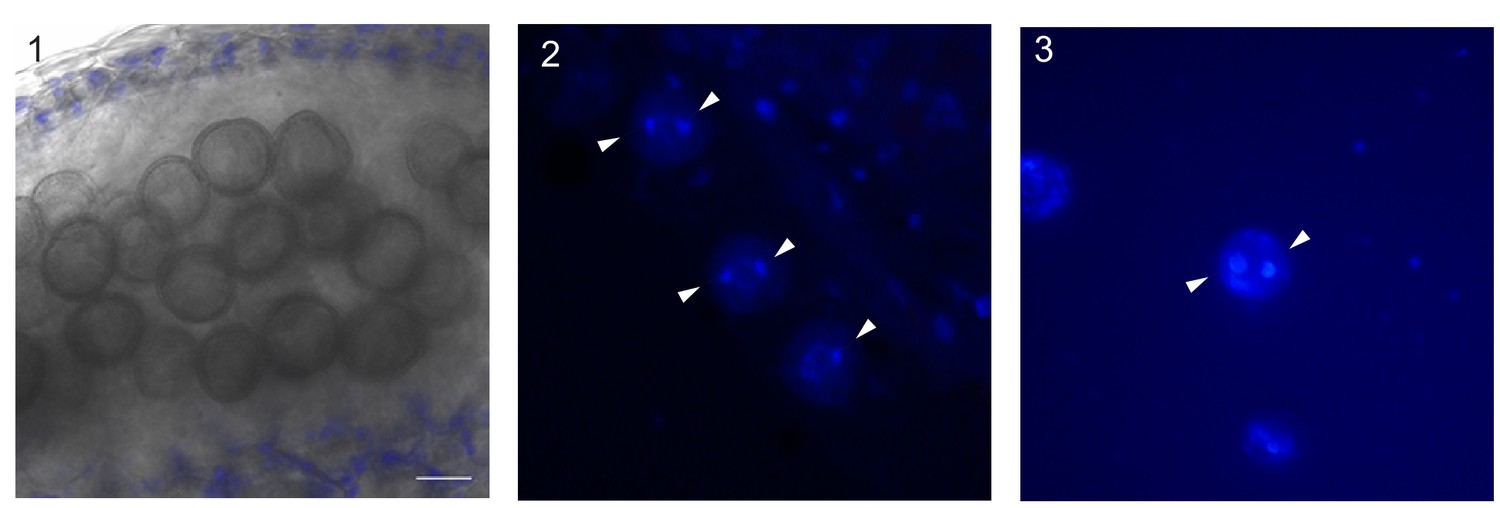
Pollen undergoes a further cell division after imaging.
(A) Still picture of an anther of WT plant at confocal microscopy. The flower bud was imaged for 48 hr, and then left for 72 hr on a new ACM medium, in growing conditions. During this time pollen grains detached fully from each other. The scale bar is 20 micron, in blue autofluorescence of chloroplasts of the outer layers of the anther. (B and C) pollen grains after DAPI staining. The pollen is originated from WT anthers imaged for 24 hr, and later on transferred for 72 hr on ACM medium at growing conditions. Some pollen grains appear to be binucleated (white arrow head), proving that pollen undergoes at least one more cell division after being exposed to cell imaging. Pollen grains with higher number of nuclei were not detected, indicating that either the ACM medium is not optimized for pollen maturation, or the time of fixation was too early, not allowing the progression through a further cell division.
Figure 2 with 1 supplement
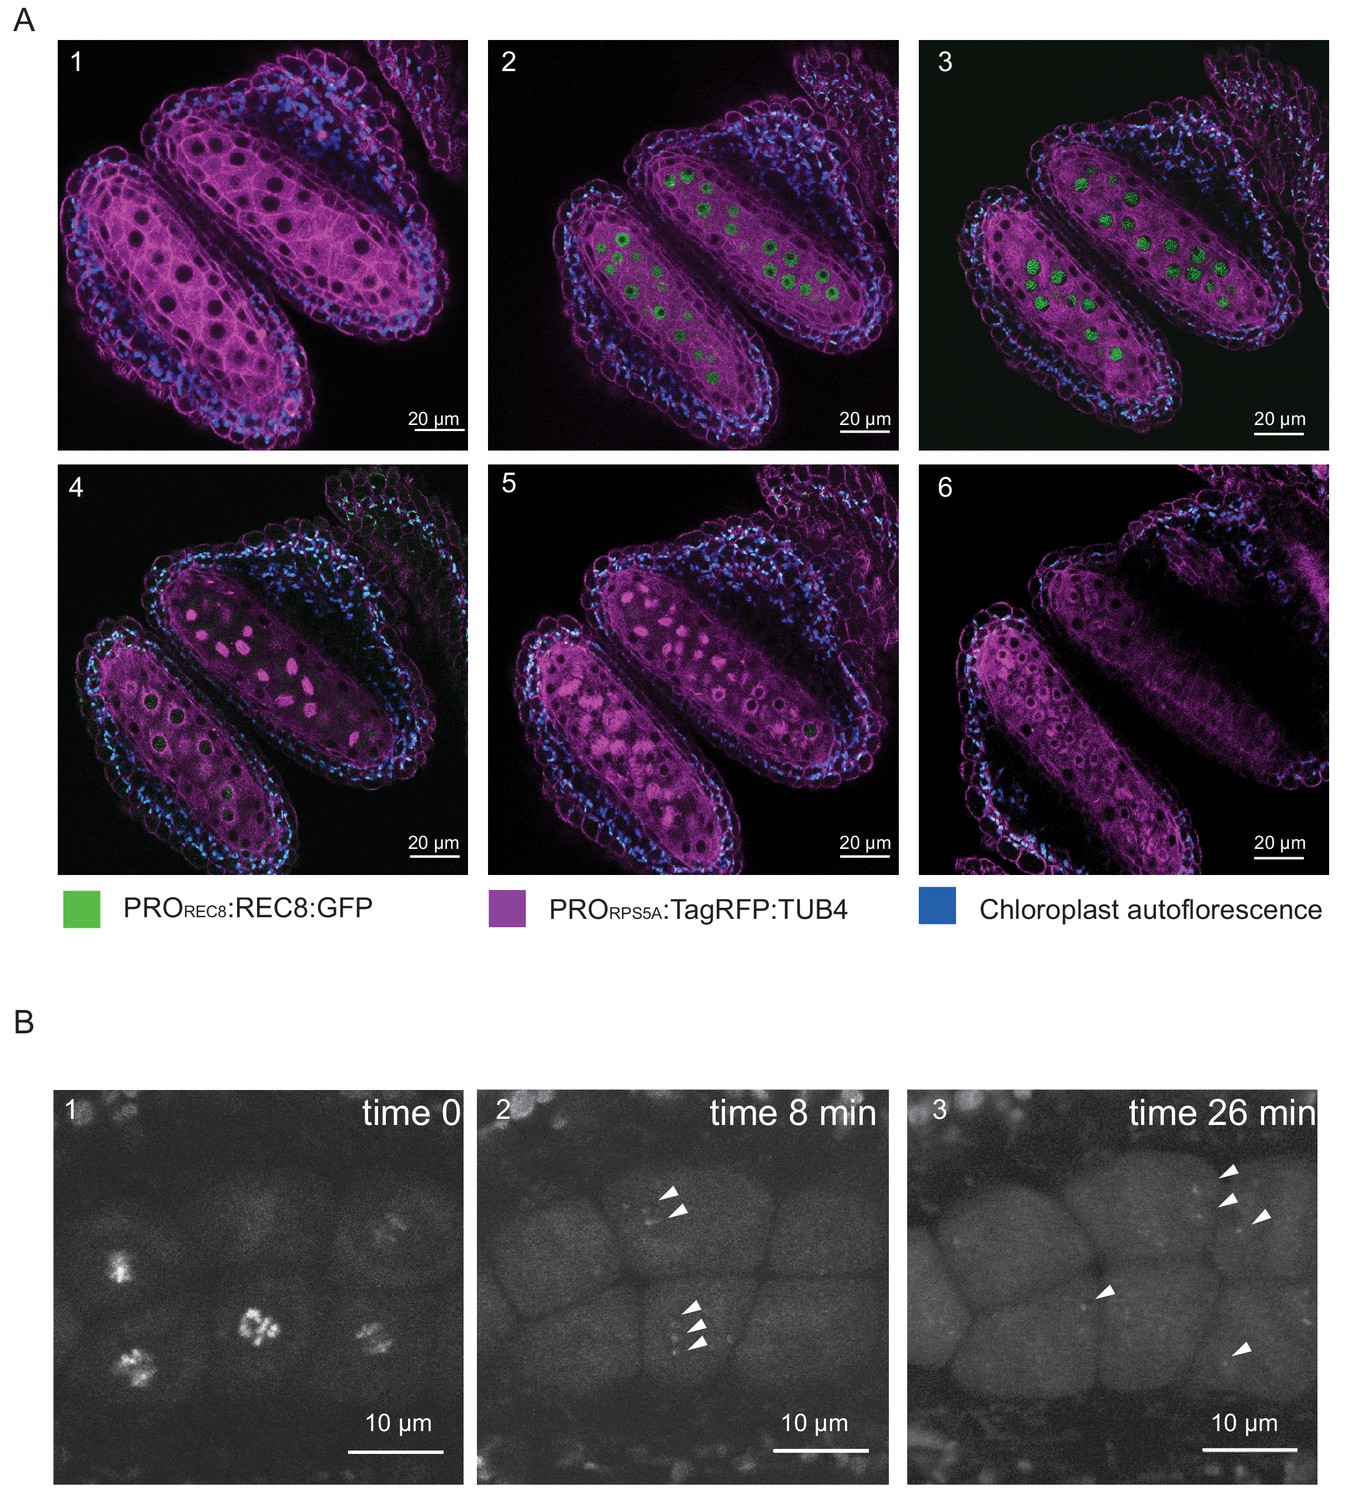
REC8 and TUB4 localization.
(A) Cross section of two neighboring anthers of the KINGBIRD line expressing PROREC8:REC8:GFP and PRORPS5A:TagRFP:TUB4 in wild-type background. A1: premeiosis; A2: leptotene; A3: zygotene; A4: diplotene in the lower anther and metaphase I in the upper anther; A5: telophase I in the lower anther and late prophase II-metaphase II transition in the upper anther; A6: tetrad stage. (B) REC8:GFP localization after metaphase I (B1) in a PROREC8:REC8:GFP plant. The white arrowheads in B2 and B3 indicate centromeric REC8.
Figure 2—figure supplement 1

Functionality of reporter lines used in this study.
(A) Branches of Col-0 WT, rec8 -/-, REC8:GFP in rec8-/- background, KINGBIRD in Col-0 WT background. While rec8 -/- shows short, thin and sterile siliques (magenta arrow head), REC8:GFP and KINGBIRD present WT-like, elongated and thick siliques (white arrow heads). (B) Open siliques of Col-0 WT, rec8 -/-, REC8:GFP in rec8-/- background, KINGBIRD in Col-0 WT background. Col-0 WT, REC8:GFP and KINGBIRD form round, turgid and fully developed seeds (white arrow heads), whereas rec8 -/- presents dry and aborted seeds (magenta arrow head). (C) Anthers stained with Peterson staining (Peterson et al., 2010). Col-0 WT, REC8:GFP and KINGBIRD only produce viable pollen, while high rates of aborted pollen (blue) produced by rec8 -/- are visible inside the pollen sacs. (D) Rate of seed abortion (%). (E) Rate of aborted pollen in (%). (F) Cell spreads of Col-0 WT, rec8 -/-, REC8:GFP in rec8-/- background, TagRFP-TUB4 in Col-0 WT background and TagRFP:TUA5 in Col-0 WT background. The figure shows a selection of the main meiotic phases. rec8-/- starts to show defects from diplotene onwards, with the presence of univalent at metaphase I, and the consequent miss-segregation of chromosomes, which leads to the formation of micronuclei and unbalanced tetrads. The meiotic progression is restored in rec8-/- expressing REC8:GFP and it is not disrupted in TagRFP:TUB4 and TagRFP:TUA5 in Col-WT background. Both of the constructs generated balanced and viable gametes.
Figure 3
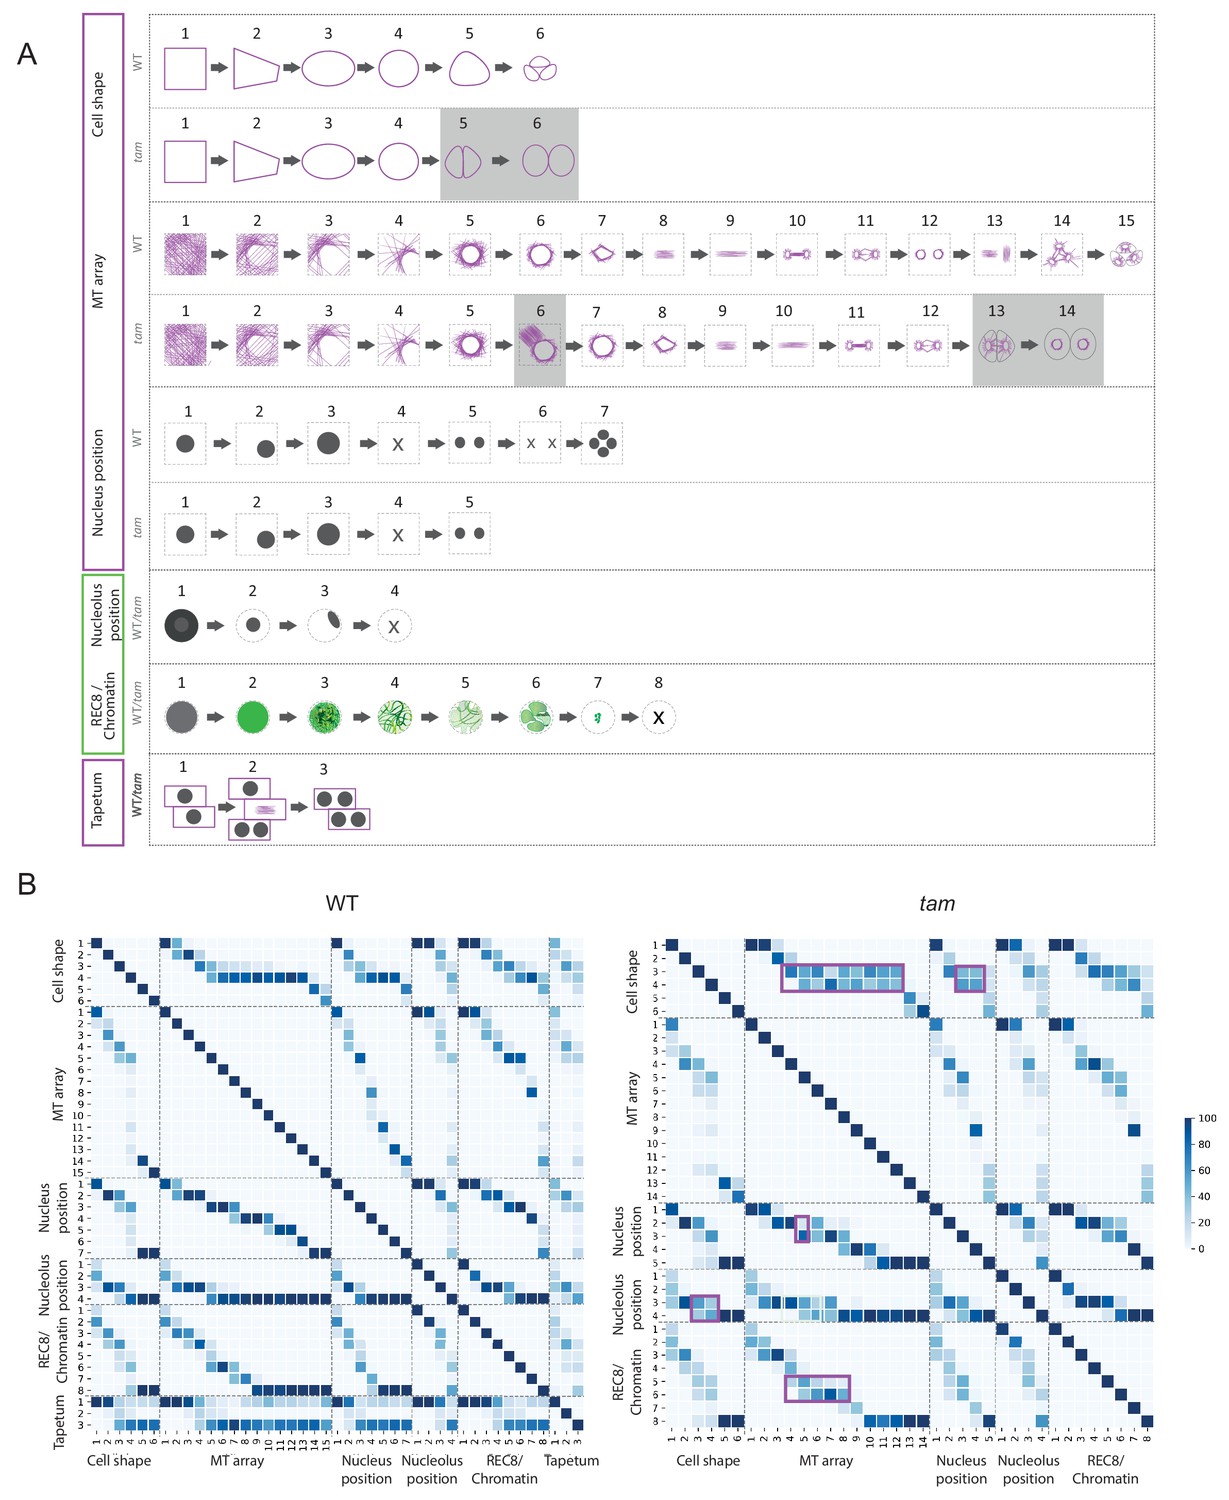
Identification of parameter states of male meiocytes.
(A) Schematic representation of the different states of the five parameters observed during meiotic progression in the WT and tam. While nucleolus position, REC8/chromatin and tapetum cells do not change their patterns; cell shape and MT array adopt additional states in tam. Consistent with a premature exit from meiosis, parameter states of the cell shape, nucleus, and MT associated with the second meiotic division are missing in tam. (B) Heat-maps of the co-occurrence of the different parameter states in the WT (on the left) and tam (on the right). The darker the blue color, the higher is the frequency of co-appearance of two parameter states. Tapetum cell states were only included in the WT analysis and found to be not very tightly correlated with any of the other parameters. The magenta rectangle highlights relationships that become less stringent in tam when compared to the WT. Numbers refer to the scheme in A.
Figure 4
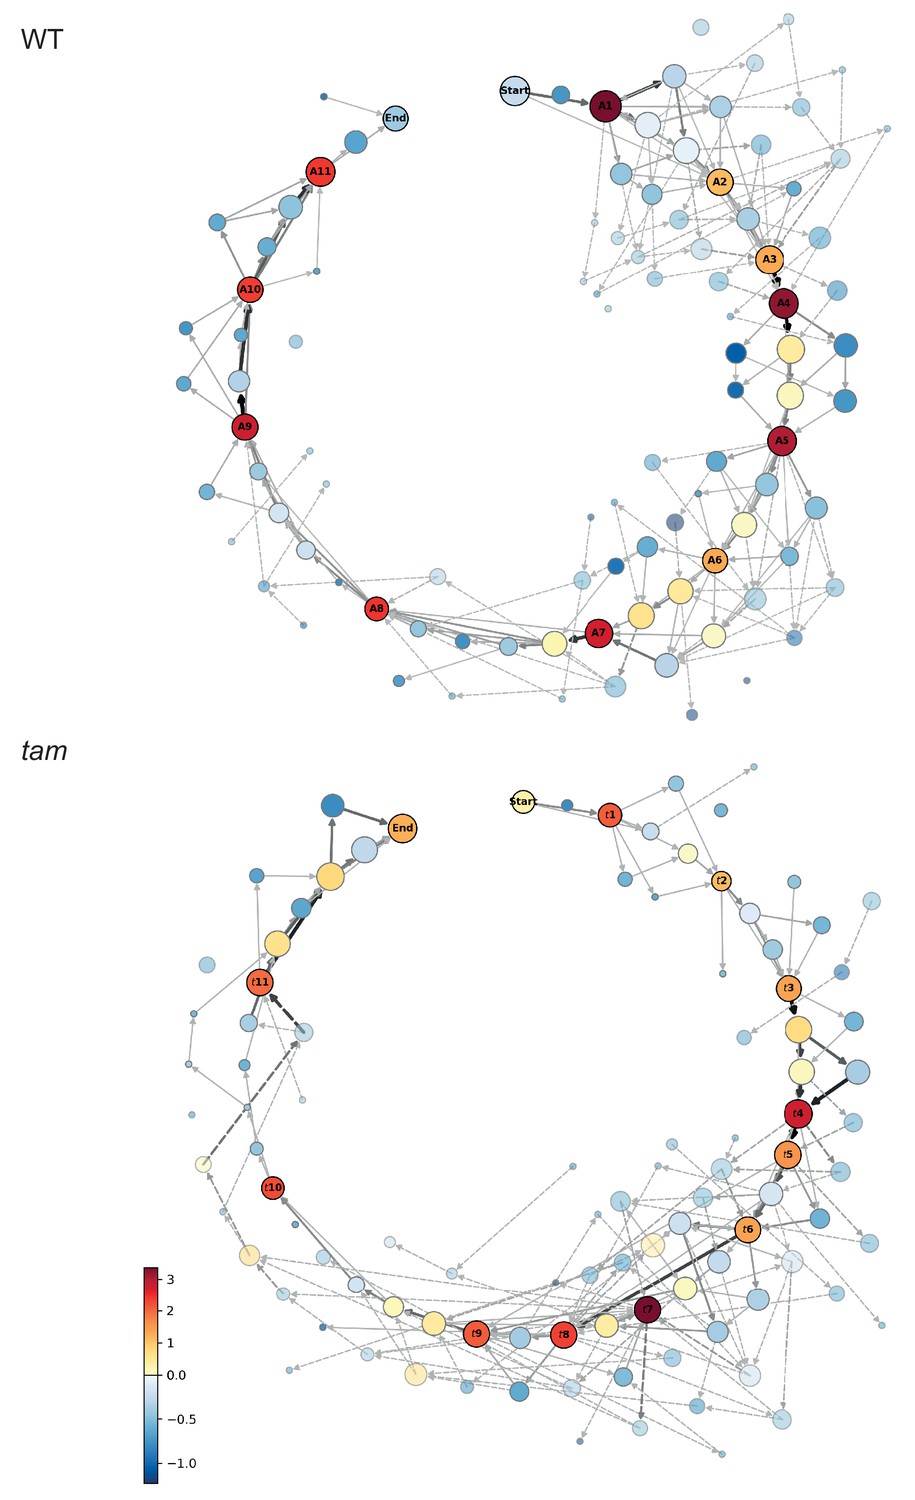
Matrix of cellular states.
The two schemes represent the matrix of the observed cellular states and how they relate to each other, in the WT (upper scheme) and tam background (lower scheme). Each circle represents a cellular state as a function of the combination of the observed parameters states. The area of the circle indicates the number of observations of that particular combination while the color indicates its neighboring score value; the warmer the color the higher is the neighboring value. The circles with a name and marked by a dark outline are the selected landmark states. The remaining circles are defined as transition states. The arrows represent all the direct transitions between cellular states observed within the data set, the thicker the arrows, the higher the number of observations. The dotted lines are transitions that do not fit the landmark scheme for example a trapezoidal cell (cell shape state 2) paired to an half moon initial state (MT array state number 3), yet with a centrally placed nucleus (state number 1). Most of these states are observed very rarely (2.8% in total).
-
Figure 4—source data 1
Cellular states of WT plants.
- https://doi.org/10.7554/eLife.42834.010
-
Figure 4—source data 2
Bootstrapping for WT landmark scoring.
- https://doi.org/10.7554/eLife.42834.011
-
Figure 4—source data 3
Cellular states of tam.
- https://doi.org/10.7554/eLife.42834.012
-
Figure 4—source data 4
Bootstrapping for tam landmark scoring.
- https://doi.org/10.7554/eLife.42834.013
Figure 5

Landmark scheme Illustration of the 11 meiotic landmarks.
(A1-A11) identified by the neighboring score in WT male meiosis. The first column provides a microscopy picture of meiocytes depicting each cellular state. The state of each parameter is separately shown in the following columns, the right-most column (overlay) displays their combination. On the right side, the classical stages of meiosis are roughly assigned to each landmark. The magenta and green frames identify the landmarks obtained by the analysis of TagRFP:TUB4 and REC8 separately.
-
Figure 5—source data 1
Cellular states revealed by 1 reporter.
- https://doi.org/10.7554/eLife.42834.015
Figure 6
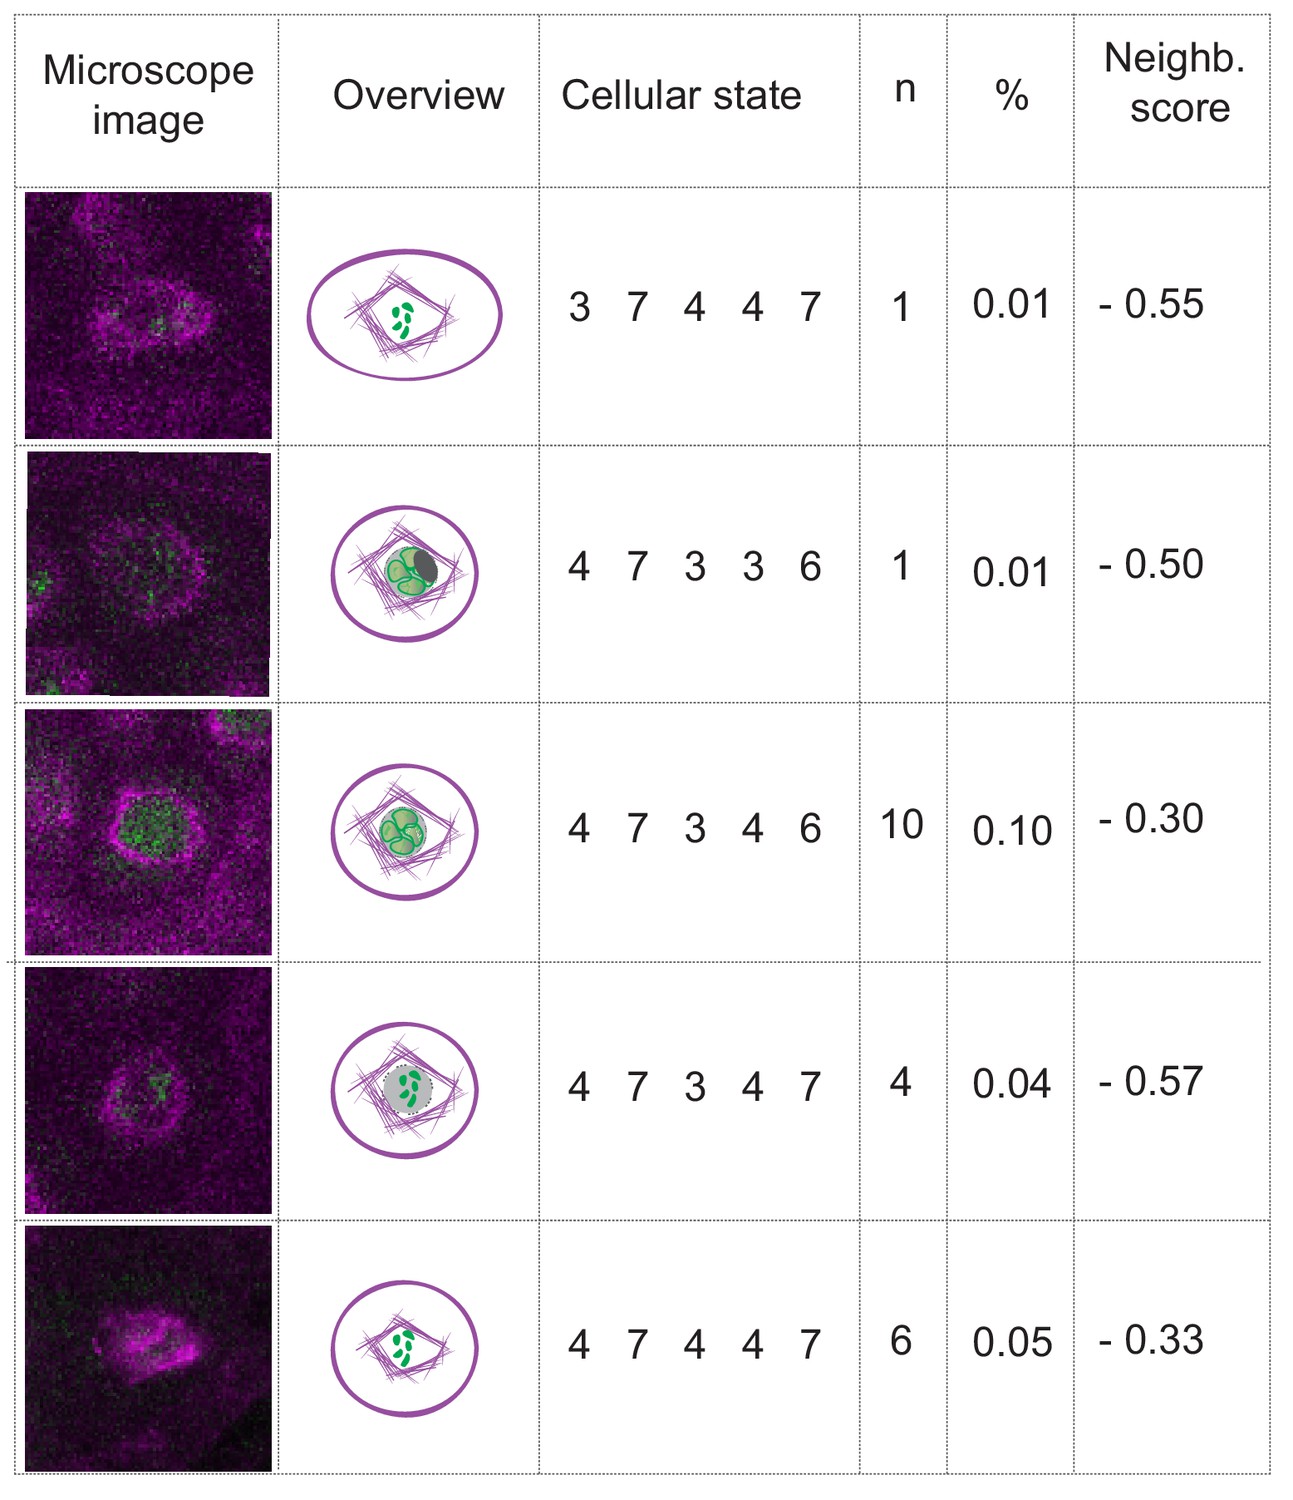
The case of nuclear envelope breakdown.
Table illustrating the different parameter states and the corresponding microscope images at the moment of nuclear envelope breakdown in WT plants. Even when the breakdown can be seen (the low number of observations is due to the short duration of the phenomenon), there is high variability of the combinations of parameter states that depict this moment. Hence, the neighboring scores are below zero, precluding the inclusion of the nuclear envelope breakdown as a landmark in this analysis.
Figure 7
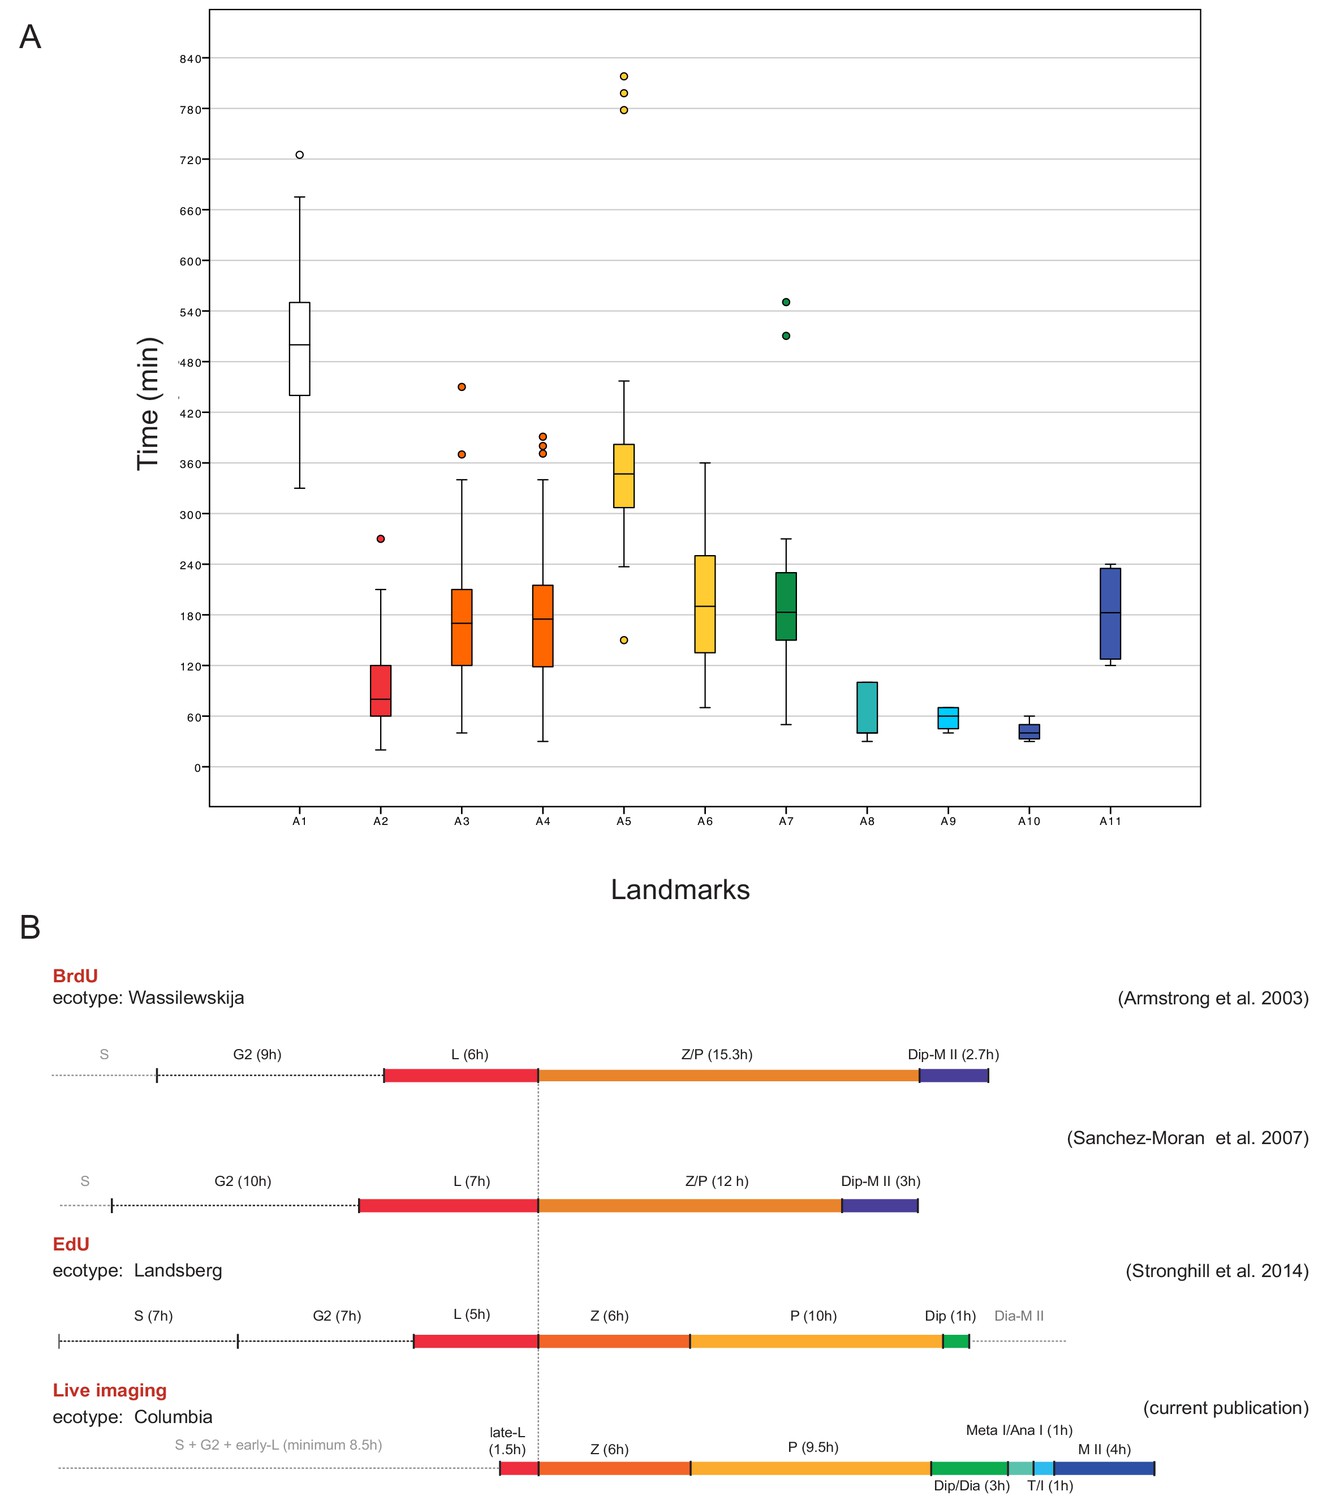
Time course of male meiosis in Arabidopsis.
(A) Box plot illustrating the duration of each landmark in minutes as observed in WT plants. Outliers are illustrated with a dot. The color code for each landmark refers to the meiotic phase: white (A1) is S-phase/G2, red (A2) is late leptotene, orange (A3, A4) is zygotene, yellow (A5, A6) is pachytene, green (A7) is diplotene/diakinesis, aquamarine (A8) is metaphase I/anaphase I, light blue (A9) is telophase/interkinesis, dark blue (A10, A11) is the second meiotic division. (B) Comparison of meiotic timelines obtained with different techniques: BrdU and EdU staining, followed by sample fixation, versus live imaging. S stands for S-phase; L for leptotene, Z for zygotene, P for pachytene, Dip for diplotene, Dia for diakinesis, Meta I/Ana I for metaphase and anaphase I, T/I for telophase and interkinesis, M II for second meiotic division. The duration of each phase is indicated in hours for all the time courses. Since the onset of zygotene can be clearly defined by previous experiments and in our live cell imaging system, it has been used here to graphically anchor this analysis.
-
Figure 7—source data 1
Table summarizing the number of samples used per each analysis and the duration of each landmark.
- https://doi.org/10.7554/eLife.42834.020
-
Figure 7—source data 2
Landmark duration in WT.
- https://doi.org/10.7554/eLife.42834.021
Figure 8
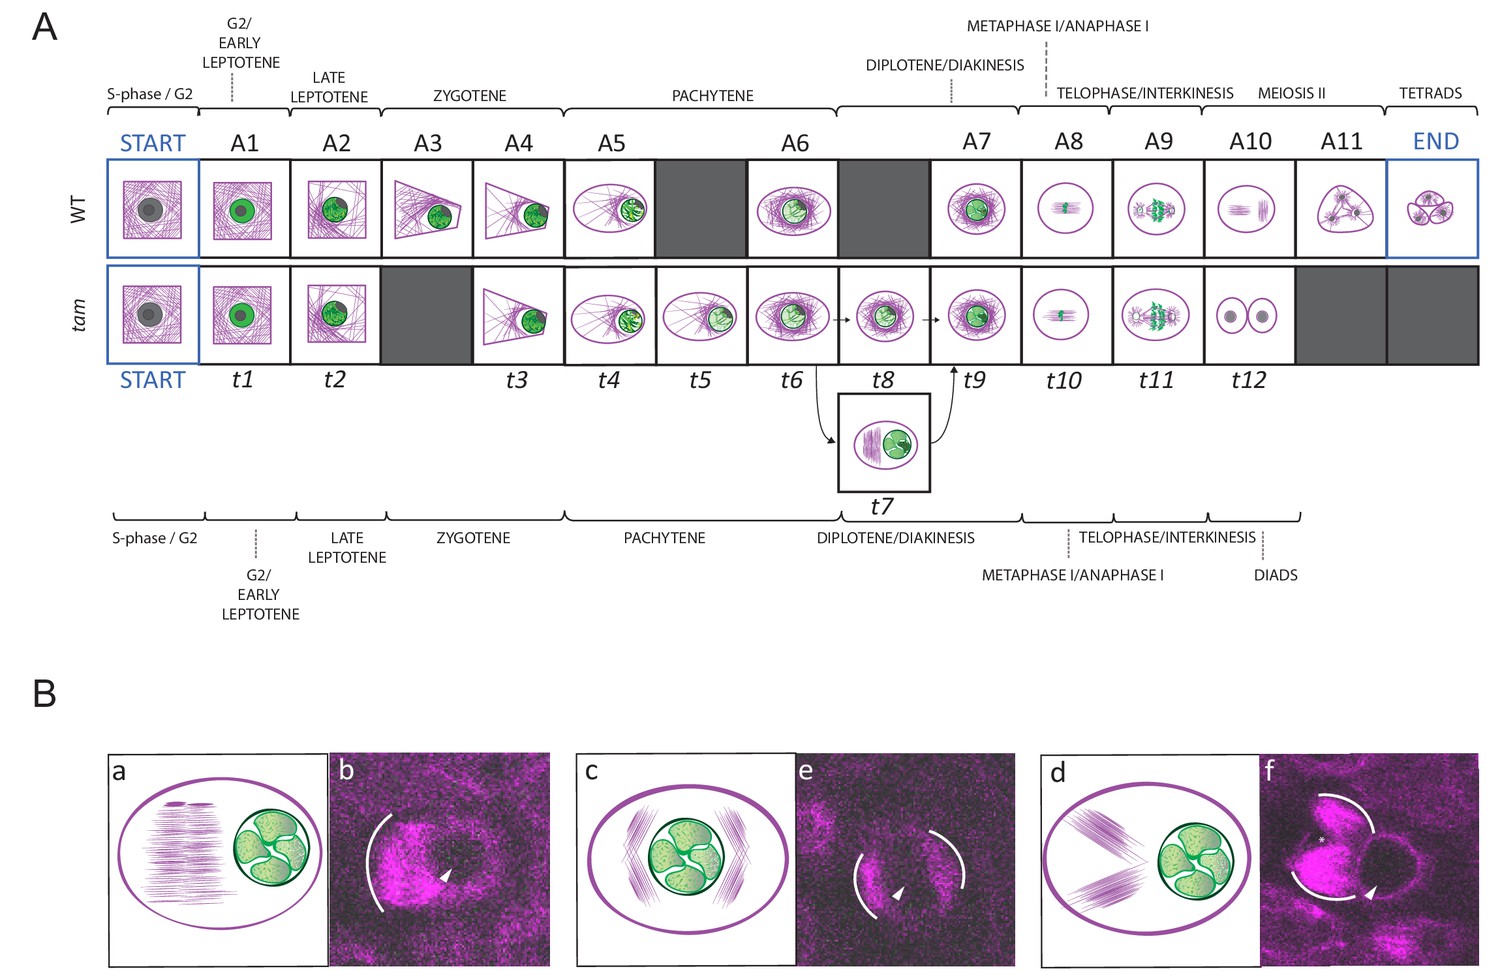
Landmark scheme of tam and MT aberrations in tam.
(A) Comparison between the landmarks identified for the meiotic progression in WT (A1 to A11) and tam (t1 to t11). Corresponding landmarks are located on the top of each other. The gray squares indicate landmarks that are observed in one genetic background only (e.g. A3 and A11 for WT, t5, t7 and t8 for tam). Landmark A9 and t11 differ in cell shape while A10 and t12, which follow A9 and t11 respectively mark the time point of premature exit from the meiotic program in tam mutants. The arrows connecting t6 to t9 via t7 or t8 show two different pathways seen in tam mutants during diplotene. (B) Schematic illustrations (a to c) and confocal pictures (d to f) of different patterns adopted by MTs at landmark t7 in tam mutants. MTs can bundle in a large phragmoplast-like structure, which develops on one side of the nucleus (a and d). Alternatively they can aggregate in multiple bundles on two opposite sides of the nucleus (b and e) or on the same side of the nucleus (c and f). In the microscopic pictures, the white arc marks the outer rim of the MT aggregations; the arrowhead points to the nucleus, and the asterisk signals the presence of a potential micronucleus.
Figure 9
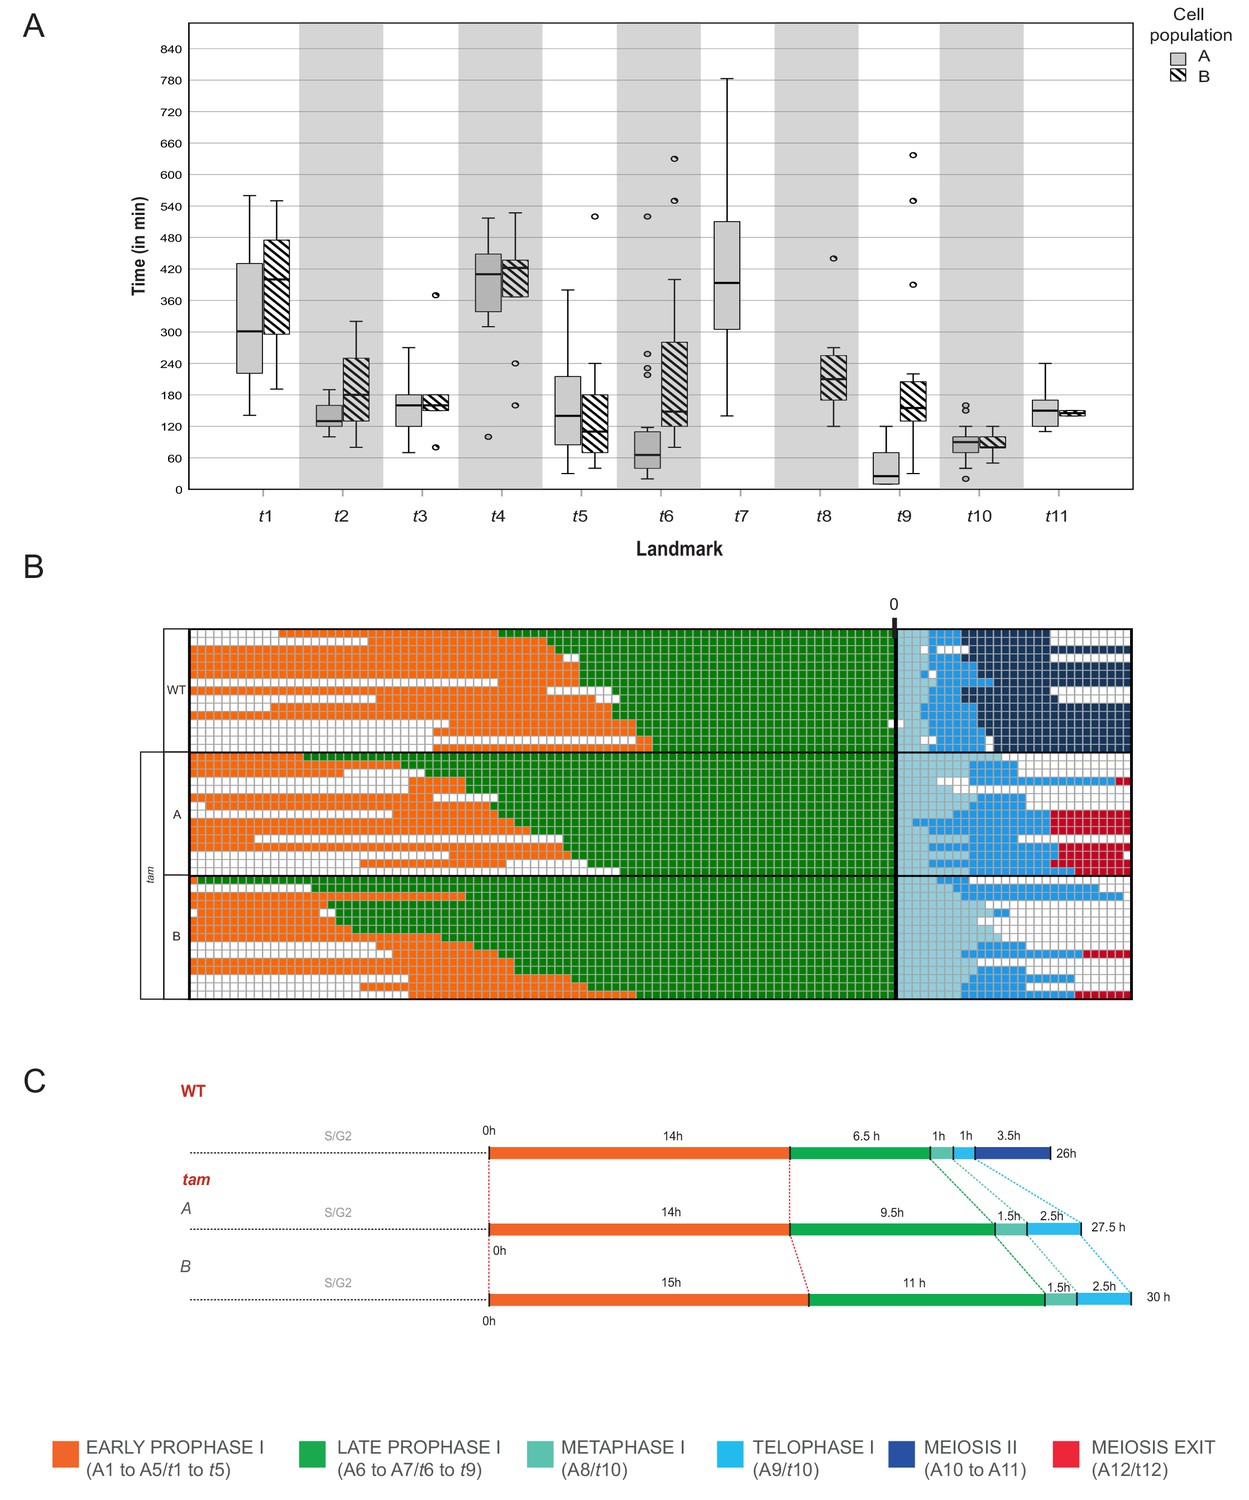
Time course of male meiosis in tam mutants.
(A) Box plot illustrating the duration of each landmark in minutes in the two populations of tam. Population A follows the pathway including landmark t7 but skipping t8 while population B switches from t6 to t8 and omits t7. Outliers are illustrated with a dot. (B) Schematic representation of the progression of meiosis from diplotene onwards in a subgroup of 45 cells (15 WT, 15 tam A, and 15 tam B) where each line represents a cell. The timing was synchronized at the onset of metaphase (A8 for WT, and t10 for tam), and each square corresponds to a 10 min time interval. The graph visualizes that tam shows a longer diplotene (green), as well as a prolonged metaphase I and telophase I (aquamarine and light blue) in comparison to the WT. No landmarks for the second meiotic division (dark blue) were observed in tam, in which cells exit meiosis (red) directly after telophase I. (C) Comparison of meiotic timelines of WT and tam. The time displayed is derived from the sum of the average durations of each single landmark as indicated below the graph.
-
Figure 9—source data 1
Landmark duration of population A, tam.
- https://doi.org/10.7554/eLife.42834.026
-
Figure 9—source data 2
Landmark duration of population B, tam.
- https://doi.org/10.7554/eLife.42834.027
Videos
Video 1
Detection of PROREC8:REC8:GFP at metaphase I –anaphase I transition.
This movie focuses on five male meiocytes at metaphase I. The PROREC8:REC8:GFP signal (in white) is seen on highly condensed chromosomes. With the onset of anaphase I, the remaining PROREC8:REC8:GFP can be seen at the centromere areas of homologs being pulled to opposite cell poles (white arrowheads at the movie reply).
Video 2
NE breakdown in WT male meiocytes at stages from diplotene to metaphase.
The instance of nuclear envelope breakdown can be seen for the majority of the cells at minute 75 and for the remaining cells at minute 80. Tubulin is highlighted in magenta; chromosomes and REC8 are in green. The movie has been acquired with 5 min interval time.
Video 3
Complete meiotic progression in WT.
Progression of meiosis in two anthers of a WT flower. Tubulin (RFP) is highlighted in magenta, chromosomes are marked by REC8 in green (GFP), chloroplasts (autofluorescence) are blue. The meiocytes, localized in the central areas of the pollen sacs, reside in a pre-meiotic stage at the beginning of the movie, and undergo a complete meiotic program with the first and the second meiotic division until the formation of tetrads. On the top left corner, there is an indication of the landmark crossed. Time is expressed in minutes; the interval between image acquisition is 10 min, with the exception of 1 time point (7 min interval between time 1130 and 1137); time 0 corresponds to the start of image acquisition, and not to the start of meiosis.
Video 4
Complete meiotic progression in tam.
Progression of meiosis in a tam anther. Tubulin (RFP) is highlighted in magenta, chromosomes are marked by REC8 in green (GFP), chloroplasts (autofluorescence) are blue. At the start of the time-lapse meiocytes are at the pre-meiotic landmark t0 (START), and they proceed through the division, until telophase I (minute 1800 to 2040, t11). After telophase I, they exit meiosis pre-maturely, leading to the formation of dyads (minute 2040 onwards). Meiosis proceed slower in tam mutant, starting from diplotene stage, where the MTs start to present aberrant phenotypes (time 1300). On the top left corner, there is an indication of the landmark crossed. Time is expressed in minutes; the interval between image acquisition is 10 min, with the exception of 1 time point (80 min interval between time 880 and 960); time 0 corresponds to the start of image acquisition, and not to the start of meiosis.
Video 5
Aberrant phenotypes in tam anthers.
Late prophase (from diplotene onwards) in two anthers of a tam flower. Tubulin (RFP) is highlighted in magenta, chromosomes are marked by REC8 in green (GFP), chloroplasts (autofluorescence) are blue. Two different cell populations can be recognized: a first population that present MT ectopic aggregations (white arrows) and eventually the formation of micronuclei (white asterisk), and a second population of cells that proceed through the phases in a WT-like manner, albeit slower. Clear premature exit form meiosis is visible in all the cells (starting form time 640). On the top left corner, there is an indication of the landmark crossed. Time is expressed in minutes; the interval between image acquisition is 10 min, time 0 corresponds to the start of image acquisition.
Tables
Key resources table
| Reagent type (species) or resource | Designation | Source or reference | Identifiers | Additional information |
|---|---|---|---|---|
| Gene (Arabidopsis thaliana) | REC8 | PMID: 11706195 | AT5G05490 | |
| Gene (Arabidopsis thaliana) | TAM | PMID: 10072401 | AT1G77390 | |
| Strain background (Arabidopsis thaliana) | WT; Wild- Type; Col0 | NASC | Nasc stock number: N1093 | |
| Genetic reagent (Arabidopsis thaliana) | rec8 | Syngenta via NASC | SAIL_807_B08; Syngenta stock name: CS874380 | |
| Genetic reagent (Arabidopsis thaliana) | tam | Syngenta via NASC | SAIL_505_C06; Syngenta stock name: CS836037, Nasc stock number: N836037 | |
| Genetic reagent (Arabidopsis thaliana) | PROREC8:REC8:GFP | this paper | plant line, Dep. Developemental biology., Hamburg Universitaet, Hamburg, Germany | |
| Genetic reagent (Arabidopsis thaliana) | PRORPS5A:TagRFP:TUB4 | this paper | plant line, Dr. Takashi Ishida, Kumamoto University, Japan | |
| Genetic reagent (Arabidopsis thaliana) | PRORPS5A:TagRFP:TUA5 | this paper | plant line, Dep. Developemental biology., Hamburg Universitaet, Hamburg, Germany | |
| Genetic reagent (Arabidopsis thaliana) | PROREC8:REC8:GFP/PRORPS5A:TagRFP:TUA5 | this paper | plant line, Dep. Developemental biology., Hamburg Universitaet, Hamburg, Germany | |
| Genetic reagent (Arabidopsis thaliana) | WT; KINGBIRD WT | this paper | plant line, Dep. Developemental biology., Hamburg Universitaet, Hamburg, Germany | |
| Genetic reagent (Arabidopsis thaliana) | tam; KINGBIRD tam | this paper | plant line, Dep. Developemental biology., Hamburg Universitaet, Hamburg, Germany | |
| Software | Metamorph version 7.8.0 (Molecular Devices) | Molecular devices | Copyright 1992–2013 Molecular Devices, LLC. | |
| Software | Fiji | PMID: 22743772 | https://imagej.net/Fiji | |
| Software | StackReg (Fiji plugin) | DOI: 10.1109/83.650848 | http://bigwww.epfl.ch/thevenaz/stackreg/ | |
| Software | Landmark analysis (Phyton script) | this paper | https://gitlab.com/wurssb/arabidopsis-thaliana---landmark-analysis | Rik Van Rosmalen, Wageningen University and Research, Wageningen, The Netherlands |
| Software | Landmark Summary Generator | this paper | https://github.com/felixseifert/LandmarkSummaryGenerator | Dr. Felix Seifert, cropSeq bioinformatics, Hamburg, Germany |
Table 1
Primers used in this study.
https://doi.org/10.7554/eLife.42834.028| Purpose | Primer name | Sequence (5'−3') |
|---|---|---|
| Genotyping | ||
| rec8 T_DNA | SAIL_LB3 | TAGCATCTGAATTTCATAACCAATCTCGATACAC |
| SAIL_807_B08-RP | GGGGGAAAAGAGAAAGGTTC | |
| rec8 WT allele | SAIL_807_B08-LP | CTCATATTCACGGTGCTCCC |
| SAIL_807_B08-RP | GGGGGAAAAGAGAAAGGTTC | |
| rec8 WT allelle in REC8:GFP | SAIL_807_B08-RP | GGGGGAAAAGAGAAAGGTTC |
| TL-gREC8-R | GAACGGAGAAGGGTAAGGCTCTTGAGTC | |
| tam T_DNA | SAIL_LB3 | TAGCATCTGAATTTCATAACCAATCTCGATACAC |
| TAM_L | CAGAAATCCTCCACTTGCG | |
| tam WT allele | TAM_U | GACTTGATGGATCCACAGC |
| TAM_L | CAGAAATCCTCCACTTGCG | |
| Cloning of PROREC8:REC8:GFP | ||
| REC8 genome | AT5G05490-F | CACCCCAGCCAAGACATTGTGATCTTCAAC |
| REC8 genome | AT5G05490-R | TGTGTGATTCAGGGGTAAGAAATATGCG |
| SmaI | REC8 CterSmaI-F | GGGTAAGGTTTGATTTCTAAATTA |
| SmaI | REC8 CterSmaI-R | GGGCATGTTGGGTCCTCTTGCAAT |
| locus of insertion of gREC8-GFP | gREC8-GFP_LP | GAATATTACCTTGCCATAGGCTTG |
| attB1r REC8ter-R | GGGGACTGCTTTTTTGTACAAACTTGTGTGTGATTCAGGGTAAGAAA | |
| attB4 REC8_2ndI-F | GGGGACAACTTTGTATAGAAAAGTTAATCAACTCAATTCCCTGTG | |
| attB1r REC8_2ndI-R | GGGGACTGCTTTTTTGTACAAACTTGGCAAAGAGATAAAACCACGC | |
| REC8 2nd intron-F | GCCGCCCCCTTCACCGTAATCAACTCAATTCCCTG | |
| REC8 2nd intron-R | TTCGAATTCCGTTACCTGCAAAGAGATAAAACCAC | |
| Vector for REC8 2I-F | CTCTTTGCAGGTAACGGAATTCGAAATTTA | |
| Vector for REC8 2I-R | AGTTGATTACGGTGAAGGGGGCGGCCGCGG | |
| Cloning of PROREC8:REC8:GFP/TagRFP:PRORPSA5:TUA5 | ||
| attB4 TUA5-F | GGGGACAACTTTGTATAGAAAAGTTTTGATTCGCTATTTGCAGTGCAC | |
| attB1r TUA5-R | GGGGACTGCTTTTTTGTACAAACTTGTGTGTGATTCAGGGGTAAGAAA | |
Additional files
-
Transparent reporting form
- https://doi.org/10.7554/eLife.42834.029
Download links
A two-part list of links to download the article, or parts of the article, in various formats.
Downloads (link to download the article as PDF)
Open citations (links to open the citations from this article in various online reference manager services)
Cite this article (links to download the citations from this article in formats compatible with various reference manager tools)
Live cell imaging of meiosis in Arabidopsis thaliana
eLife 8:e42834.
https://doi.org/10.7554/eLife.42834


