Yap1 promotes sprouting and proliferation of lymphatic progenitors downstream of Vegfc in the zebrafish trunk
- The University of Queensland, Australia
- National Cerebral and Cardiovascular Centre Research Institute, Japan
- Peter MacCallum Cancer Centre, Australia
- University of Melbourne, Australia
- University of South Australia, SA Pathology, Australia
- Uppsala University, Sweden
Abstract
Lymphatic vascular development involves specification of lymphatic endothelial progenitors that subsequently undergo sprouting, proliferation and tissue growth to form a complex second vasculature. The Hippo pathway and effectors Yap and Taz control organ growth and regulate morphogenesis and cellular proliferation. Yap and Taz control angiogenesis but a role in lymphangiogenesis remains to be fully elucidated. Here we show that YAP displays dynamic changes in lymphatic progenitors and Yap1 is essential for lymphatic vascular development in zebrafish. Maternal and Zygotic (MZ) yap1 mutants show normal specification of lymphatic progenitors, abnormal cellular sprouting and reduced numbers of lymphatic progenitors emerging from the cardinal vein during lymphangiogenesis. Furthermore, Yap1 is indispensable for Vegfc-induced proliferation in a transgenic model of Vegfc overexpression. Paracrine Vegfc-signalling ultimately increases nuclear YAP in lymphatic progenitors to control lymphatic development. We thus identify a role for Yap in lymphangiogenesis, acting downstream of Vegfc to promote expansion of this vascular lineage.
https://doi.org/10.7554/eLife.42881.001Introduction
During embryonic development, the lymphatic vascular network derives chiefly from pre-existing veins. In the E9-9.5 mouse embryo, complex, multicellular lymphatic vessels are ultimately generated from a limited pool of lymphatic endothelial cell (LEC) progenitors first specified along the cardinal veins (Oliver and Srinivasan, 2010; Wigle and Oliver, 1999). LEC progenitors sprout and progressively colonise embryonic tissues over developmental time (Hägerling et al., 2013; Koltowska et al., 2013). In the zebrafish trunk, a complex lymphatic vasculature is established within just a few days and from a very limited number of progenitors (Koltowska et al., 2015a; Nicenboim et al., 2015; Shin et al., 2016). Beginning from around 32–34 hr post fertilisation (hpf), lymphangiogenesis generates a functional lymphatic network by 5 days post fertilisation (dpf) (Hogan and Schulte-Merker, 2017). To allow this rapid development, multiple molecular pathways have to instruct and orchestrate cellular behaviour as well as control the growth and proliferation of the developing tissue.
Precursor cells in the cardinal vein obtain lymphatic identity upon induction of Prox1 expression, a transcription factor that is essential for development of LECs in both mice and zebrafish (Johnson et al., 2008; Koltowska et al., 2015a; Wigle and Oliver, 1999). Sprouting of LECs from the cardinal veins is governed by Vegfc signalling acting through the endothelial receptor Vegfr3 (Flt4) in both mice and zebrafish (Hogan et al., 2009b; Karkkainen et al., 2004; Le Guen et al., 2014; Veikkola et al., 2001; Villefranc et al., 2013). Zebrafish Vegfc and Vegfd also play partially compensatory roles in both trunk and craniofacial lymphangiogenesis (Astin et al., 2014; Bower et al., 2017). Underlining the conservation of this pathway in lymphangiogenesis, mutations in VEGFC and VEGFR3 cause primary lymphedema in humans (Gordon et al., 2013; Irrthum et al., 2000; Karkkainen et al., 2000). Ultimately, induction of Vegfr3 signalling in LECs by Vegfc triggers the activation of multiple downstream intracellular signalling events involved in cell migration, survival and cellular proliferation (Deng et al., 2015; Zheng et al., 2014). In the zebrafish, Vegfc-Flt4 signalling acts to induce Prox1 expression at the earliest stages of lymphatic specification (Koltowska et al., 2015a; Shin et al., 2016), although a role in specification remains to be fully explored in the mouse model. Precisely how LECs contextually interpret growth factor signals and elicit a number of different, specific cellular responses still remains to be fully understood.
Key regulators of normal and pathological organ and tissue growth are the Hippo pathway and effector transcription factors, YAP and TAZ, which have been shown to promote proliferation, suppress apoptosis and modulate cellular and tissue morphogenesis (Harvey et al., 2013). YAP and its paralogue TAZ are transcriptional co-factors that drive target gene expression by binding to the TEAD1-4 transcriptional co-factors (Pobbati and Hong, 2013; Yu and Guan, 2013; Yu et al., 2015). As potent drivers of cell proliferation, YAP and TAZ have been implicated as oncogenes that are commonly upregulated in various cancer types including colon and breast cancer (Harvey et al., 2013; Varelas, 2014). Thus, their activity has to be tightly regulated. The classical HIPPO pathway inhibits YAP/TAZ signalling by retaining the effectors in the cytoplasm through the activation of a phosphorylation cascade. The kinase MST1/2 phosphorylates another kinase LATS1/2, which subsequently phosphorylates YAP/TAZ. This phosphorylation sequesters YAP/TAZ in the cytoplasm and leads to their degradation (Yu and Guan, 2013; Yu et al., 2015). Ultimately, YAP and TAZ function in the cytoplasm, at cell-cell junctions and in the nucleus as core integrators of extracellular stimuli such as growth factor signalling, mechanical forces and cellular adhesion (Panciera et al., 2017; Varelas, 2014).
Recent studies have demonstrated that YAP and TAZ play important roles in vasculature (Kim et al., 2017; Neto et al., 2018; Wang et al., 2017). While Yap knockout mice are lethal due to developmental arrest of the embryo and severe defects in the yolk sac vasculature (Morin-Kensicki et al., 2006), endothelial specific deletion of Yap and Taz leads to vascular defects due to impaired EC sprouting and proliferation (Kim et al., 2017; Neto et al., 2018). In endothelial cells (ECs), nuclear YAP/TAZ promotes proliferation and cell survival while retention of YAP/TAZ in the cytoplasm leads to apoptosis (Panciera et al., 2017; Zhao et al., 2011). Moreover, it has been suggested that YAP/TAZ in blood vascular ECs regulate angiogenesis downstream of VEGFA both by modulating cellular proliferation and controlling adherens junctional dynamics during vessel morphogenesis (Neto et al., 2018; Wang et al., 2017). Roles for Yap and Taz have been recently shown in lymphatic vessel morphogenesis in development and postnatal settings in mice, but the mechanisms of action remain to be fully appreciated (Cho et al., 2019). YAP has further been found to respond to altered flow patterns in zebrafish and in cultured blood and lymphatic ECs (Nakajima et al., 2017; Sabine et al., 2015). Yap1 also contributes to blood vessel maintenance in zebrafish, although blood vessels still undergo normal angiogenesis in zebrafish yap1 mutant models (Nakajima et al., 2017). Despite important roles in the vasculature, in the context of early embryonic lymphatic vascular development, roles for Yap and Taz remain to be fully explored.
Here we utilise zebrafish mutants and live imaging of zebrafish reporters of YAP activity to show that Yap1 is indispensable for lymphatic vascular development. Yap1 acts in a cell autonomous manner and is necessary at stages of lymphangiogenesis driven by Vegfc/Flt4 signalling. However, unlike mutants in the Vegfc/Flt4 pathway Yap1 mutants display normal specification of Prox1-positive lymphatic progenitors coincident with aberrant cellular behaviours during LEC sprouting. We identify a central role for Yap1 in Vegfc-induced EC proliferation and show that the nuclear concentration of YAP changes dynamically in lymphatic progenitors, driven by Vegfc. This work suggests a dynamic signalling mechanism integrating Vegfc/Flt4 signalling with Yap1 control of LEC proliferation and cellular behaviour during trunk lymphatic vascular development.
Results
YAP is active in developing lymphatics of the zebrafish trunk
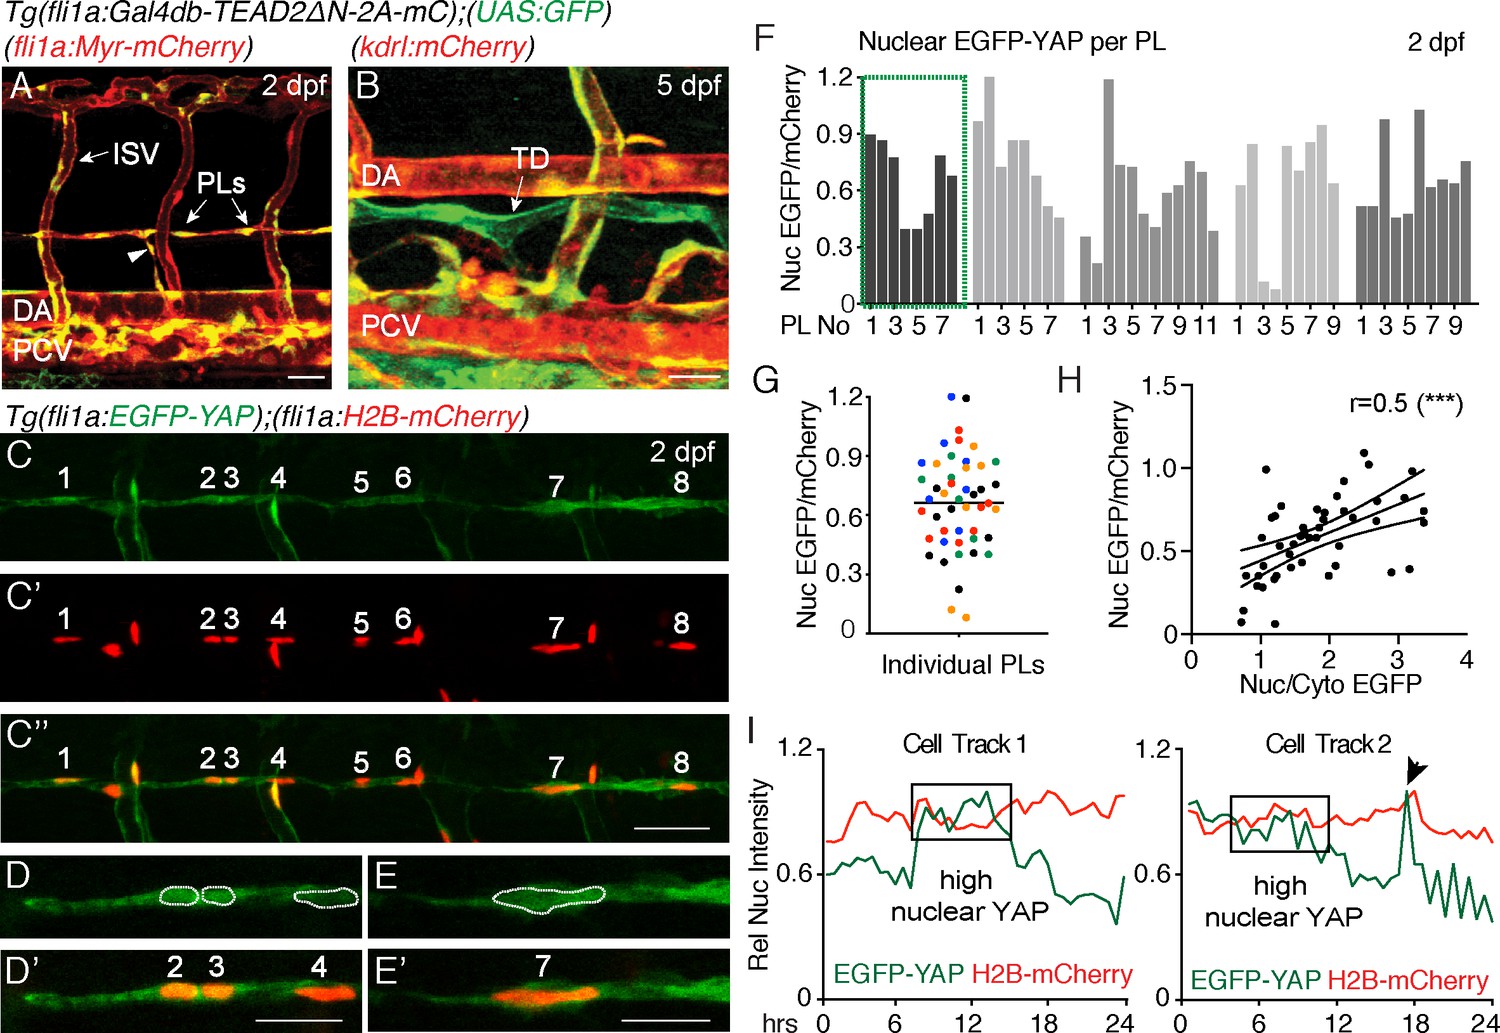
To investigate whether zebrafish LEC progenitors display Yap1/Taz signalling, we made use of the previously published transgenic line, Tg(fli1:Gal4db-TEAD2DN-2A-mCherry); Tg(UAS:GFP), hereafter called the TEAD reporter (Nakajima et al., 2017). This line reports expression when active, endogenous Yap1 binds to the synthetic TEAD-Gal4db protein and subsequently drives EGFP expression from a UAS element. Expression was detected throughout the dorsal aorta (DA), the intersegmental vessels (ISVs) and PCV at 30 hpf, parachordal LEC progenitors (PLs, 2 dpf) and the thoracic duct at 5 dpf (Figure 1A,B, Video 1).
Figure 1 with 1 supplement see all
Nuclear EGFP-YAP changes dynamically in the developing trunk lymphatic vasculature.
(A–B) The TEAD reporter line [Tg(fli1:Gal4db-TEAD2ΔN-2A-mC);(UAS:GFP)] shows Yap1 activity in vasculature, parachordal LECs (PLs) and cardinal vein sprouts (arrowhead) of the 2 dpf trunk (A) as well as in the thoracic duct (TD) at 5 dpf (B). Scale bars: 40 μm. (C) Maximum projection of 8 PLs in a two dpf embryo showing EGFP-YAP in green [Tg(fli1:EGFP-YAP)] and the nucleus in red (C’), [Tg(flil:H2B-mCherry)] and merge (C”’). Scale bar: 25 μm. (D–E) High power single z-sections of selected PLs from C, showing nuclear YAP in PL2 and PL3, but low nuclear YAP in PL4 (D–D’) and PL7 (E–E’). Scale bars: 10 μm. (F) Quantification of nuclear EGFP/mCherry average pixel intensity across individual PLs from multiple embryos at 2 dpf. Each bar represents a single PL (n = 47), each grey shade a different embryo (n = 5). PLs in (C and D) highlighted in the green box. EGFP/mCherry Ratios have been calculated using mean fluorescent intensities in 3D. (G) Scatter Plot of the Nuclear EGFP/mCherry average pixel intensity for individual PLs (n = 5 embryos). Each colour indicates PLs from a different embryo. Values calculated in 3D measurements of the mean fluorescent intensity for EGFP and mCherry (0.66 ± 0.04, n = 47). (H) Pearson Correlation Plot of the Nuclear EGFP/mCherry Ratio values in F and the Nuclear/Cytoplasmic EGFP Ratio values in Figure 1—figure supplement 1B (r = 0.52, 95% confidence intervals: 0.27 to 0.70, R square = 0.27, p=0.0002(***)). The two distinct approaches produce correlative measurements. (I) Average nuclear pixel intensity graphs from cell tracks of single PLs time-lapse imaged from 2 to 3 dpf. EGFP-YAP intensity (green) is compared over time with H2B-mCherry (red) intensity in individual nuclei. Arrow points to a cell division during time-lapse.
-
Figure 1—source data 1
Measurements of EGFP-YAP in PLs.
- https://doi.org/10.7554/eLife.42881.005
Video 1
Time-lapse Video of the developing trunk vasculature of Tg(fli1:Gal4db-TEAD2ΔN-2A-mC);(UAS:GFP)] from 30 hpf – 2 dpf.
The EGFP signal can be seen to diminish in major trunk blood vessels but remains strong in the dorsal posterior cardinal vein (PCV) and parachordal LECs (PLs).
TEAD-reporter activity is observed via a stable EGFP protein, thus does not accurately report dynamic activity of Yap1. Hence, we used Tg(fli1a:EGFP-YAP);(fli1a:H2B-mCherry) (Nakajima et al., 2017), hereafter referred to as the YAP reporter line, which expresses human YAP fused to EGFP in zebrafish vasculature. YAP is regulated at the level of entry into the nucleus and EGFP-YAP used here has been shown to accurately reflect endogenous YAP (Bao et al., 2011; Nakajima et al., 2017). We analysed EGFP-YAP fluorescence intensity (average pixel intensity per nucleus) in the nuclei of PLs relative to the intensity of nuclear H2B-mCherry in the same cells using two different methods (Figure 1C–G, see Materials and methods for details). Firstly, the EGFP/mCherry fluorescence intensity ratio was calculated in 3D, using automated surface masking of the nucleus and measuring the intensities for both channels spanning the full z-stack (Figure 1F and G). Secondly, fluorescence intensity was extracted from a single Z-plane (2D) at the centre of each nucleus (Figure 1—figure supplement 1A and D). Both approaches revealed concordant results (Figure 1—figure supplement 1E). We found nuclear EGFP-YAP in PL nuclei that was highly variable between PLs within the same embryo (relative to H2B-mCherry), despite both proteins being driven from the fli1a promoter (Figure 1C–G). Furthermore, we estimated the nuclear to cytoplasmic ratios for EGFP-YAP between PLs (for the same embryos quantified in Figure 1F). We found that differences in the nuclear concentration of EGFP-YAP between PLs (calculated as nuclear EGFP-YAP/mCherry) correlated with differences in the nuclear-cytoplasmic ratio of EGFP-YAP (Figure 1H and Figure 1—figure supplement 1B–C). This suggests that measurement of nuclear concentration can reflect and serve as a proxy for cytoplasm-nuclear changes. Given the above findings, the variable nature of EC cytoplasmic distribution, and relative accuracy of nuclear measurements, all further analyses use changes in nuclear concentration as a proxy for changes in YAP activity.
Interestingly, when we measured nuclear EGFP-YAP intensities using high speed spinning disc microscopy, we found that EGFP-YAP did not change or fluctuate rapidly over short developmental time periods (imaged over 90 min of development) (Figure 1—figure supplement 1F–F”, Video 2). However, quantification of nuclear EGFP-YAP levels in individual PLs over longer periods of development revealed dynamic changes (Video 3, Figure 1I, Figure 1—figure supplement 1G). Detailed cell tracking analyses showed that these changes were not associated simply with breakdown of the nuclear lamina during cell division (Figure 1I (arrow in cell track two indicates a cell division), Figure 1—figure supplement 1G). Taken together, these observations suggest that YAP is dynamically regulated in PLs during lymphatic development.
Video 2
High-speed time-lapse Video of the developing parachordal LECs (PLs) in [Tg(fli1a:EGFP-YAP),(fli1a:H2B-mCherry)] embryos from 2 dpf.
EGFP-YAP signal remains relatively stable over the imaged time period of 90 min. Z-stacks were acquired every minute. Fluorescence intensity of EGFP diminishes due to mild bleaching over time. The right panel shows the EGFP fluorescent intensity as a heatmap within the PL nuclei.
Video 3
Time-lapse Video of developing parachordal LECs (PLs) in [Tg(fli1a:EGFP-YAP),(fli1a:H2B-mCherry)] embryos from 2 to 3 dpf with images acquired in 20–22 min intervals.
The EGFP-YAP signal in individual PLs changes over time as shown in the lower panel displaying a heatmap of the nuclei. Dorsal aorta (DA), posterior cardinal vein (PCV).
Yap1 cell autonomously regulates lymphangiogenesis in the zebrafish trunk
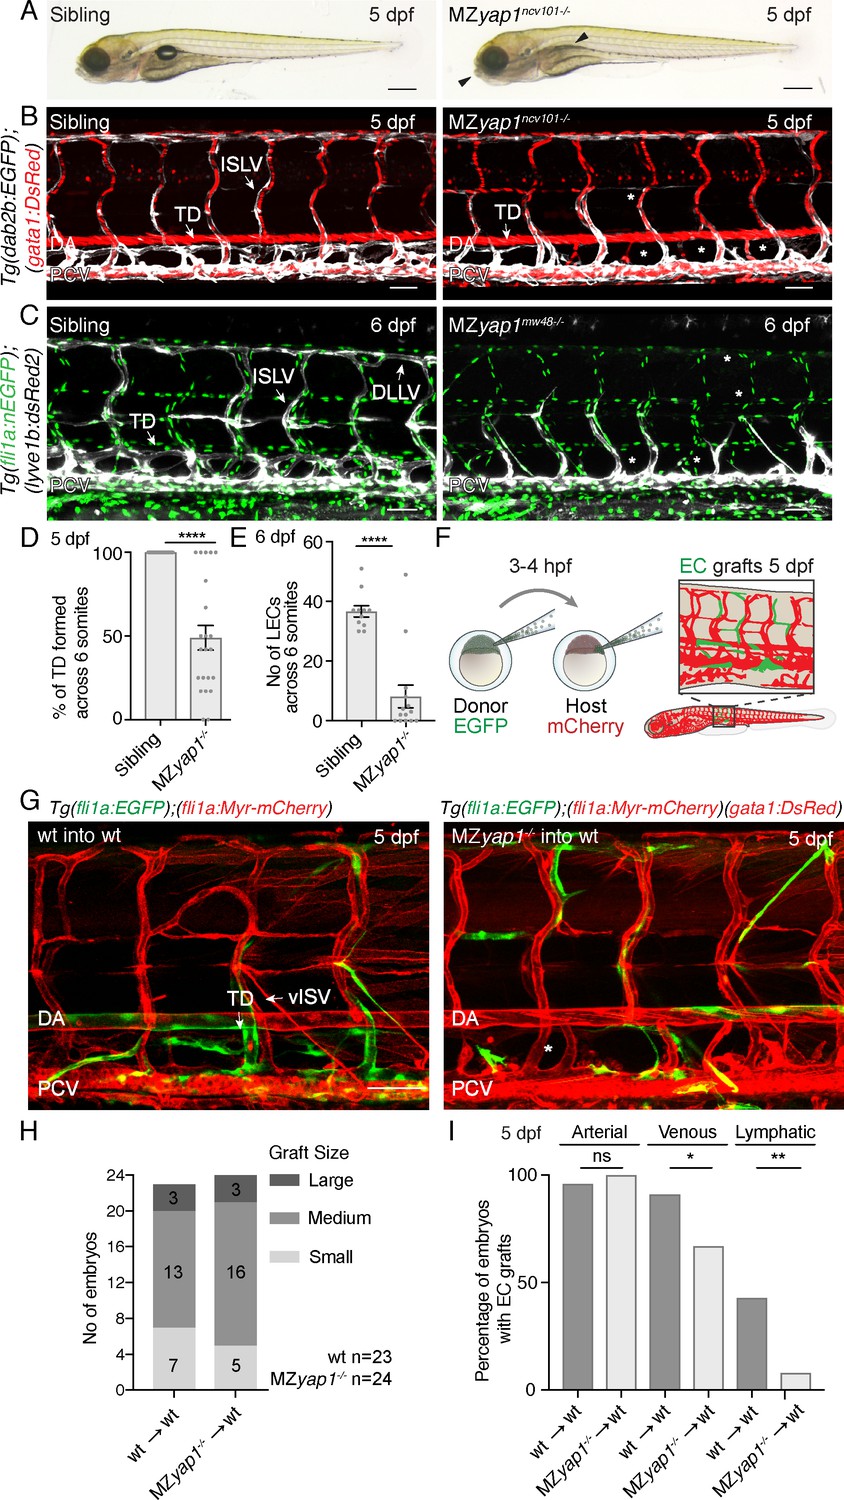
We next examined the formation of the lymphatic vasculature in yap1 mutants. We analysed two different mutant strains: yap1ncv101-/- mutants have a 25 bp deletion in exon1 leading to a frame shift and stop codon after 71 bp, prior to the TEAD binding domain (Nakajima et al., 2017) and yap1mw48-/- mutants display a 4 bp deletion after 158 bp, truncating the TEAD binding domain and leading to a premature stop codon (Miesfeld et al., 2015). Analysis of the two alleles revealed equivalent phenotypes. Yap1 is maternally deposited and zygotic yap1 mutants (Zyap1-/-) are viable (Cox et al., 2016). Using transgenic lines to visualise developing veins and lymphatics (TgBAC(dab2b:EGFP)ncv67, Tg(kdrl:mCherry)ncv502), we observed only subtle lymphatic defects in Zyap1ncv101-/- mutants with a minor reduction in thoracic duct formation (Figure 2—figure supplement 1A,C). To completely deplete the embryo of Yap1, we generated maternal zygotic (MZyap1-/-) mutants in several transgenic backgrounds by crossing heterozygous males to homozygous mutant females. Strikingly, while the overall morphology of MZyap1-/- mutants at 5 dpf appeared relatively normal with mutant embryos displaying subtle craniofacial defects and a missing swim bladder (Figure 2A), MZyap1-/- mutants failed to form a mature trunk lymphatic vasculature (Figure 2B–E). However, the craniofacial lymphatic network had developed normally (Figure 2—figure supplement 1B, D) and blood flow remained intact and functional with apparently normal morphology of blood vessels in the 5 dpf trunk (Figure 2B–C). To further investigate whether the MZyap1-/- mutants displayed any abnormalities in the formation of the blood vasculature, we analysed angiogenic sprouting at 24 and 32 hpf (Figure 2—figure supplement 2). Compared with wildtype siblings, MZyap1-/- mutants had a transient, mild reduction in the number of EC nuclei in intersegmental vessel (ISV) sprouts (Figure 2—figure supplement 2A,D,E), prominent in the most posterior sprouts analysed (Figure 2—figure supplement 2F) at 24 hpf. However, the number of ECs in each vessel had largely recovered by 32 hpf (Figure 2—figure supplement 2B,D,E,F). Furthermore, we could see normal lumenisation of blood vessels in MZyap1-/- mutants (Figure 2—figure supplement 2C).
Figure 2 with 2 supplements see all
Yap1 acts cell autonomously to control trunk lymphangiogenesis in zebrafish.
(A) Overall morphology of sibling (left) and MZyap1ncv101-/- mutant (right) at 5 dpf. Arrowheads indicate mild craniofacial defects and absent swim bladder. Scale bar 200 μm. (B–C) Trunk vasculature of sibling and MZyap1ncv101-/- mutant embryos at 5 dpf. Veins and lymphatics are displayed in white [Tg(dab2b:EGFP)], erythrocytes show normal blood flow in red [Tg(gata1:DsRed)]. Asterisks mark absent lymphatic vessels. (C) Trunk vasculature of sibling and MZyap1mw48-/- mutant at 6 dpf. Vascular nuclei are marked in green [Tg(fli1a:nEGFP)], venous and lymphatic vessels in white [Tg(−5.2lyve1b:DsRed)]. Asterisks indicate absent lymphatic vessels. Scale bars: 50 μm in B and C. (D) Percentage of TD fragments formed per somite, scored across six somites in total for siblings and MZyap1ncv101-/-mutants at 5 dpf (sibling: 100% ± 0, n = 23; MZyap1ncv101-/-: 49% ± 7.33, n = 22; p,0.0001). (E) Quantification of the total number of LECs across 6 somites at 6 dpf (sibling: 37 ± 1.91, n = 11; MZyap1mw48-/-: 8 ± 3.79; p<0.0001). (F) Schematic showing the cell transplantation technique. Blastomere cells are transplanted from donor (EGFP) into host (mCherry) embryos. This results in a chimeric host embryo (right) with randomly located, transplanted EC grafts. (G) Representative images of host chimeric trunk vessels at 5 dpf. Wildtype (wt) donor ECs contribute to all vascular EC types, while MZyap1ncv101-/- mutant ECs show reduced propensity to contribute to lymphatic structures. Asterisk marks missing TD. Scale bars: 50 μm. (H) Graft sizes analysed for vascular grafts. Numbers within bars represent the number of embryos scored for each graft size. (I) Percentage of embryos with EC grafts contributing to arterial (wt into wt: 96% ± 4; MZyap1ncv101-/- into wt: 100% ± 0; p=0.31, not significant (ns)), venous (wt into wt: 91% ± 6; MZyap1ncv101-/- into wt: 67% ± 10; p=0.04 (*)) and lymphatic vessels (wt into wt: 43% ± 10; MZyap1ncv101-/- into wt: 8% ± 6; p=0.005 (**)). Wildtype into wildtype total number of EC grafts: n = 23; MZyap1ncv101-/- mutant into wildtype total number of EC grafts: n = 24. Dorsal aorta (DA); Posterior Cardinal Vein (PCV); Thoracic Duct (TD); Intersegmental Lymphatic vessel (ISLV), Dorsal Longitudinal Lymphatic vessel (DLLV).
-
Figure 2—source data 1
Measurements for the lymphatic phenotype of the MZyap1-/-mutant.
- https://doi.org/10.7554/eLife.42881.014
The above observations indicate that yap1 is necessary to form a lymphatic vasculature, but not blood vasculature. To test whether Yap1 function is cell autonomous in ECs, we next transplanted wildtype or mutant Tg(fli1a:EGFP) ECs into wildtype or mutant Tg(fli1a:myrmCherry) hosts (Figure 2F–G). Subsequently, we selected embryos with EC grafts and scored grafts of similar size (Figure 2H). We scored the contribution of ECs in vascular grafted embryos to arterial, venous and lymphatic vessels (Figure 2I). Across n = 23 wildtype EC grafts, ECs contributed to arterial and venous structures as well as to lymphatic vessels at frequencies equivalent to those we have previously reported (Koltowska et al., 2015b). Across n = 24 mutant EC grafts, MZyap1-/- mutant ECs were able to form arterial grafts at frequencies comparable to wildtype EC grafts. However, MZyap1-/- mutant ECs formed venous grafts at a slightly reduced frequency and failed to contribute to lymphatic vessels except for small numbers of cells in just n = 2/24 transplanted embryos (compared with n = 10/23 robust contributions in embryos transplanted with WT cells) (Figure 2G–I). Overall, this indicates that Yap1 has a cell autonomous role in trunk lymphangiogenesis.
Yap1 is dispensable for specification but essential for sprouting and Vegfc-induced proliferation of LECs
LEC progenitors sprout from the PCV in a Vegfc/Flt4 dependent manner and colonise the HM transiently, a period when they are highly proliferative as well as migratory (Bussmann et al., 2010; Cha et al., 2012; Koltowska et al., 2015a; Yaniv et al., 2006). We scored MZyap1-/- mutants for ECs sprouting from the PCV at 2 dpf and found a reduction in the total number of ECs departing the vein (Figure 3A–B). Strikingly, we saw almost a complete loss of PLs, but near normal numbers of ECs in venous intersegmental blood vessels (Figure 3A,C,D). By 3 dpf, PL numbers in the HM remained reduced but showed recovery compared with sibling controls (Figure 3E). To investigate whether this reduction in PL numbers is a result of reduced LEC progenitor specification, we examined Prox1 expression as a marker of LEC fate. We found that Prox1 expression in the PCV and LECs departing the PCV was unchanged at 36 hpf (Figure 3F,G). Thus, Yap1 is not required for the induction of lymphatic identity but is needed to establish normal numbers of LECs in sprouts arising from the PCV.
Figure 3

MZyap1-/- mutants display defects in LEC numbers but not specification.
(A) Trunk vasculature (EC nuclei in green, veins and lymphatics in white) of sibling and MZyap1mw48-/- mutant at 2 dpf. Arrowheads indicate posterior cardinal vein (PCV) sprouts. Asterisks mark absent parachordal LECs (PLs). Dorsal aorta (DA). Scale bars: 50 μm. (B) Total number of lyve1-positive ECs departing the PCV across 6 somites at 2 dpf. (C) Number of endothelial cells in venous intersegmental vessels (vISV) across 6 somites at 2 dpf (sibling: 13 ± 0.94, n = 14; MZyap1-/-: 12 ± 1.33, n = 14; p=0.24 (ns)). (D) Number of PLs scored across 6 somites at 2 dpf (sibling: 3 ± 0.56, n = 14; MZyap1-/-: 0.36 ± 0.23, n = 14; p<0.0001 (****)). (E) Number of PLs scored across 6 somites at 3 dpf (sibling: 4.5 ± 0.20, n = 14; MZyap1-/-: 3.31 ± 0.36, n = 13; p=0.0075(**)). (F) Immunofluorescence staining for EC nuclei (green) and Prox1 (red) in sibling and MZyap1mw48-/- mutants at 36 hpf. Arrows point to Prox1+ LEC progenitors. Scale bars: 30 μm. (G) Quantification of Prox1 +cells in PCV and CV sprouts scored across 6 somites at 36 hpf (sibling: 3.47 ± 0.65, n = 19; MZyap1-/-: 3.31 ± 0.61, n = 16; p=0.86 (ns)). (H) Maximum projection stills from time-lapse Videos from 32 to 65 hpf. Sibling still images show normal lymphangiogenesis with PCV sprouts, PL formation, sprout detachment and PL proliferation (upper panels). MZyap1mw48-/- mutant one displays abnormal sprouting and looping of PCV sprouts that are retained until the end of the Video (central panels). MZyap1mw48-/- mutant two also exhibits abnormal sprouting and PCV loop formation but also forms PLs (lower panels). Scale bars: 25 μm. Timelapse imaging began at 32 hpf.
-
Figure 3—source data 1
Cell counts for PCV-derived cells in the MZyap-/- mutants.
- https://doi.org/10.7554/eLife.42881.016
To further investigate the cellular behaviours controlled by Yap1, we performed time-lapse imaging from 32 to 65 hpf. We visualised sprouting LECs using Tg(lyve1b:dsRed2; fli1a:nlsEGFP), which at these stages spans the period of first detection of dsRed2 expression (Figure 3H, Videos 4–6). We observed striking abnormal behaviours of sprouts arising from the PCV in MZyap1-/- mutants, most commonly sprouts appeared thickened, retracted, or turned ventrally and formed abnormal loops (Video 5, mutant 1). Often venous sprouts formed abnormal connections with other venous sprouts from adjacent body segments (Video 6, mutant 2). These abnormal behaviours and reduced sprouting cell numbers likely contribute to fewer PLs accurately seeding the HM during development.
Video 4
Time-lapse Video of the trunk vasculature of a sibling from 32 to 65 hpf in the [Tg(fli1a:nEGFP);(−5.2lyve1b:DsRed2)] background showing endothelial nuclei in green and lymphatic and venous endothelium in red.
Normal lymphangiogenesis involves sprouting from the posterior cardinal vein (PCV) to form PLs at the horizontal myoseptum. Dorsal aorta (DA). Scale bar: 25 μm.
Video 5
Time-lapse Video of MZyap1mw48-/- mutant 1 from 32 to 65 hpf with endothelial nuclei in green and lymphatic and venous endothelium in red.
Abnormal sprouts emerge from the posterior cardinal vein (PCV). Dorsal aorta (DA). Scale bar: 25 μm.
Video 6
Time-lapse Video of the trunk vasculature in MZyap1mw48-/- mutant 2 from 32 to 65 hpf, showing endothelial nuclei in green and lymphatic and venous endothelium in red.
Abnormal sprouts emerge from the posterior cardinal vein (PCV) anddisplaying loops as well as fusions with adjacent sprouts. Dorsal aorta (DA). Scale bar: 25 μm.
Yap1 mediates Vegfc-driven proliferation in venous-derived endothelial cells
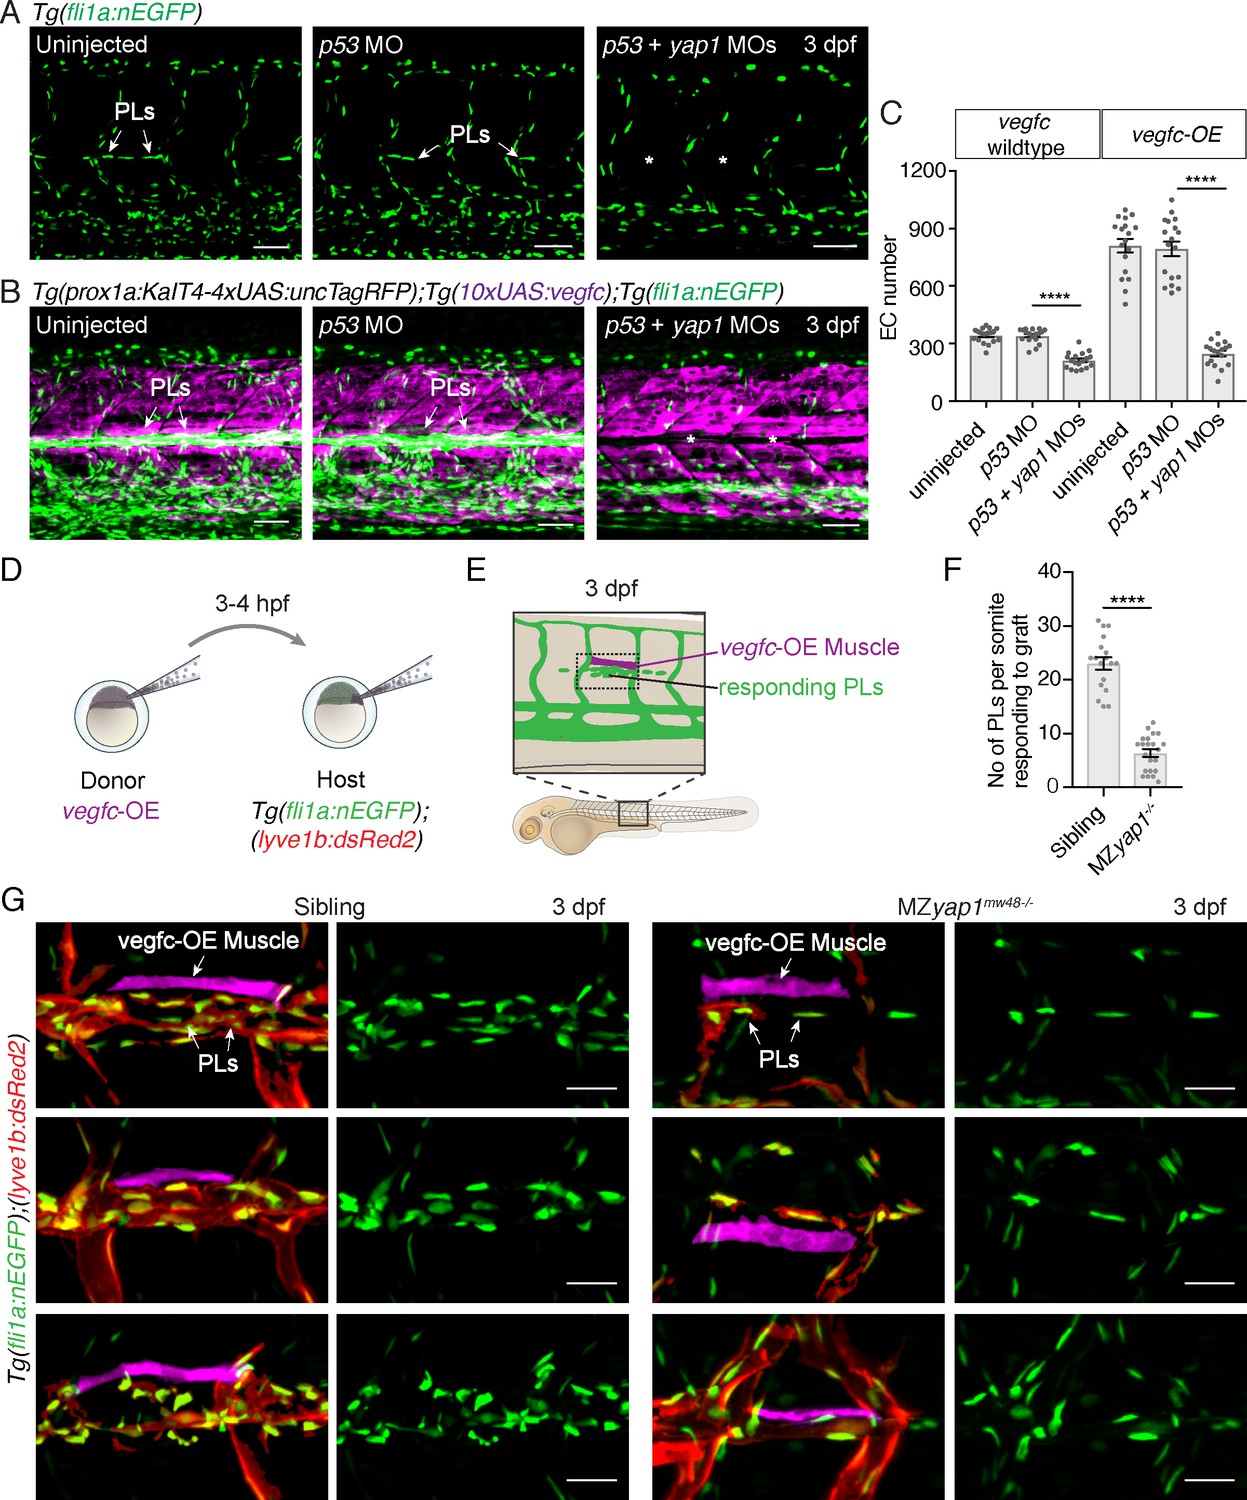
YAP is established to control cellular proliferation in diverse contexts, including in ECs (Panciera et al., 2017; Zhao et al., 2011). To ask whether Yap1 plays a role in EC proliferation downstream of Vegfc in PLs, as well as mediating normal sprouting behaviour, we used a transgenic approach. We overexpressed vegfc throughout the trunk under the control of the prox1a promoter (using TgBAC(prox1a: KalTA4-4xUAS-ADV.E1b:TagRFP)nim5, Tg(10xUAS:vegfc)uq2bh double transgenic (vegfc-OE) embryos), which is active in tissues that include muscle, neurons and vasculature (Koltowska et al., 2015a; van Impel et al., 2014). We then injected a yap1 targeting morpholino (MO) that has been previously validated (Loh et al., 2014) and phenocopied MZyap1-/- mutants (Figure 4A,C and data not shown). vegfc overexpression resulted in hyper-proliferation of venous-derived ECs throughout the trunk including prominently in the HM, where excessive numbers of ECs proliferate as previously described (Figure 4B,C, Koltowska et al., 2015a). The effect of Vegfc stimulation was completely blocked upon yap1 MO injection but not upon p53 (control) MO injection (Figure 4B,C). Together, these observations are consistent with a role for Yap1 downstream of Vegfc, functioning in Vegfc-induced proliferation.
Figure 4
Yap1 mediates endothelial cell proliferation downstream of Vegfc.
(A) Trunk vasculature at 3 dpf displaying endothelial cells (ECs) in green from uninjected, p53 morpholino (MO) injected and p53 +yap1 MO injected embryos. Asterisks highlight missing parachordal LECs (PLs). Scale bars: 50 μm. (B) Trunk vasculature at 3 dpf from uninjected, p53 MO injected and p53 +yap1 MOs injected embryos of the Tg(prox1a:KalT4xUAS:uncTagRFP); Tg(10xUAS:vegfc) strain. yap1 MO injection rescues the EC proliferation phenotype. ECs in green. Asterisks mark missing PLs. Scale bars: 50 μm. (C) Quantification of total EC number across four somites in vegfc-unstimulated (uninjected: 343 ± 9, n = 18; p53 MO: 341 ± 9, n = 18; p53 +yap1 MOs: 248 ± 15, n = 18; p<0.0001(****)) and vegfc-stimulated embryos (uninjected: 811 ± 35, n = 18; p53 MO: 794 ± 38, n = 18; p53 +yap1 MOs: 212 ± 10, n = 18; p<0.0001(****)). (D) Schematic representation of vegfc-overexpressing cell transplantations for single muscle grafts in [Tg(fli1a:nEGFP);(−5.2lyve1b:DsRed2)] hosts of siblings and MZyap1mw48-/- mutants. (E) Schematic of transplanted host embryo at 3 dpf. Muscle grafts produce excessive Vegfc causing a hyperproliferation response in adjacent PLs. (F) Quantification of PL number within one somite responding to the vegfc-OE single muscle graft at 3 dpf (sibling: 23.00 ± 1.19, n = 18; MZyap1mw48-/-: 6.36 ± 0.71, n = 22; p<0.0001 (****)). (G) Examples of 3 different vegfc-OE muscle grafts (false coloured) in siblings (left panels) and MZyap1mw48-/- mutants (right panels). Merge images show ECs in green, lymphatic and venous ECs are red (yellow) [Tg(fli1a:nEGFP);(−5.2lyve1b:DsRed2)]. Scale bars: 25 μm.
-
Figure 4—source data 1
Measurements of ECs in Vegfc-overexpression embryos.
- https://doi.org/10.7554/eLife.42881.021
To further validate this observation made with MO-mediated knockdown, we tested the ability of elevated Vegfc-induced signalling to stimulate PL proliferation in MZyap1-/- mutant embryos. We transplanted cells at blastula stages from vegfc-OE transgenic donor embryos into wildtype and MZyap1-/- mutant embryos (Figure 4D–E). Embryos that had engrafted vegfc-OE cells in muscle adjacent to the HM were then selected for analysis. The number of PLs responding to the local graft were scored within the same body segment in wildtype and MZyap1-/- mutant embryos at 3 dpf. Strikingly, the MZyap1-/- mutant host embryos displayed a vast reduction (although not a complete block) in numbers of proliferative PLs adjacent to HM grafts compared with wildtype siblings (Figure 4F,G). These data, coupled with reduced numbers of ECs in sprouts departing the PCV (Figure 3B), together suggest that Yap1 plays a role in the proliferation of developing lymphatic progenitors stimulated by Vegfc.
Vegfc signalling promotes nuclear YAP in LEC progenitors
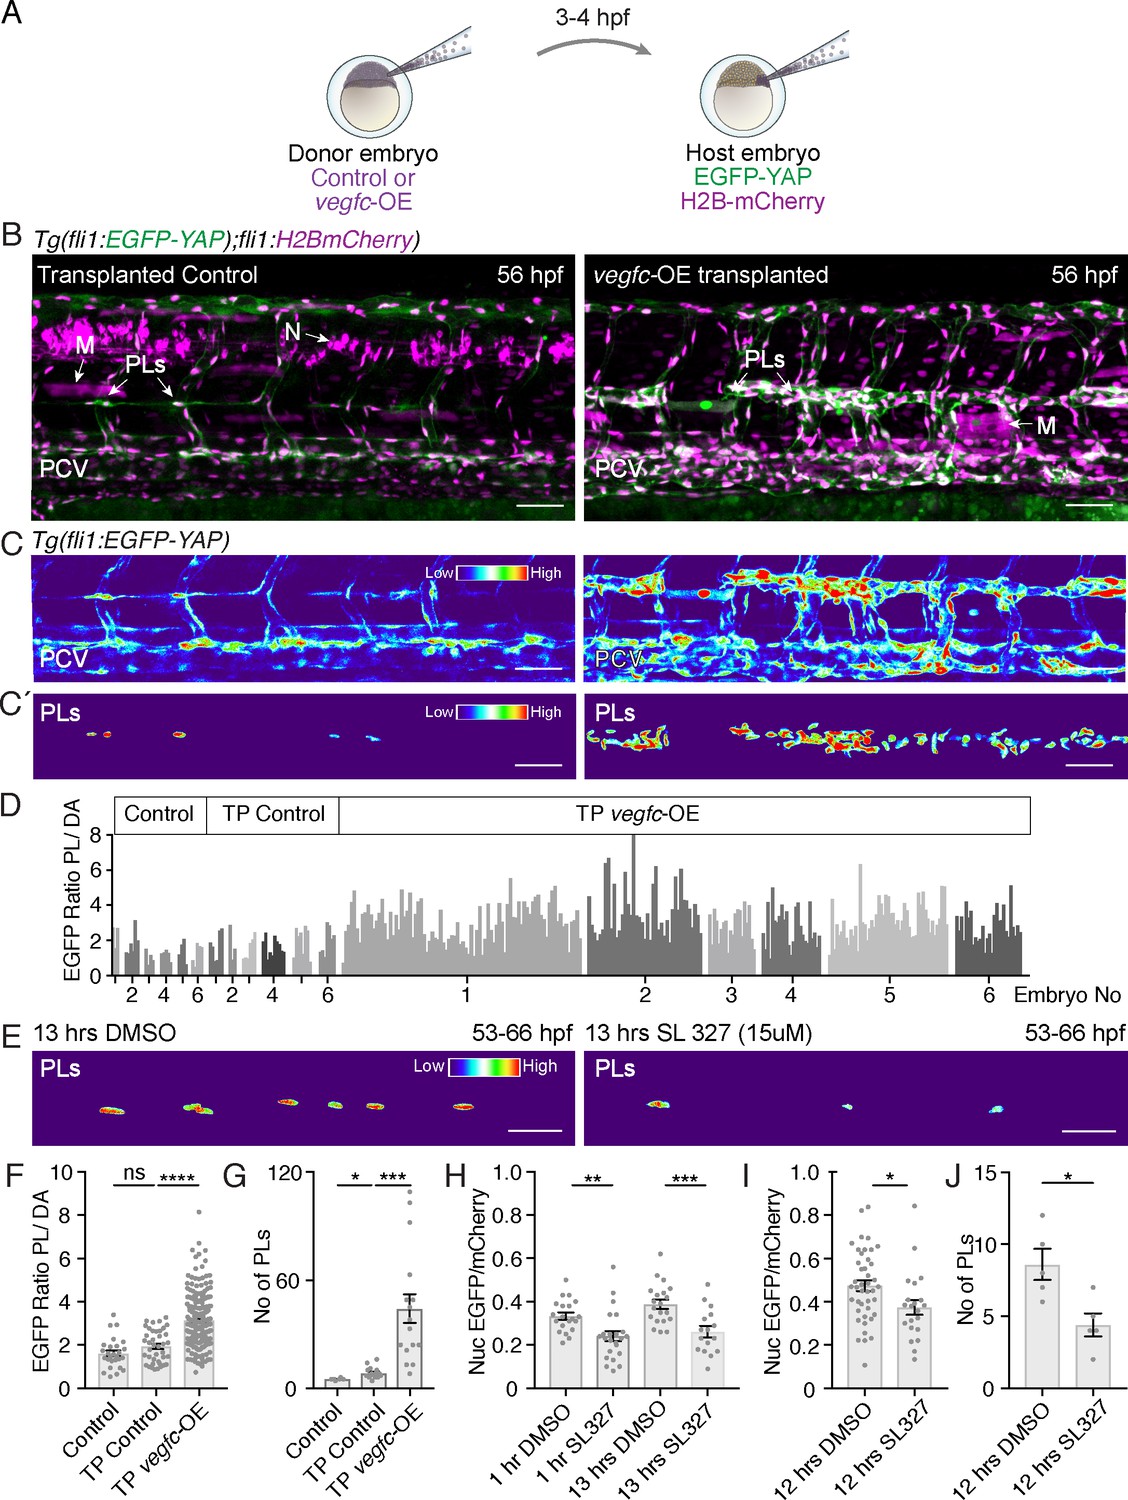
Nuclear localisation of YAP has been linked to EC proliferation (Panciera et al., 2017). We speculated that Vegfc signalling might promote nuclear Yap1 in order to promote LEC proliferation. To test this, we used a transplantation approach and transplanted vegfc-overexpressing cells (labelled by TagRFP in host embryos) at blastula stages into embryos carrying the EGFP-YAP reporter (Figure 5A). We selected embryos with labelled vegfc-OE neurons or muscle cells and found that these grafts were sufficient to induce local proliferation of adjacent venous ECs and LEC progenitors (Figure 5B,C). We analysed the localisation of EGFP-YAP in responding PLs local to Vegfc-producing donor cells. To generate an unbiased quantification that allows for variation in transgene intensity between embryos, we scored nuclear EGFP intensity in dorsal aorta cells (DA) and used the average pixel intensity of the DA cells as vegfc-OE unresponsive internal controls (see Koltowska et al., 2015a). Thus, PL nuclear EGFP intensity is calculated as PL nuclear intensity/average DA nuclear intensity in the same embryo (Figure 5C’,D). We found that Vegfc responsive PLs displayed an increase in nuclear EGFP-YAP compared with control PLs (Figure 5C’,D). This increase in nuclear EGFP-YAP in the vegfc-OE transplanted embryos was concomitant with a higher number of PLs (Figure 5G). Control PLs were scored in embryos transplanted with donor cells expressing the Kalt4 driver but not carrying the UAS:vegfc element (Figure 5B–D,F–G). Further, we transplanted from EGFP-YAP reporter donor embryos into vegfc-OE and control recipient embryos (Figure 5—figure supplement 1A). We selected small vascular EC grafts and examined grafted LECs and VECs for EGFP-YAP nuclear concentration. Relative to nuclear concentration in grafted vegfc-unresponsive DA cells, EGFP-YAP was increased in nuclei in lymphatic and venous EC grafts in the vegfc-OE hosts (Figure 5—figure supplement 1B–E).
Figure 5 with 1 supplement see all
Vegfc promotes nuclear Yap1 in developing lymphatic progenitors.
(A) Schematic showing the transplantation of vegfc-OE cells into EGFP-YAP reporter hosts. (B) Trunk vasculature of YAP reporter host embryos with neuron and muscle grafts expressing RFP (magenta) at 56 hpf. Control grafts (left) and vegfc-OE grafts (right). Posterior cardinal vein (PCV); Muscle (M); parachordal LECs (PLs); Neuron (N). Scale bars: 50 μm in B and C. (C) Heatmaps of maximum projections of EGFP-YAP from B) showing PLs and PCV. Red corresponds to high EGFP-YAP fluorescence. (C’) Lower panels show heatmaps of EGFP-YAP in PL nuclei. (D) EGFP intensity for each PL expressed as a ratio to the average of 6 dorsal aorta (DA) cells (unresponsive to vegfc). six embryos per group: untransplanted host (control) (PL n = 27), transplanted control without the UAS:vegfc construct (TP Control) (PL n = 40) and vegfc-OE transplanted embryos (TP vegfc-OE) (PL n = 251). Individual embryos indicated by an individual grey shade. (E) Heatmaps of EGFP-YAP depicting PL nuclei of embryos at 66 hpf that were treated with DMSO (left) and SL327 for 13 hr (hrs) (right). Max projections are from time-lapse Videos. Scale bars: 30 μM. (F) EGFP mean intensity for each PL/DA in panel D (Control: 1.61 ± 0.13, n = 27; TP Control: 1.93 ± 0.12, n = 40; p=0.08 (ns); TP vegfc-OE: 3.14 ± 0.07, n = 251; p<0.0001(****)). (G) Quantification of PL number across six somites for each group (Control: 5 ± 0.26, n = 6; TP Control: 8 ± 0.78, n = 16; p=0.0157 (*); TP vegfc-OE: 44 ± 8.04, n = 16; p=0.0001(***)). (H) Quantifications of the mean EGFP/mCherry fluorescent intensity ratio in PL nuclei from time-lapse Video stills. Embryos were mounted in DMSO as control (n = 5) or SL327 (15 μM) (n = 5) and continuously imaged for 12 hr starting at 54 hpf (1 hr drug treatment), finishing at 66 hpf (13 hr) (1 hr DMSO: 0.33 ± 0.02, n = 20; 1 hr SL327: 0.24 ± 0.02, n = 23; p=0.0036 (**)) (13 hr DMSO: 0.39 ± 0.02, n = 20; 13 hr SL327: 0.26 ± 0.03, n = 16; p=0.0006(***)). (I) Quantifications of mean EGFP/mCherry Ratio in PLs of embryos at 66 hpf treated with DMSO/SL327 for 12 hr from 54 hpf to 66 hpf without time-lapse imaging (12 hr DMSO: 0.47 ± 0.02, PLs n = 43; 13 hr SL327: 0.37 ± 0.03, PLs n = 22; p=0.02 (*)). (J) Quantification of PL number in embryos treated with DMSO/SL327 for 12 hr at 66 hpf without time-lapse imaging (12 hr DMSO: 8.6 ± 1.08, embryo n = 5; 13 hr SL327: 4.4 ± 0.81, embryo n = 5; p=0.014 (*)).
-
Figure 5—source data 1
Measurements of LEC EGFP-YAP in response to Vegfc.
- https://doi.org/10.7554/eLife.42881.025
Finally, as Vegfc/Flt4 signalling has been previously shown to be transduced via Erk in zebrafish trunk vasculature (Koltowska et al., 2015a; Shin et al., 2016), we investigated the impact of blocking this pathway on EGFP-YAP in PLs. Treatment with SL327, a MEK inhibitor that blocks Erk signalling in zebrafish (Shin et al., 2016), decreased the concentration of EGFP-YAP in the nuclei of PLs, concomitant with a reduction in PL number (Figure 5E,H–J). This was observed using time-lapse Videos (Figure 5H, not shown) as well as acquiring images following a single 12 hr treatment to exclude interference from time-lapse bleaching (Figure 5I). Overall, these observations indicate that the Vegfc-Erk axis promotes high nuclear Yap1 and drives normal sprouting and proliferation during zebrafish developmental lymphangiogenesis.
Discussion
Hippo pathway signalling and YAP/TAZ activity are key regulators of cell proliferation and organ growth and pathway components are frequently dysregulated in cancer (Harvey et al., 2013). Recent research has broadened our understanding of this pathway, which can function to integrate stimuli from the cellular environment that ultimately affect cell migration, growth and even cell fate (Panciera et al., 2017). In ECs, YAP/TAZ signalling has been relatively understudied, yet has still been reported to have roles in proliferation, survival, migration, adhesion and cellular rearrangements, although the mechanisms that utilise YAP are not completely understood (Kim et al., 2017; Neto et al., 2018; Wang et al., 2017). We show here that loss of Yap1 has a dramatic effect upon lymphatic vascular development, as MZyap1-/- mutants fail to form a lymphatic network in the zebrafish trunk. Surprisingly, these mutants exhibit a largely normal blood vasculature. The severity of the MZyap1-/- mutant phenotype indicates that Yap1 is indispensable for lymphangiogenesis and its paralogue Taz is not able to fully compensate in lymphatic vasculature. While not studied here, it remains possible that Taz may compensate for the absence of Yap1 in some vascular beds (eg. blood vessels) and not others (eg. lymphatics). It is also possible that there are tissue specific effectors of Yap1 in lymphatic endothelial cells by comparison to other vascular lineages. Further work is clearly needed to determine the mechanisms underlying the restricted lymphatic phenotype that we have observed here.
Lymphatic endothelial progenitor cells are specified in MZyap1-/- mutants but these fail to sprout normally to the horizontal myoseptum. The processes that are necessary for departure of LEC progenitors from the PCV and seeding of the HM include cell sprouting and directional migration, both Vegfc-dependent (Koltowska et al., 2015a; Nicenboim et al., 2015). Mutants displayed variable and abnormal cell behaviours including turning of sprouts back towards the PCV and fusion of adjacent sprouts. What the precise role of Yap1 is in venous EC sprouting requires further study, yet recent work points to regulation of junctional dynamics and cellular elongation as candidate cellular processes in other vessel contexts (Neto et al., 2018).
In addition to sprouting defects, we see a general reduction in the number of ECs that depart the PCV during secondary angiogenesis in the MZyap1-/- mutants. We further show that Vegfc-induced VEC and PL proliferation (in a transgenic overexpression model) requires normal levels of Yap1. In previous studies of blood vascular ECs, the Yap/Taz dependent proliferative response was regulated by Yap/Taz localization in the nucleus, where they regulate transcription to promote cell proliferation (Neto et al., 2018; Sakabe et al., 2017; Wang et al., 2017). Here, we report that EGFP-YAP localises to the nuclei of early LEC progenitors in zebrafish. Moreover, in vivo live imaging showed that dynamic changes occur in EGFP-YAP protein concentration in lymphatic progenitor nuclei. This may indicate active regulation of nuclear-cytoplasmic localisation of Yap1, as has recently been live-imaged in Drosophila (Manning et al., 2018). Directly imaging nuclear-cytoplasmic shuttling of EGFP-YAP presented challenges, chiefly the highly variable morphology of PL cytoplasm, which limited us to calculations and image analysis in 2D and may have introduced technical variation. Nevertheless, nuclear/cytoplasmic EGFP-YAP measurements correlated with changes in nuclear concentration of EGFP-YAP between PLs (Figure 1 and Figure 1—figure supplement 1) and confirmed that PLs display highly variable concentrations of nuclear EGFP-YAP that likely reflect differences in Yap1 activation and upstream signalling. We also note that we did not observe enrichment of EGFP-YAP fusion protein at cell-cell junctions and we note a caveat that YAP may also be regulated at the level of protein turnover. Importantly, a high concentration of nuclear EGFP-YAP was promoted by a local source of Vegfc, concomitant with increased PL proliferation (Figure 5 and Figure 5—figure supplement 1). Inhibition of Flt4-dependent Erk signalling also reduced the nuclear concentration of EGFP-YAP (Figure 5E–J). This suggests overall that paracrine Vegfc signalling activates LEC progenitor Flt4/Erk-signalling and that Yap1 is an essential effector of this pathway.
The development of the lymphatic vasculature is a remarkable process whereby a limited pool of progenitor cells in the wall of functional embryonic blood vessels are utilised as progenitors to generate a complex second vasculature. This inherently presents a tissue growth event that requires extensive, coordinated cellular proliferation coincident with network morphogenesis. That the HIPPO pathway and YAP would play a role follows a clear biological rationale. The process of lymphangiogenesis is important in a swathe of disease settings that include in common cardiovascular diseases and in the metastatic spread of cancer (Petrova and Koh, 2018). In the later setting, excessive lymphangiogenesis underpins metastatic spread and is a target of interest for inhibition (Dieterich and Detmar, 2016). Excessive lymphangiogenesis is also a target of interest in rare diseases such as lymphangioma or lymphatic malformation. While much emphasis in the development of anti-lymphangiogenic agents has focused on targeting VEGFC/VEGFR3 signalling, pathways involved in tissue growth and cellular proliferation such as the Hippo pathway, YAP and TAZ may well represent alternative targets worthy of further investigation.
Materials and methods
Key resources table
| Reagent type (species) or resource | Designation | Source or reference | Identifiers | Additional information/ reagent source |
|---|---|---|---|---|
| Genetic reagent (D.rerio) | yap1mw48-/- | Miesfeld et al., 2015 | RRID:ZFIN_ZDB-ALT-160122-5 | Brian Link (Medical College of Wisconsin, Milwaukee, USA) |
| Genetic reagent (D.rerio) | yap1ncv101-/- | Nakajima et al., 2017 | RRID:ZFIN_ZDB-ALT-170522-16 | Naoki Mochizuki (National Cerebral and Cardiovascular Centre Research Institute, Suita, Osaka) |
| Genetic reagent (D.rerio) | Tg(fli1a:nEGFP)y7 | Lawson et al., 2002 | RRID:ZFIN_ZDB-ALT-060821-4 | Brant M Weinstein (National Institute of Child Health and Human Development, Bethesda, USA) |
| Genetic reagent (D.rerio) | Tg(- 5.2lyve1b:DsRed)nz101 | Okuda et al., 2012 | RRID:ZFIN_ZDB-ALT-120723-3 | Phil and Kathy Crosier (Department of Molecular Medicine University of Auckland School of Medicine) |
| Genetic reagent (D.rerio) | Tg(fli1:EGFP-YAP)ncv35 | Nakajima et al., 2017 | RRID:ZFIN_ZDB-ALT-170522-18 | Naoki Mochizuki (National Cerebral and Cardiovascular Centre Research Institute, Suita, Osaka) |
| Genetic reagent (D.rerio) | Tg(fli1:Gal4db-TEAD2ΔN-2A-mC)ncv36 | Nakajima et al., 2017 | RRID:ZFIN_ZDB-ALT-170522-19 | Naoki Mochizuki (National Cerebral and Cardiovascular Centre Research Institute, Suita, Osaka) |
| Genetic reagent (D.rerio) | Tg(UAS:GFP)y1 | Asakawa et al., 2008 | RRID:ZFIN_ZDB-ALT-011017-8 | Naoki Mochizuki (National Cerebral and Cardiovascular Centre Research Institute, Suita, Osaka). |
| Genetic reagent (D.rerio) | Tg(fli1:Myr-mC)ncv1 | Kwon et al., 2013 | ZFIN ID: ZDB-FIG-150115–34 | Naoki Mochizuki (National Cerebral and Cardiovascular Centre Research Institute, Suita, Osaka) |
| Genetic reagent (D.rerio) | Tg(fli1:H2B-mC)ncv31 | Yokota et al., 2015 | RRID:ZFIN_ZDB-ALT-160323–6 | Naoki Mochizuki (National Cerebral and Cardiovascular Centre Research Institute, Suita, Osaka) |
| Genetic reagent (D.rerio) | Tg(gata1:DsRed)sd2 | Traver et al., 2003 | RRID:ZFIN_ZDB-ALT-051223-6 | Leonard I Zon (Howard Hughes Medical Institute, Boston, MA), European Zebrafish Resource Center (EZRC),Zebrafish International Resource Center (ZIRC). |
| Genetic reagent (D.rerio) | TgBAC(prox1a: KalTA4-4xUAS-ADV.E1b:TagRFP)nim5 | Dunworth et al., 2014; van Impel et al., 2014 | RRID:ZFIN_ZDB-ALT-160323–6 | Elke Ober (The Danish Stem Cell Centre (DanStem) University of Copenhagen) |
| Genetic reagent (D.rerio) | Tg(10xUAS:vegfc)uq2bh | Koltowska et al., 2015a | RRID:ZFIN_ZDB-ALT-151208-1 | Ben M Hogan (Institute for Molecular Bioscience, The University of Queensland) |
| Genetic reagent (D.rerio) | Tg(fli1a:H2B-mCherry)uq37bh | this paper | Ben M Hogan (Institute for Molecular Bioscience, The University of Queensland) | |
| Genetic reagent (D.rerio) | TgBAC(dab2b:EGFP)ncv67 | other | Shigetomo Fukuhara and Shinya Yuge (Nippon Med. School) | |
| Genetic reagent (D.rerio) | Tg(kdrl:mCherry)ncv502 | other | Naoki Mochizuki (National Cerebral and Cardiovascular Centre Research Institute, Suita, Osaka). | |
| Antibody | chicken anti-GFP | Abcam | Cat#ab13970 | Primary AB, Alexa Fluor-488 conjugated, 1:250 |
| Antibody | C1 anti-GFP | Invitrogen | Cat#A11039 | Secondary AB, 1:400 |
| Antibody | rabbit anti-Prox1 | AngioBio | Cat#11–002 | Primary AB, 1:500 |
| Antibody | anti-rabbit IgG-HRP | Cell Signaling | Cat#7074S | Secondary AB, 1:1000 |
| Sequence-based reagent | MO4-yap1 | Loh et al., 2014 | ZFIN ID: ZDB-MRPHLNO-140915–5 | Genetools, LLC |
| Sequence-based reagent | p53 MO | Robu et al., 2007 | SKU: PCO-ZebrafishP53-100 | Genetools, LLC |
| Commercial assay or kit | TSA Plus Cyanine 3 System | Perkin Elmer | #NEL744001KT | Amplification of signal detection of the Prox1-AB staining |
| Chemical compound, drug | SL327 (MEK inhibitor) | Sigma-Aldrich | S4069; CAS:305350-87-2 | 15 mM |
| Software, algorithm | ImageJ | ImageJ (http://imagej.nih.gov/ij/) | SCR:002285 | Image processing and analysis, Version 2.0.0-rc-49/1.51d |
| Software, algorithm | Imaris x64 | Bitplane | SCR:007370 | Image processing and analysis, Version 9.0.2 |
| Software, algorithm | GraphPad Prism | GraphPad Prism (https://graphpad.com) | SCR:015807 | Statistics, Prism7: Version7.0 c and Prism8: Version 8.0.1 |
Zebrafish
All zebrafish work was conducted in accordance with the guidelines of the animal ethic committee guidelines at the University of Queensland and of the National Cerebral and Cardiovascular Center (No.14005 and No.15010). The two different mutant strains used were the yap1ncv101-/- mutant, which has a 25 base pair (bp) deletion in exon1 leading to a frame shift and stop codon after 71 bp, prior to the TEAD binding domain (Nakajima et al., 2017), and the yap1mw48-/- mutant, which displays a 4 bp deletion after 158 bp, truncating the TEAD binding domain and leading to a premature stop codon (Miesfeld et al., 2015). The transgenic zebrafish lines used were published previously as following: Tg(fli1a:nEGFP)y7 (Lawson et al., 2002), Tg(- 5.2lyve1b:DsRed)nz101 (Okuda et al., 2012), Tg(fli1:EGFP-YAP)ncv35 and Tg(fli1:Gal4db-TEAD2ΔN-2A-mC)ncv36 (Nakajima et al., 2017), Tg(UAS:GFP)y1 (Asakawa et al., 2008), Tg(fli1:Myr-mC)ncv1 (Kwon et al., 2013) and Tg(fli1:H2B-mC)ncv31 (Yokota et al., 2015), Tg(gata1:DsRed)sd2 (Traver et al., 2003), TgBAC(prox1a: KalTA4-4xUAS-ADV.E1b:TagRFP)nim5(Dunworth et al., 2014; van Impel et al., 2014); Tg(10xUAS:vegfc)uq2bh (Koltowska et al., 2015b). The Tg(fli1a:H2B-mCherry)uq37bh strain was generated for this study using Gateway cloning and transgenesis. The transgenic line TgBAC(dab2b:EGFP)ncv67 was provided by Shigetomo Fukuhara and Shinya Yuge (Nippon Med. School). Tg(kdrl:mCherry)ncv502 were generated using Tol2 mediated transgenesis.
Morpholino injections
The yap1 morpholino (MO) used has been validated and described previously as MO4-yap1 (Loh et al., 2014). To control for yap1 morpholino non-specific effects, we co-injected p53 MO as previously described (Robu et al., 2007) and both uninjected and p53 MO injected embryos were used as controls. All MOs were purchased from Genetools, LLC and injected at 5 ng/embryo.
Genotyping of yap1 mutants
Request a detailed protocolYap1 mutants of the yap1ncv101 allele were genotyped by PCR using a Microchip Electrophoresis System for DNA/RNA Analysis (MCE-202 MultiNA). yap1ncv101 forward primer: TCCTTCGCAAGGCTTGGATAATTG yap1ncv101 reverse primer: TTGTCTGGAGTGGGACTTTGGCTC yap1 mutants carrying the yap1mw48 allele were genotypes using a KASP genotyping assay following the manufacturer’s instructions (LGC Genomics).
Drug treatments and immunohistochemistry
Request a detailed protocolEmbryos were treated with 15 μM of the chemical inhibitor SL327 (Merk, NJ, USA) diluted in E3 medium with 0.003% 1-phenyl-2-thiourea (PTU) and 1% DMSO (Sigma) and immobilised with Tricaine (0.08 mg/ml) and 1% low melting agarose for imaging. Control embryos were kept in E3-PTU water with 1% DMSO.
Immunofluorescent staining was performed as described in Okuda et al. (2018) with the following minor changes to the protocol: 30 min of ProtK treatment (20 ng/ml) was used for 36 hpf old embryos. For EGFP, the primary antibody used was chicken a-GFP (1:400, Abcam, #ab13970) and secondary C1 anti-GFP (Invitrogen, #A11039). For Prox1, rabbit a-Prox1 (1:500, AngioBio, #11–002) was used as primary and a-rabbit IgG-HRP (1:1,000, Cell Signaling, #7074S) as secondary and amplified the Prox1 signal with TSA Plus Cyanine 3 System (Perkin Elmer, #NEL744001KT).
Transplantations
Request a detailed protocolEC transplantations to test cell autonomy were performed between pre-dome stage donor and host embryos essentially as previously published (Hogan et al., 2009a). Briefly, only successfully transplanted embryos with a normal morphology were selected to be imaged. Despite each transplanted graft being unique, comparable EC grafts were selected in terms of location and size for each experiment. In Figure 2G–I, the EC graft size was categorized as small, medium or large to keep grafts comparable between wildtype and mutant embryos studied. ‘Large’ grafts spanned vasculature over 4–5 somites, ‘medium’ sized grafts spanned vasculature over 2–3 somites and ‘small’ grafts over 1–2 somites. Single cell grafts were not included in the analysis. To analyse the response of PLs to locally transplanted vegfc-overexpressing muscle cell grafts in Figure 4, only single cell muscle grafts adjacent to the horizontal myoseptum were considered which spanned one somite. The PL number was quantified within the same somite. In Figure 5—figure supplement 1, selected host embryos showed lymphatic or venous ECs as well as transplanted ECs in the dorsal aorta.
All EC graft donor embryos were in-crosses of either wildtype control or homozygous Zyap1ncv101 mutants. For the transplantation of muscle and neurons in Figure 5, donor embryos for the chosen transgenes [TgBAC(prox1a: KalTA4-4xUAS-ADV.E1b:TagRFP)] as TP control and [TgBAC(prox1a: KalTA4-4xUAS-ADV.E1b:TagRFP);Tg(10xUAS:vegfc)]as vegfc-OE were all heterozygous. Crosses between Tg(fli1:EGFP-YAP)ncv35 and Tg(fli1a:H2B-mCherry)uq37bh were used to generate heterozygous host embryos.
Imaging
Request a detailed protocolAll imaged embryos were immobilised with tricaine (0.08 mg/ml) and mounted laterally in 1% low-melting agarose (Sigma-Aldrich, A9414-100G) for still images and 0.7% agarose for time-lapse Videos. Zebrafish embryos were imaged at the Australian Cancer Research Foundation’s Cancer Ultrastructure and Function Facility at the Institute for Molecular Bioscience in Brisbane, Australia using a Zeiss LSM 710 FCS confocal microscope and an Andor Dragonfly Spinning Disc Confocal microscope with the Zyla 4.2 sCMOS camera (exclusively for Video 2 and Figure 1—figure supplement 1F), or at the National Cerebral and Cardiovascular Center Research Institute in Osaka, Japan on an OLYMPUS confocal microscope (FluoView FV1000 and FV1200). All embryos analysed for quantification of signal intensity were heterozygous carriers for each transgene and imaged with the same imaging settings for each experiment with neuronal and muscle transplantations being the exception.
Image processing and fluorescent intensity analysis
Request a detailed protocolImages were processed with image processing software ImageJ Version 2.0.0-rc-49/1.51d (National Institute of Health) and Imaris x64 (Version 9.0.2). For Figure 2B, the dorsal longitudinal lymphatic vessel (DLLV) could not be scored due to interference with skin fluorescence in the TgBAC(dab2b:EGFP) strain.
To investigate EGFP-YAP activity within ECs, we used three different approaches. The first method, which we chose to use throughout the study examined nuclear EGFP/mCherry intensity ratios within ECs. This analysis was performed using Imaris software to extract the average pixel intensity spanning the entire nucleus in 3D. The nucleus was masked using the red channel (mCherry). To represent both fluorophores in one graph for each cell track shown in Figure 1I and Figure 1—figure supplement 1G, the mean mCherry intensity was used to normalize the graphs. In the second method, nuclear EGFP/mCherry intensity was calculated manually in 2D on a single z-plane using ImageJ. The chosen z-plane was determined by the centre of each PL nucleus. Intensities were extracted by thresholding the red channel. The final method calculated the nuclear to cytoplasm ratio of EGFP-YAP using the same manual approach with ImageJ with the addition that the cell outline is manually drawn around each cell and the all values within the thresholded nucleus are excluded.
For Figure 5, measurements of relative EGFP-YAP intensity, to control for the variation in transgene signal between embryos, the average EGFP fluorescent intensity per pixel for individual PLs was measured and divided by the mean of 6 DA cells measured within the same embryo. A similar approach was used for Figure 5—figure supplement 1 with the modification that at least 3 DA cells were averaged due to graft size limitations.
Figure 5C’ and E, Videos 2–3 and Figure 5—figure supplement 1C”-D” display the EGFP fluorescence intensity as a heatmap within the PL nuclei which was generated using the Imaris surface function for the red channel to select only the nuclei.
Quantification and statistical analysis
Request a detailed protocolGraphic representation of data and statistical analysis was performed using Prism7 and Prism8 (GraphPad, version 7.0 c for Prism7 and version 8.0.1 for Prism8). All experiments were statistically evaluated using the unpaired two-sided t-test as comparison of mean unless stated otherwise. Stars indicate p-values as level of significance in GP style with p≤0.0001 (****), p≤0.0002 (***), p≤0.0021 (**), p≤0.332 (*), and p≥0.05 (not significant (ns)). All graphs with single dot scatter plots with error bars showing mean and standard error of the mean (SEM). A pearson correlation analysis and linear regression has been performed in Figure 1H and Figure 1—figure supplement 1C to compare the similarity of the different methods to measure the average EGFP intensity.
The EC numbers in Figure 4C and Figure 5G and J were counted using the Spot detection algorithm from Imaris. All other EC numbers were manually counted with ImageJ. The fragments of thoracic duct in Figure 2D and the PL abundance in Figure 3D were scored as present (1) or absent (0) for each somite per embryo and displayed as percentage.
Data availability
All data generated or analysed during this study are included in the manuscript and supporting files.
References
-
Molecular controls of lymphatic VEGFR3 signalingArteriosclerosis, Thrombosis, and Vascular Biology 35:421–429.https://doi.org/10.1161/ATVBAHA.114.304881
-
Tumor lymphangiogenesis and new drug developmentAdvanced Drug Delivery Reviews 99:148–160.https://doi.org/10.1016/j.addr.2015.12.011
-
The hippo pathway and human cancerNature Reviews Cancer 13:246–257.https://doi.org/10.1038/nrc3458
-
Ccbe1 is required for embryonic lymphangiogenesis and venous sproutingNature Genetics 41:396–398.https://doi.org/10.1038/ng.321
-
Congenital hereditary lymphedema caused by a mutation that inactivates VEGFR3 tyrosine kinaseThe American Journal of Human Genetics 67:295–301.https://doi.org/10.1086/303019
-
Lymphatic endothelial cell identity is reversible and its maintenance requires Prox1 activityGenes & Development 22:3282–3291.https://doi.org/10.1101/gad.1727208
-
Missense mutations interfere with VEGFR-3 signalling in primary lymphoedemaNature Genetics 25:153–159.https://doi.org/10.1038/75997
-
YAP/TAZ regulates sprouting angiogenesis and vascular barrier maturationJournal of Clinical Investigation 127:3441–3461.https://doi.org/10.1172/JCI93825
-
Yap and Taz regulate retinal pigment epithelial cell fateDevelopment 142:3021–3032.https://doi.org/10.1242/dev.119008
-
Visualization and tools for analysis of zebrafish lymphatic developmentMethods in Molecular Biology 1846:55–70.https://doi.org/10.1007/978-1-4939-8712-2_4
-
Mechanobiology of YAP and TAZ in physiology and diseaseNature Reviews Molecular Cell Biology 18:758–770.https://doi.org/10.1038/nrm.2017.87
-
Organ-specific lymphatic vasculature: from development to pathophysiologyThe Journal of Experimental Medicine 215:35–49.https://doi.org/10.1084/jem.20171868
-
Emerging roles of TEAD transcription factors and its coactivators in cancersCancer Biology & Therapy 14:390–398.https://doi.org/10.4161/cbt.23788
-
FOXC2 and fluid shear stress stabilize postnatal lymphatic vasculatureJournal of Clinical Investigation 125:3861–3877.https://doi.org/10.1172/JCI80454
-
YAP/TAZ orchestrate VEGF signaling during developmental angiogenesisDevelopmental Cell 42:462–478.https://doi.org/10.1016/j.devcel.2017.08.002
-
Live imaging of lymphatic development in the zebrafishNature Medicine 12:711–716.https://doi.org/10.1038/nm1427
-
The hippo pathway: regulators and regulationsGenes & Development 27:355–371.https://doi.org/10.1101/gad.210773.112
-
The hippo pathway in organ size control, tissue regeneration and stem cell self-renewalNature Cell Biology 13:877–883.https://doi.org/10.1038/ncb2303
-
Lymphangiogenic factors, mechanisms, and applicationsJournal of Clinical Investigation 124:878–887.https://doi.org/10.1172/JCI71603
Article and author information
Author details
Funding
National Heart Foundation of Australia (1083811)
- Benjamin M Hogan
National Health and Medical Research Council (1155221)
- Benjamin M Hogan
The funders had no role in study design, data collection and interpretation, or the decision to submit the work for publication.
Acknowledgements
This work was supported in part by a National Health and Medical Research Council (NHMRC) Project Grant (1079670) and the University of Queensland’s Centre for Cardiac and Vascular Biology. BMH was supported by a National Heart Foundation/NHMRC Career Development Fellowship (1083811) and NHMRC Senior Research Fellowship (1155221). We thank Tevin Chau and Nick Condon for technical assistance and useful suggestions. The TgBAC(dab2:EGFP) line used in this manuscript was provided by Shigetomo Fukuhara and Shinya Yuge (Nippon Med. School). Imaging was performed in the Australian Cancer Research Foundation’s Cancer Ultrastructure and Function Facility at IMB and the imaging centre at the National Cerebral and Cardiovascular Centre, Osaka.
Ethics
Animal experimentation: All zebrafish work was conducted in accordance with the guidelines of the animal ethic committee guidelines at the University of Queensland and of the National Cerebral and Cardiovascular Center (No.14005 and No.15010).
Copyright
© 2019, Grimm et al.
This article is distributed under the terms of the Creative Commons Attribution License, which permits unrestricted use and redistribution provided that the original author and source are credited.
Metrics
-
- 2,844
- views
-
- 454
- downloads
-
- 34
- citations
Views, downloads and citations are aggregated across all versions of this paper published by eLife.
Citations by DOI
-
- 34
- citations for umbrella DOI https://doi.org/10.7554/eLife.42881
Download links
A two-part list of links to download the article, or parts of the article, in various formats.
Downloads (link to download the article as PDF)
Open citations (links to open the citations from this article in various online reference manager services)
Cite this article (links to download the citations from this article in formats compatible with various reference manager tools)
Yap1 promotes sprouting and proliferation of lymphatic progenitors downstream of Vegfc in the zebrafish trunk
eLife 8:e42881.
https://doi.org/10.7554/eLife.42881


