Werner syndrome helicase is a selective vulnerability of microsatellite instability-high tumor cells
- Boehringer Ingelheim RCV GmbH & Co KG, Austria
- Research Institute of Molecular Pathology, Austria
- University of Michigan, United States
- Baylor University Medical Center, United States
Figures
Figure 1 with 1 supplement
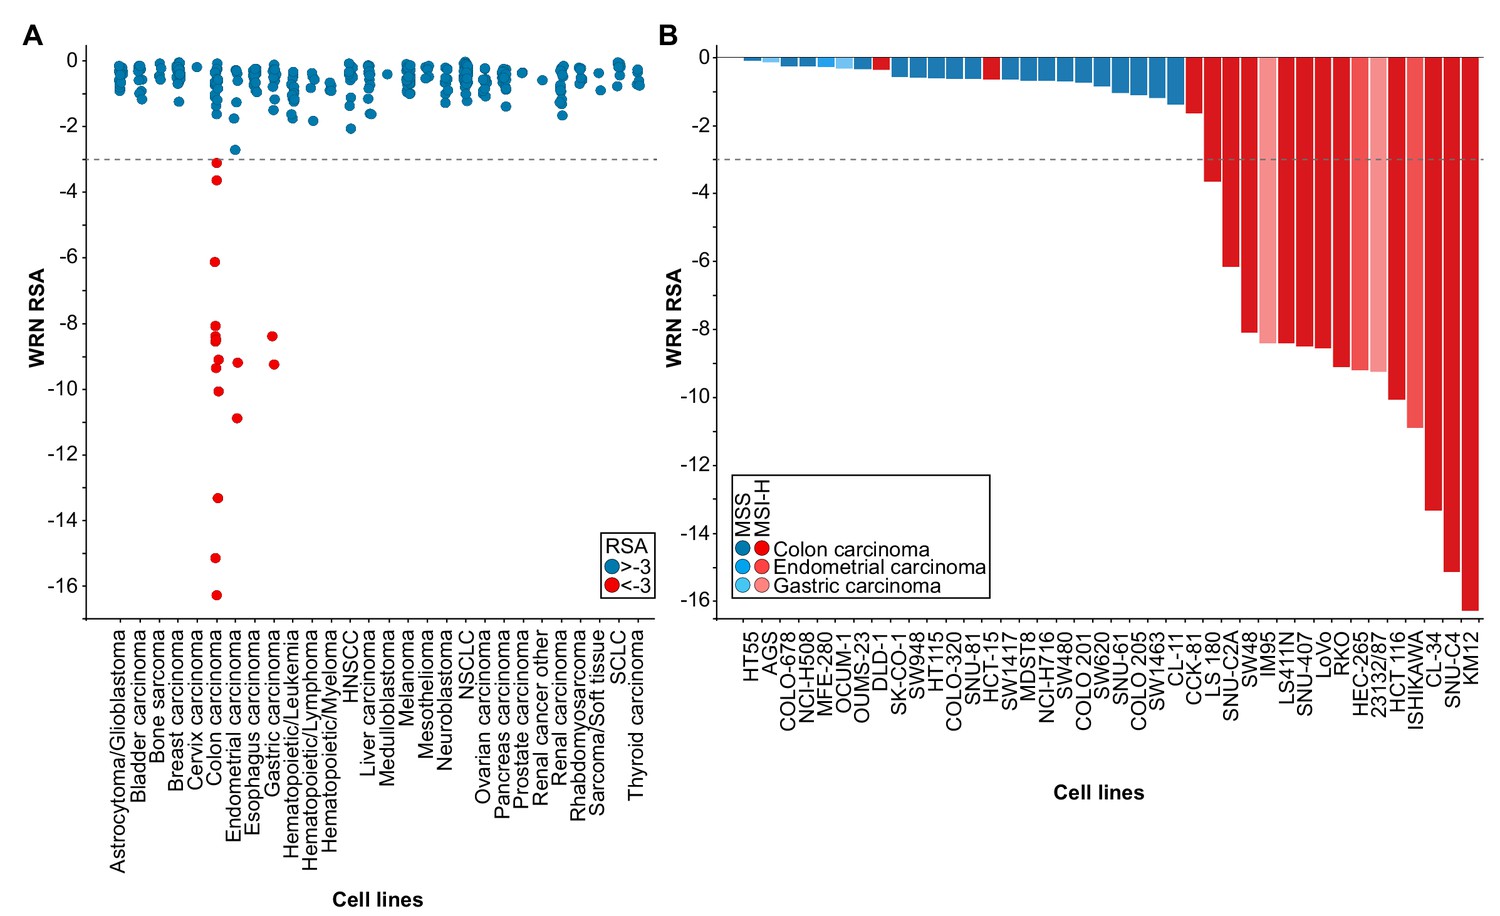
WRN is a selective dependency in MSI-H cancer cell models.
(A) WRN shRNA activity by RSA score in pooled shRNA depletion screens from Project DRIVE (McDonald et al., 2017). Cell lines were binned according to tumor type. (B) MSS/MSI-H status and WRN RSA of CRC, endometrial and gastric cancer models from Project DRIVE.
Figure 1—figure supplement 1

WRN dependency correlates with MMR gene mutation status and MLH1 expression.
(A) Receiver operating characteristic curve and variable importance plot for Random Forest model. Note: <gene >_st denotes the mutational status of respective gene whereas <gene > denotes the expression of the respective gene in the variable importance plot. (B) MLH1 mRNA TPM and WRN RSA of cancer models from Project DRIVE. Genes involved in MMR are indicated in red font. Data information: Cell line mutation and expression data were derived from the Ordino database (Streit et al., 2019).
Figure 2 with 3 supplements

Loss of WRN selectively impairs viability of MSI-H CRC and endometrial cancer cell models.
(A) MSS and MSI-H CRC cell lines were transfected with the indicated siRNAs. Cell viability was determined 7 days after transfection and is shown relative to non-targeting control (NTC) siRNA. WRN siRNA knock-down efficacy was analyzed by immunoblotting. Protein lysates were prepared 72 hr after transfection. GAPDH expression was used to monitor equal loading. (B) Crystal violet staining of MSS and MSI-H CRC lines treated as in panel A. (C) Cell viability analysis of MSS and MSI-H endometrial cell lines treated as in panel A. Data information: In (A and C), data are presented as mean ± SD of three independent experiments.
Figure 2—figure supplement 1
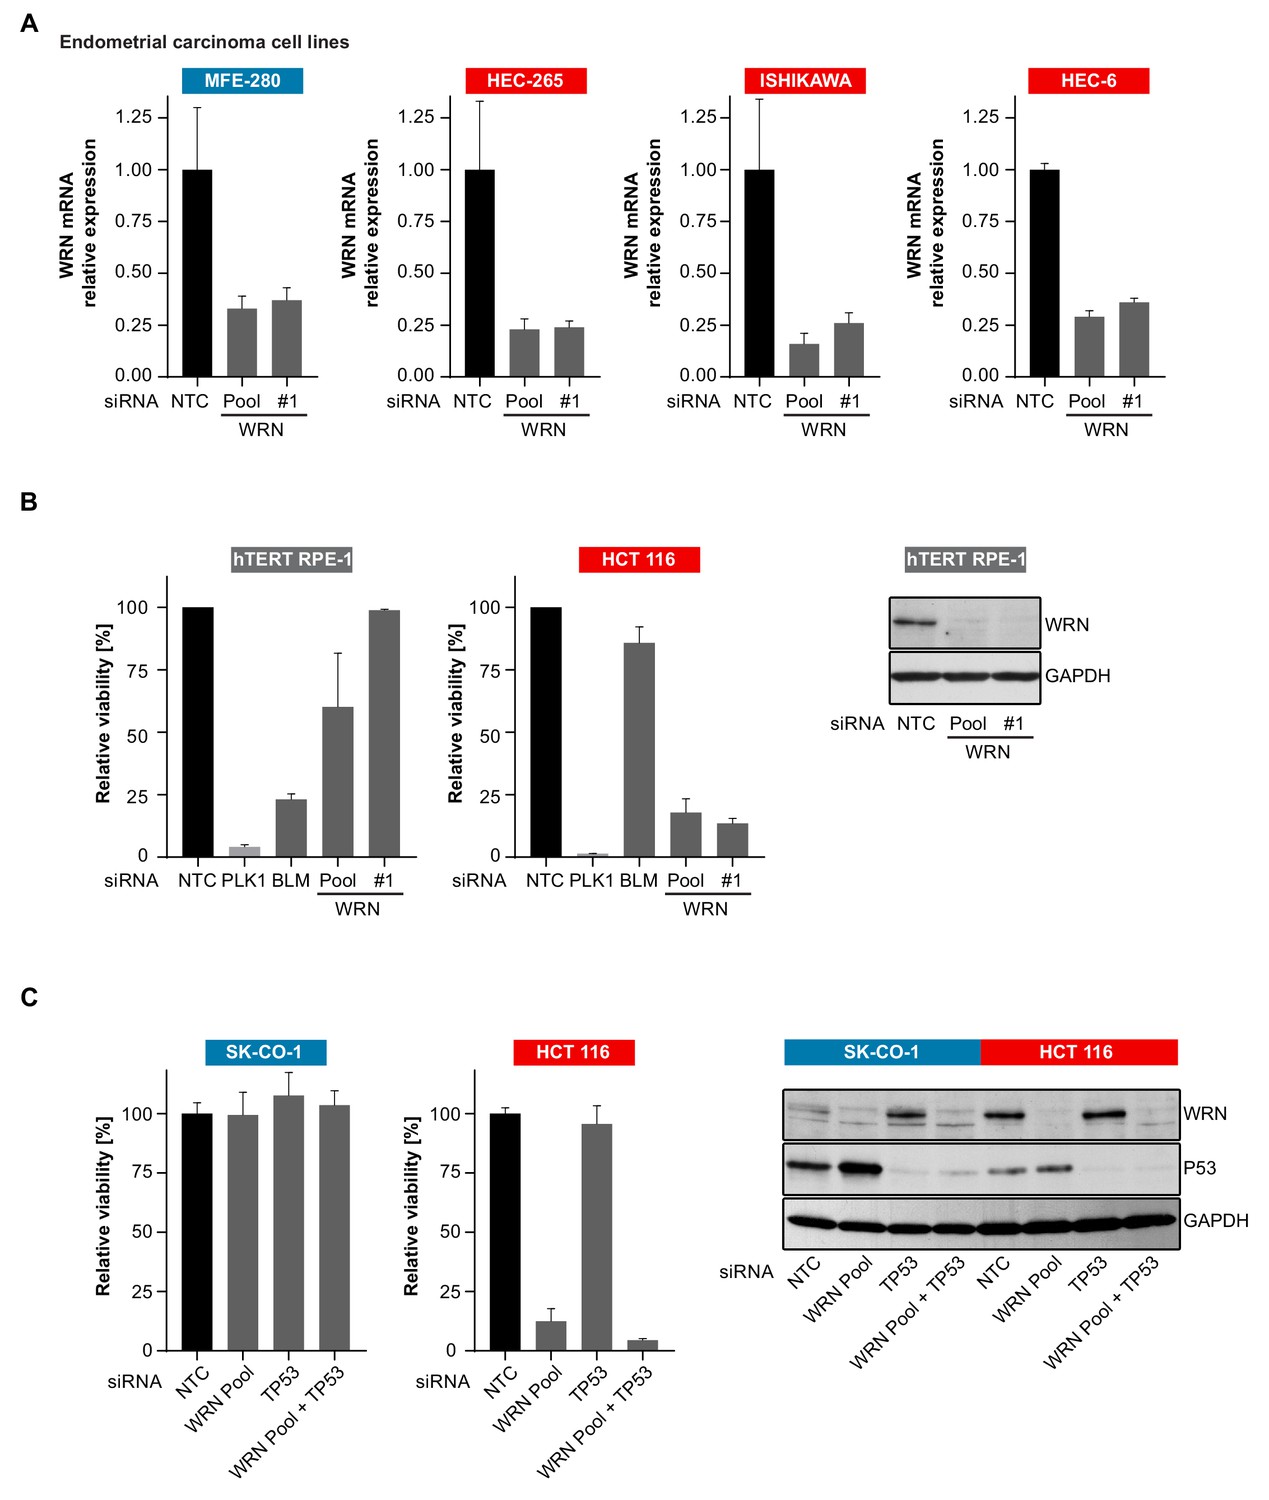
Non-transformed cells do not display WRN dependency.
(A) WRN siRNA knock-down efficacy in endometrial carcinoma cell models was analyzed by qRT-PCR. RNA lysates were prepared 72 hr after transfection. WRN mRNA expression is normalized to 18S rRNA levels (n = 1 experimental replicate). (B) Non-transformed hTERT RPE-1 and HCT 116 cells were transfected with the indicated siRNAs. Cell viability was determined 7 days after transfection and is shown relative to NTC siRNA. WRN siRNA knock-down efficacy was analyzed by immunoblotting. Protein lysates were prepared 72 hr after transfection. GAPDH expression was used to monitor equal loading. (C) TP53-wild-type CRC cell lines SK-CO-1 and HCT 116 cells were transfected with the indicated siRNAs. Cell viability and WRN siRNA knock-down efficacy was analyzed as in panel B. Data information: In (B and C) data are presented as mean ± SD of two independent experiments.
Figure 2—figure supplement 2
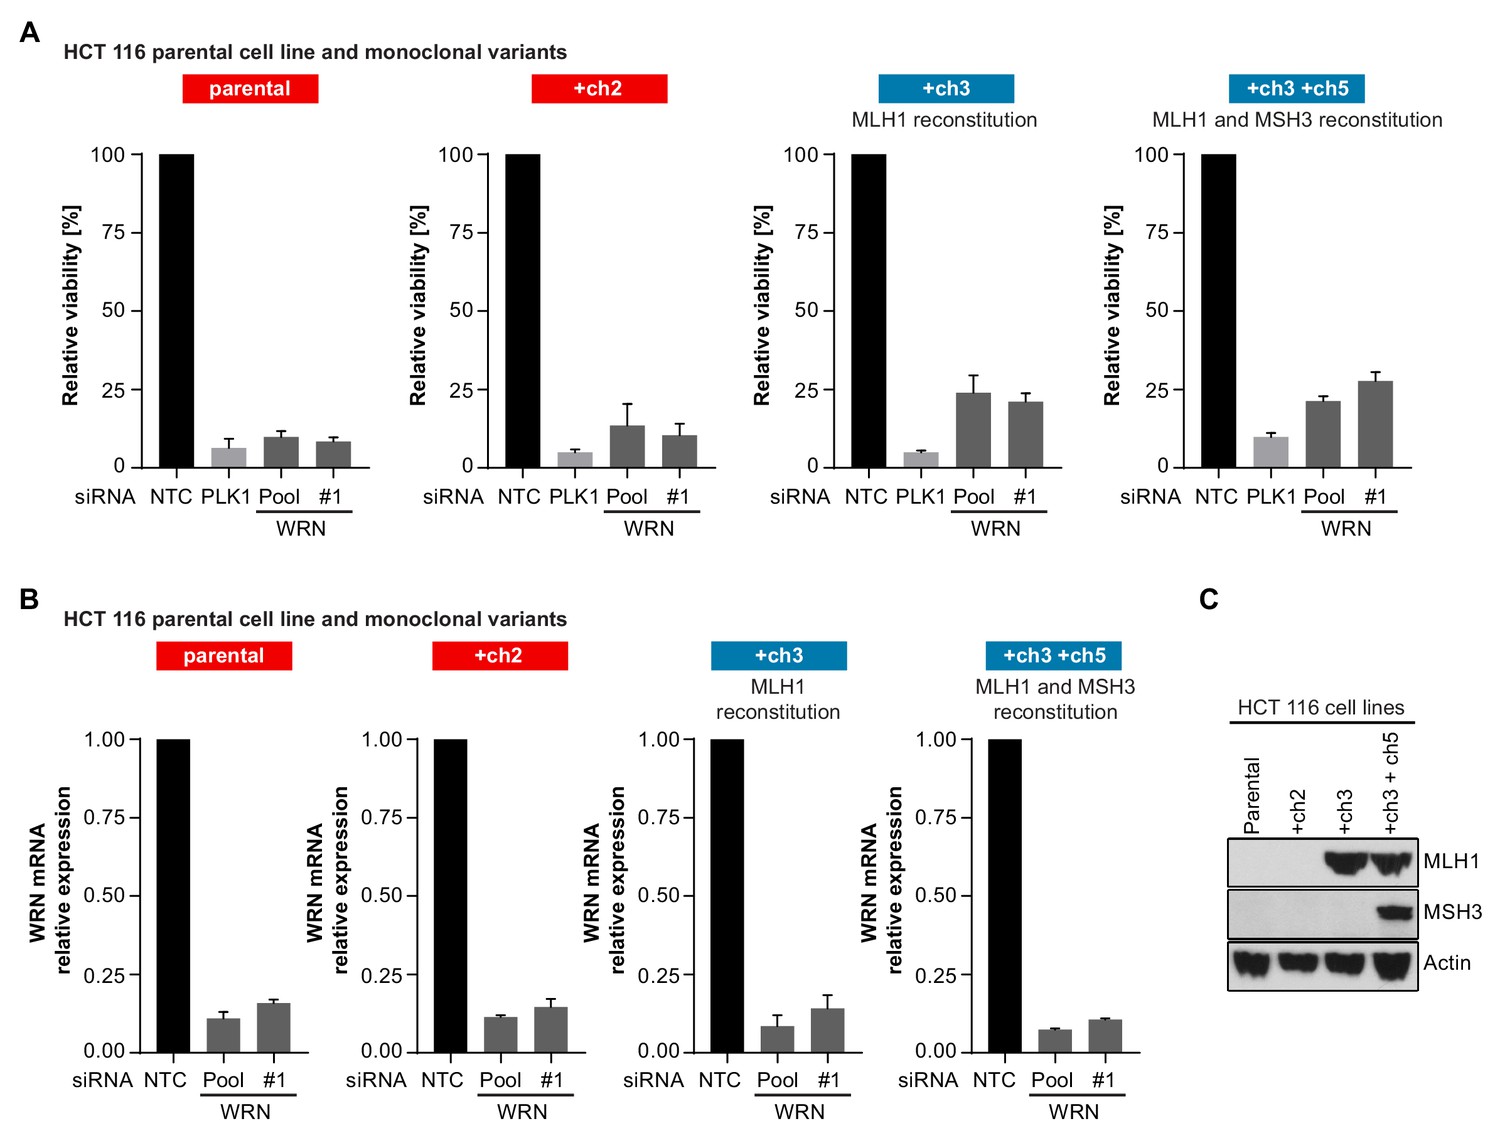
MLH1/MSH3 reconstitution in HCT 116 CRC cells does not alleviate WRN dependency.
(A) HCT 116 cell lines were transfected with the indicated siRNAs. Cell viability was determined 7 days after transfection and is shown relative to non-targeting control (NTC) siRNA. (B) WRN siRNA knock-down efficacy was analyzed by qRT-PCR. RNA lysates were prepared 48 hr after transfection. WRN mRNA expression is normalized to 18S rRNA levels. (C) Reconstitution of MLH1 and MSH3 was determined by immunoblot, Actin expression was used to monitor equal loading. Data information: In (A), data are presented as mean ± SD of three to six independent experiments. In (B), data are presented as mean ± SD of two independent experiments.
Figure 2—figure supplement 3
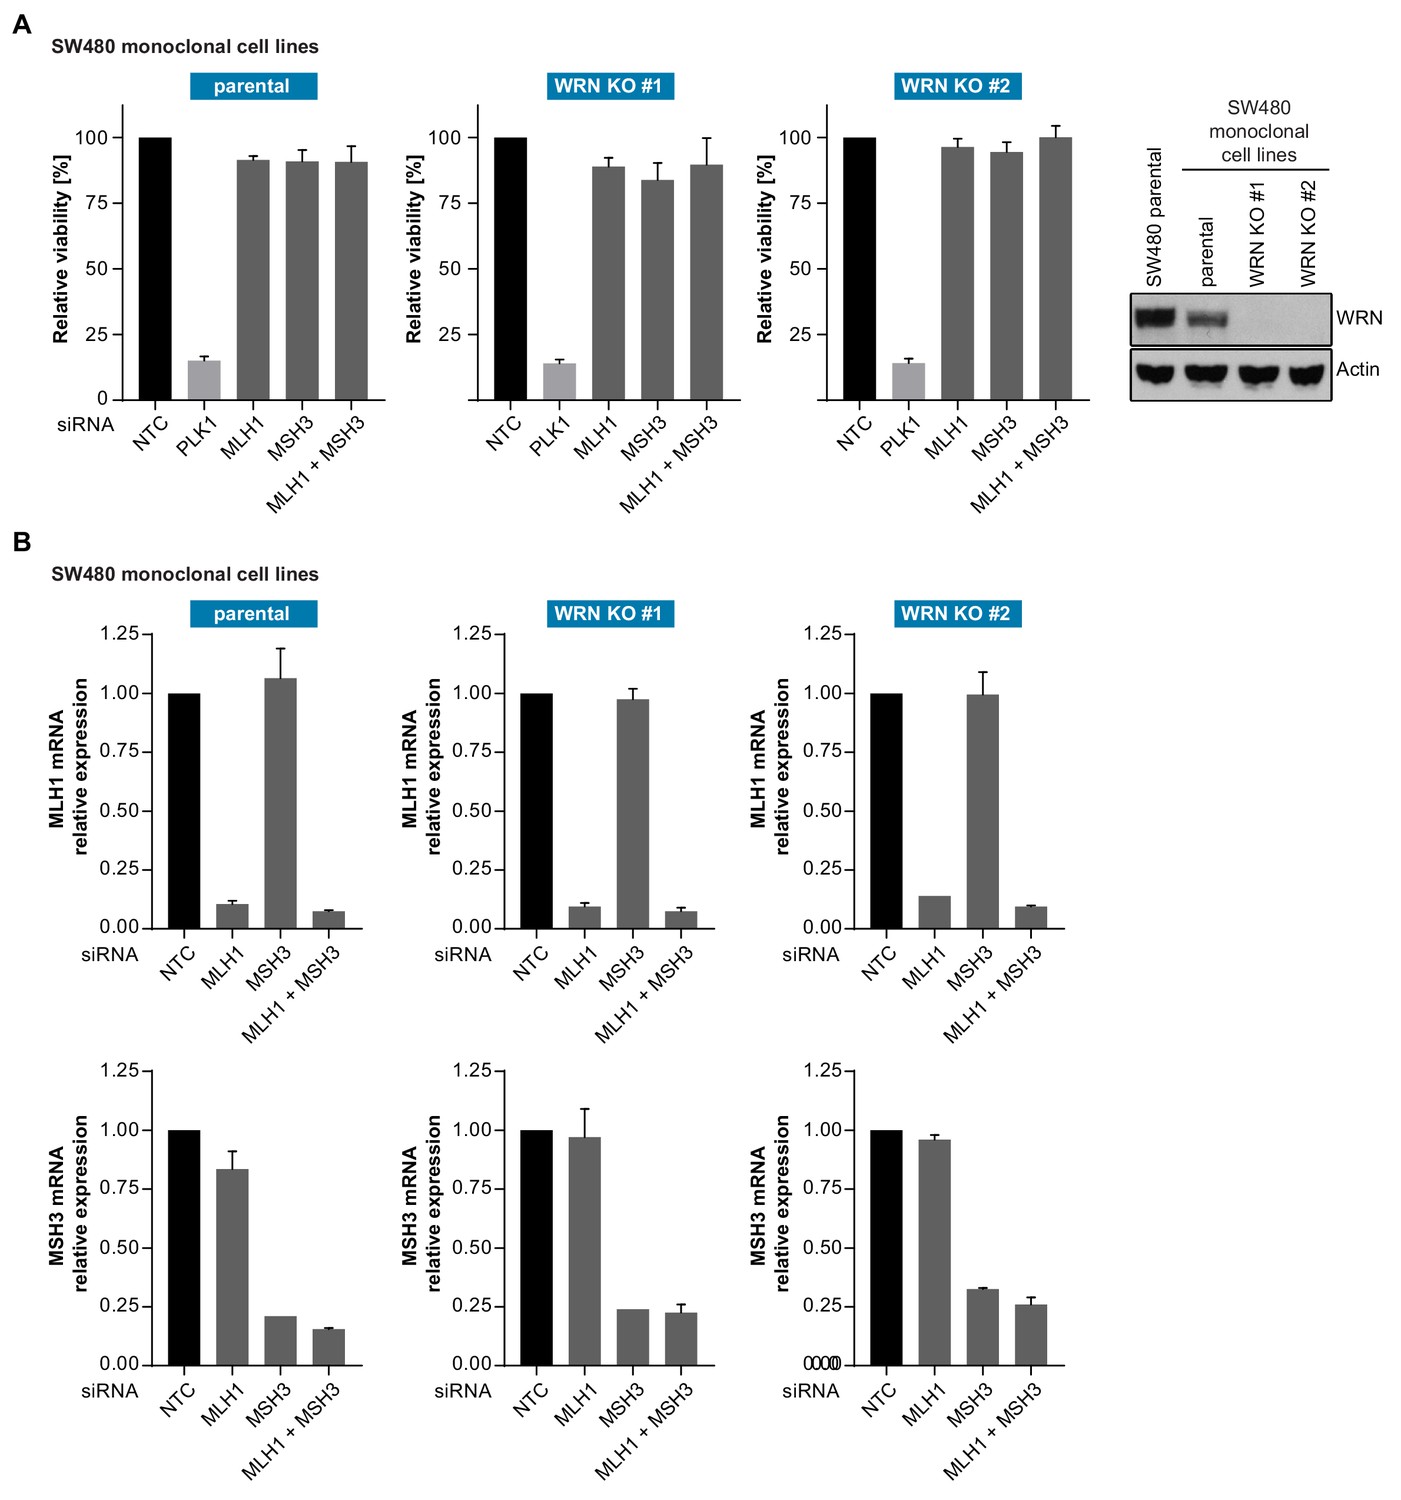
WRN inactivation does not elicit dependency on MLH1 or MSH3 in MSS SW480 CRC cells.
(A) SW480 monoclonal cell lines were transfected with the indicated siRNAs. Cell viability was determined 7 days after transfection and is shown relative to non-targeting control (NTC) siRNA. Knock-out of WRN was confirmed by immunoblot, Actin expression was used to monitor equal loading. (B) MLH1 and MSH3 siRNA knock-down efficacy was analyzed by qRT-PCR. RNA lysates were prepared 48 hr after transfection. MLH1 and MSH3 mRNA expression is normalized to 18S rRNA levels. Data information: In (A), data are presented as mean ± SD of three independent experiments. In (B), data are presented as mean ± SD of two independent experiments.
Figure 3 with 1 supplement
CRISPR-Cas9-mediated knock-out of WRN confirms the selective dependency of MSI-H CRC models on WRN.
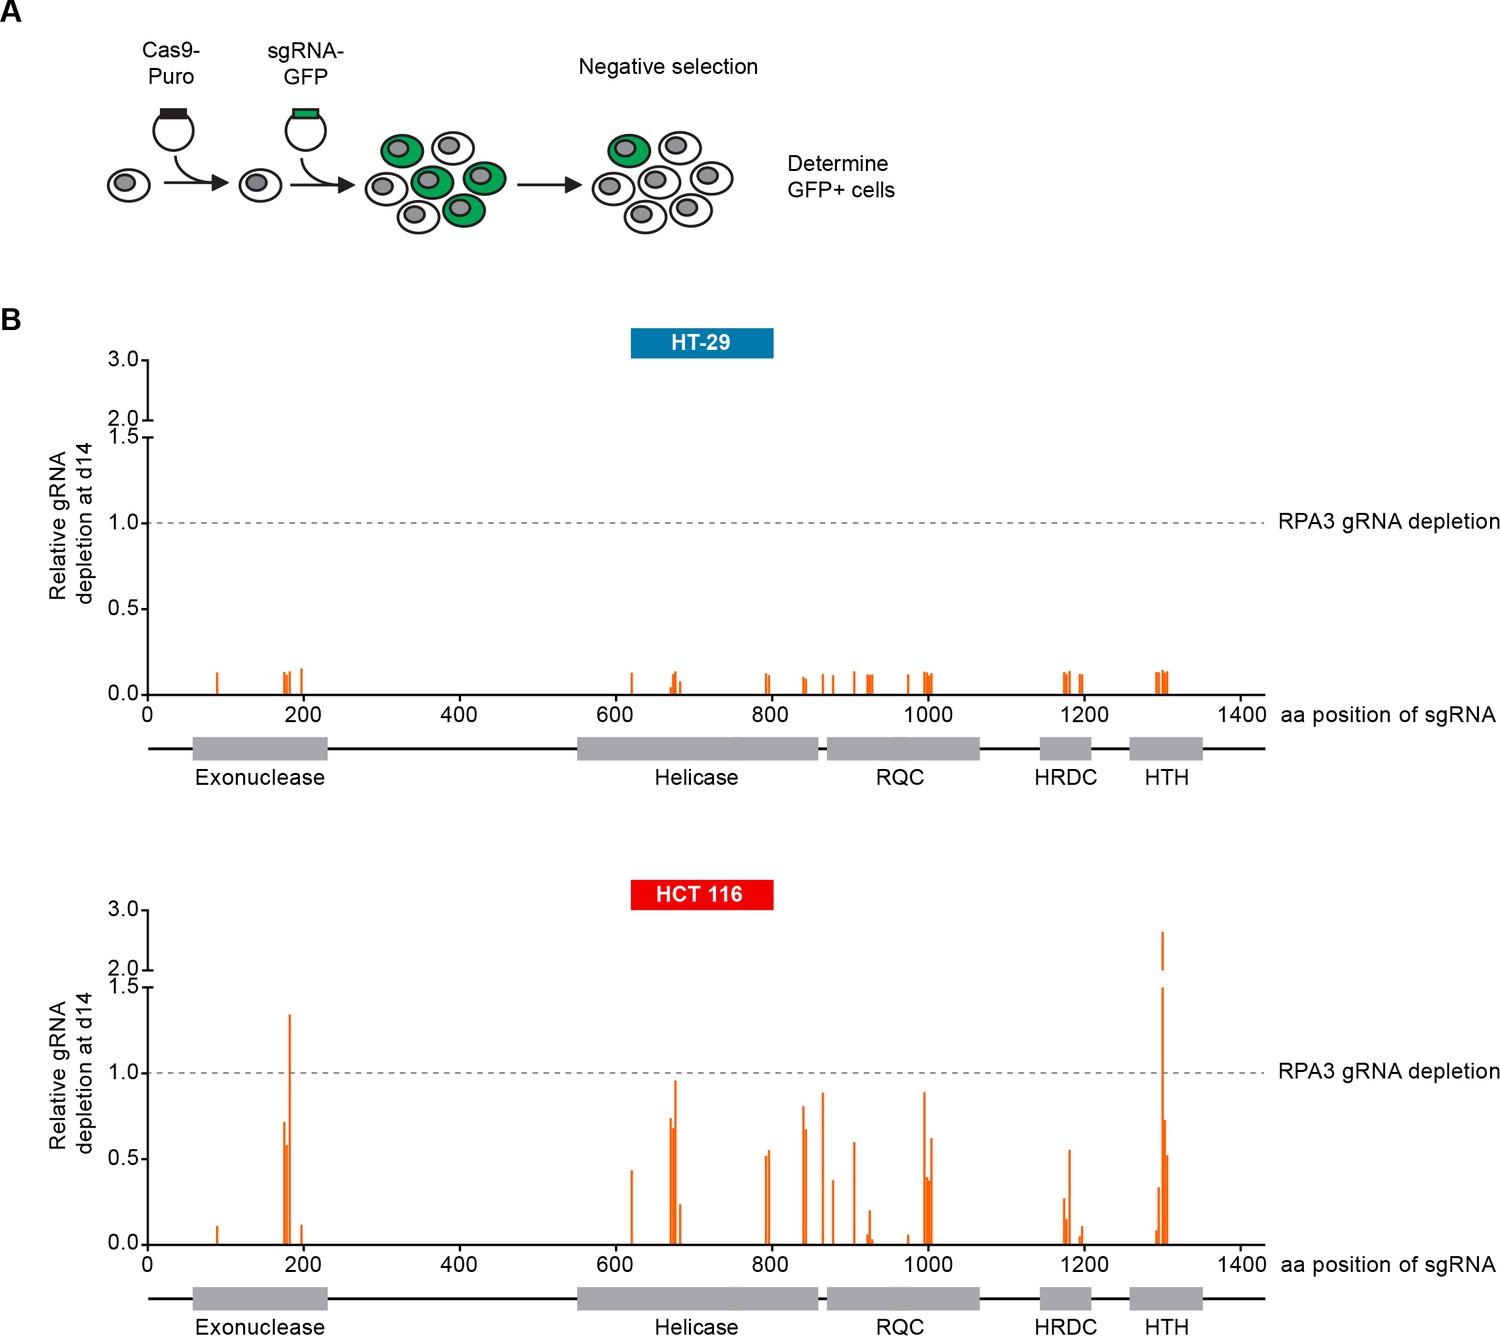
(A) Schematic representation of CRISPR-Cas9 depletion assays. Cas9 expressing cells were transduced with a lentivirus encoding GFP and sgRNAs. The percentage of GFP-positive cells was determined over time by flow cytometry. (B) Cas9 expressing MSS or MSI-H CRC cells were transduced with a lentivirus encoding GFP and sgRNAs targeting multiple domains in WRN as indicated. The percentage of GFP-positive cells was determined 14 days post-transduction and normalized to the fraction of GFP-positive cells at the first measurement. Depletion ratios are shown relative to the positive control RPA3 (n = 1 experimental replicate). Domains are annotated according to PFAM entry Q14191. RQC, RecQ helicase family DNA-binding domain; HRDC, Helicase and RNase D C-terminal, HTH, helix-turn-helix motif.
Figure 3—figure supplement 1
CRISPR-Cas9-mediated knock-out of WRN confirms the selective dependency of MSI-H CRC models on WRN.
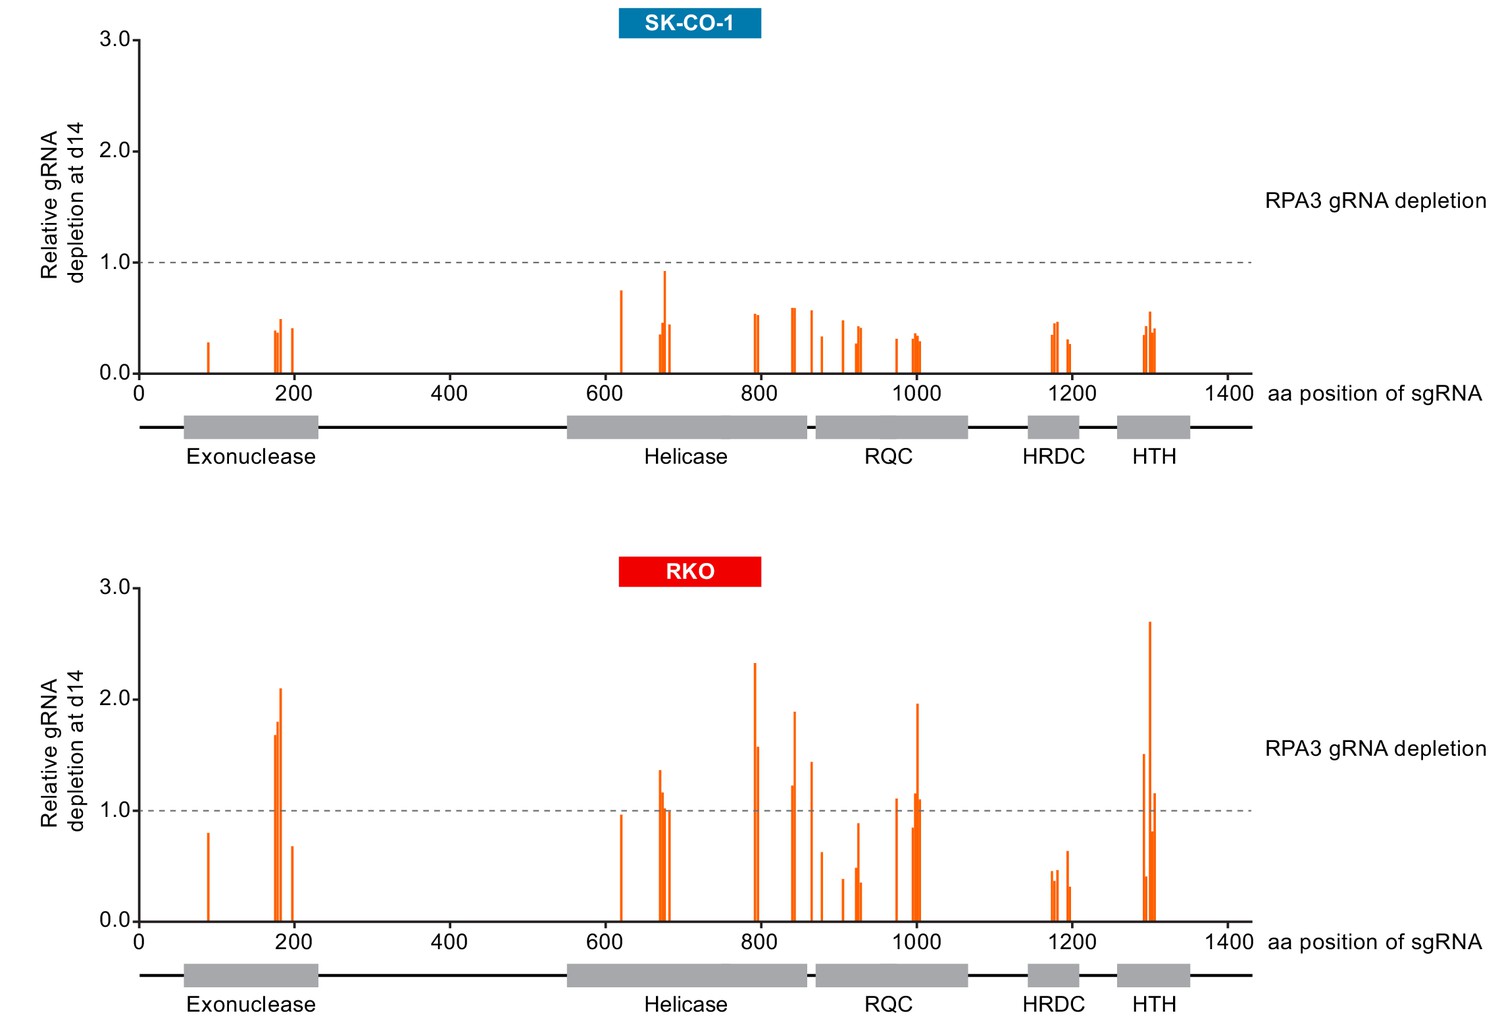
Cas9-GFP expressing MSS or MSI-H CRC cells were transduced with a lentivirus encoding GFP and sgRNAs targeting multiple domains in WRN as indicated. The percentage of GFP-positive cells was determined 14 days post-transduction and normalized to the fraction of GFP-positive cells at the first measurement. Depletion ratios are shown relative to the pan-essential positive control RPA3 (n = 1 experimental replicate). Domains are annotated according to PFAM entry Q14191. RQC, RecQ helicase family DNA-binding domain; HRDC, Helicase and RNase D C-terminal, HTH, helix-turn-helix motif.
Figure 4 with 1 supplement

WRN dependency in MSI-H cancer cell lines is linked to its helicase function.
(A) Schematic representation of WRN domain structure. Location of nuclease- and ATPase-inactivating mutations in siRNA-resistant WRN (WRNr) expression constructs is indicated. (B) MSI-H CRC HCT 116 cells were stably transduced with FLAG-tagged wild-type or mutant forms of WRNr and monoclonal lines with similar WRNr expression levels were isolated. For WRNr wild-type, two clones with high and low transgene expression were selected to cover the expression range of WRNr variants. Anti-FLAG immunofluorescence analysis was performed to monitor homogenous expression of WRNr. Expression of WRNr wild-type and mutant forms and endogenous protein levels were determined using immunoblotting with anti-FLAG and anti-WRN antibodies. GAPDH expression was used to monitor equal loading. Scale bar, 20 µM. (C) WRNr-expressing HCT 116 cells were transfected with the indicated siRNAs. Cell viability was determined 7 days after transfection and is shown relative to NTC siRNA. Data information: In (C), data are presented as mean ± SD of three independent experiments.
Figure 4—figure supplement 1
WRN dependency in MSI-H cancer cell lines is linked to its helicase function.
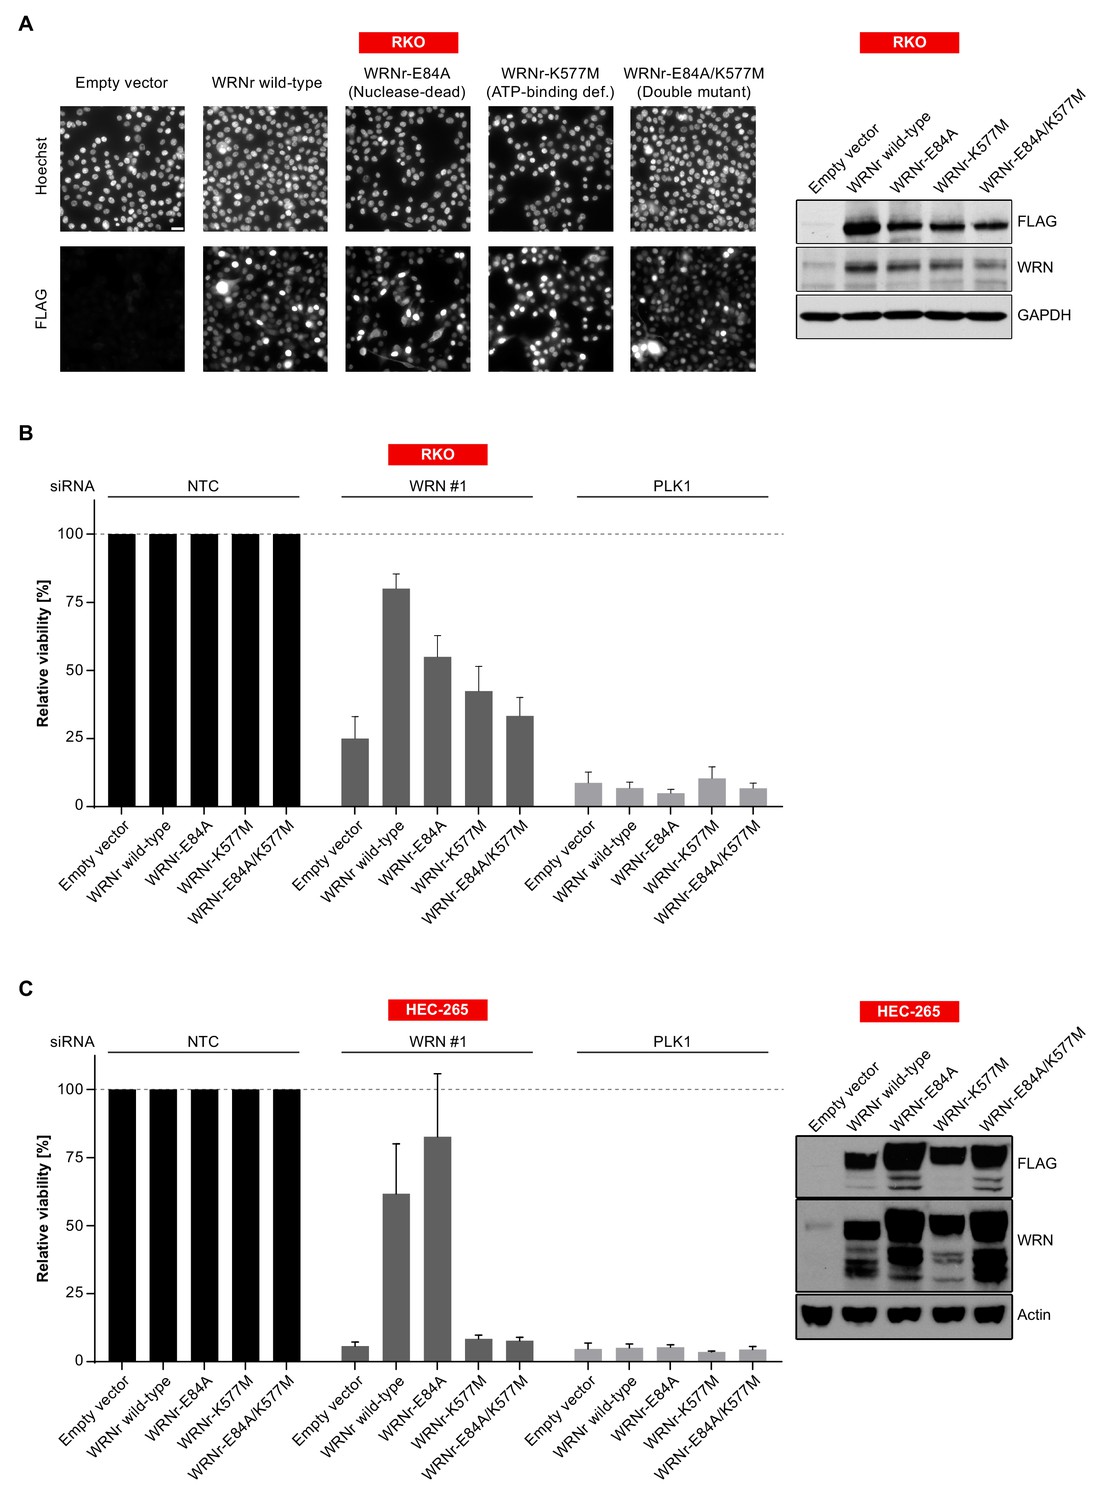
(A) MSI-H CRC RKO cells were stably transduced with FLAG-tagged wild-type or mutant forms of WRNr. Anti-FLAG immunofluorescence analysis was performed to monitor homogenous expression of WRNr. Overexpression of WRNr wild-type and mutant forms compared to endogenous protein levels was determined using immunoblotting with anti-FLAG and anti-WRN antibodies. GAPDH expression was used to monitor equal loading. Scale bar, 20 µM. (B) WRNr-expressing RKO cells were transfected with the indicated siRNAs. Cell viability was determined 7 days after transfection and is shown relative to NTC siRNA. (C) MSI-H endometrial carcinoma HEC-265 cells were stably transduced with FLAG-tagged wild-type or mutant forms of WRNr. WRNr-expressing HEC-265 cells were transfected with the indicated siRNAs. Cell viability was determined 7 days after transfection and is shown relative to NTC siRNA. Overexpression of WRNr wild-type and mutant forms compared to endogenous protein levels was determined using immunoblotting with anti-FLAG and anti-WRN antibodies. Actin expression was used to monitor equal loading. Data information: In (B) and C), data are presented as mean ± SD of three independent experiments.
Figure 5
WRN loss-of-function in MSI-H CRC results in nuclear morphology and integrity defects.
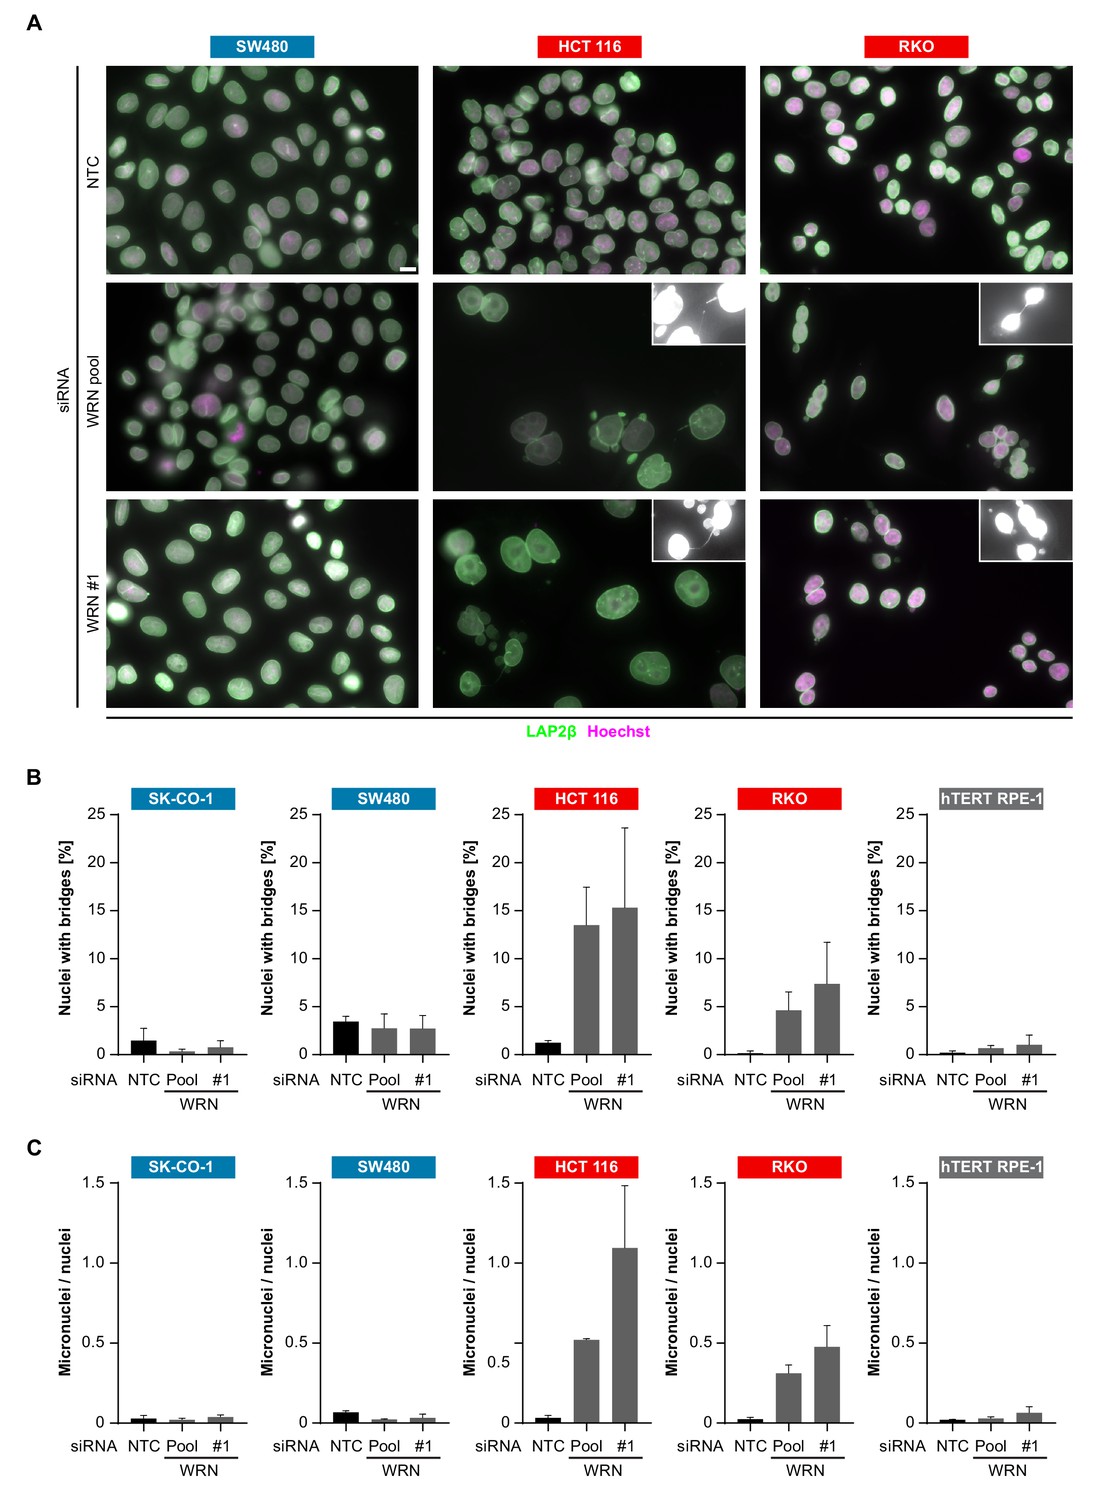
(A) MSS and MSI-H CRC cell lines were transfected with the indicated siRNAs. Immunofluorescence analysis was performed 96 hr after transfection to determine the fraction of cells with chromosomal bridges and micronuclei. Examples with enhanced brightness are shown as insets. LAP2β signal intensity was adjusted in a subset of samples for uniform representation. Scale bar, 10 µm. (B) Statistical analysis of chromosomal bridge phenotypes observed in siRNA knock-down studies in MSS and MSI-H CRC lines and hTERT RPE-1 non-transformed cells. (C) Statistical analysis of micronuclei phenotypes observed in siRNA knock-down studies in MSS and MSI-H CRC lines and hTERT RPE-1 non-transformed cells. Data information: In (B and C), data are presented as mean ± SD of two or three independent experiments (n ≥ 410 cells).
Figure 6
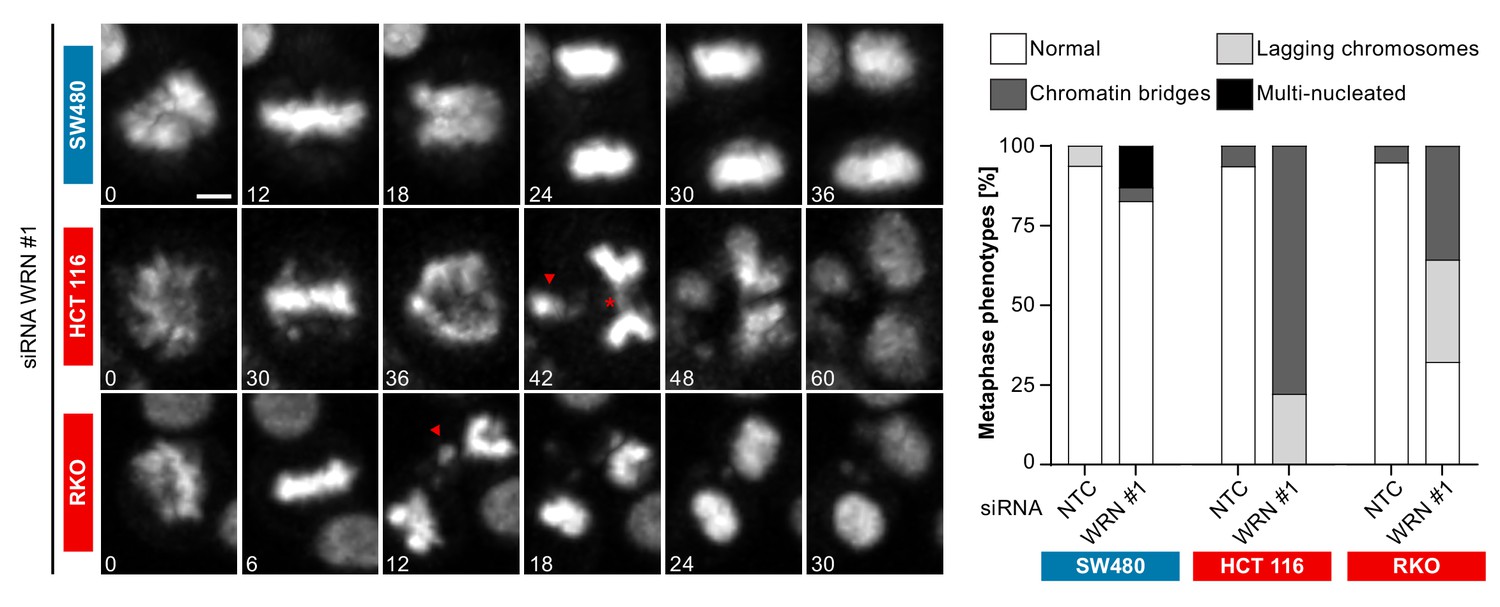
Time-lapse analysis of mitosis in WRN-depleted MSS and MSI-H CRC models.
Mitotic live cell imaging in WRN-depleted MSS and MSI-H CRC cell lines. Cells were transfected with WRN siRNA #1. Cells were stained with SiR-Hoechst dye and were analyzed 24 hr post siRNA transfection. Exemplary lagging chromosomes (arrowhead) and a chromatin bridge (asterisk) are designated. Duration of time-lapse is indicated in minutes. Scale bar, 5 µM.
Figure 7 with 1 supplement
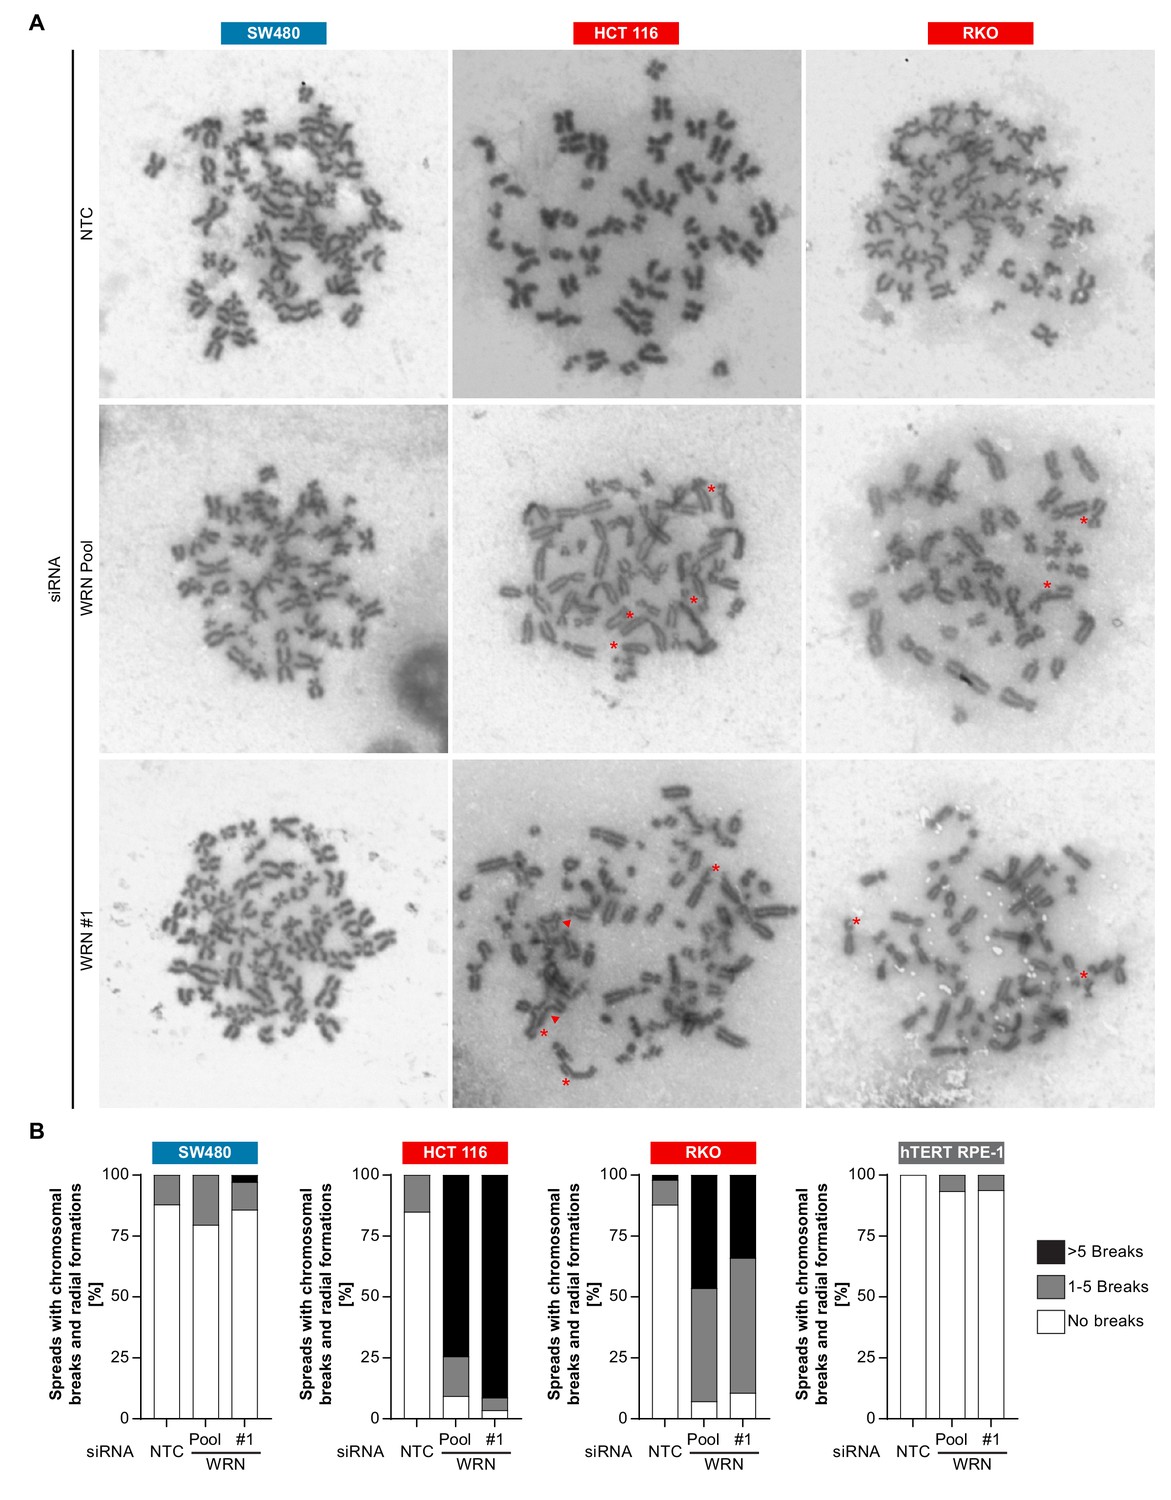
Loss of WRN function in MSI-H CRC causes severe chromosomal defects.
(A) MSS and MSI-H CRC cell lines were transfected with the indicated siRNAs. Mitotic chromosome spreads were prepared 72 hr after transfection and visualized by microscopy. Non-homologous radial formations are designated by arrows, breaks are labeled with asterisks. (B) Quantification of chromosomal defects observed in siRNA knock-down studies in MSS and MSI-H CRC lines and hTERT RPE-1 non-transformed cells. The status of chromosomal breaks of individual metaphase spreads was categorized into normal, 1–5 breaks or more than five breaks (n ≥ 28 spreads of two independently analyzed slides). Non-homologous radial formation was counted as two breaks.
Figure 7—figure supplement 1
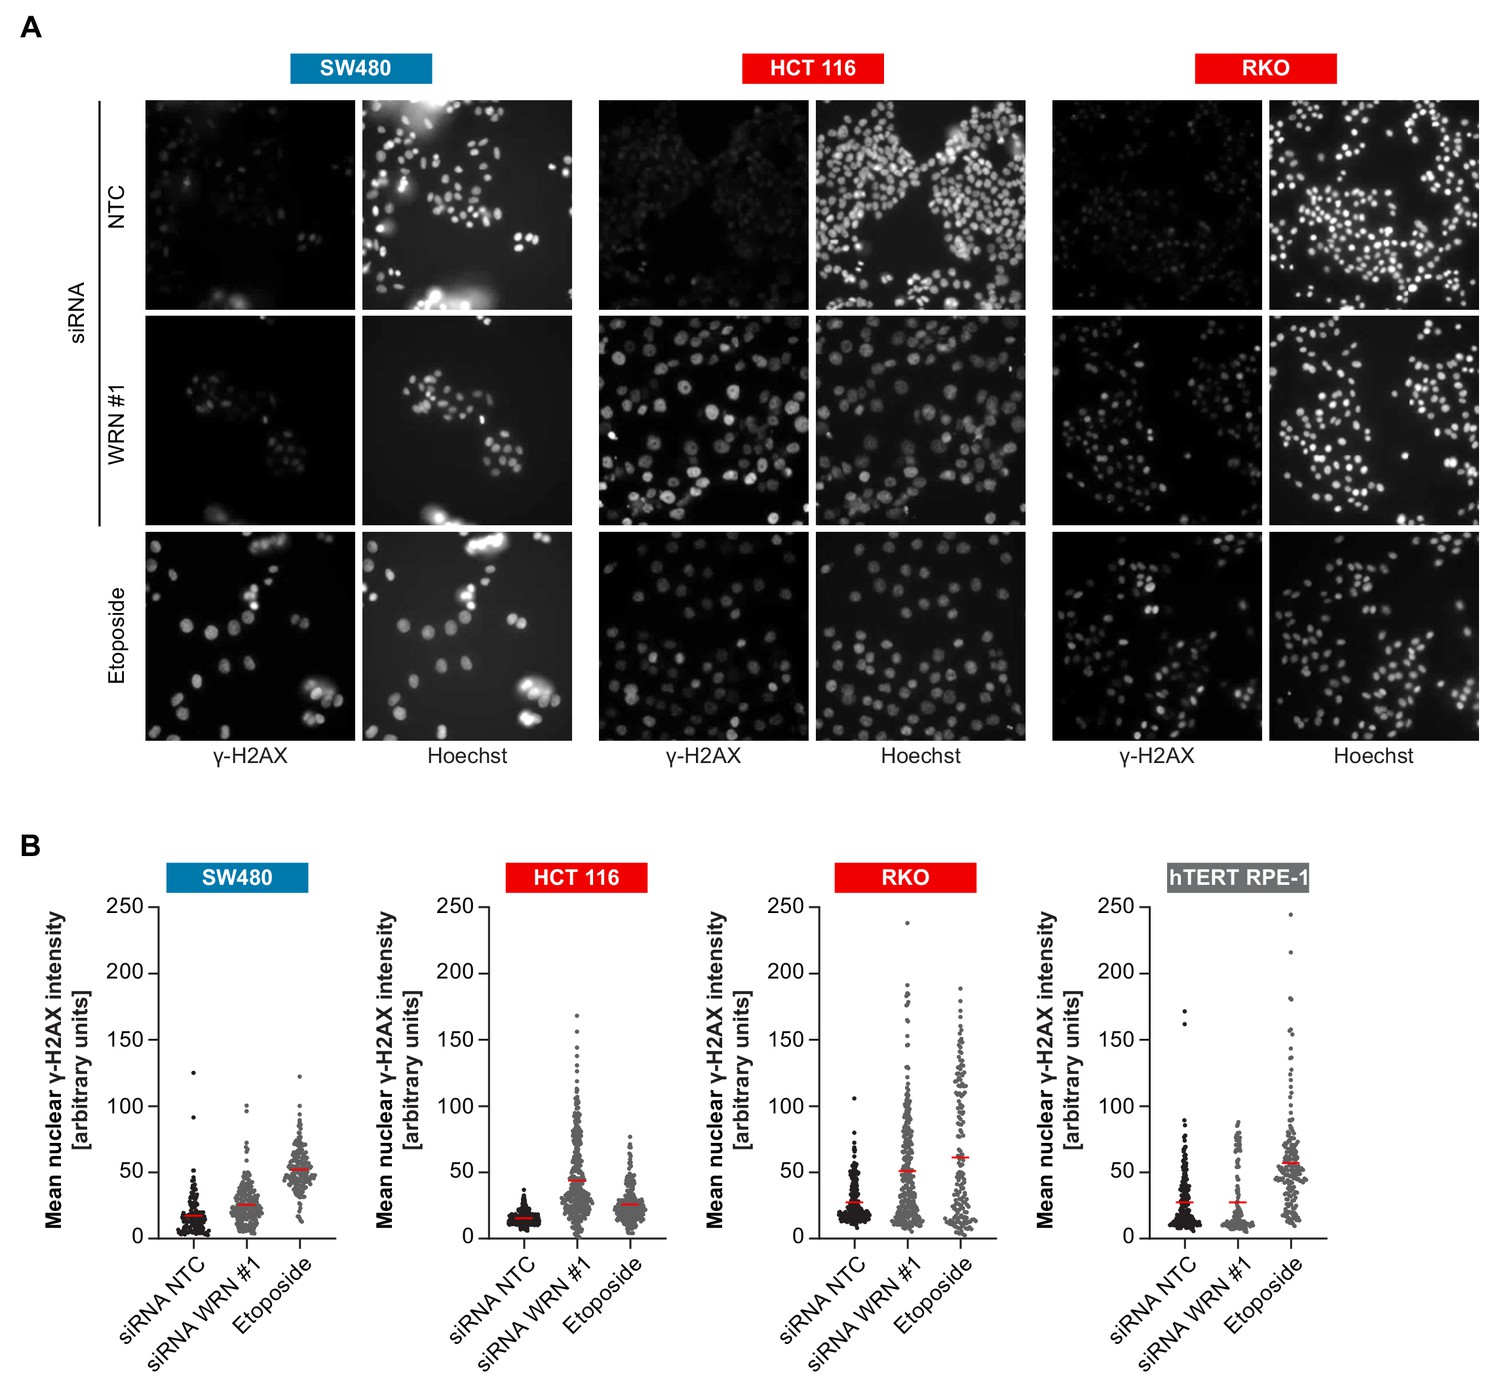
Elevated levels of the DNA damage marker γ-H2AX upon loss of WRN function in MSI-H CRC cells.
(A) MSS and MSI-H CRC cell lines were transfected with the indicated siRNAs or treated with 5 µM etoposide. Immunofluorescence analysis was performed 72 hr after transfection or 24 hr post etoposide treatment. (B) Quantitative analysis of γ-H2AX mean nuclear intensities upon siRNA-mediated knock-down of WRN or etoposide treatment in MSS and MSI-H CRC lines and hTERT RPE-1 non-transformed cells. Data information: In (B), individual values and mean of two independent experiments (n ≥ 140 cells) are presented.
Author response image 1
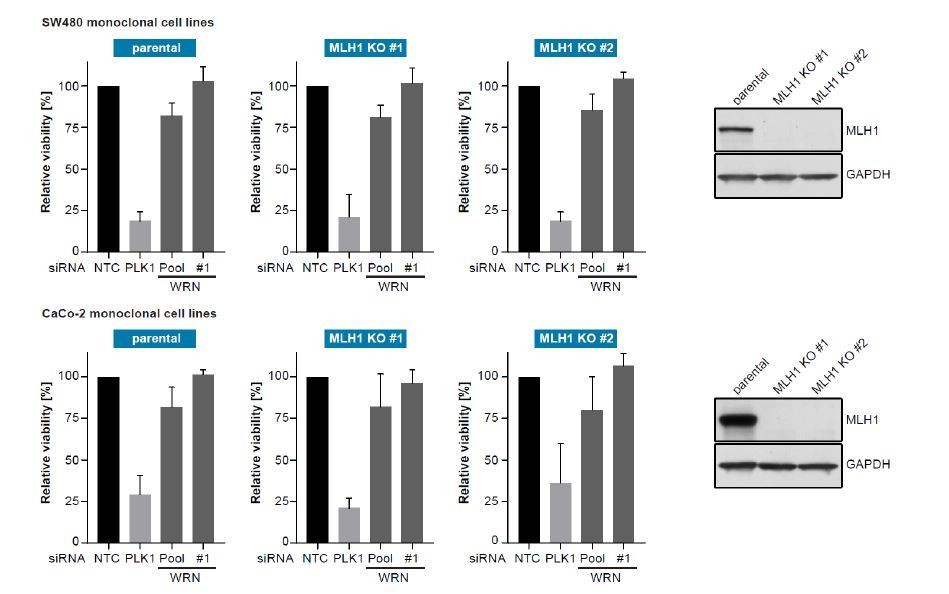
SW480 (upper panel) and CaCo-2 (lower panel) parental and MLH1-knock-out monoclonal CRC cell lines were transfected with the indicated siRNAs.
Cell viability was determined 7 days after transfection and is shown relative to non-targeting control (NTC) siRNA (n=3 biological replicates; error bars denote standard deviation). Knock-out of MLH1 was confirmed by immunoblotting.
Author response image 2

Left panel: List of MSI target genes and positive/negative control genes included in the siRNA knock-down analysis.
Cyclophilin was included as a negative control gene; PLK1, PSMA1 and SGO1 are used as positive control genes. siRNA targeting WRN was also include in the analysis. NTC, non-targeting control siRNA. Right panel: Effect of siRNA-mediated knock-down of MSI target gens on viability of parental and WRN-knock-out SW480 cell lines.
Tables
Key resources table
| Reagent type (species) or resource | Designation | Source or reference | Identifiers | Additional information |
|---|---|---|---|---|
| Gene (Homo sapiens) | Werner Syndrome RecQ Like Helicase (WRN) | N/A | Entrez Gene: 7486 | |
| Genetic reagent (Homo sapiens) | NTC siRNA | Dharmacon | D-001810–10 | non-targeting siRNA pool |
| Genetic reagent (Homo sapiens) | WRN siRNA pool | Dharmacon | L-010378–00 | WRN-targeting siRNA pool |
| Genetic reagent (Homo sapiens) | WRN siRNA | Dharmacon | J-010378–05 | WRN-targeting siRNA |
| Cell line (Homo sapiens) | HCT 116 | ATCC | RRID:CVCL_0291 | MSI-H CRC cell line |
| Cell line (Homo sapiens) | RKO | ATCC | RRID:CVCL_0504 | MSI-H CRC cell line |
| Cell line (Homo sapiens) | SW480 | ATCC | RRID:CVCL_0546 | MSS CRC cell line |
| Cell line (Homo sapiens) | SK-CO-1 | ATCC | RRID:CVCL_0626 | MSS CRC cell line |
| Cell line (Homo sapiens) | hTERT RPE-1 | ATCC | RRID:CVCL_4388 | Non-transformed telomerase immortalized cell line |
| Antibody | mouse anti-WRN | Cell Signaling | RRID:AB_10692114 | 1/1000 dilution for immunoblot |
| Antibody | mouse anti-GAPDH | Abcam | RRID:AB_2107448 | 1/30000 dilution for immunoblot |
| Antibody | mouse anti-FLAG | SIGMA | RRID:AB_262044 | 1/1000 dilution for immunoblot |
| Antibody | mouse anti-LAP2ß | BD Transduction Laboratories | RRID:AB_398313 | 1/100 for immunofluorescence analysis |
| Recombinant DNA reagent | pLVX-WRN-3x FLAG-IRES-Puro | This study | Lentiviral vector for stable expression of WRN wild-type | |
| Recombinant DNA reagent | pLVX-WRN-3x FLAG-IRES-Puro E84A | This study | Lentiviral vector for stable expression of WRN E84A mutant | |
| Recombinant DNA reagent | pLVX-WRN-3x FLAG-IRES-Puro K577M | This study | Lentiviral vector for stable expression of WRN K577M mutant | |
| Recombinant DNA reagent | pLVX-WRN-3x FLAG-IRES-Puro E84A _K577M | This study | Lentiviral vector for stable expression of WRN E84A/K577M double mutant | |
| Other | Drive database | PMID 28753431 | Functional genomics database on cancer cell line dependencies |
Author response table 1
Cell lines were plated at initial densities of 1000 or 2000 cells per well of a 96-well plate.
The following day, cells were treated with the indicated inhibitors at concentrations ranging from 10 to 0.04 µM (0.5 to 0.002 µM for panobinostat). Cell viability was determined 7 days after treatment. Data for NSC 19630, ML-216 and panobinostat are representative IC50 values from three experiments, NSC 617145 IC50 values are from a single analysis.
| Tumor Type | MSS/MSI status | Cell line | NSC 617145 IC50 [µM] | NSC 19630 IC50 [µM] | ML-216 IC50 [µM] | Panobinostat IC50 [µM] |
| CRC | MSS | SK-CO-1 | 7.09 | 3.11 | >10 | 0.011 |
| MSS | SW480 | 2.14 | 3.32 | >10 | 0.028 | |
| MSS | SW480_wt_clone | 1.83 | 4.09 | >10 | 0.018 | |
| MSS | SW480_WRN_KO_clone#1 | 1.73 | 2.64 | >10 | 0.016 | |
| MSS | SW480_WRN_KO_clone#2 | 1.38 | 3.73 | >10 | 0.022 | |
| MSI | HCT 116 | 8.87 | 4.99 | 4.40 | 0.012 | |
| MSI | RKO | >10 | 6.39 | >10 | 0.044 | |
| Endometrial carcinoma | MSS | MFE-280 | 4.54 | 3.38 | 5.71 | 0.009 |
| MSI | HEC-265 | 7.74 | 6.80 | >10 | 0.021 | |
| MSI | ISHIKAWA | >10 | 5.55 | >10 | 0.016 | |
| Non-transformed | MSS | hTERT-RPE-1 | 4.34 | 5.54 | >10 | 0.035 |
-
[Editors' note: further revisions were requested prior to acceptance, as described below.]
Additional files
-
Supplementary file 1
MSS/MSI-H status analysis of CRC, endometrial and gastric carcinoma cell lines.
MSS/MSI-H status was analyzed using fluorescent PCR-based analysis of the mononucleotide microsatellite markers NR-21, BAT-26, BAT-25, NR-24 and MONO-27. Main peak sizes for the mononucleotide microsatellite markers are shown for the MSS control cell line K562 and CRC, endometrial and gastric carcinoma cell lines. Cell models were classified as MSS (blue) or MSI-H (red) according to the indicated size range classification of MSS alleles.
- https://doi.org/10.7554/eLife.43333.016
-
Supplementary file 2
Overview of cell lines used in this study.
Cell lines used in this study are listed with tumor type of origin, MSS/MSI-H status, vendor source, and STR confirmation status. Variable STR profiles are reported for ISHIKAWA cells, consistent with MSI-H status (Korch et al., 2012).
- https://doi.org/10.7554/eLife.43333.017
-
Supplementary file 3
Sequences of sgRNAs used for CRISPR depletion studies.
Sequences of sgRNAs used for targeting WRN are listed in N- to C-terminal order according to the representation in Figure 3 and Expanded View Figure 3. Domains are annotated according to PFAM entry Q14191. RQC, RecQ helicase family DNA-binding domain; HRDC, Helicase and RNase D C-terminal, HTH, helix-turn-helix motif. Negative and positive control sgRNA sequences are also listed.
- https://doi.org/10.7554/eLife.43333.018
-
Transparent reporting form
- https://doi.org/10.7554/eLife.43333.019
Download links
A two-part list of links to download the article, or parts of the article, in various formats.
Downloads (link to download the article as PDF)
Open citations (links to open the citations from this article in various online reference manager services)
Cite this article (links to download the citations from this article in formats compatible with various reference manager tools)
Werner syndrome helicase is a selective vulnerability of microsatellite instability-high tumor cells
eLife 8:e43333.
https://doi.org/10.7554/eLife.43333


