Predominance of cis-regulatory changes in parallel expression divergence of sticklebacks
- Max-Planck-Ring, Germany
- University of Helsinki, Finland
Figures
Figure 1 with 6 supplements

Freshwater and marine sticklebacks show parallel expression divergence among a largely non-parallel evolving transcriptome.
(a) Marine and freshwater strains sampled from four different river systems (b) The gill is a multifunctional organ with roles in osmoregulation, respiration and waste excretion. In freshwater gills uptake ions (blue), while in saline water ions are excreted (red). (c) Principal components analysis of normalized expression levels separates marine (red) from freshwater (blue) ecotypes along a composite PC axis (gray line). PCA is calculated based on a sample-size balanced set of Tyne and Little Campbell samples (solid symbols), onto which Forss and Shiel individuals are projected (open symbols).
Figure 1—figure supplement 1
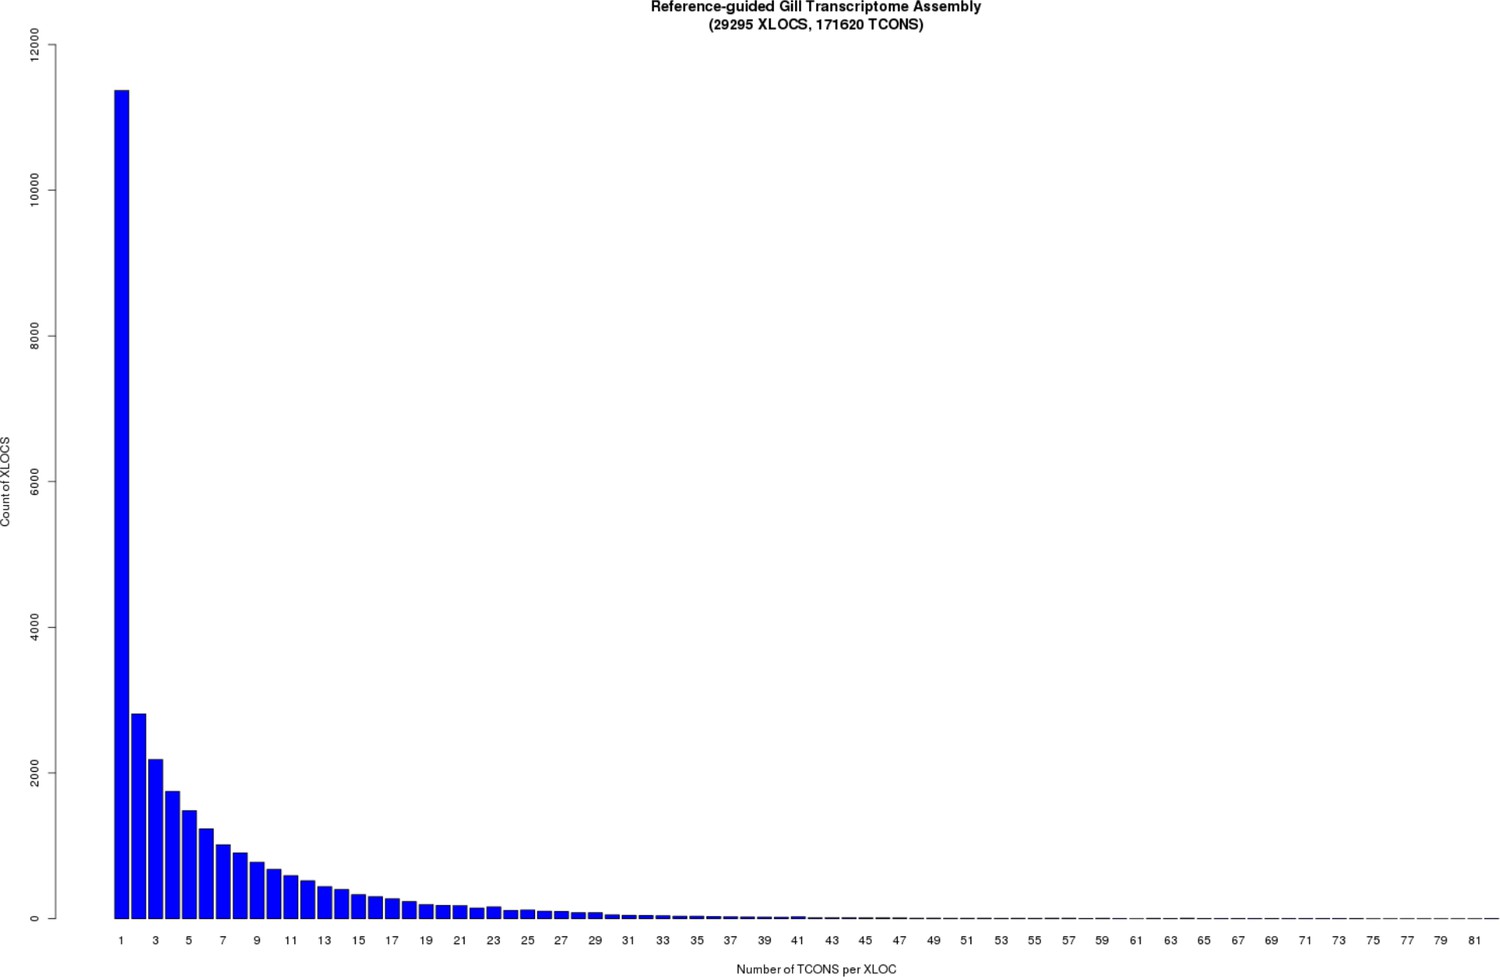
The stickleback gill transcriptome has a highly skewed distribution of isoform variation (number of ‘TCONS’) per expressed locus (‘XLOC’).
While some loci have >50 isoforms per locus, the majority of loci have 3 (median) or less transcripts per locus.
Figure 1—figure supplement 2

Hierarchical clustering of stickleback gill transcriptome by expression level in 20 marine and freshwater fish reared under standard laboratory conditions reveals five major groups of loci based on their average expression level.
The most highly expressed group of genes showing strong enrichment for biological processes with the respiratory function of the gill including mitochondrial respiration, ATP synthesis coupled proton transport and cytoplasmic translation (Appendix 1).
Figure 1—figure supplement 3
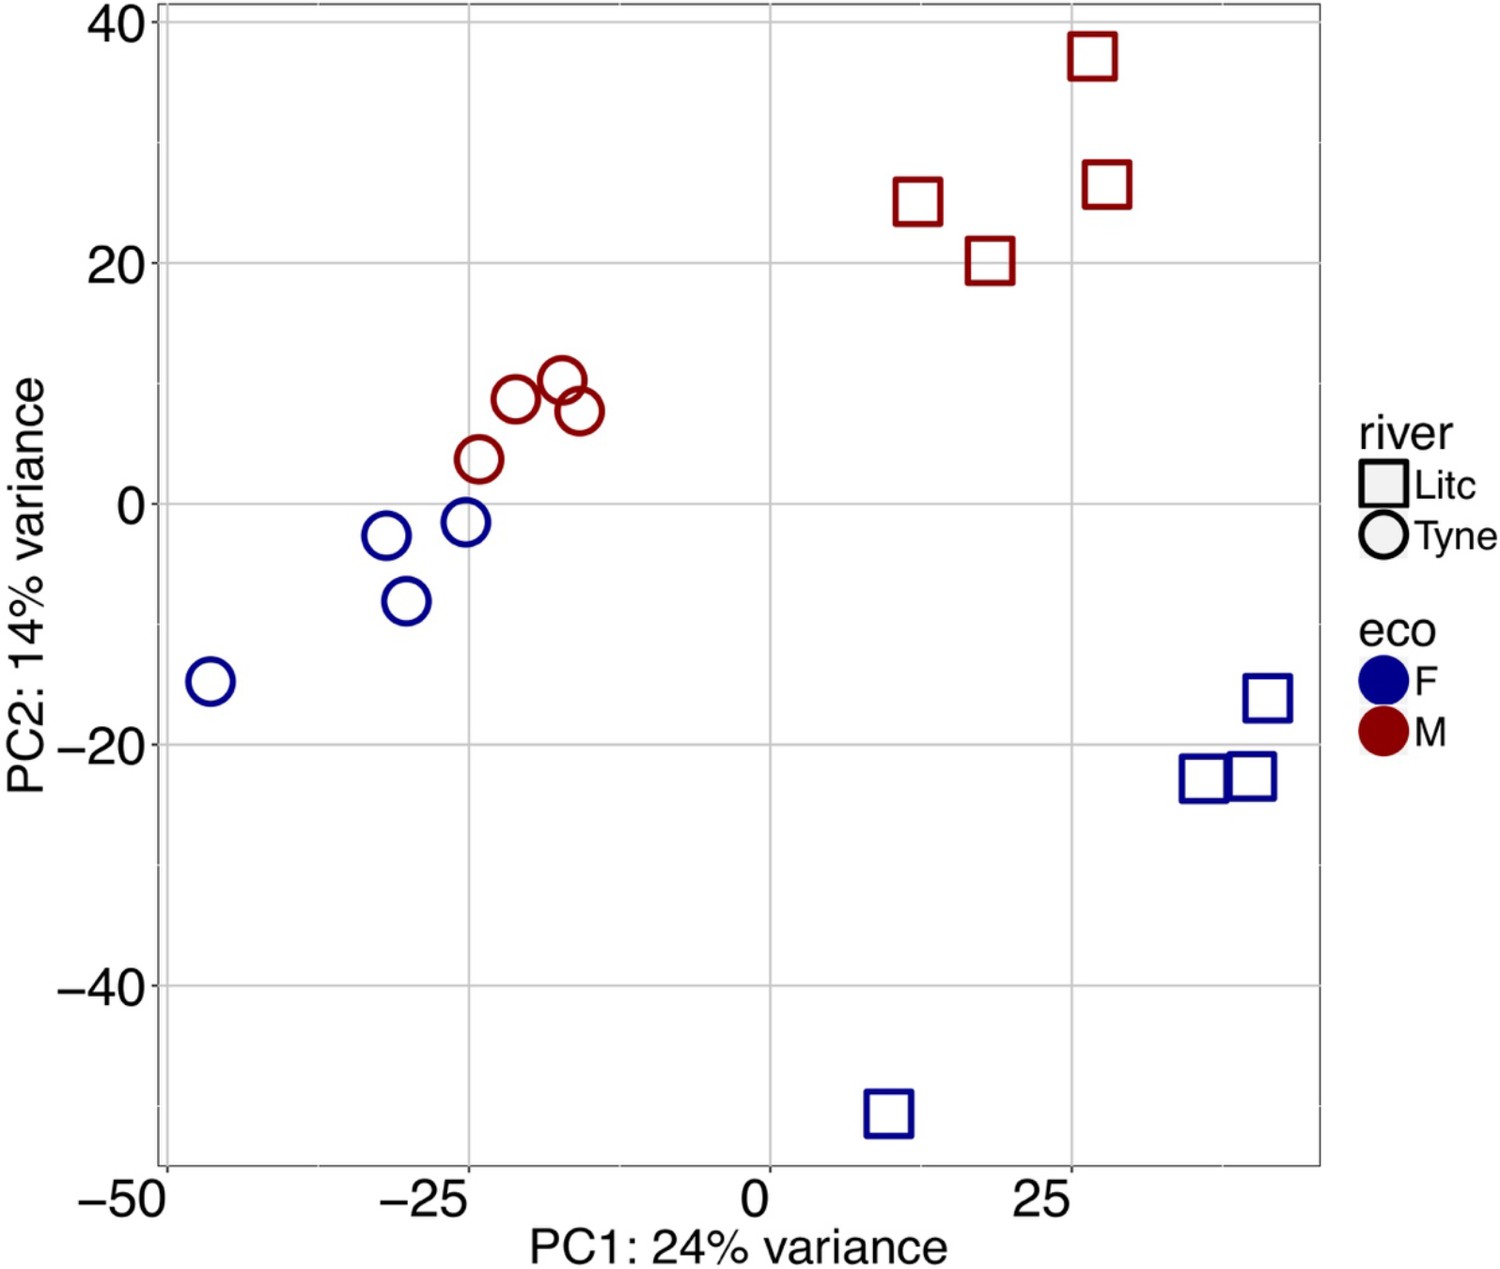
Principal component analysis of gill transcriptomes of Little Campbell and Tyne ecotypes showing principal components 1 and 2 separating individuals by geography (PC1) and ecotype (PC2) respectively.
https://doi.org/10.7554/eLife.43785.005
Figure 1—figure supplement 4
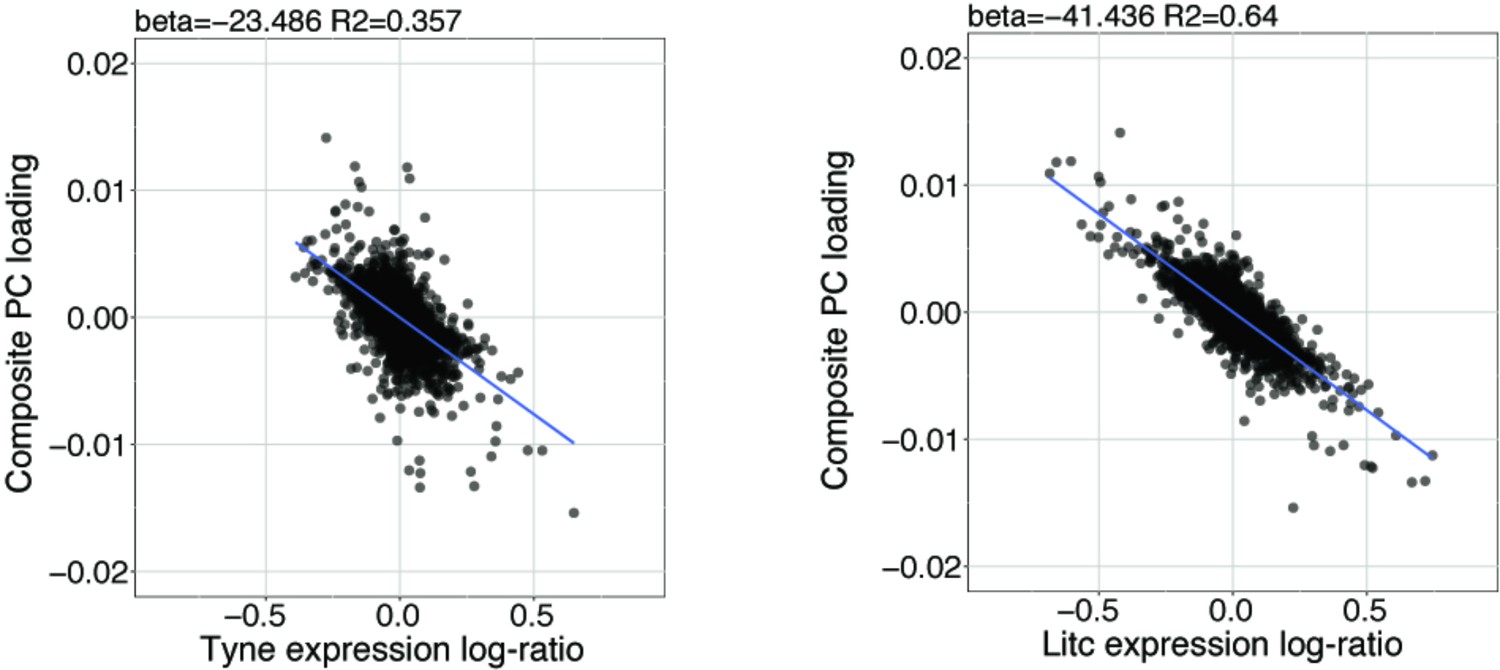
Parallel marine-freshwater divergence in gene expression quantified using the Composite PC loadings (y-axis, see also Figure 1c) is highly correlated with river-specific marine-freshwater divergence in gene expression River Tyne, Scotland (left) and Little Campbell River, Canada (right) quantified as the log of marine/freshwater expression values.
Each point represents a transcript. Negative values on x- and y-axes represent stronger expression in freshwater fish and positive values represent stronger expression in marine fish.
Figure 1—figure supplement 5
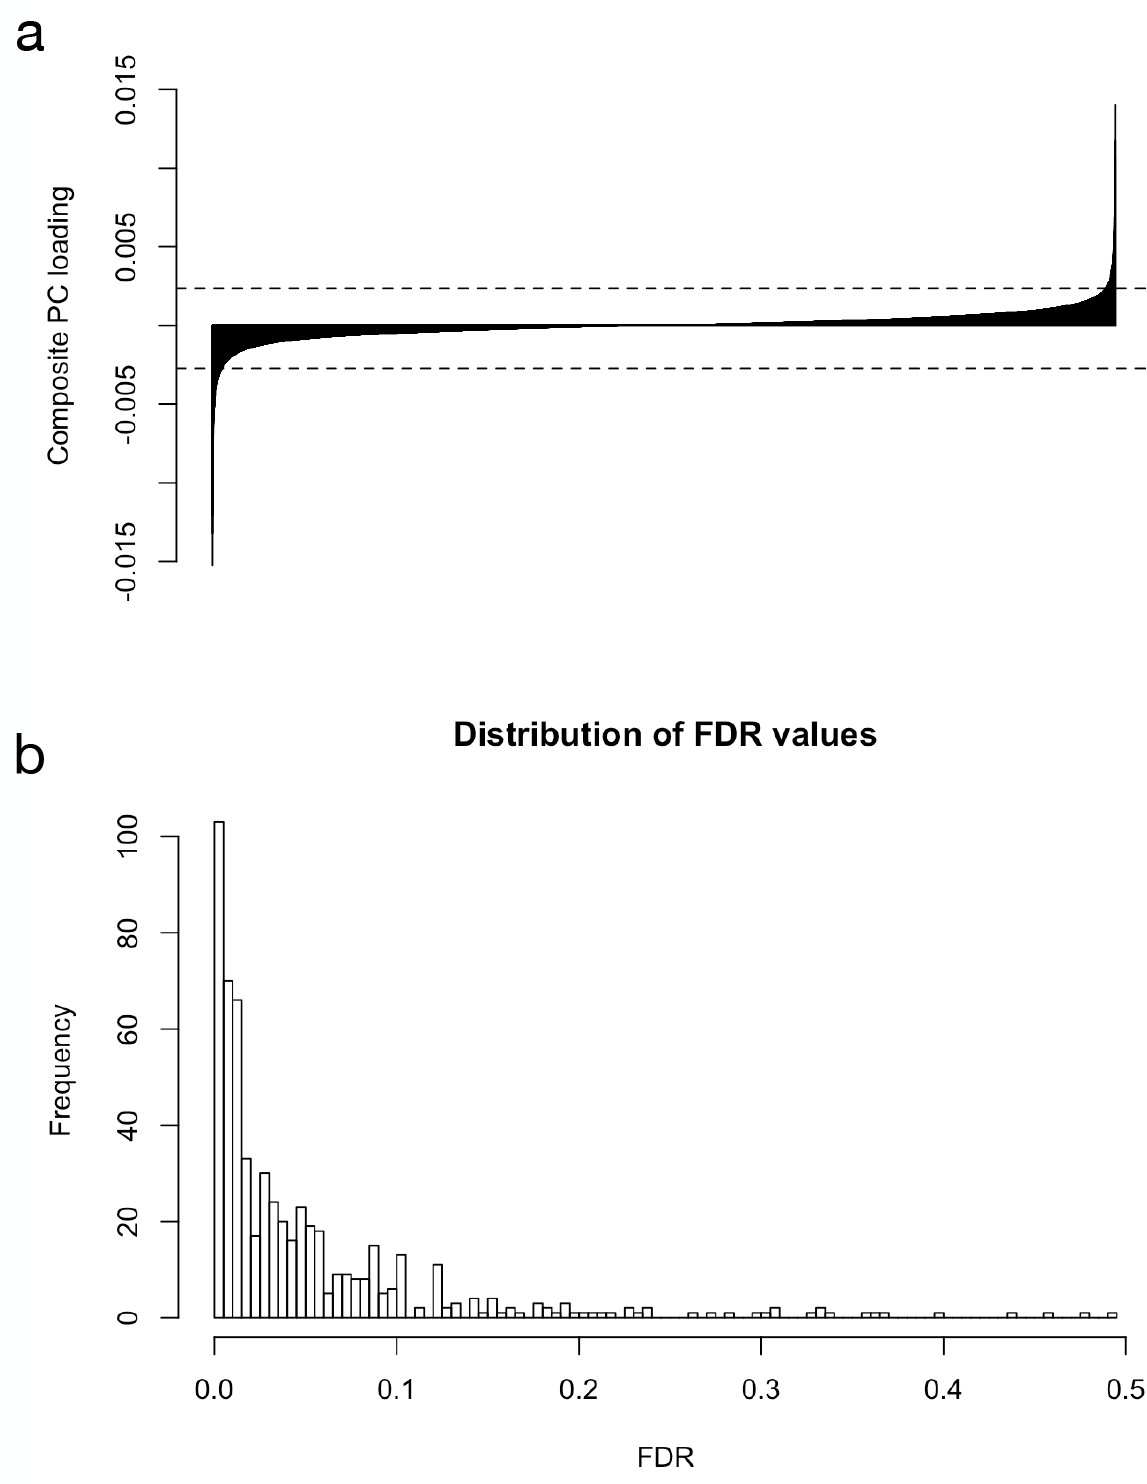
Assignment of parallel diverged genes and their FDR values.
(a) barchart of composite PC loadings sorted by magnitude. Dotted lines show 1% cutoffs for extreme values. (b) distribution of FDR values for the 586 transcripts designated as composite PC outliers (median = 2.6).
Figure 1—figure supplement 6
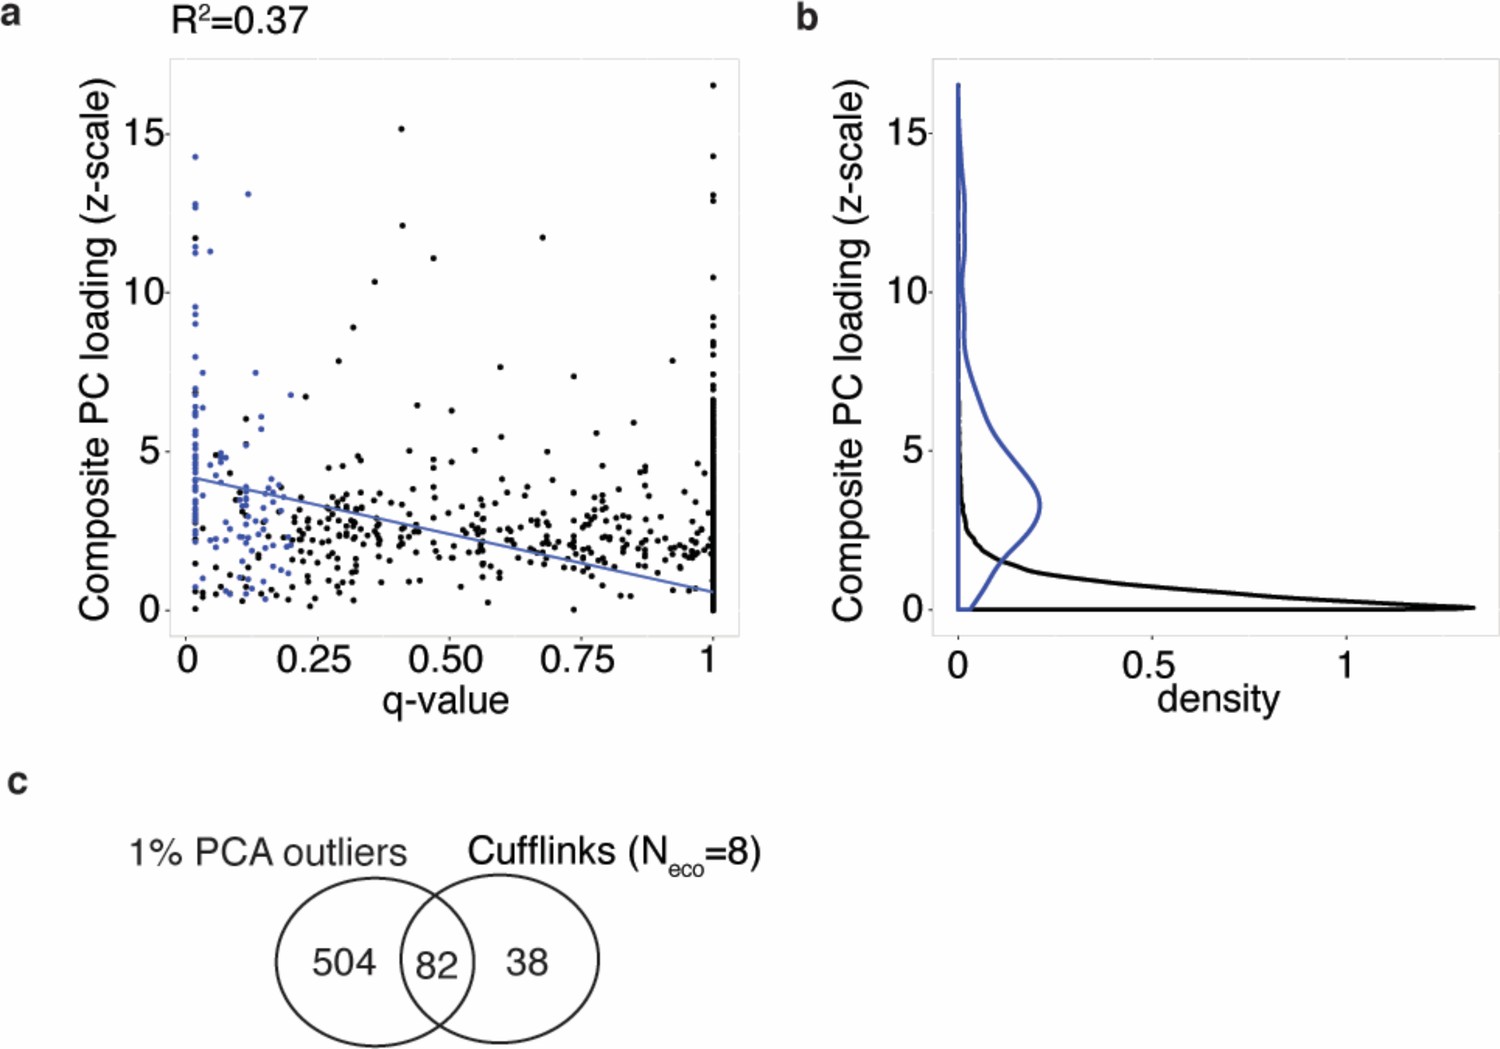
Parallel diverged transcripts identified as per PCA analysis and parametric test overlap.
(a-b) Parallel freshwater-marine differentially expressed transcripts identified using parametric tests (FDR 20%, blue points and density estimation) versus parallel differentially expressed transcripts identified from composite PC loadings. Variation in composite PC loading explains 37% of variation in q-value (blue line). (c) Sharing of parallel freshwater-marine differentially expressed transcripts versus transcripts that have the strongest contribution to sample separation on composite PC (‘PC outliers’, that is. composite PC loading in the lowest or highest 1% of loading distribution and correlated freshwater-marine mean expression difference in Little Campbell and Tyne).
Figure 2 with 3 supplements
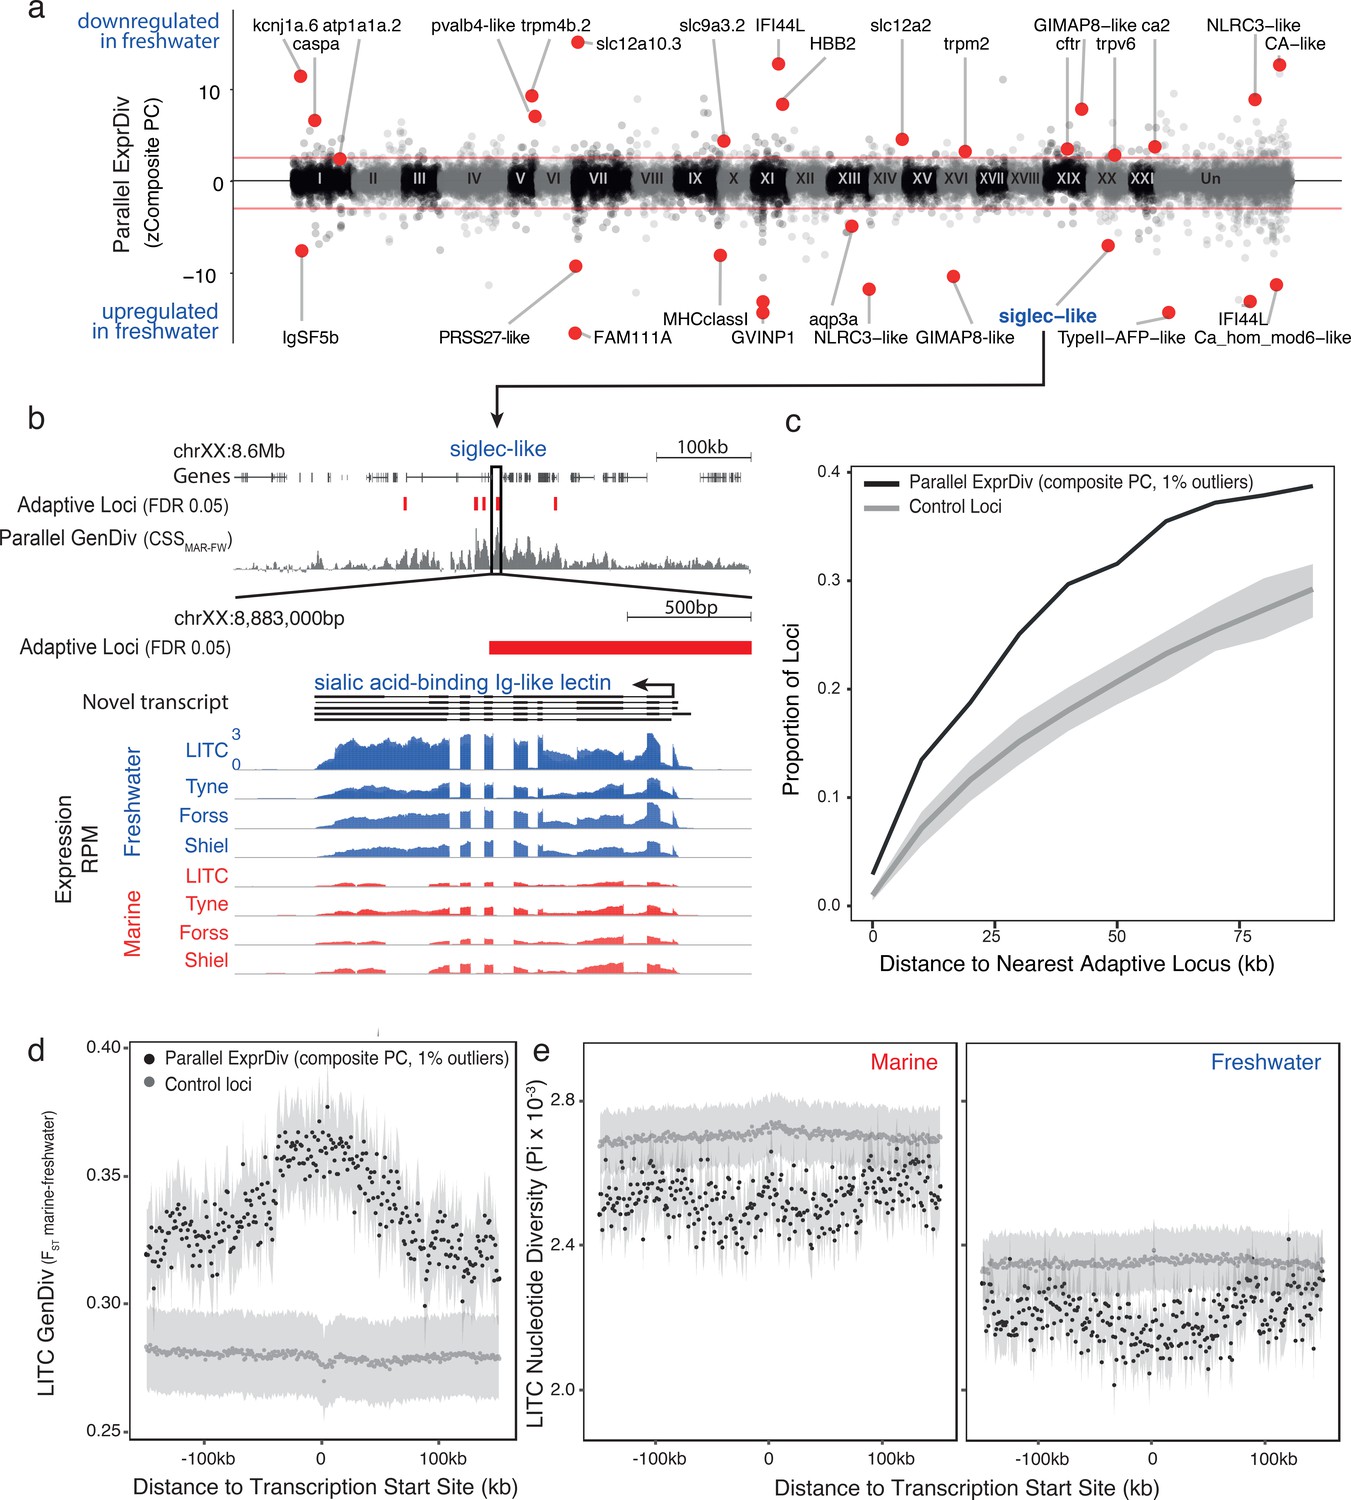
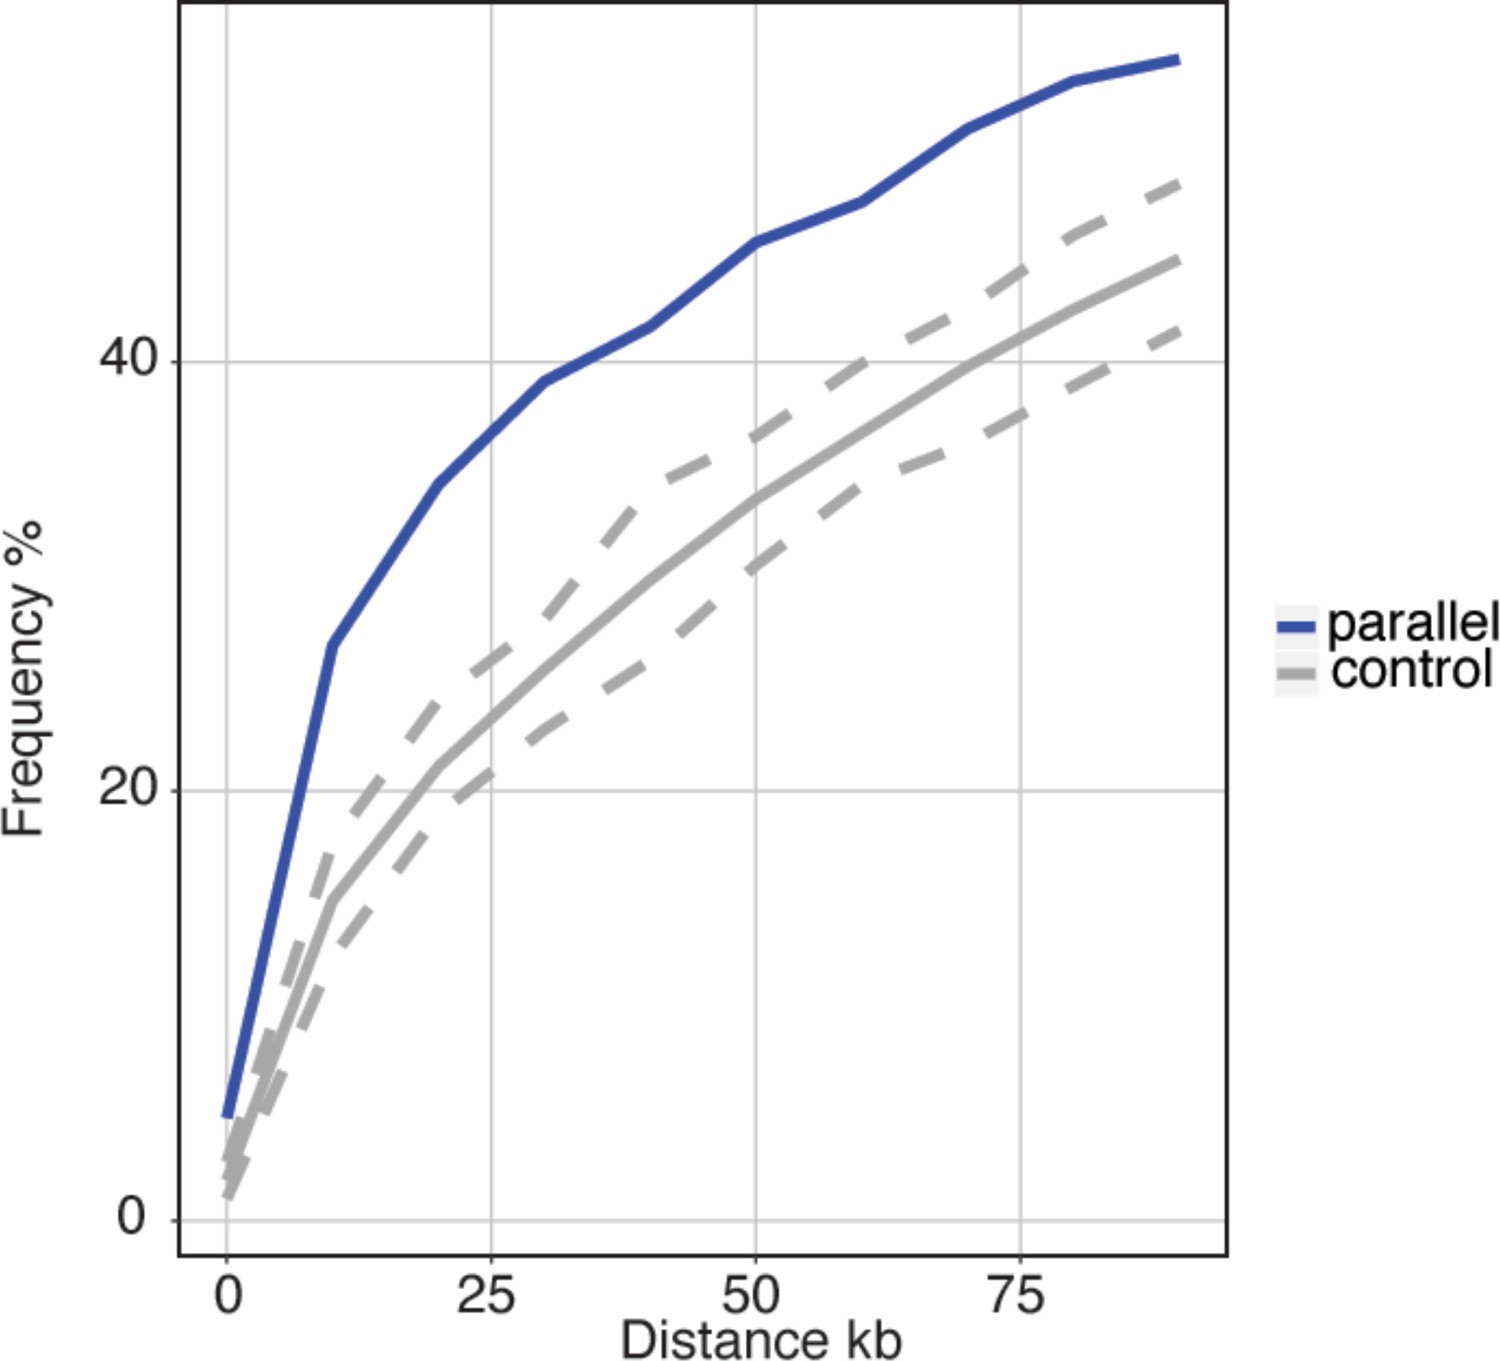
Genes with parallel marine-freshwater expression divergence are proximal to genomic regions underlying marine-freshwater adaptive divergence and show molecular signatures of natural selection.
(a) Z-standardized composite PC loadings (zComposite PC) for each analyzed transcript across the genome highlighting transcripts with strong parallel marine-freshwater divergence in gene expression. Red lines correspond to the upper and lower 1% composite PC quantiles. Genes highlighted with red points have putative roles in ion transport and osmoregulation (kcnj1a.6, atp1a1a.2, pvalb4, trpm4b.2, slc12a1, slc12a10.3, slc9a3.2, trpm2, trpv6, cftr, ca2, CA-like, aqp3a), calcium homeostasis (FAM111A, ca_hom_mod6-like), respiration (HBB2), cold temperature adaptation (TypeII AFP), jaw, gill and skeletal morhpogenesis (caspa, FAM111a), and immune system function (IFSF5b, caspa, PRSS27, MHCclassI, GVINP1, IFI44L (x2), GIMAP8-like (x2), NLRC3-like (x2), siglec). (b) An example highlighting the proximity of parallel differentially expressed genes to adaptive loci is a novel transcript coding for a sialic-acid binding Ig-like lectin. This gene shows strong parallel expression divergence among freshwater and marine ecotypes from all four river-systems and overlaps a previously identified adaptive locus with a signature of parallel marine-freshwater genomic divergence (CSS FDR 0.05, Jones et al., 2012) (c) Across the genome, loci with strong parallel expression divergence (loci in the upper and lower 1% quantiles of composite PC, black line) are more proximal to adaptive loci identified in Jones et al. (2012) than randomly sampled ‘control’ loci (gray line). Gray shading shows 95% confidence intervals from 100 random samples of 586 transcripts. (d and e) In marine and freshwater fish from the Little Campbell River (LITC), loci with strong parallel expression divergence show molecular signatures of natural selection (d, increased genetic divergence FST; and e, decreased nucleotide diversity, Pi) centered around their transcription start sites (black points) compared to control loci (expressed loci showing non-parallel expression divergence). Points represent mean values of 1 kb sliding windows and gray shading shows the standard error of the mean.
Figure 2—figure supplement 1
Transcripts with parallel expression divergence are in close spatial proximity to regions of the genome that show elevated parallel genetic divergence (CSS outlier loci) among marine and freshwater fish from the River Tyne and Little Campbell that were genome sequenced in this study.
https://doi.org/10.7554/eLife.43785.010
Figure 2—figure supplement 2
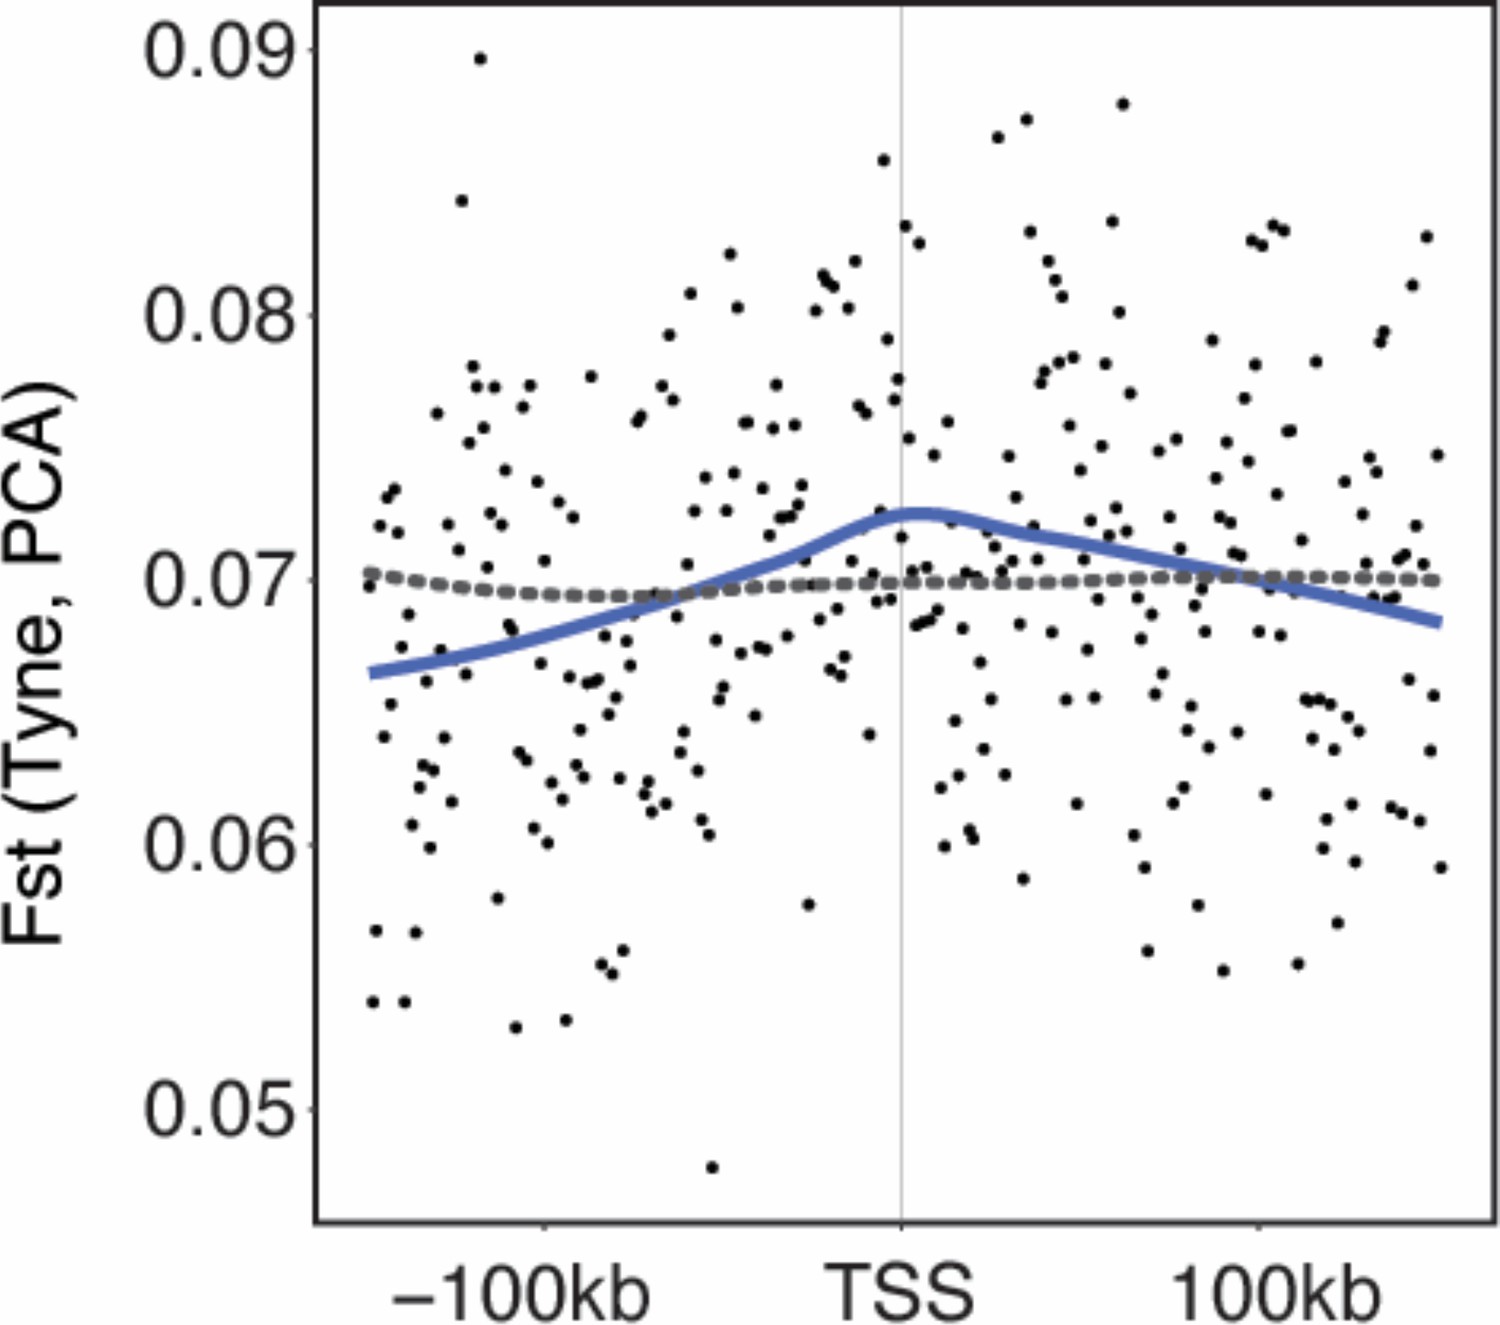
Genetic divergence (FST) calculated in 1 kb windows around the 586 loci with parallel divergent expression (black points with blue line representing mean) relative to randomly sampled loci (gray dashed line) in Tyne populations.
https://doi.org/10.7554/eLife.43785.011
Figure 2—figure supplement 3
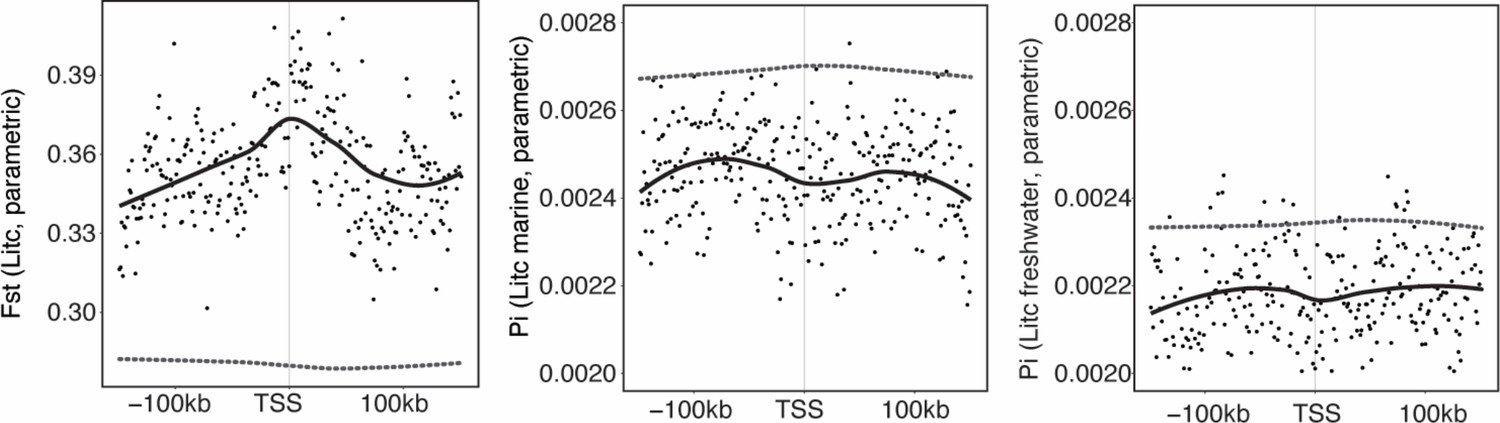
Genetic divergence (Fst) and nucleotide diversity (Pi) associated with loci showing parallel expression divergence defined based on a parametric test performed in cufflinks (Little Campbell).
Black points represent values for 1 kb windows, and solid line a loess smoothed mean. Dashed gray lines represent mean FST for randomly sampled ‘control’ windows. Results for Tyne were non-significant (not shown).
Figure 3 with 4 supplements
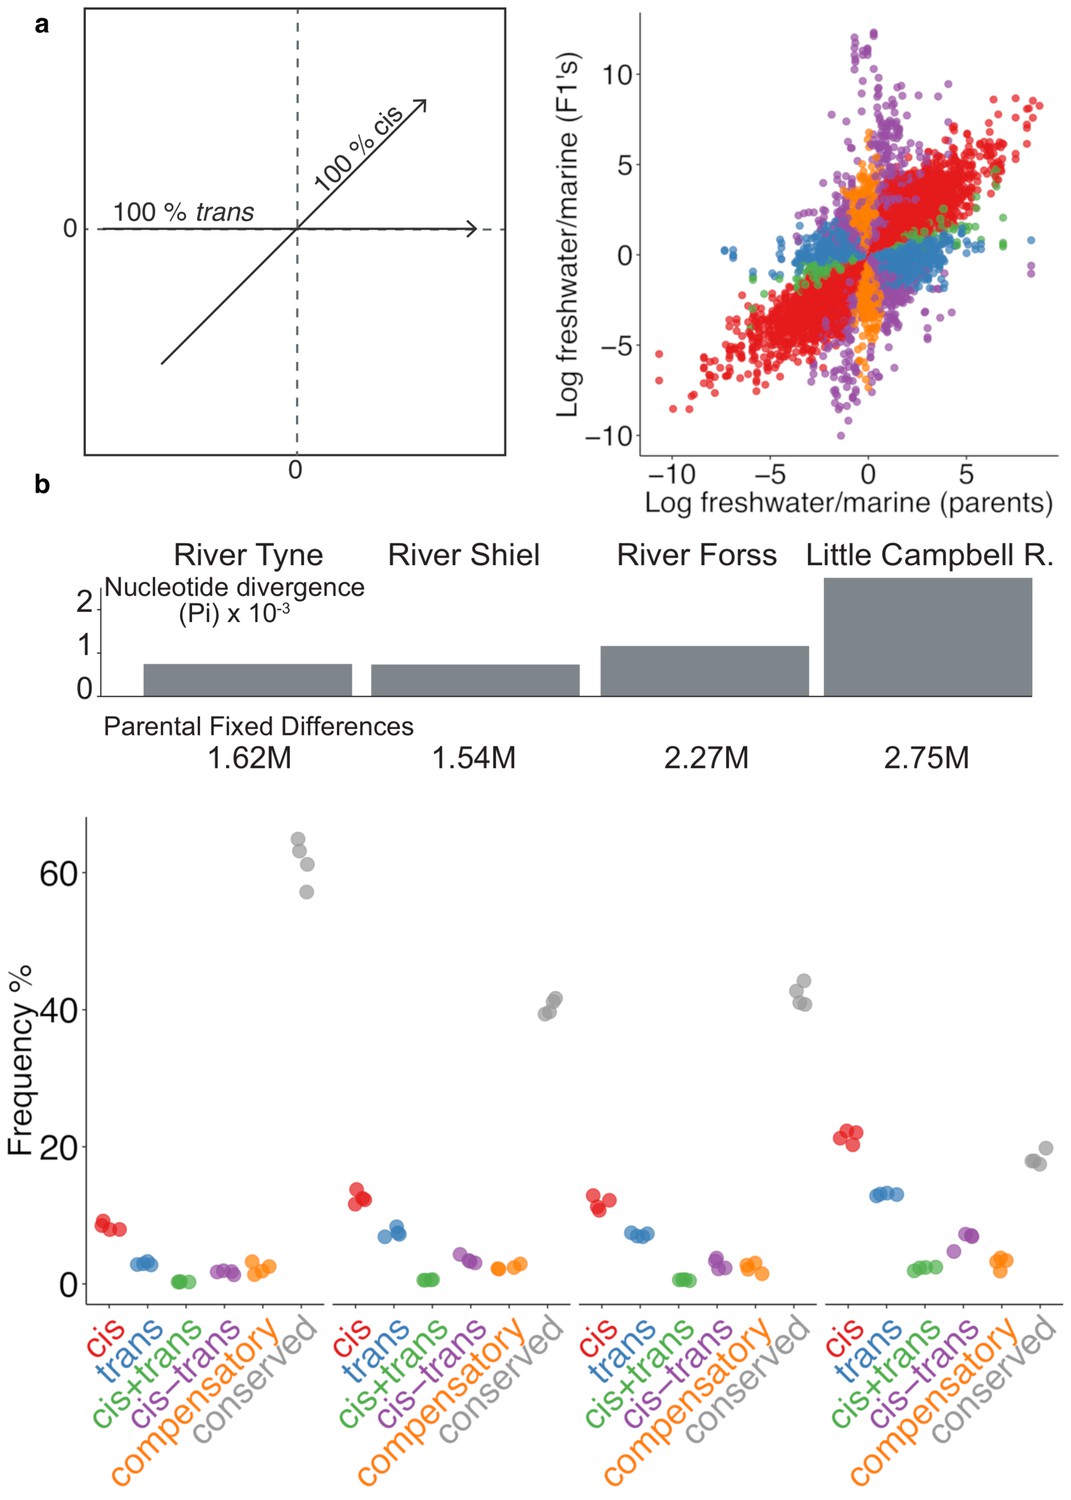
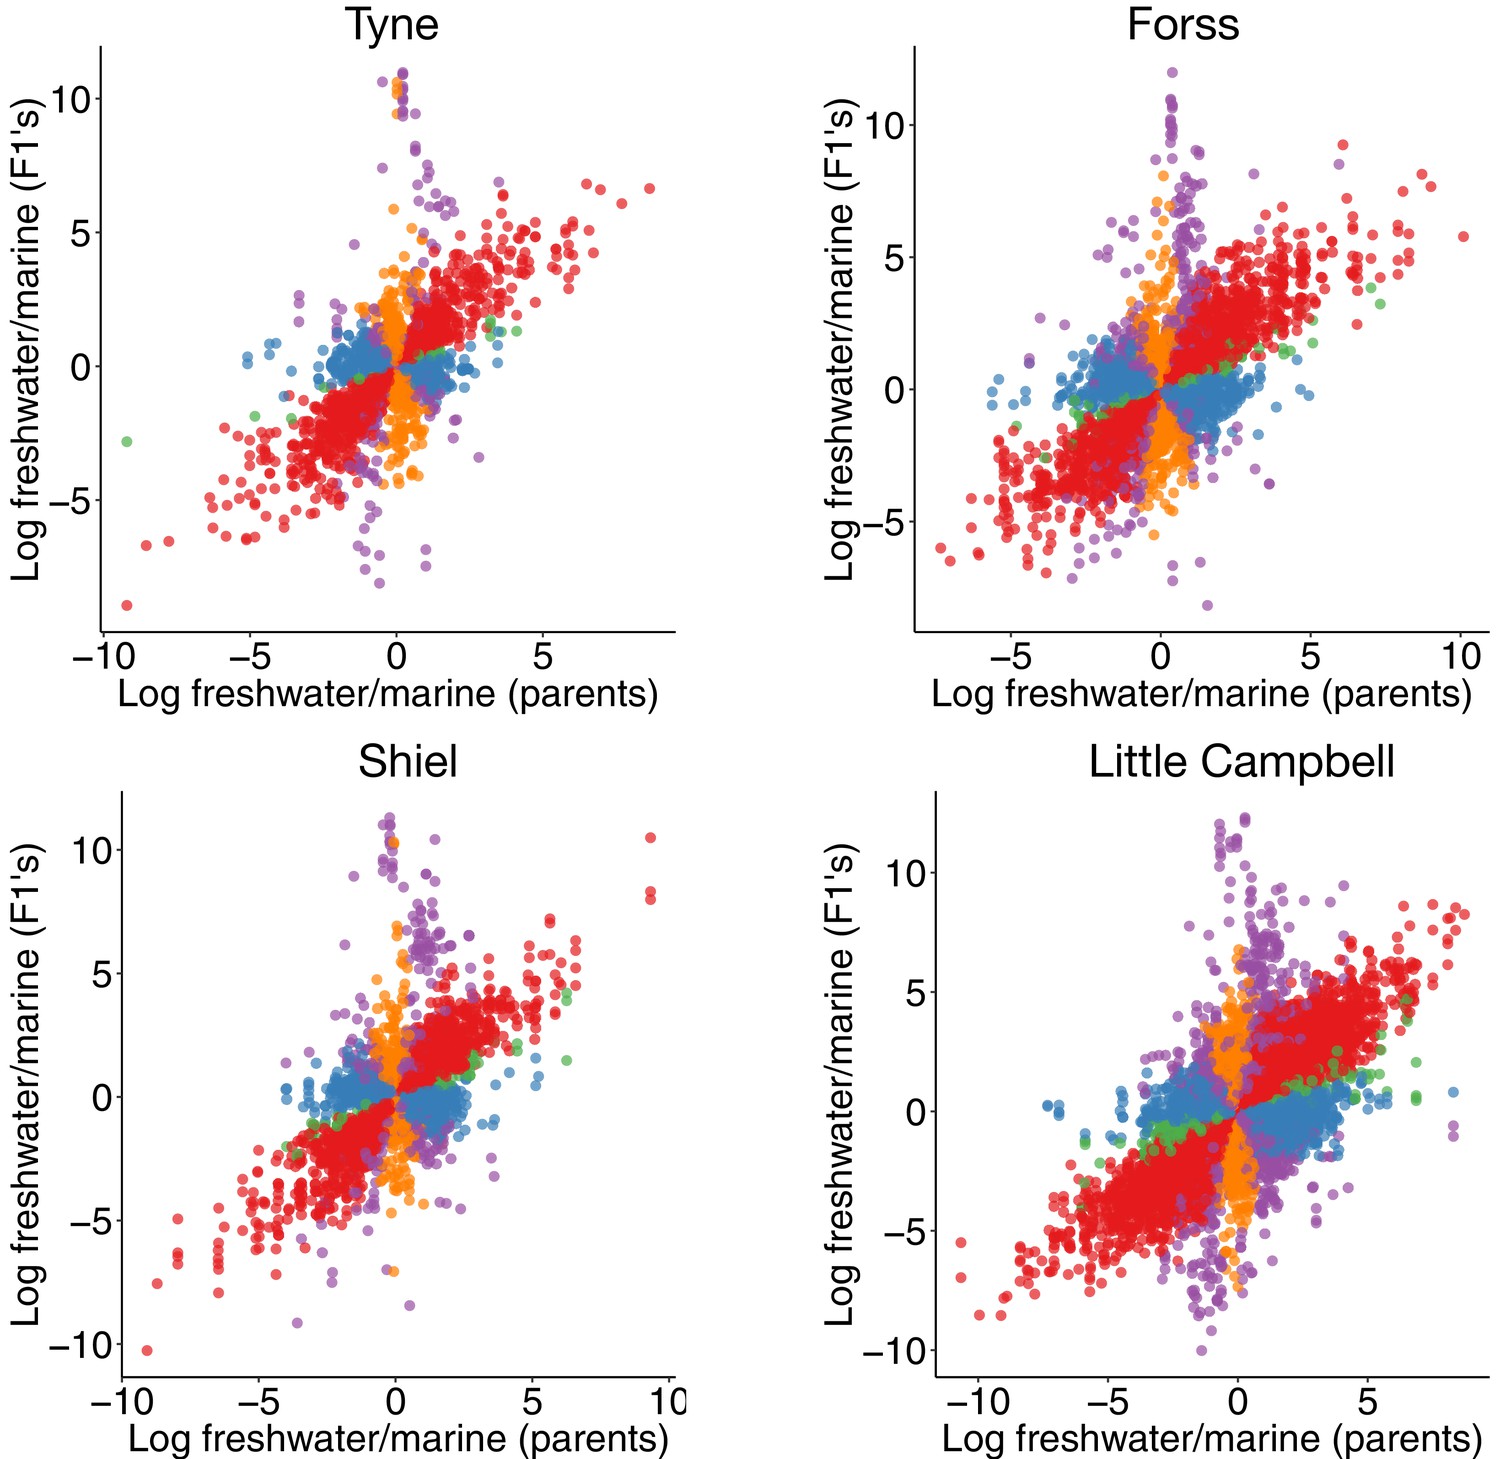
Expression divergence between marine-freshwater ecotype pairs is predominantly due to cis-regulatory divergence.
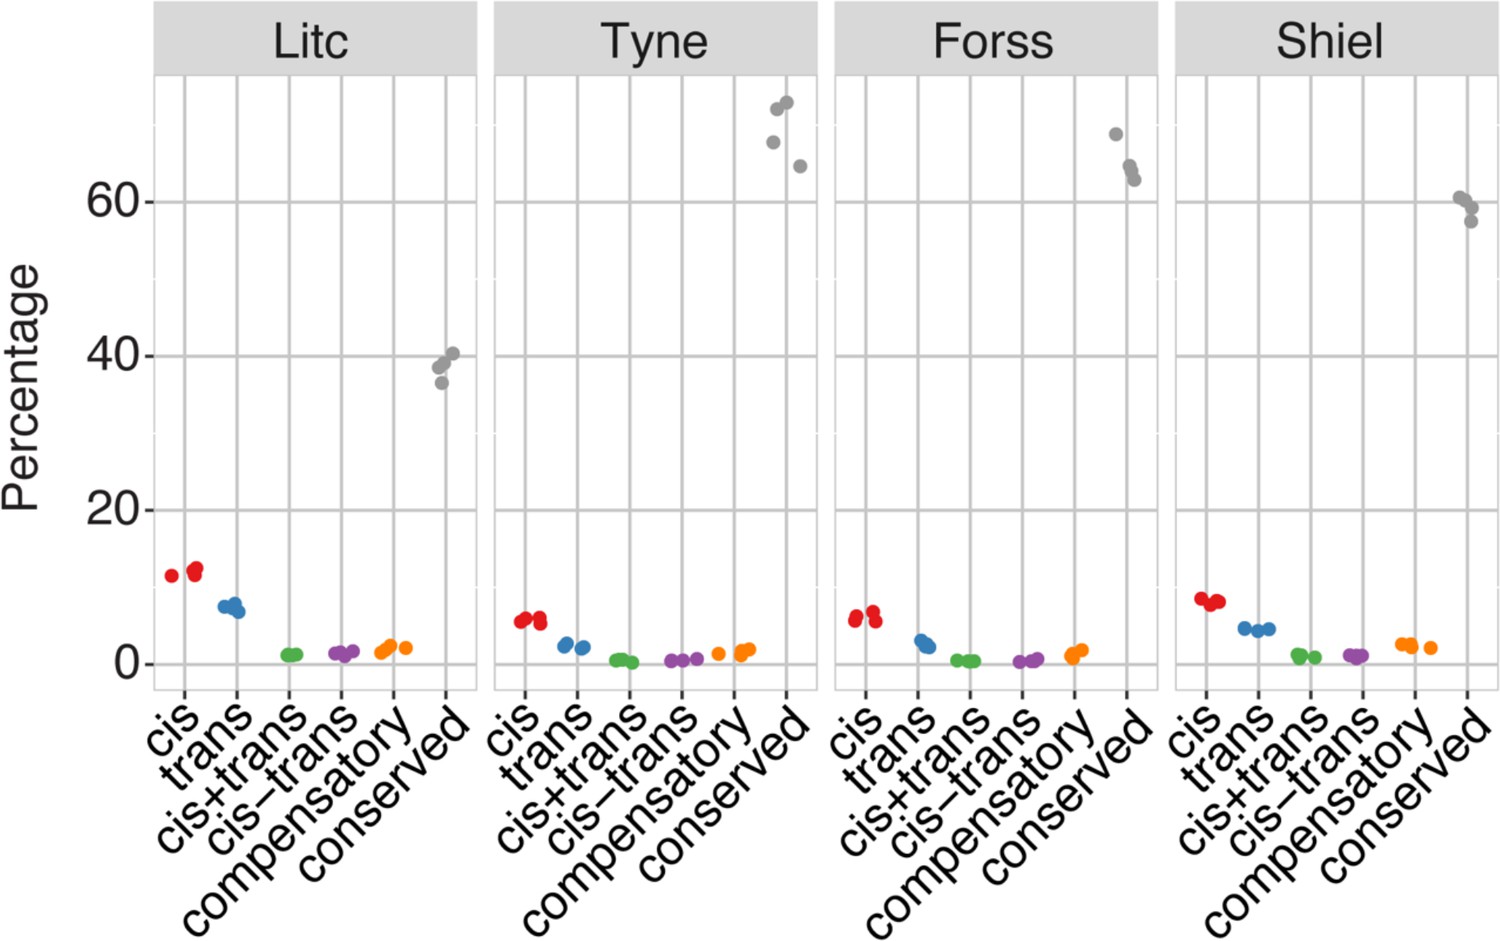
(a) Regulatory divergence is categorized in six categories by comparison of the expression log2-ratio of the marine and freshwater parent to marine- and freshwater- allele-specific expression log2-ratio within an the F1 offspring (Landry et al., 2005). Individual data-points correspond to allele-specific expression values (y-axis) for each gene in each of four F1s relative to their parents (x-axis). Genes are colored according to their classification into different genetic architectures of expression divergence (red cis, blue trans, green cis+trans, purple cis-trans, gold compensatory, gray conserved. ‘Ambiguous’ and ‘conserved’ classes are omitted for clarity.) (b) cis-regulation is the predominant regulatory mechanism underlying gene expression divergence in all four river systems. Points show the overall frequency of regulatory divergence types, relative to the number of analyzed transcripts for each F1 offspring analysed. The proportion of expression divergence caused by cis-regulatory divergence, scales positively both with nucleotide divergence (gray bars) and the number of fixed differences (numbers beneath bars) between the marine and freshwater parents. ‘Ambiguous’ class is omitted for clarity.
Figure 3—figure supplement 1
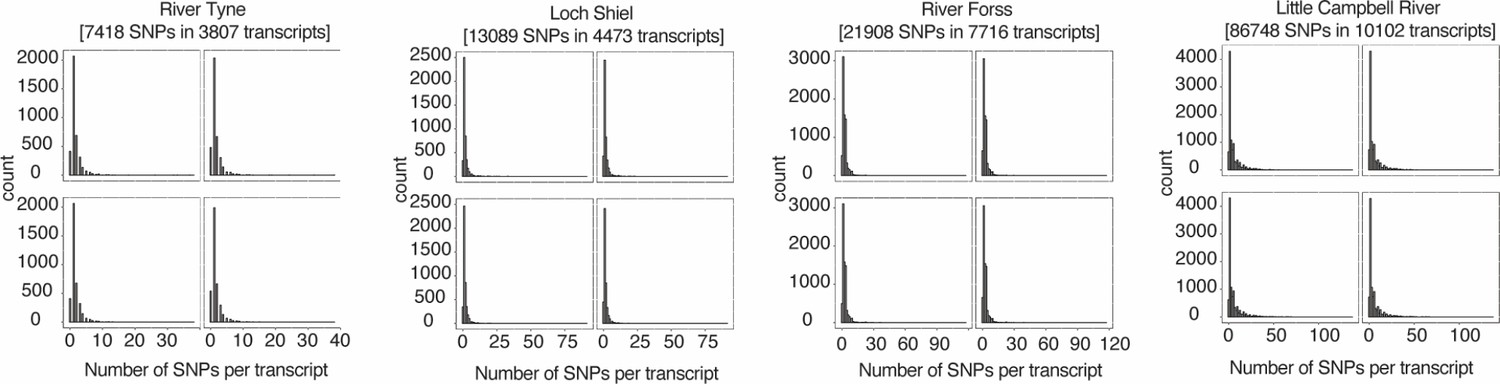
Number of informative (tested) SNPs per transcript per cross.
Four panels per cross represent four analyzed F1s. Zero corresponds to positions where SNP position was not informative (expressed) in a given F1, but informative in other F1s of the same family.
Figure 3—figure supplement 2
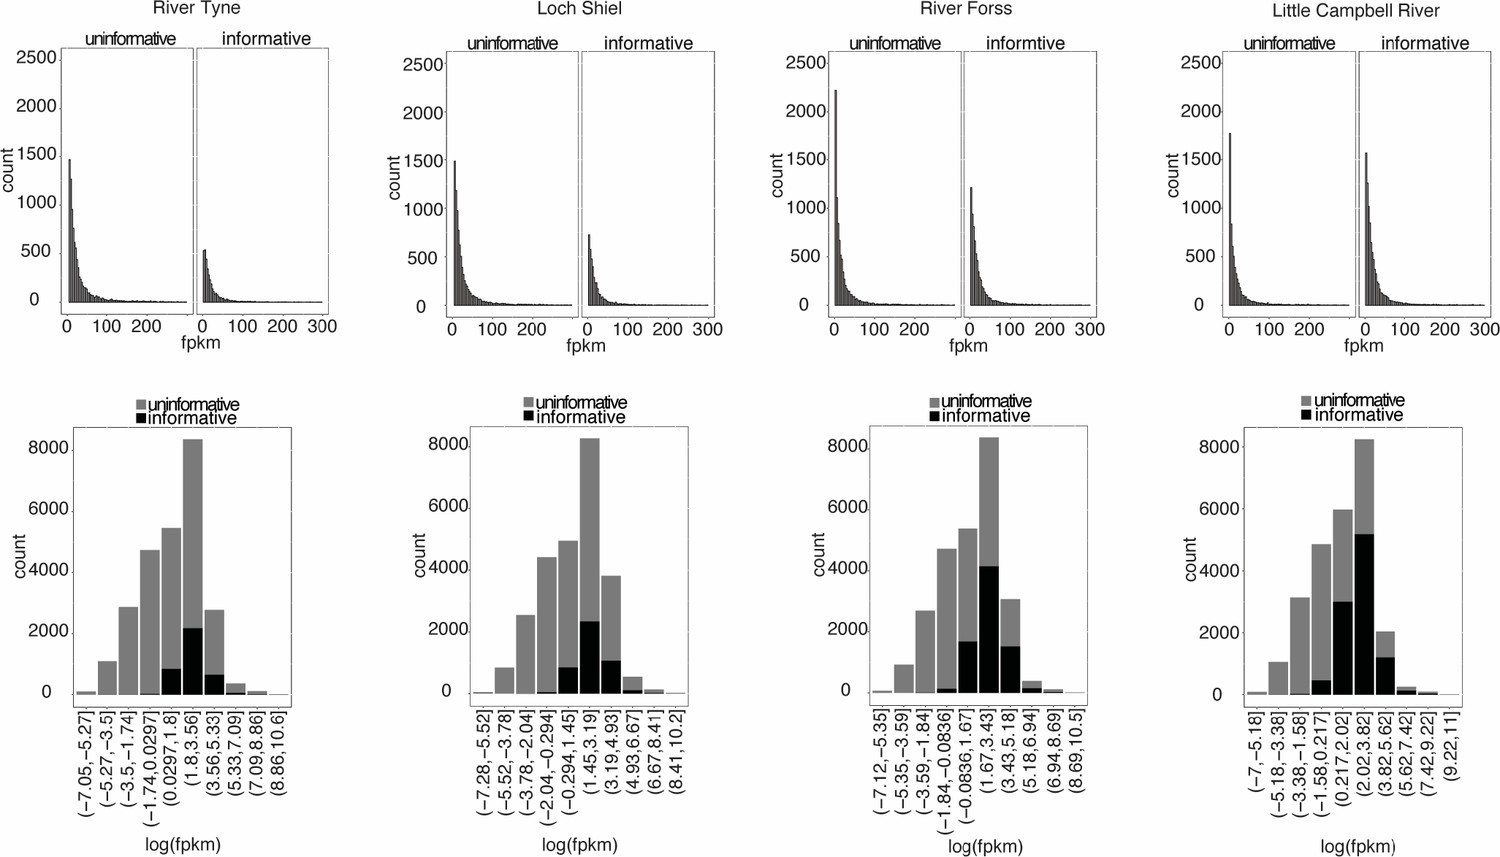
Expression levels of transcripts with informative SNPs.
Average FPKM values in transcripts with informative SNPs for allele-specific expression test and those without informative SNPs (uninformative).
Figure 3—figure supplement 3
The genetic architecture of expression divergence between ecotype pairs in all investigated ecotype-pairs (as per Figure 3b).
https://doi.org/10.7554/eLife.43785.016
Figure 3—figure supplement 4
Frequencies of genetic architectures of expression divergence in down-sampled (30M uniquely mapping reads per sample) dataset.
https://doi.org/10.7554/eLife.43785.017
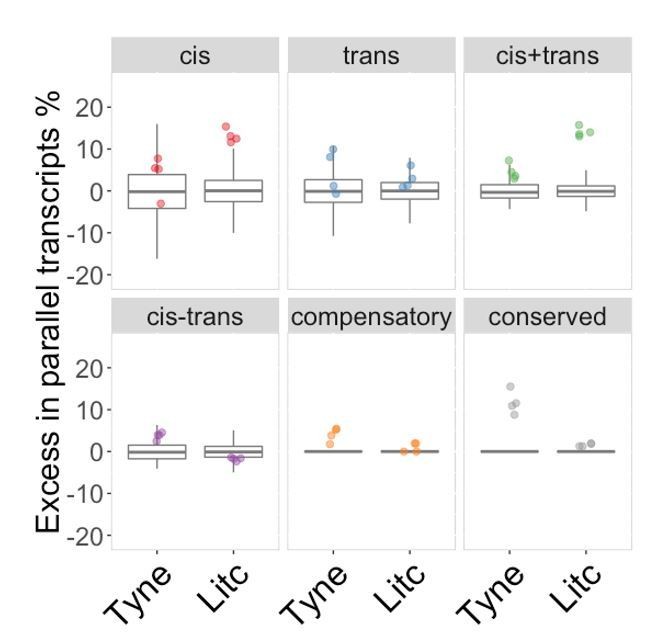
Figure 4
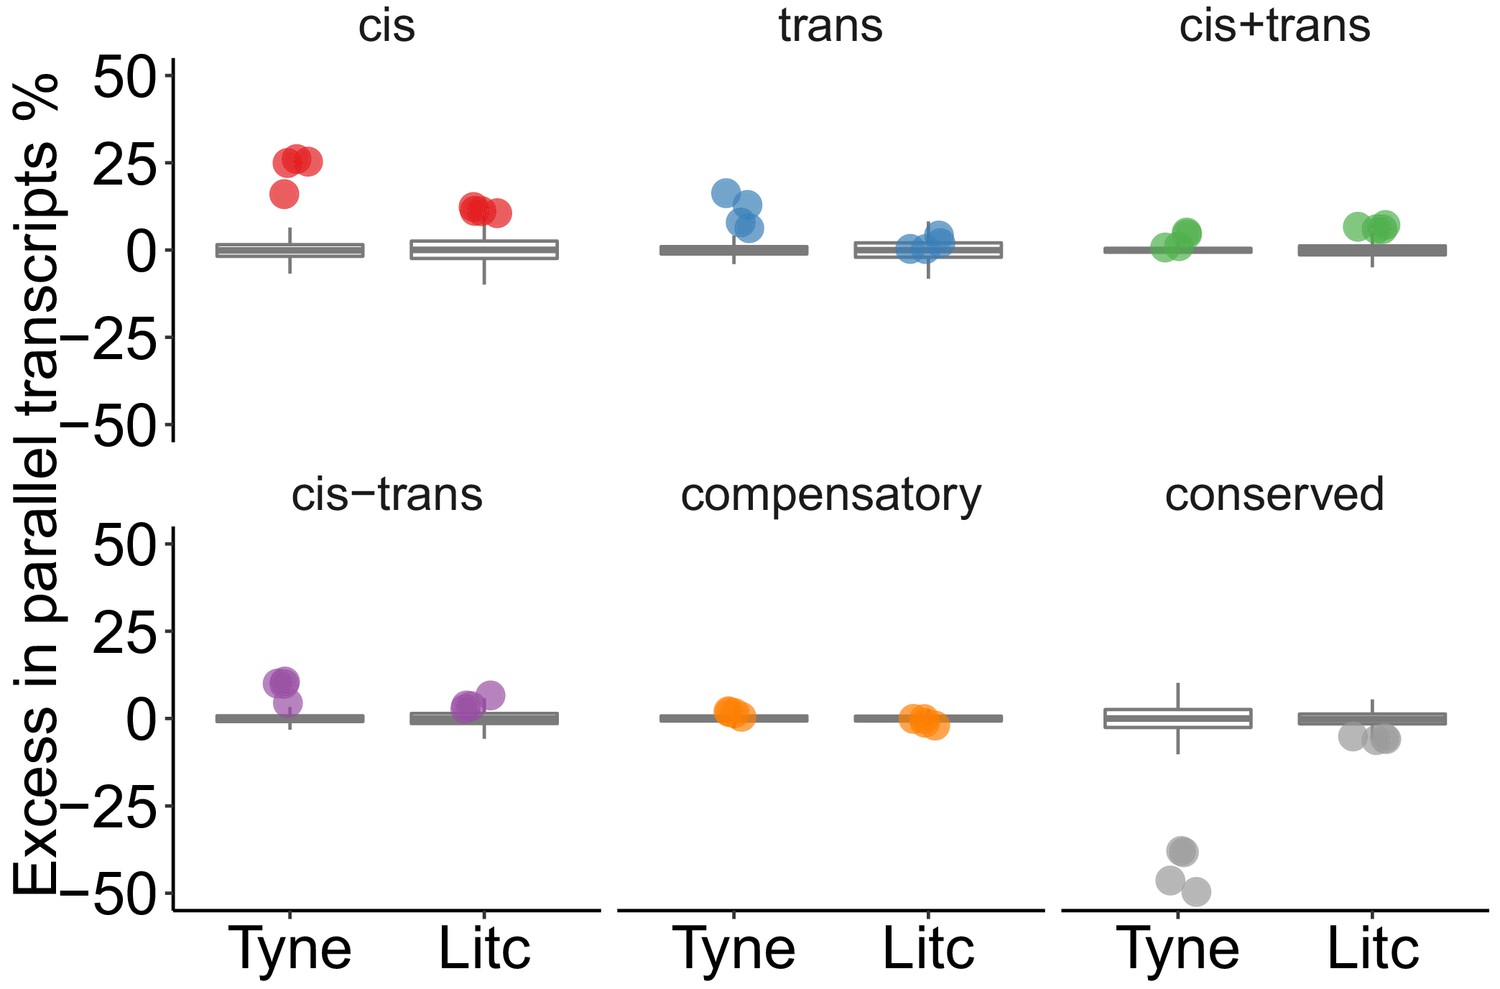
Genes with parallel marine-freshwater divergence in expression are enriched in cis-regulatory divergence.
Overrepresentation of expression regulation types associated with parallel evolving transcripts, compared to the overall frequency of regulatory divergence between freshwater and marine ecotypes. Points represent the observed values in four F1's per cross. Box-plots represent the random expectation based on 1000 samples of the corresponding number from transcripts showing expression divergence between ecotypes. Horizontal bar in box-plot corresponds to median, box includes 50% and whiskers 99.3% of random expectation.
Figure 5 with 1 supplement
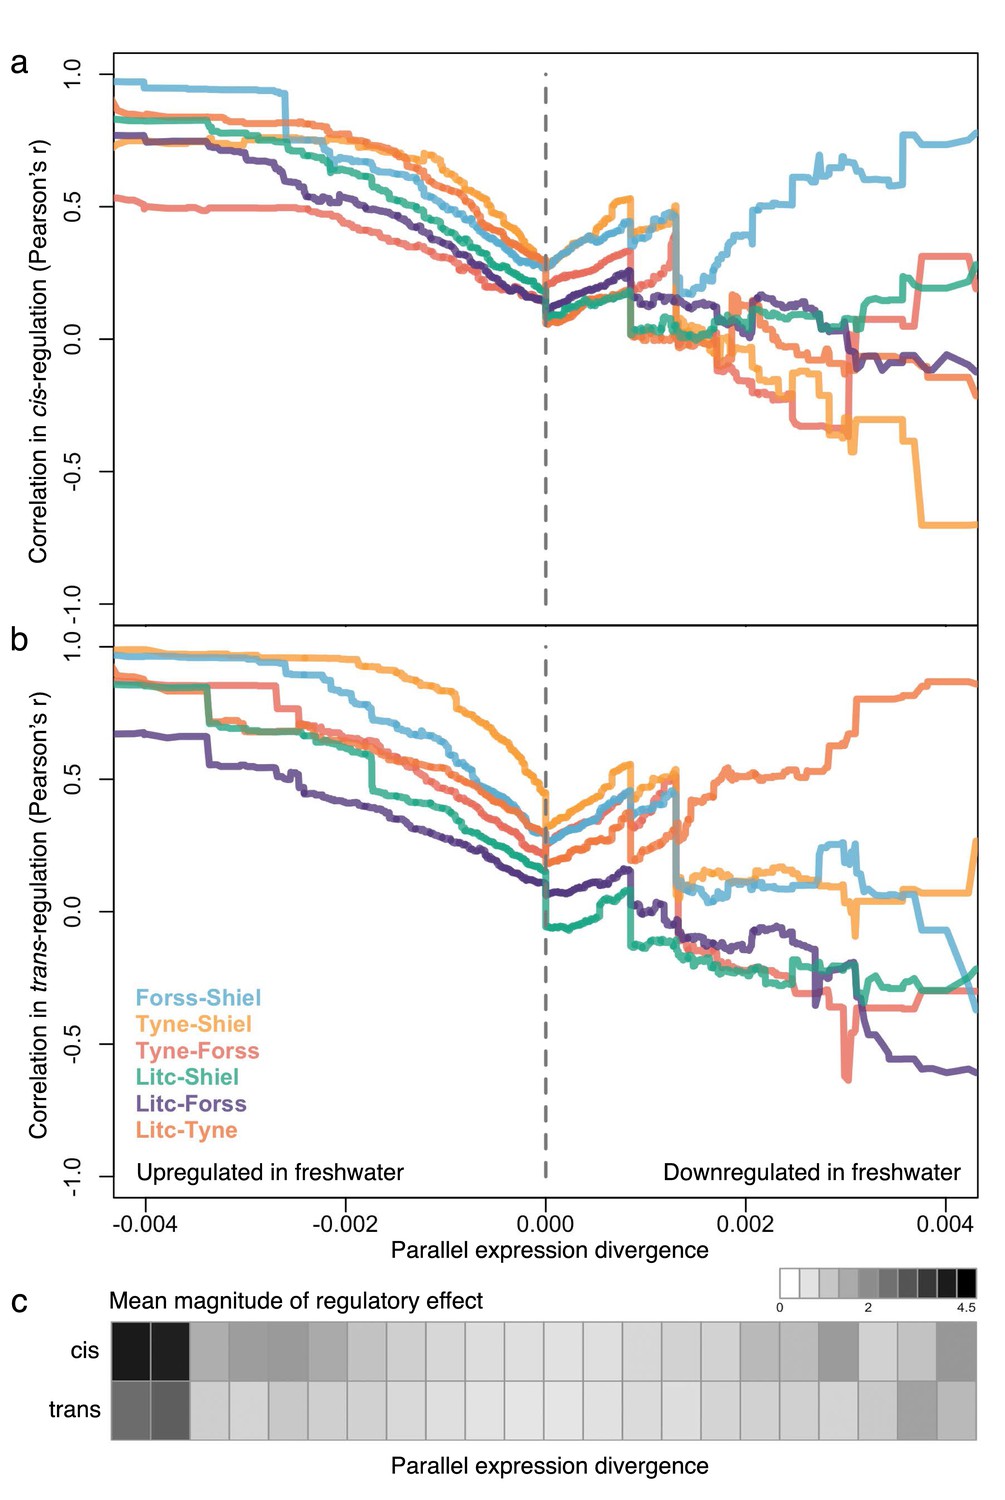
The degree of parallelism (correlation) in the magnitude of cis- (a) and trans-divergence (b) of marine-freshwater expression divergence among different river systems at loci with increasingly parallel divergent expression (composite PC loadings).
Parallel divergent genes that are upregulated in freshwater (strong negative loading on composite PC) show high correlation in their degree of cis- and trans-divergence among populations. In contrast, loci that have not diverged in parallel (PC loadings close to zero) and loci that are parallel downregulated in freshwater are not highly correlated in the magnitude of cis- and trans- divergence. For each population pair, Pearson correlation coefficients, r, were calculated for subsets of loci defined by an increasingly extreme positive or negative threshold on the composite PC loading scores. (c) The mean absolute magnitude of cis- and trans- divergence across populations in subsets of loci defined by bins of parallel expression divergence (composite PC). For both cis- and trans-divergence, higher magnitude effects (darker gray shades) are seen at parallel divergent loci that are upregulated in freshwater. Means and standard errors of effect size per population are shown in Figure 5—figure supplement 1.
Figure 5—figure supplement 1
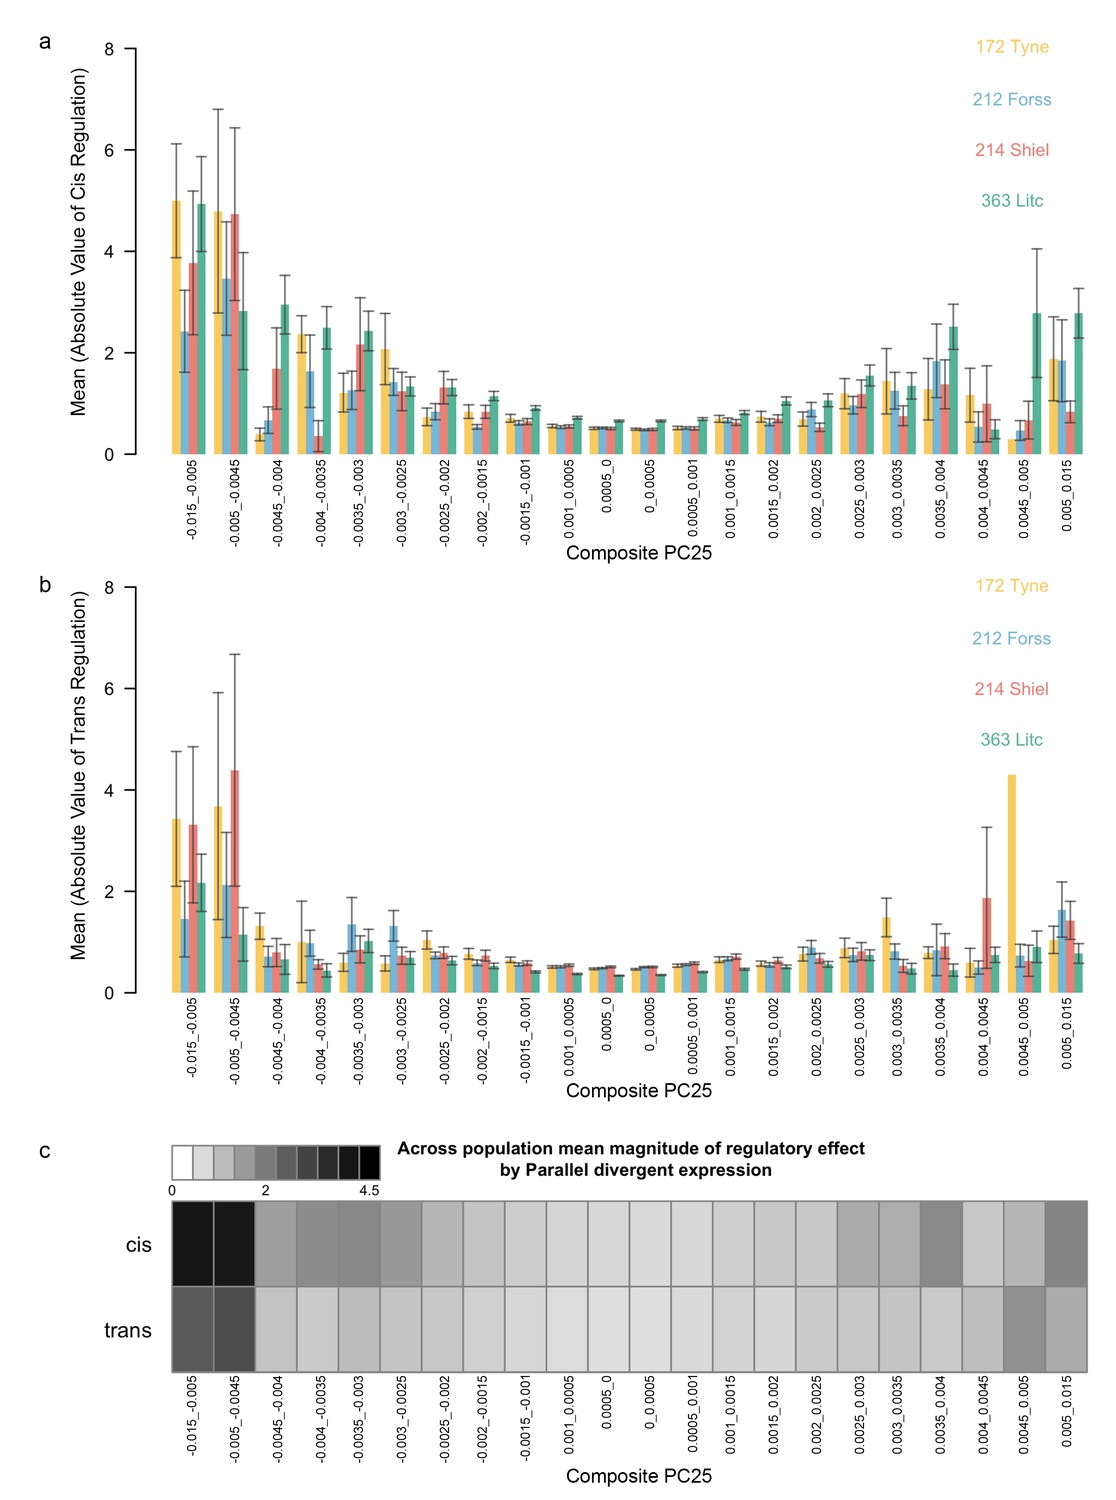
Mean magnitude of cis- (a) and trans- (b) regulation relative to parallel divergence in gene expression measured by composite PC.
For each population studied for allele-specific expression, loci were binned according to their loadings on the composite PC describing parallel divergence in gene expression of pure strains. For each bin and each population, the mean and standard error of the quantitative degree of cis-regulation and trans-regulation was calculated (see main text). (c) As per Figure 5c in main text. For each bin, the mean across populations was calculated and plotted as a heat map with darker gray representing larger magnitudes of cis- and trans- effects.
Figure 6 with 2 supplements
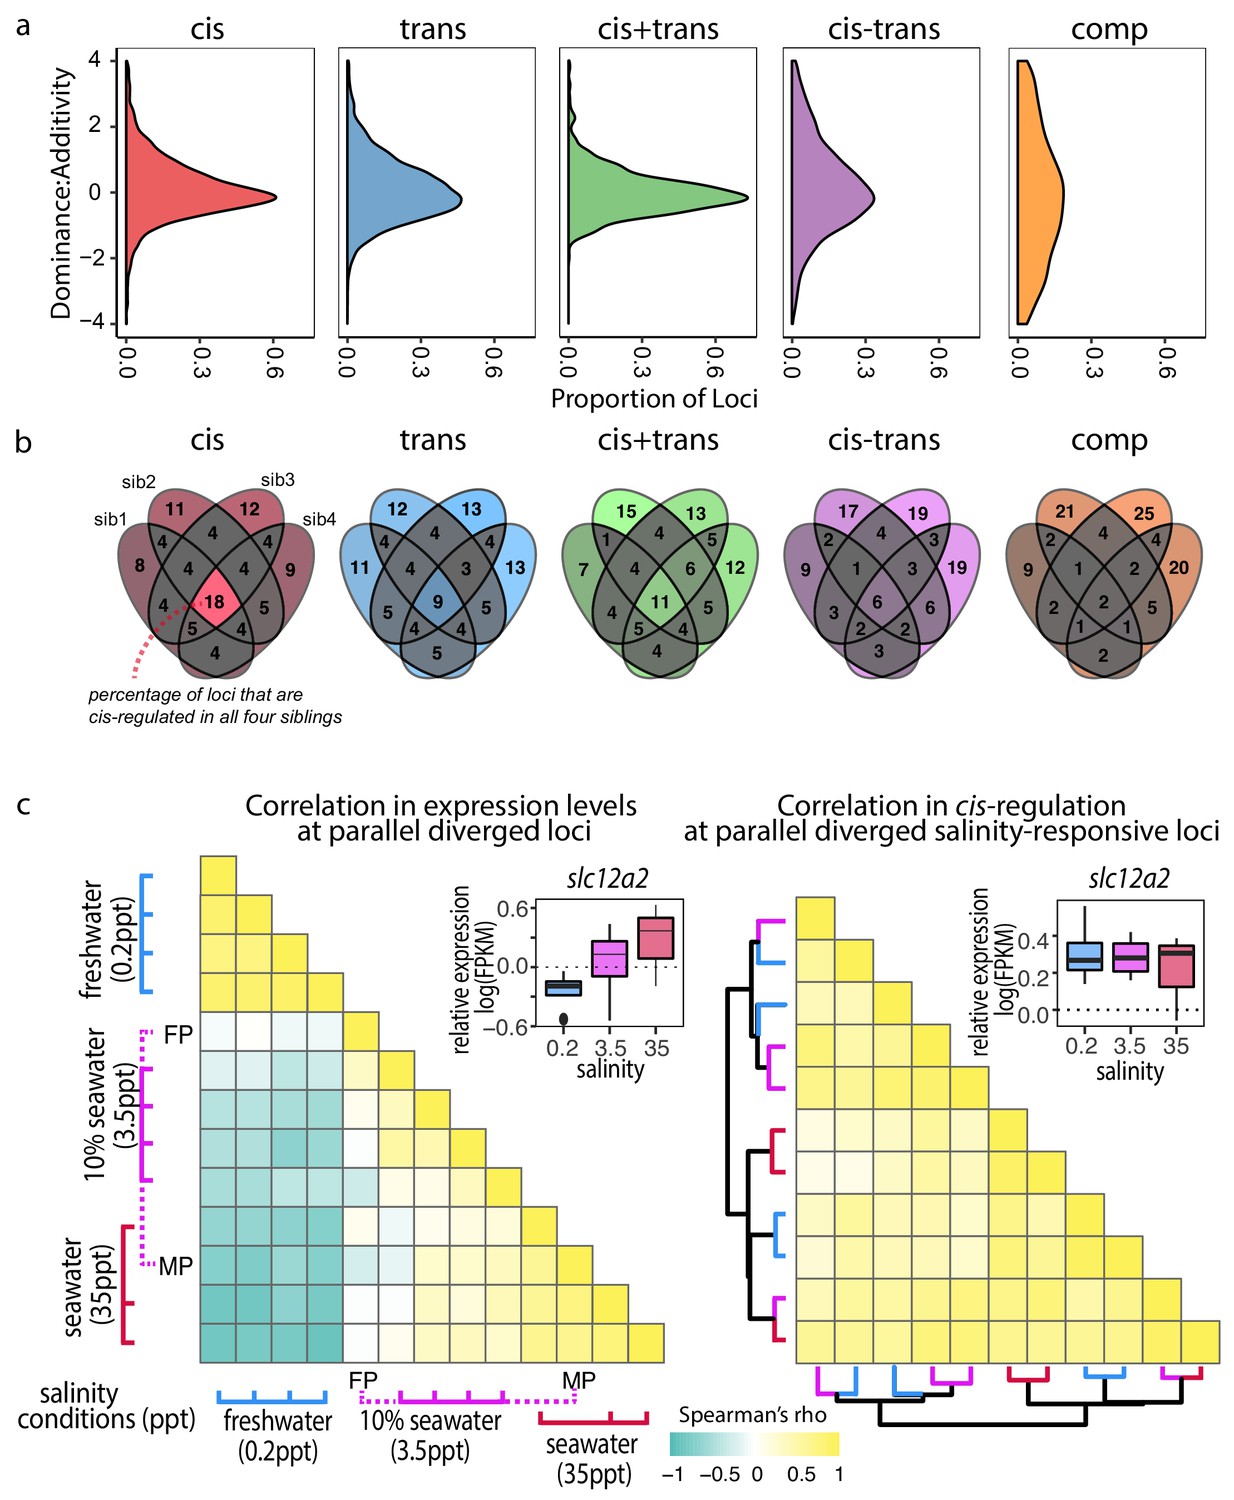
Cis-regulatory changes are additive and insensitive to genetic and environmental contexts compared to other regulatory classes.
(a) Density estimates of dominance-additivity ratio of each locus assigned to the respective regulatory classes (data represents all four F1 – parent comparisons of Little Campbell). A ratio of zero indicates additivity, ±1 full dominance, and values > 1 or <-1 imply over- or underdominance. The slight bias towards negative values indicates tendency of stronger dominance of low-expressed allele (irrespective of ecotype). (b) Sharing of regulatory divergence between siblings as a proxy for the level of epistasis associated with each regulatory class in Little Campbell. The type of regulation observed for each gene is compared among siblings (overlapping ovals) with numbers representing percent of loci shared between siblings (rounded to integer). Color scale ranges from gray (low) to colored (high). Cis-regulatory divergence tended to be most stable across genetic backgrounds indicating that cis-acting divergence is least influenced by epistasis. (see also data for River Tyne shown in supplement figure). (c) While the expression levels of parallel diverged transcripts are sensitive to water salinity (left triangle) the degree of cis-regulation of these loci is insensitive to water salinity (right triangle). Pairwise Spearman’s correlation (rho) in expression levels (left triangle) and allele-specific-expression ratio (right triangle) of parallel diverged loci in marine x freshwater F1 siblings acclimated to different salinity conditions. A negative correlation (cyand) indicates salinity-responsive genes were up-regulated (or show allele-specific-expression bias) in one salinity and down-regulated (or show allele-specific-expression bias in the opposite direction) in another, while a positive correlation (yellow) indicates that expression profiles and allele-specific expression profiles were similar between individuals. Expression levels of an example locus, slc12a2, are shown as an inset above each heatmap. slc12a2 expression increases under seawater conditions, but cis-regulatory control of this expression is stable across different salinities. Rows and columns of the right heatmap are ordered based on euclidean distance and the dendogram shows that cis-regulation does not cluster by salinity. Colors of dendrogram branches refer to salinity in parts per thousand (0.2-blue, 3.5-pink, 35ppt-red). MP, FP refer to marine and freshwater parents.
Figure 6—figure supplement 1
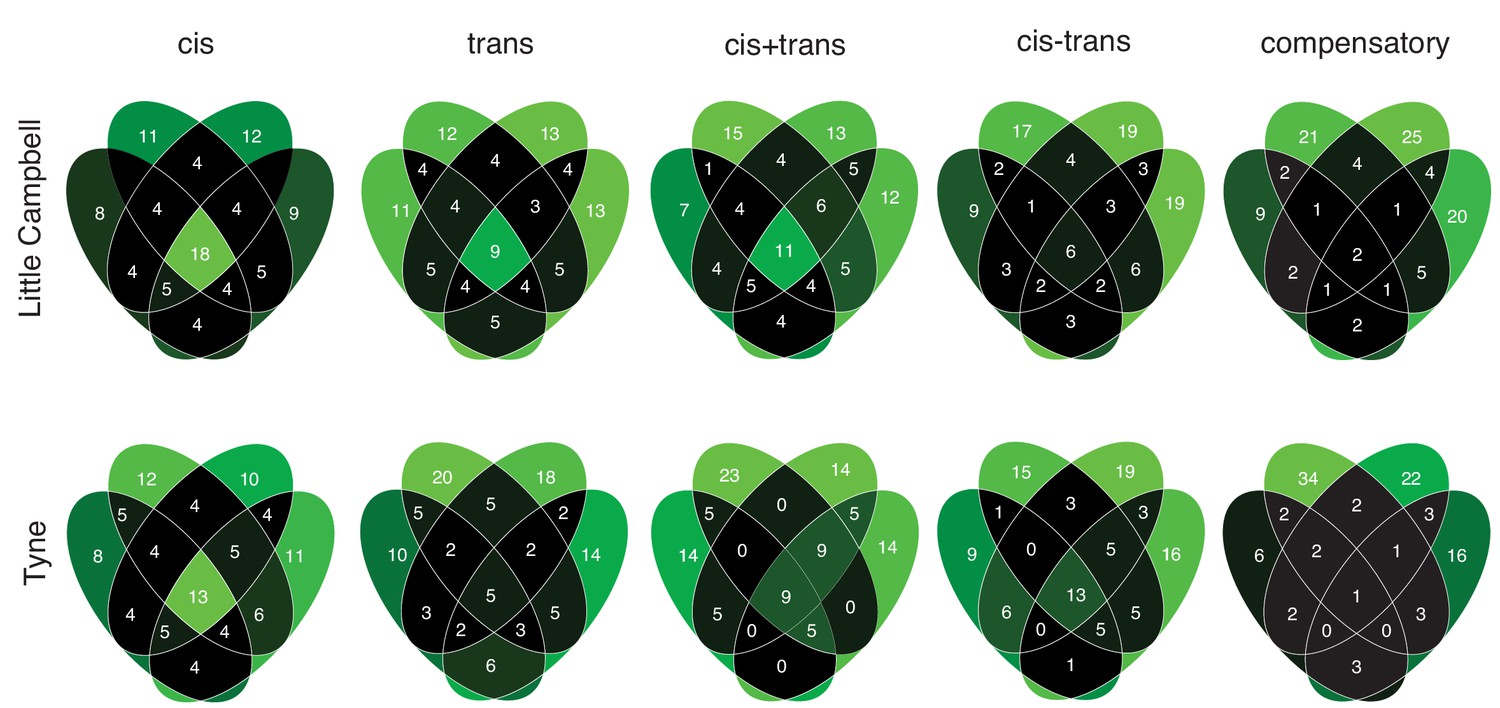
Sharing of regulatory divergence between siblings as a proxy for the level of epistasis associated with different genetic architectures in Little Campbell (see also main text Figure 6b) and Tyne.
The type of regulation observed for each gene is compared among siblings (overlapping ovals) with numbers representing percent of loci shared between siblings (rounded to integer). Color scale ranges from black (low) to pale green (high). Cis-regulatory divergence tended to be most stable across genetic backgrounds indicating that cis-acting divergence is least influenced by epistasis.
Figure 6—figure supplement 2
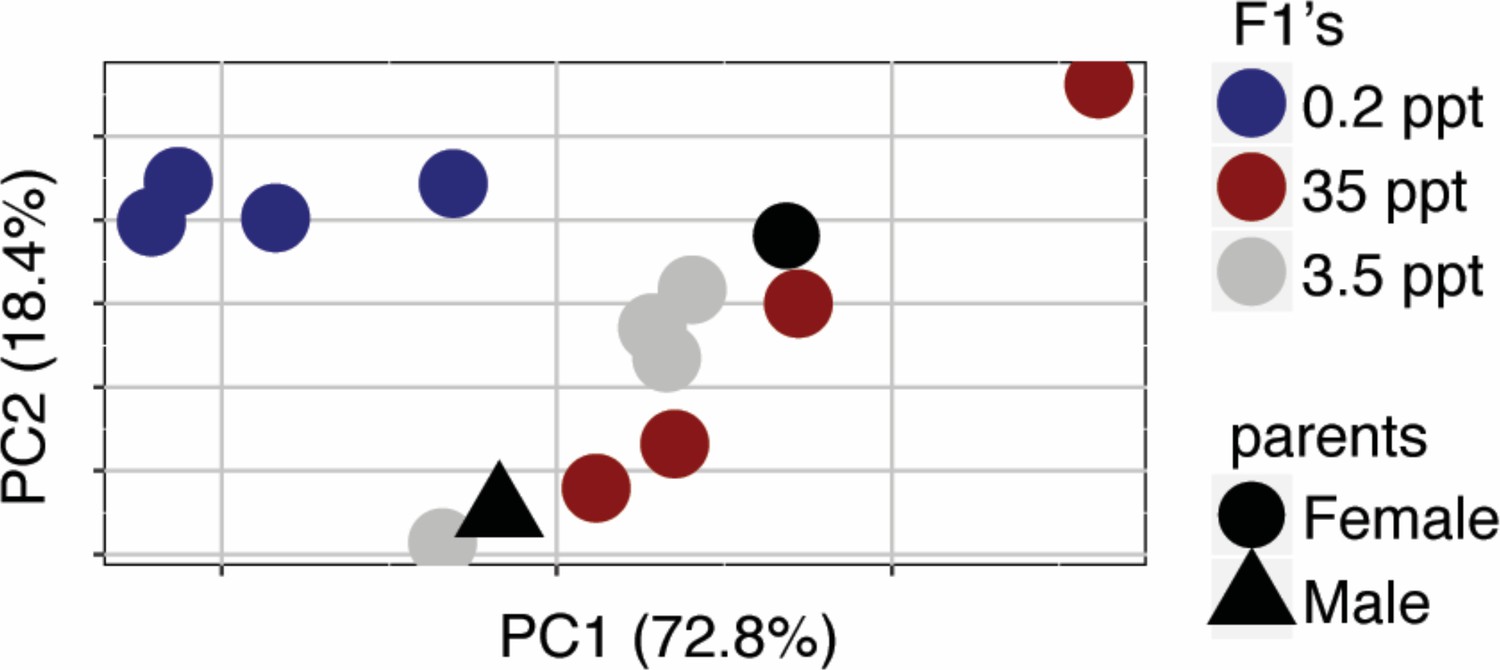
Principal Component Analysis of expression profiles of full siblings from a Little Campbell River marine x freshwater cross acclimated to different salinities.
https://doi.org/10.7554/eLife.43785.023
Appendix 1—figure 1
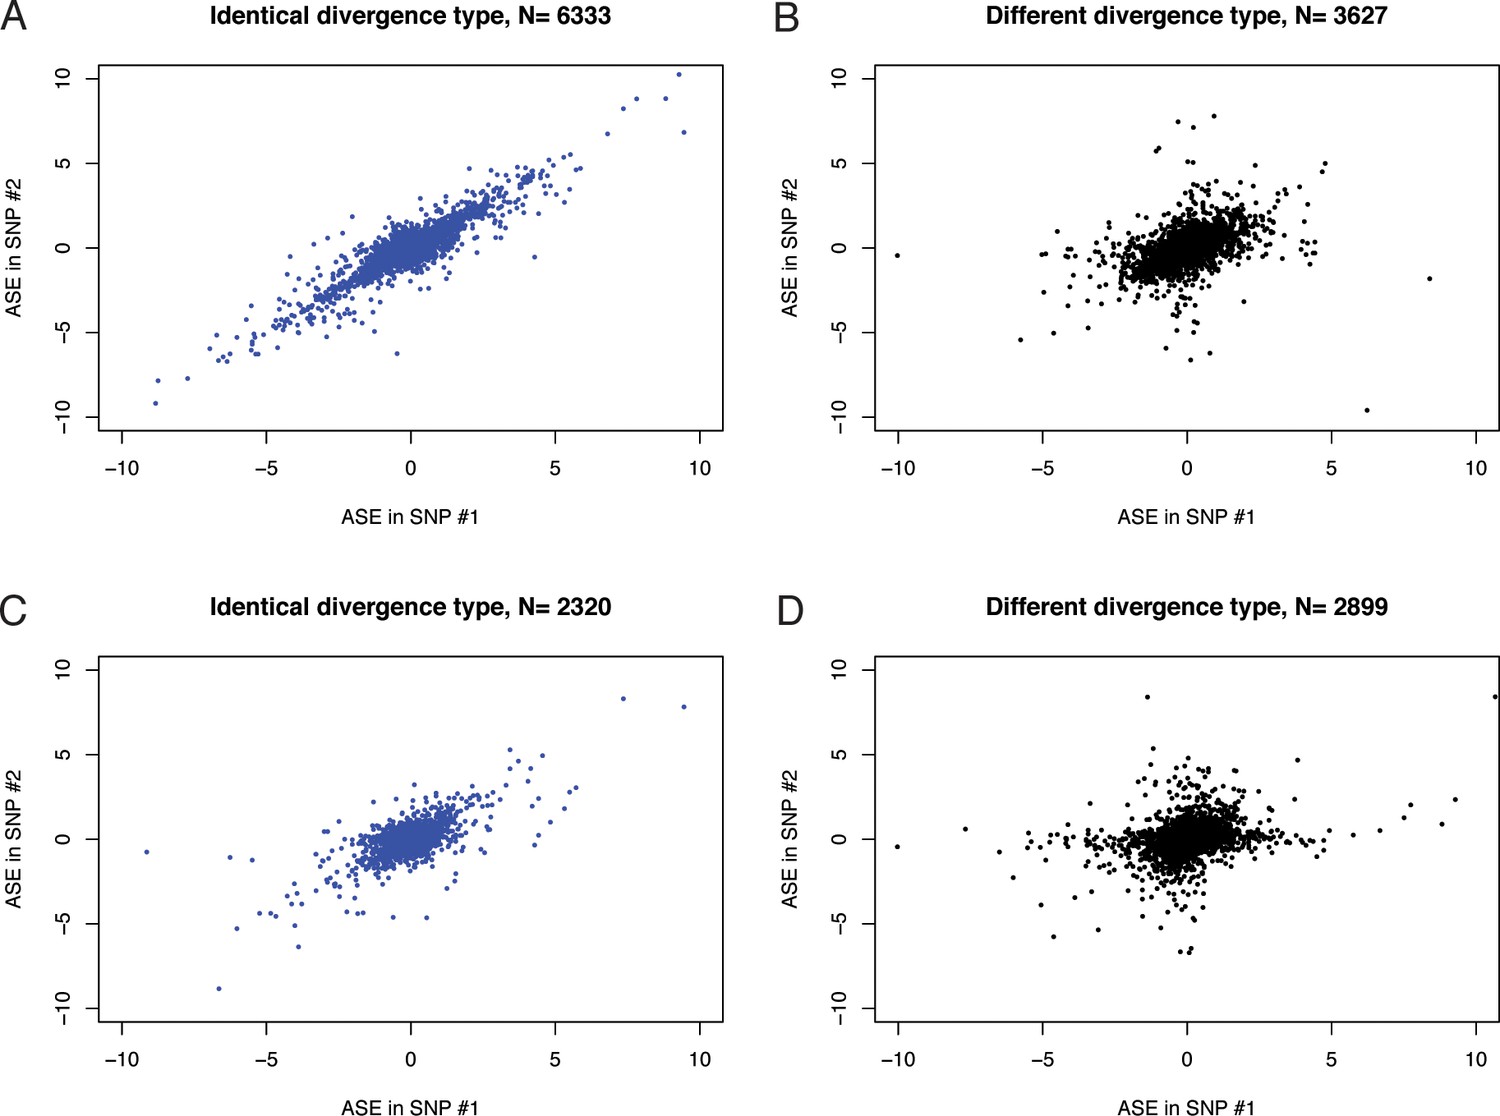
Correlation of ASE (log-fold change of RNA-seq counts of marine over freshwater allele) in different pairs of SNPs was used to perform concordance analysis.
(a) SNPs assigned to same exons and showing identical type of genetic divergence (concordant SNPs). (b) SNPs assigned to same exons but showing different classes of genetic divergence (discordant SNPs). (c) SNPs assigned to different exons of the same transcript and showing identical type of genetic divergence. (d) SNPs assigned to different exons of the same transcript and showing different type of genetic divergence.
Appendix 1—figure 2
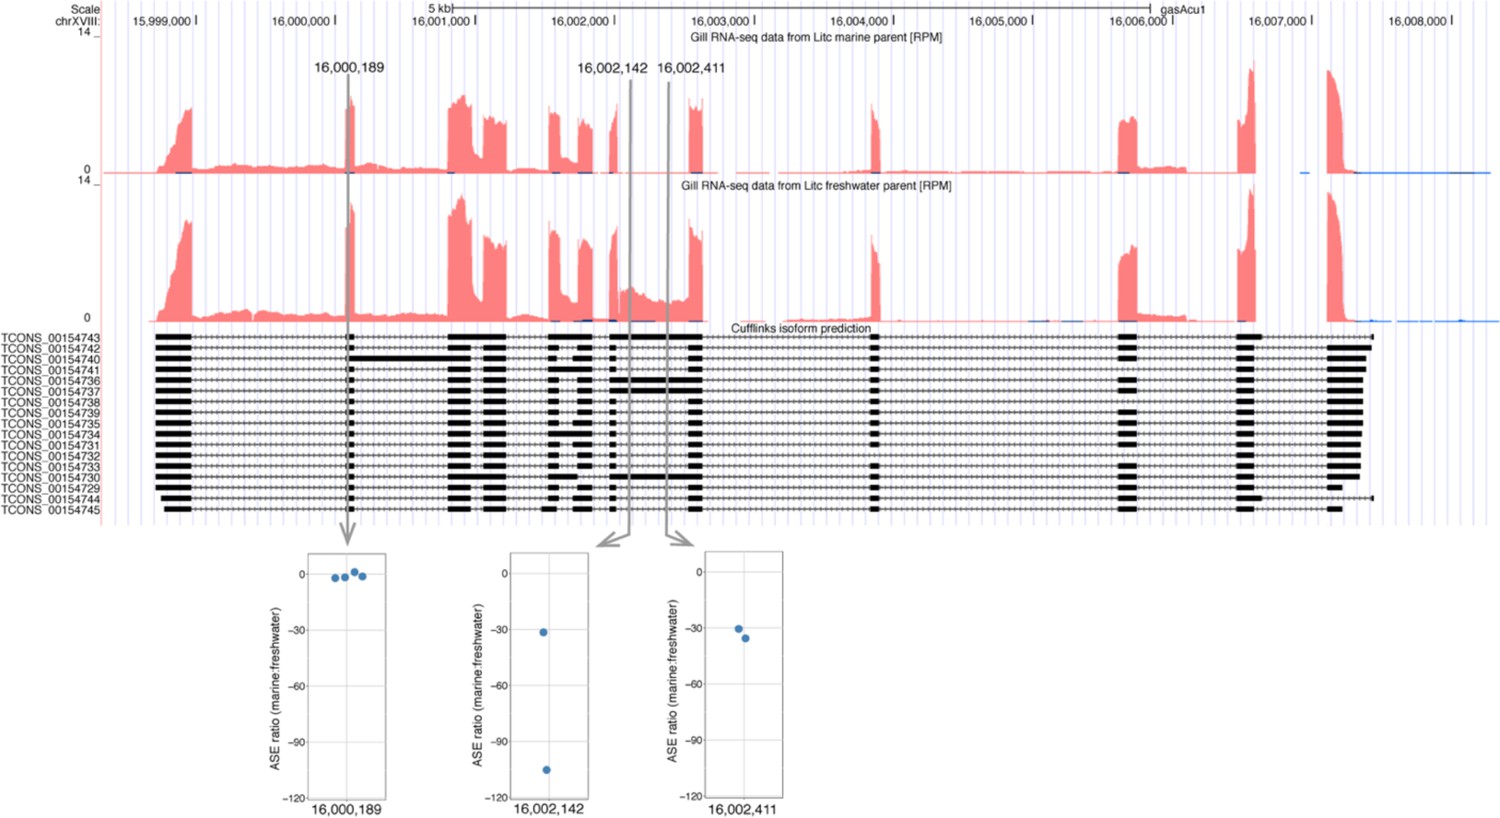
Candidate transcript for alternative isoform expression.
This example illustrates that SNPs in different regions of the same transcript can show varying levels of ASE associated with alternative splice forms. Expression level is represented by RPM (Reads [mapping to position] Per Million [reads mapped overall]) and corresponds to red track in Little Campbell marine (upper) and freshwater (lower) parents. CuffLinks isoform predictions are represented below expression tracks. The marine and freshwater alleles are distinguished by three SNPs mapping to two exons. SNP at position chrXVIII:16000189 shows similar expression level of both alleles and hence no ASE. SNPs at positions 16002142 and 16002411 map to an alternatively spliced region of the transcript where expression is observed in freshwater allele but not in marine allele, and hence the SNPs show ASE towards freshwater.
Author response image 1
Genes with parallel marine-freshwater divergence in expression are enriched in cis-divergence.
Overrepresentation of expression regulation types associated with parallel evolving transcripts, compared to genes with significant parental expression divergence (regardless of whether it is parallel or not). Points represent the observed values in four F1's per cross. Box-plots represent the background expectation.
Additional files
-
Supplementary file 1
Sampling locations.
- https://doi.org/10.7554/eLife.43785.024
-
Supplementary file 2
RNA-seq library sequencing and yield.
- https://doi.org/10.7554/eLife.43785.025
-
Supplementary file 3
Gene Ontology term enrichment.
Available as a supplementary xls file. Two different Gene Ontology analyses were performed using parallel divergent gene expression outliers defined through parametric analysis (CuffDiff) and composite PC analysis (compPC). Gene ontologies with significance lower than 1 × 10⁻⁵ shown.
- https://doi.org/10.7554/eLife.43785.026
-
Supplementary file 4
Criteria for defining divergence classes following (Landry et al., 2005).
- https://doi.org/10.7554/eLife.43785.027
-
Supplementary file 5
DNA sequencing yield.
- https://doi.org/10.7554/eLife.43785.028
-
Transparent reporting form
- https://doi.org/10.7554/eLife.43785.029
Download links
A two-part list of links to download the article, or parts of the article, in various formats.
Downloads (link to download the article as PDF)
Open citations (links to open the citations from this article in various online reference manager services)
Cite this article (links to download the citations from this article in formats compatible with various reference manager tools)
Predominance of cis-regulatory changes in parallel expression divergence of sticklebacks
eLife 8:e43785.
https://doi.org/10.7554/eLife.43785


