Engineering a conserved RNA regulatory protein repurposes its biological function in vivo
- University of Texas Dallas, United States
- National Institute of Environmental Health Sciences, National Institutes of Health, United States
- Ithaca College, United States
- University of Wisconsin-Madison, United States
- National Institutes of Health, United States
Figures
Figure 1

Evolutionary and structural divergence among the C.elegans PUF protein family.
(A) Dendrogram of C. elegans PUF proteins based on alignment of primary sequences. The four clades are indicated: FBF, containing FBF-2 (blue and maroon); PUF-8/9, containing PUF-8 (blue and yellow); PUF-3/11 (cyan) and PUF-5/6/7 (mauve). (B) FBF-2 forms a flatter RNA-binding surface to bind to a 9-nt FBE sequence and accommodates an extra nucleotide opposite PUM repeats R4 and R5. Schematic illustration (left) and ribbon diagram (middle) of FBF-2 in complex with FBE RNA (PDB ID 3V74). Repeats are colored alternately red and blue. RNA recognition side chains from each PUM repeat are shown. The RNA is shown as a stick representation colored by atom type (maroon, carbon; red, oxygen; blue, nitrogen; orange, phosphorus). Carbon atoms for nucleotides 5 and 6 are green. Structural superposition of repeats R5-R8 of PUF-8 and FBF-2 demonstrates the flatter curvature of the RNA-binding surface of FBF-2. The RNA-binding helices of PUF-8 (gold) and FBF-2 (red) are shown as cylinders (right). (C) Crystal structure of PUF-8 in complex with 8-nt PBE RNA reveals modular 1:1 recognition of RNA by PUM repeats and a curvature similar to PUM1. Schematic illustration (left) and ribbon diagram (middle) of PUF-8 in complex with PBE RNA. Repeats are colored alternately gold and blue. RNA recognition side chains from each PUM repeat are shown. The RNA is colored as in panel B, except carbon atoms are gold, The RNA base at the 5th position, which stacks with the 4th base and turns away from the protein surface, is shown with green carbon atoms. Superposition of the crystal structures of PUF-8 and human PUM1 demonstrates similar curvature. The RNA-binding helices of PUF-8 (gold) and PUM1 (blue) are shown as cylinders (right).
Figure 2

RNA recognition by PUF-8.
(A) Recognition of the conserved 5´-UGUR sequence by PUF proteins. (B) Recognition of the conserved AUA-3´ sequence by PUF proteins. Superpositions of crystal structures of PUF-8:PBE RNA (orange), human PUM1:PBE RNA (blue), and C. elegans FBF-2/FBE RNA (red) are shown. Structures were aligned by superimposing the RNA bases. (C) PUF-8 base omission mode of RNA recognition. In panels A-C, the TRM residues from each PUM repeat are shown. (D) Schematic representation of the interactions between PUF-8 and PBE RNA. PUM repeats are indicated by boxes, and RNA bases are indicated by ovals. Interactions are indicated by dashed lines (hydrogen bonds, black; van der Waals contacts, tan).
Figure 3 with 3 supplements
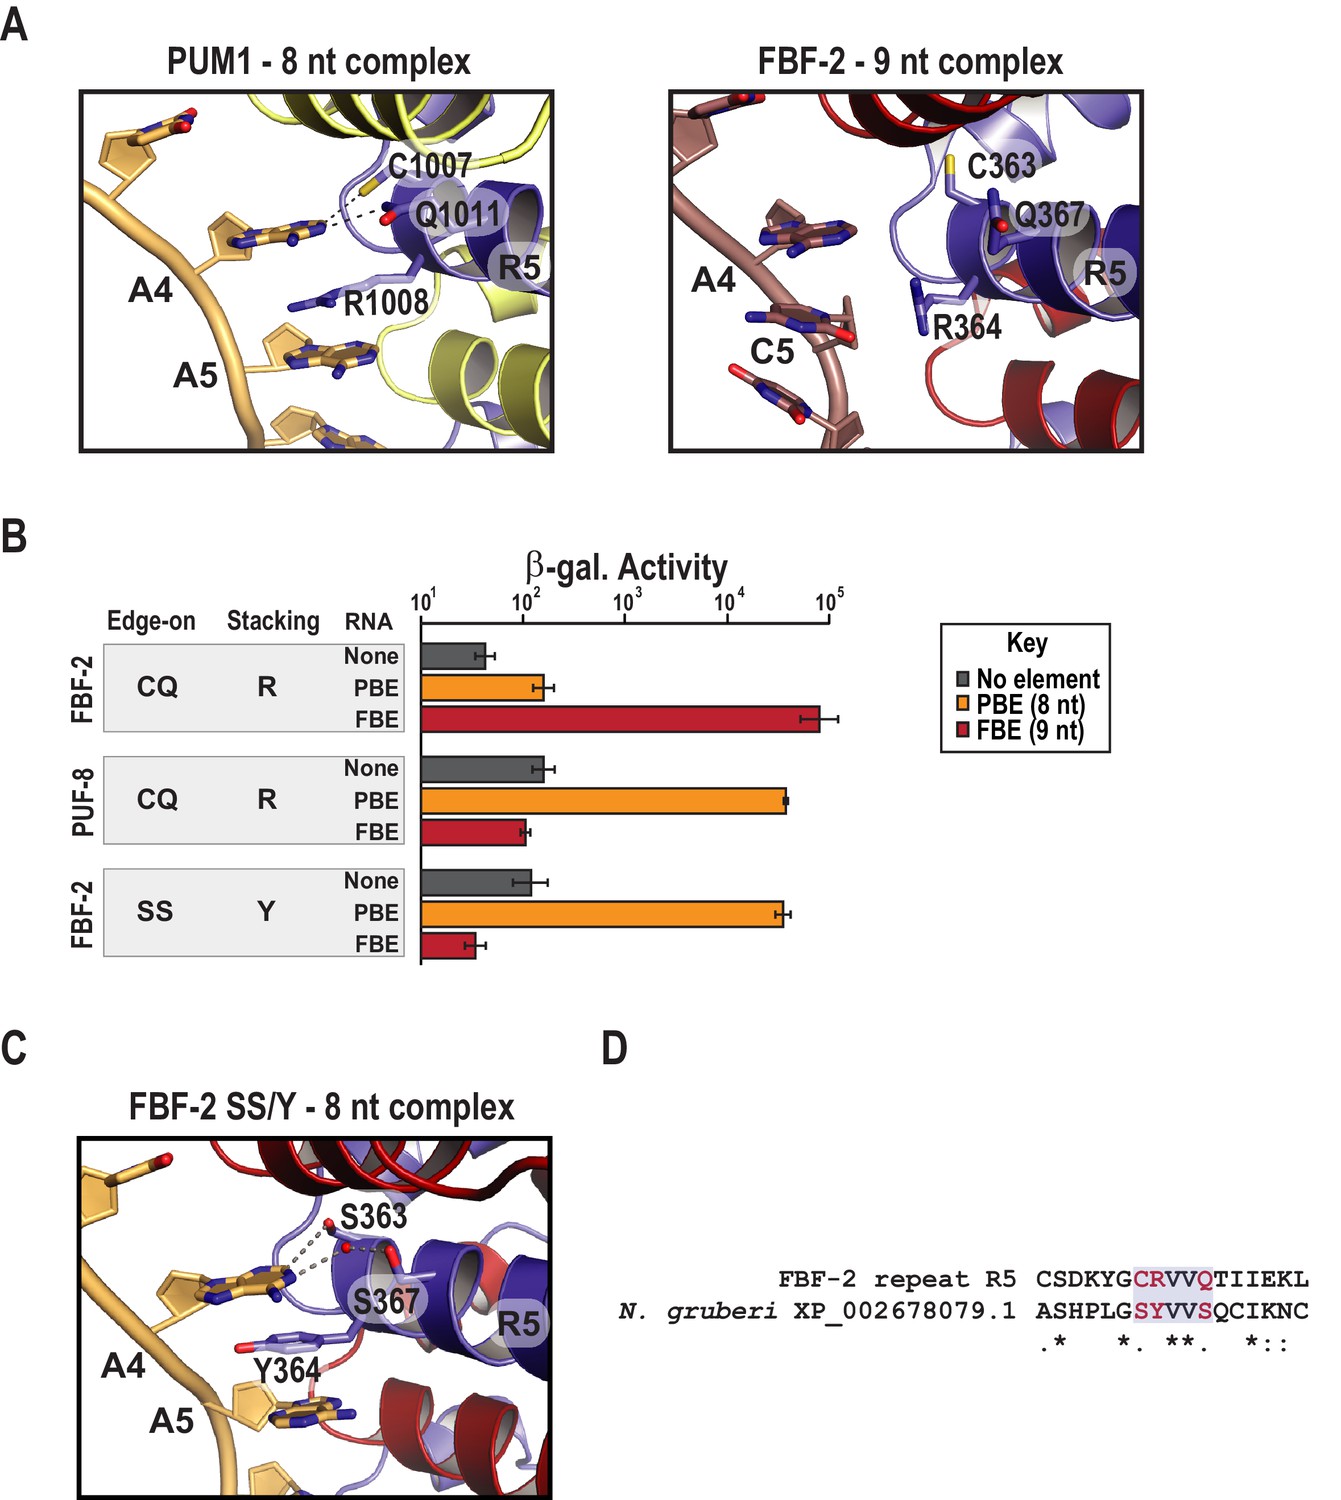
Substitution of TRM residues in FBF-2 repeat R5 to SS/Y switches specificity from a 9-nt FBE to an 8-nt PBE.
(A) PUM1 binds preferentially to an 8-nt PBE by intercalating R1008 between bases A4 and A5 (left, PDB ID 3Q0L). This is distinct from FBF-2 bound to a 9-nt FBE where R364 projects away from base C5 (right, PDB ID 3K5Q). The PBE (gold) and FBE (mauve) RNAs are shown with cartoon backbones and stick bases. Hydrogen bond and van der Waals interactions between TRM residues and RNA bases are indicated with dashes. (B) An FBF-2 variant bearing the SS/Y TRM at repeat R5 preferentially binds to an 8-nt PBE. Yeast 3-hybrid analyses of binding by FBF-2 WT, PUF-8, and FBF-2 SS/Y variant to an MS2 hairpin (None, grey) or an MS2 hairpin fused to an 8-nt PBE (orange) or a 9-nt FBE (red). Binding activity is shown as units of β-galactosidase activity normalized to cell count. Error bars indicate the standard deviation of three replicate measurements. Source data are available in Figure 3—source data 1. (C) The crystal structure of the FBF-2 SS/Y variant reveals binding to the 8-nt PBE in a 1:1 recognition pattern. Hydrogen bond and van der Waals interactions are indicated with dashes, and a water molecule is shown as a red sphere. (D) Identification of a naturally occurring SS/Y TRM. Sequence alignment of FBF-2 repeat R5 with PUM repeat R7 from N. gruberi. TRM residues are indicated in red. Identical residues are labeled with an asterisk, dots indicate similar types of amino acid residues.
-
Figure 3—source data 1
Raw data for Beta-Glo assay of FBF-2 R5 SS/Y variant with different binding elements.
- https://doi.org/10.7554/eLife.43788.011
Figure 3—figure supplement 1
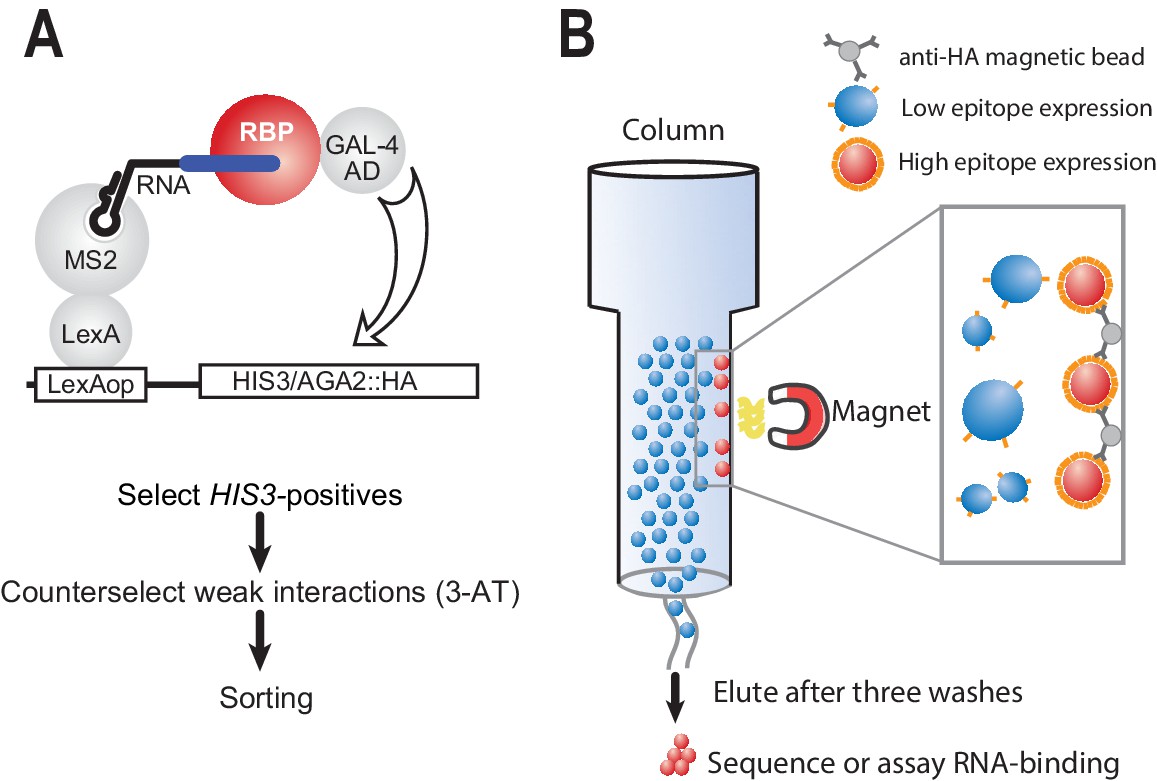
Modified yeast three-hybrid system to detect RNA-protein interactions.
(A) Schematic representation of RNA selection using the yeast three-hybrid system. RNA is presented to RNA-binding proteins by virtue of a LexA MS2 coat protein chimera. Hybrid RNAs containing MS2 stem loops and a binding site of interest are expressed. Putative RNA-binding proteins (RBPs) associate with binding elements, which in turn lead to transcription through recruitment of the GAL-4 activation domain. The interaction drives the production of HA-tagged integral membrane protein. Weak interactions are selected against through the addition of 3-AT, an inhibitor of the HIS-3 gene product. Finally, cells from surviving colonies are pooled together for sorting. (B) Magnetic separation is used to separate cells with strong interactions from those with weak interactions based on the relative density of cell surface epitopes. Magnetic beads crosslinked to HA antibodies are used to preferentially enrich cells with high levels of antigen presentation.
Figure 3—figure supplement 2
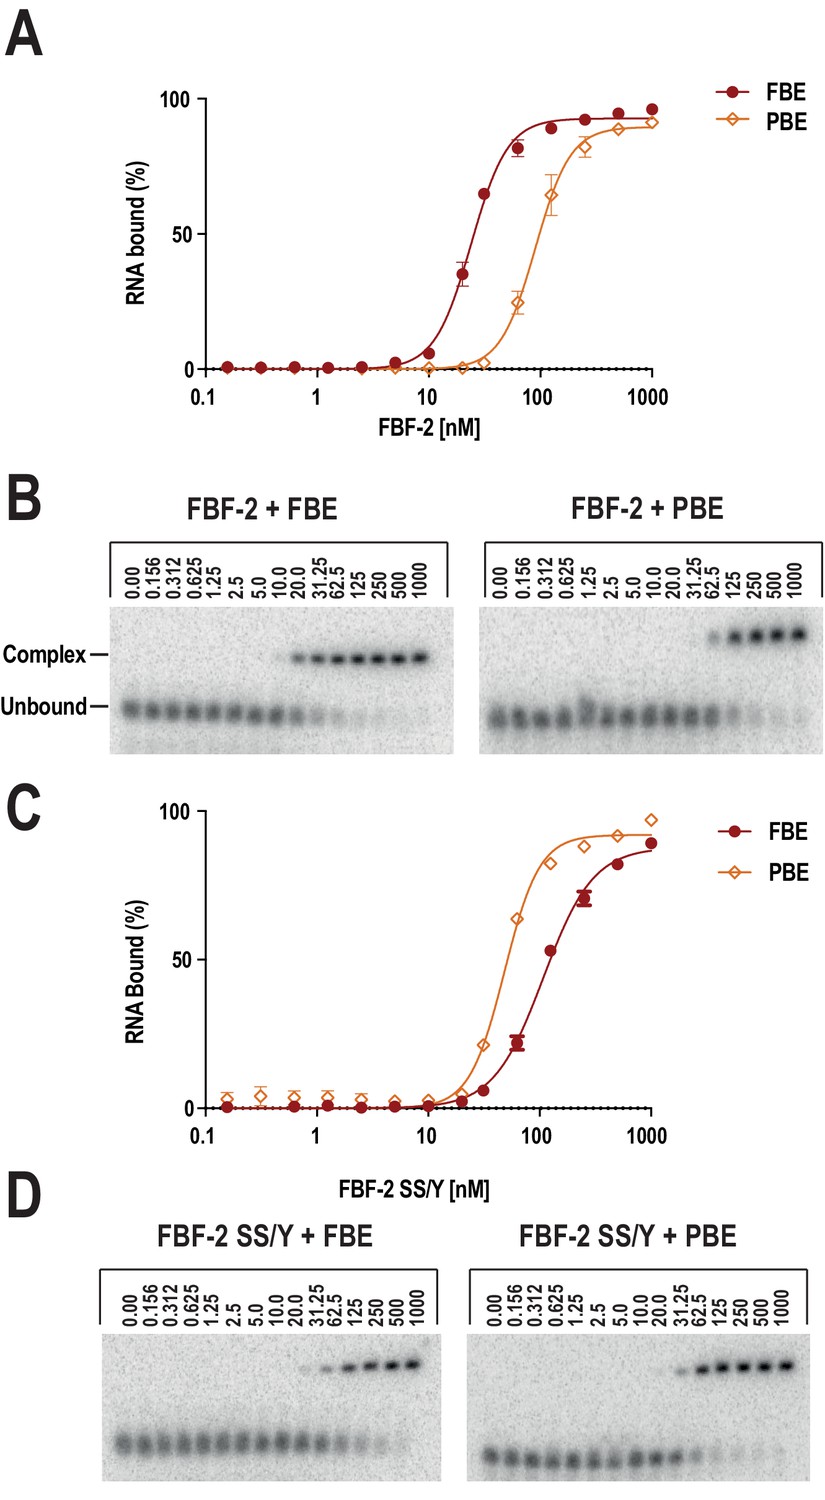
Electrophoretic mobility shift assays confirm preferential recognition of the PBE by SS/Y.
The FBF-2 R5 SS/Y variant shifts specificity toward an 8-nt PBE over a 9-nt FBE. FBF-2 binds preferentially to a 9-nt FBE versus an 8-nt PBE (A, B), whereas FBF-2 SS/Y binds preferentially to an 8-nt PBE versus a 9-nt FBE (C, D). Representative binding curves (A, C) and corresponding electrophoretic mobility shift assays (B, D) are shown.
Figure 3—figure supplement 3

The FBF-2 R5 SS/Y variant binds to an 8-nt PBE without changing the overall curvature.
(A) The SS/Y substitutions do not change the overall curvature of FBF-2. Superimposed crystal structures of an FBF-2:FBE complex and the FBF-2 SS/Y:PBE complex are shown as backbone traces. The repeat R5 TRM side chains are shown for FBF-2 WT and SS/Y.
Figure 4 with 2 supplements
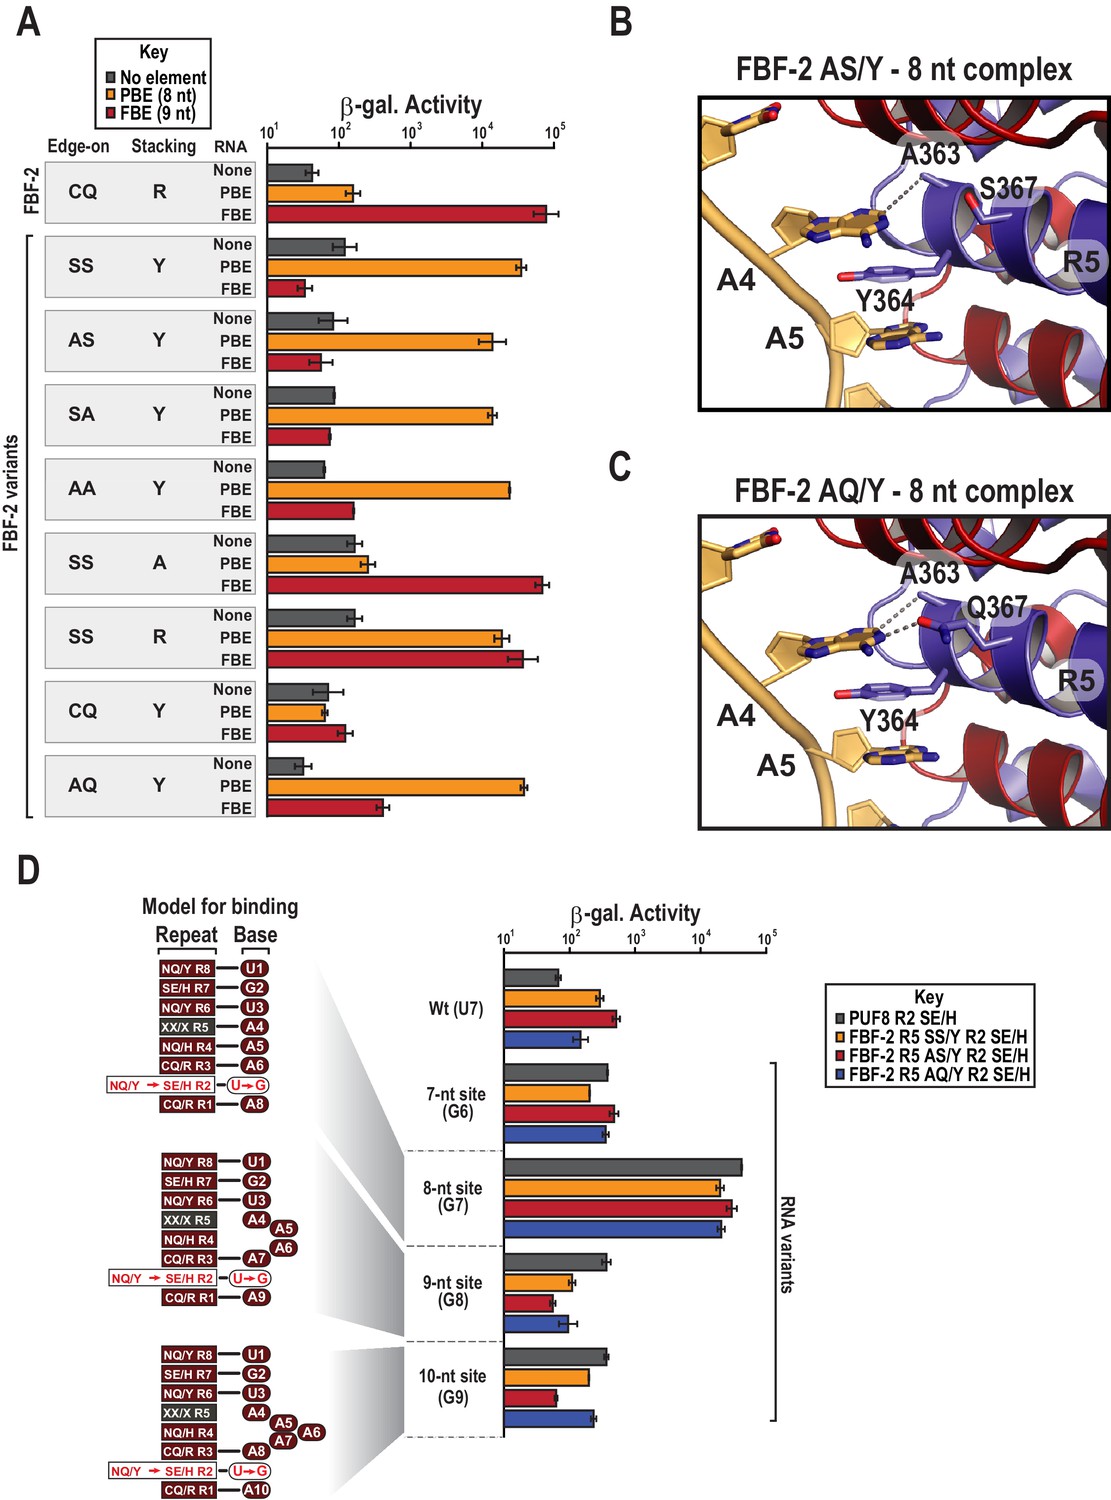
Y364 in the FBF-2 SS/Y variant is critical for 8-nt PBE selectivity.
(A) Interaction of FBF-2 TRM variants with 8-nt PBE and 9-nt FBE RNAs. Yeast 3-hybrid analyses of binding by FBF-2 WT and the FBF-2 SS/Y variant to an MS2 hairpin (None, grey) or an MS2 hairpin fused to an 8-nt PBE (orange) or a 9-nt FBE (red). Binding activity is shown as units of β-galactosidase activity. Source data areavailable in Figure 4—source data 1. (B) The FBF-2 AS/Y variant binds to the PBE RNA in a 1:1 recognition pattern similar to the SS/Y variant. Hydrogen bond and van der Waals interactions are indicated with dashes. (C) The FBF-2 AQ/Y variant binds to the PBE RNA in a 1:1 recognition pattern. (D) The FBF-2 variants retain recognition of the 3´ sequence. Yeast 3-hybrid analyses of binding by PUF-8 and FBF-2 variants to an MS2 hairpin fused to an 8-nt WT PBE or a 7–10-nt PBE with the penultimate nucleotide changed to G. Binding activity is shown as units of β-galactosidase activity normalized to cell count. Error bars indicate the standard deviation of three replicate measurements. Mutants in PUF-8, FBF-2 SS/Y, FBF-2 AS/Y, or FBF-2 AQ/Y introduce a requirement for a G base opposite repeat R2, and interaction with only 8-nt sequences indicates the importance of the 3´ sequence. Source data areavailable in Figure 4—source data 2.
-
Figure 4—source data 1
Raw data for Beta-Glo assay FBF-2 R5 variants with different binding elements.
- https://doi.org/10.7554/eLife.43788.015
-
Figure 4—source data 2
Raw data for Beta-Glo assay FBF-2 R5 variants with different binding elements.
- https://doi.org/10.7554/eLife.43788.016
Figure 4—figure supplement 1
Electrophoretic mobility shift assays.
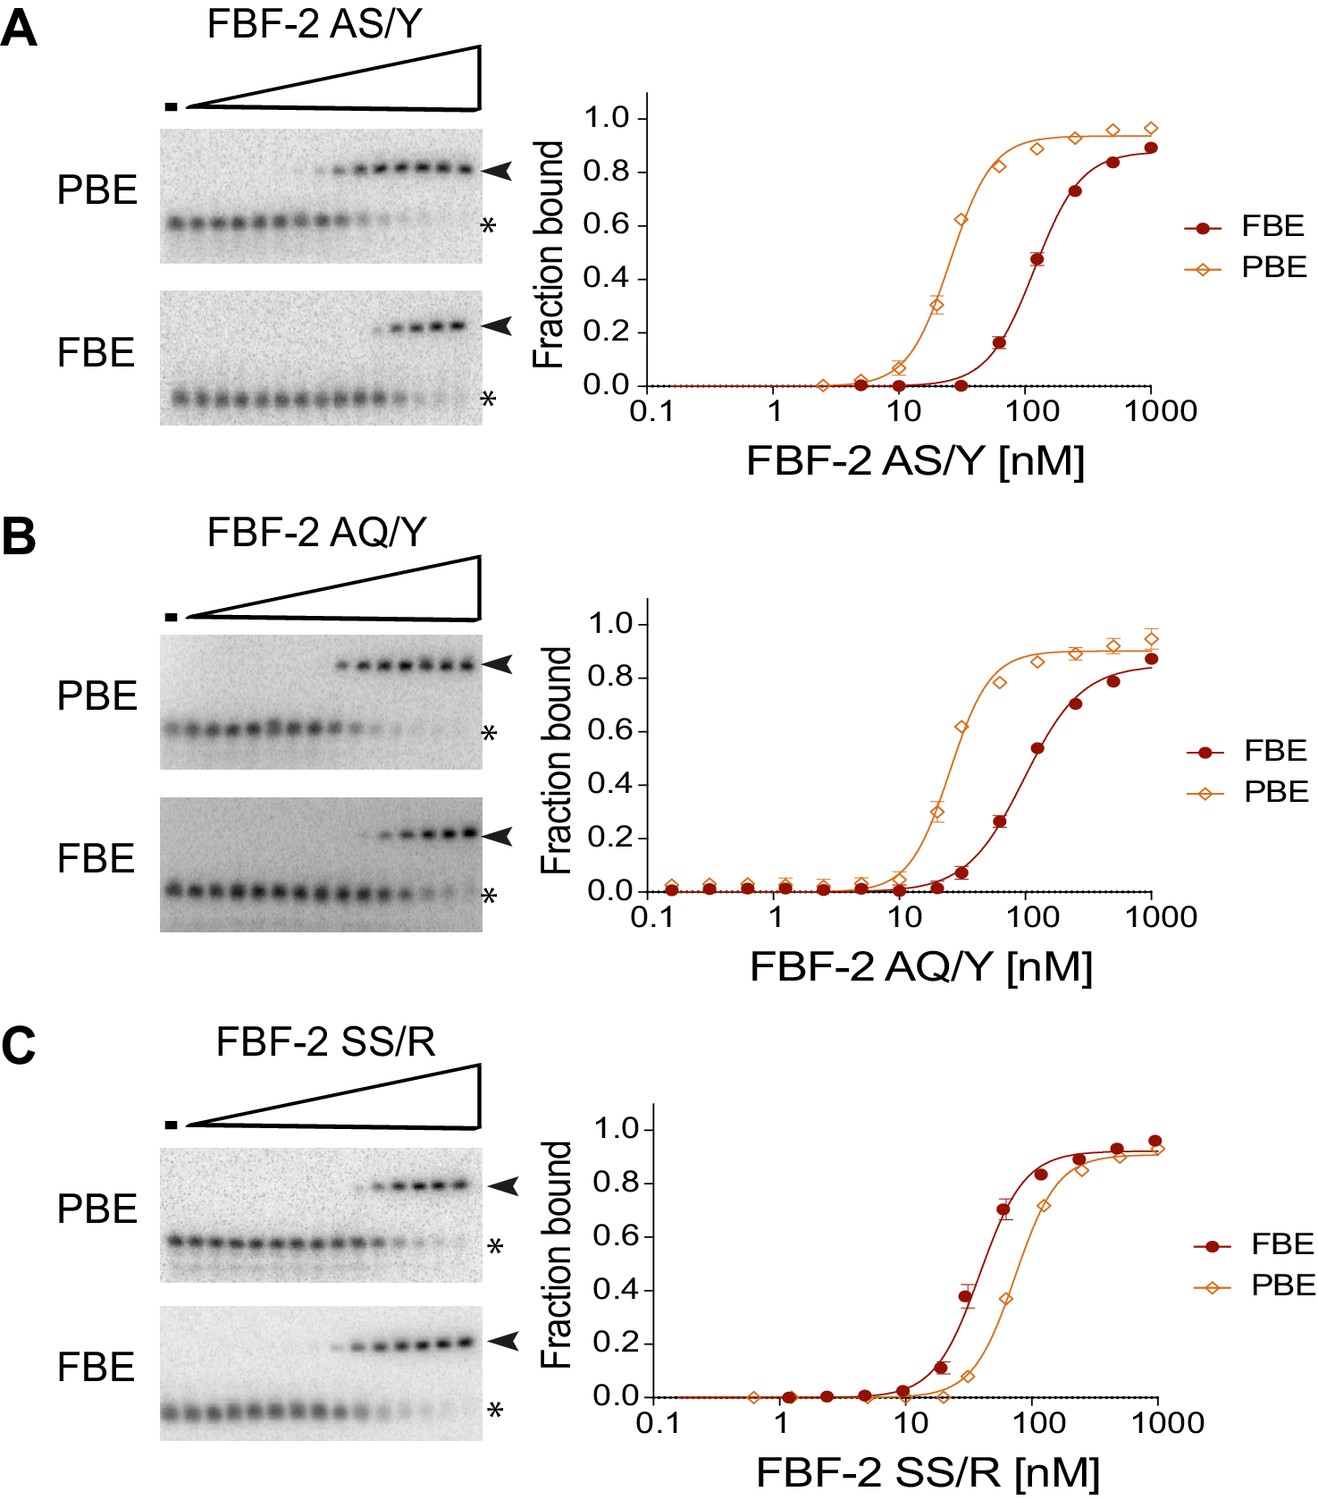
Representative binding curves and corresponding electrophoretic mobility shift assays are shown. (A, B) FBF-2 AS/Y and AQ/Y bind preferentially to an 8-nt PBE versus a 9-nt FBE. (C) FBF-2 SS/R binds with modest preference to an 9-nt FBE versus an 8-nt PBE.
Figure 4—figure supplement 2
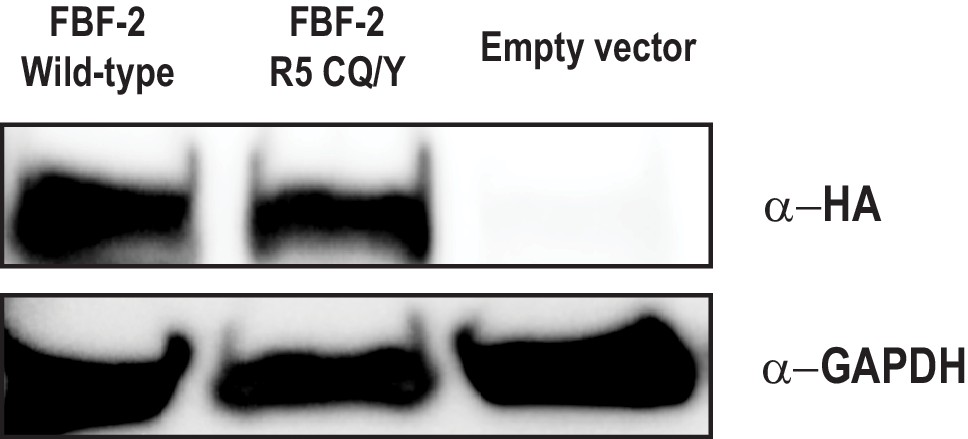
The FBF-2 R5 CQ/Y mutant is expressed in yeast.
Wild-type FBF-2 is expressed at comparable levels to the CQ/Y variant. The pGADT7 vector contains an HA tag which is used to detect activation domain fusions. GAPDH is shown as a load control.
Figure 5
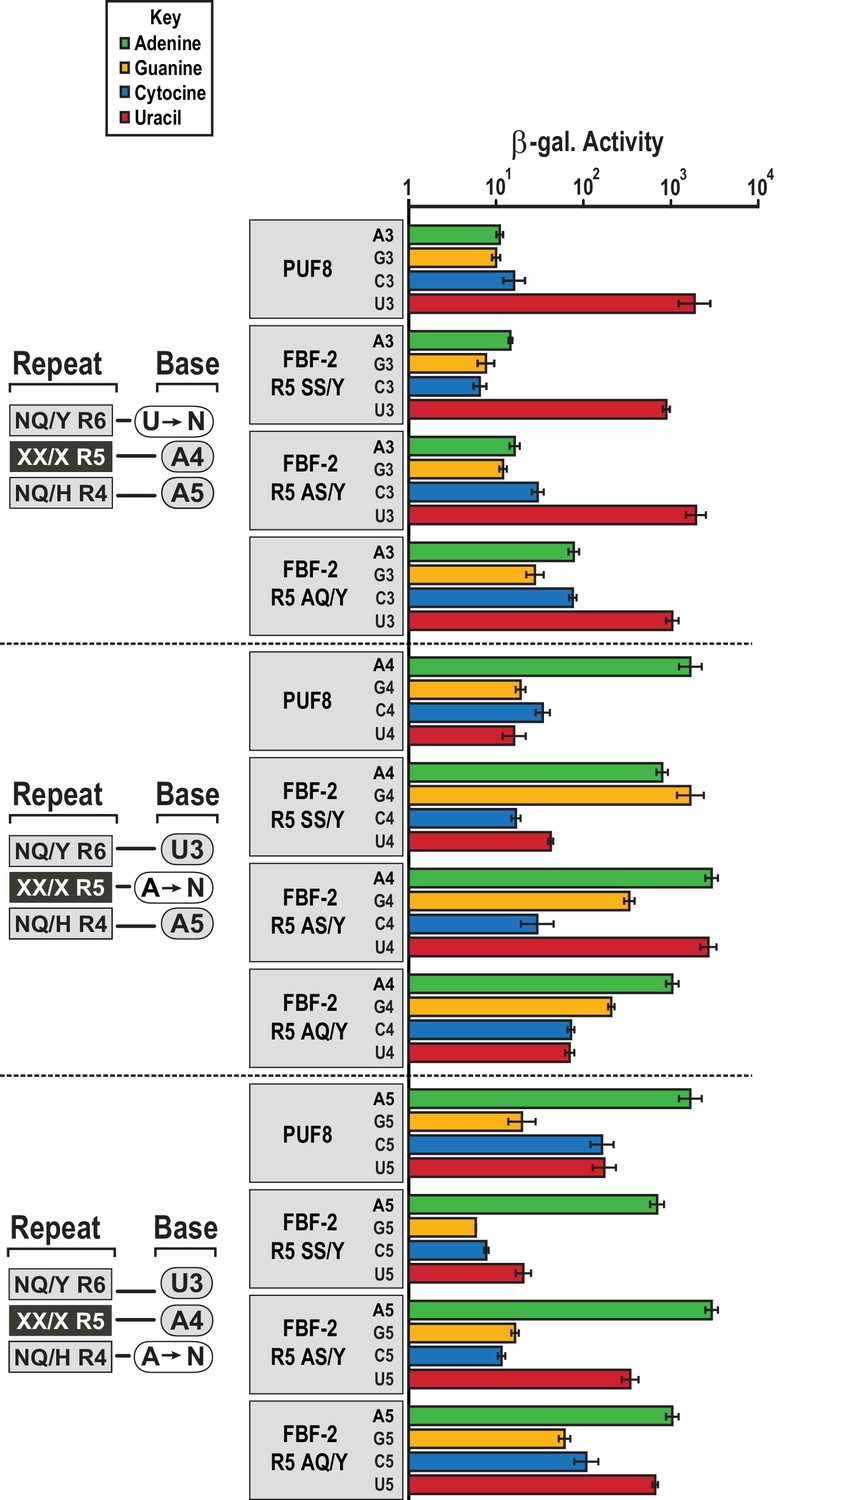
FBF-2 variants retain base recognition specificity at flanking positions.
Yeast 3-hybrid analyses of binding by PUF-8, FBF-2 SS/Y, FBF-2 AS/Y, and FBF-2 AQ/Y to an MS2 hairpin fused to 8-nt PBE RNAs bearing nucleotide substitutions at positions 3–5. Binding activity is shown as units of β-galactosidase activity normalized to cell count. Error bars indicate the standard deviation of three replicate measurements. Source data areavailable in Figure 5—source data 1.
-
Figure 5—source data 1
Raw data for Beta-Glo assay of FBF-2, FBF-2 R5 variants and PUF-8 that carry R2 SE/H mutations with different length binding elements.
- https://doi.org/10.7554/eLife.43788.018
Figure 6
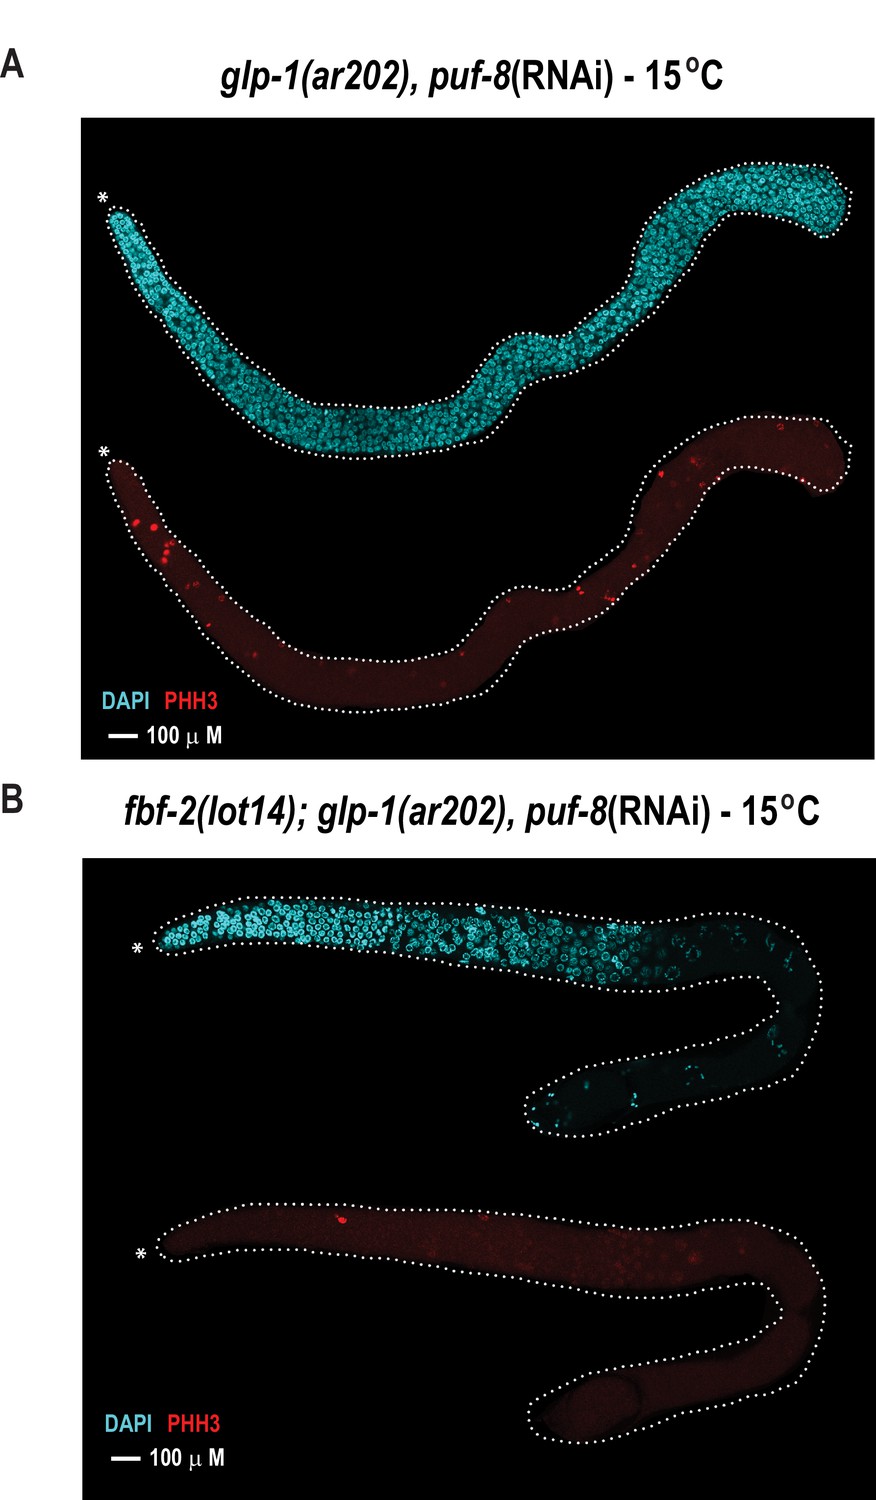
The FBF-2 R5 AQ/Y variant partially rescues the tumorous phenotype in the C.elegans germ line caused by loss of PUF-8 in a sensitized genetic background.
Extruded germlines were stained for nuclei (DAPI, blue) or mitotic cells (α-PHH3, red). (A) Fluorescence microscopic image of an extruded germline from an animal with wild-type fbf-2 and a gain-of-function mutation (glp-1(ar202)) that was subjected to puf-8 depletion by RNAi. These animals produce tumors throughout the germline as evidenced by the presence of red mitotic cells. (B) Fluorescence microscopic image of an extruded germline from an edited animal with FBF-2 AQ/Y variant (fbf-2(lot14)) and a gain-of-function mutation (glp-1(gf)) that was subjected to puf-8 depletion by RNAi. Note the absence of red mitotic cells throughout the gonad.
Tables
Table 1
Data collection and refinement statistics
https://doi.org/10.7554/eLife.43788.003| Protein:RNA | PUF-8: PBE | FBF-2 SS/Y: PBE | FBF-2 AS/Y: PBE | FBF-2 AQ/Y: PBE | |
|---|---|---|---|---|---|
| Data collection | |||||
| Space group | C2 | P61 | P61 | P61 | |
| Unit Cell | a, b, c (Å) | 109.2, 189.0, 63.2 | 96.4, 96.4, 99.9 | 96.5, 96.5, 101.1 | 95.9, 95.9, 100.4 |
| α, β, γ (°) | 90, 103.6, 90 | 90, 90, 120 | 90, 90, 120 | 90, 90, 120 | |
| Resolution (Å) | 50–2.55 (2.59–2.55)* | 50–2.25 (2.29–2.25)* | 50–2.25 (2.33–2.25)* | 50–2.85 (2.9–2.85)* | |
| Rsym or Rmerge | 0.191 (0.692) | 0.101 (0.704) | 0.104 (0.772) | 0.191 (0.957) | |
| I /σI | 9.4 (1.9) | 19.2 (3.42) | 17.1 (2.98) | 12.8 (2.34) | |
| Completeness (%) | 98.9 (98.0) | 99.9 (100) | 99.9 (100) | 99.6 (99.2) | |
| Redundancy | 6.9 (3.6) | 5.7 (5.7) | 5.7 (5.7) | 10.7 (8.8) | |
| Refinement | |||||
| Resolution (Å) | 33.8–2.6 | 32.0–2.3 | 31.6–2.3 | 27.5–2.9 | |
| No. reflections | 37,625 | 25,089 | 25,386 | 12,185 | |
| Rwork/Rfree | 0.229/ 0.285 | 0.158/ 0.204 | 0.167/ 0.223 | 0.219/ 0.272 | |
| No. atoms | |||||
| Protein | 8415 | 3197 | 3194 | 3189 | |
| RNA | 507 | 150 | 168 | 168 | |
| Solvent | 229 | 169 | 109 | 21 | |
| B-factors (Å2) | |||||
| Wilson B | 29.7 | 36.6 | 35.5 | 48.4 | |
| Protein | 32.8 | 45.3 | 45.1 | 50.2 | |
| RNA | 43.6 | 51.4 | 58.8 | 64.8 | |
| Solvent | 32.7 | 49.6 | 44.3 | 23.1 | |
| R.m.s deviations | |||||
| Bond lengths (Å) | 0.002 | 0.007 | 0.007 | 0.002 | |
| Bond angles (°) | 0.45 | 0.77 | 0.78 | 0.38 | |
-
*Values in parentheses are for the highest-resolution shell.
Table 2
RNA-binding analyses of PUF-8 and FBF-2 proteins
https://doi.org/10.7554/eLife.43788.005| Protein | RNA | RNA sequence | Kd (nM) | Krel* |
|---|---|---|---|---|
| PUF-8 | PBE | UGUA UAUA | 28.8 ± 0.7 | 1 |
| PBE-A5 | UGUA AAUA | 25.9 ± 3.1 | 0.9 | |
| PBE-C5 | UGUA CAUA | 44.8 ± 2.4 | 1.6 | |
| PBE-G5 | UGUA GAUA | 45.6 ± 3.1 | 1.6 | |
| FBE | UGUGCCAUA | 3110 ± 656 | 108 | |
| FBF-2 WT | PBE | ACAUGUAA AUAC | 74.6 ± 7.7 | 1 |
| FBE | ACAUGUGCCAUAC | 19.3 ± 0.6 | 0.3 | |
| FBF-2 SS/Y | PBE | ACAUGUAA AUAC | 22.7 ± 0.4 | 1 |
| FBE | ACAUGUGCCAUAC | 50.9 ± 2.3 | 2.2 | |
| FBF-2 AS/Y | PBE | ACAUGUAA AUAC | 16.3 ± 0.8 | 1 |
| FBE | ACAUGUGCCAUAC | 76.7 ± 4.3 | 4.7 | |
| FBF-2 SS/R | PBE | ACAUGUAA AUAC | 51.1 ± 1.1 | 1 |
| FBE | ACAUGUGCCAUAC | 26.9 ± 2.3 | 0.5 | |
| FBF-2 AQ/Y | PBE | ACAUGUAA AUAC | 20.2 ± 1.2 | 1 |
| FBE | ACAUGUGCCAUAC | 79.9 ± 2.0 | 4.0 |
-
*Krel values are calculated for each protein with binding to the PBE RNA set to 1.
-
Table 2—source data 1
Data for Table 2.
- https://doi.org/10.7554/eLife.43788.006
Table 3
Phenotypic analysis of mutant strains
https://doi.org/10.7554/eLife.43788.020| Genotype | RNAi | Wild-type | Complete tumorous | N |
|---|---|---|---|---|
| Germline, % | Germline, % | |||
| glp-1(ar202) | puf-8 | 2 | 98 | 61 |
| glp-1(ar202) | Scramble | 100 | 0 | 95 |
| fbf-2(lot14) glp-1(ar202) | puf-8 | 64 | 36 | 89 |
| fbf-2(lot14) glp-1(ar202) | Scramble | 100 | 0 | 107 |
Additional files
-
Transparent reporting form
- https://doi.org/10.7554/eLife.43788.021
Download links
A two-part list of links to download the article, or parts of the article, in various formats.
Downloads (link to download the article as PDF)
Open citations (links to open the citations from this article in various online reference manager services)
Cite this article (links to download the citations from this article in formats compatible with various reference manager tools)
Engineering a conserved RNA regulatory protein repurposes its biological function in vivo
eLife 8:e43788.
https://doi.org/10.7554/eLife.43788


