Cryo-EM reveals distinct conformations of E. coli ATP synthase on exposure to ATP
- The Victor Chang Cardiac Research Institute, Australia
- UNSW Sydney, Australia
- University of Oxford, United Kingdom
- The University of Wollongong, Australia
- Victor Chang Cardiac Research Institute, Australia
- SUNY Upstate Medical University, United States
Figures
Figure 1 with 12 supplements

Comparison of the maps obtained (a) in the presence of ATP (ATP synthase+ATP) and (b) the autoinhibited state in the absence of ATP (ATP synthaseAI).
Comparison of the active and autoinhibited maps shows that: (i) the overall architecture is similar; (ii) a single β subunit (brighter yellow) is in a closed conformation in the active form and open conformation in the autoinhibited form (black arrows show the direction of movement – view is of the segmented α and β subunits, viewed from below); (iii) density corresponding to the εCTD (coloured green) is very weak in the ATP synthase+ATP map, suggesting it has multiple conformations, whereas in the ATP synthaseAI map, the εCTD is clearly identifiable in the ‘up’ position, with the εCTH1 and εCTH2 bound to the γ subunit (coloured blue).
Figure 1—figure supplement 1
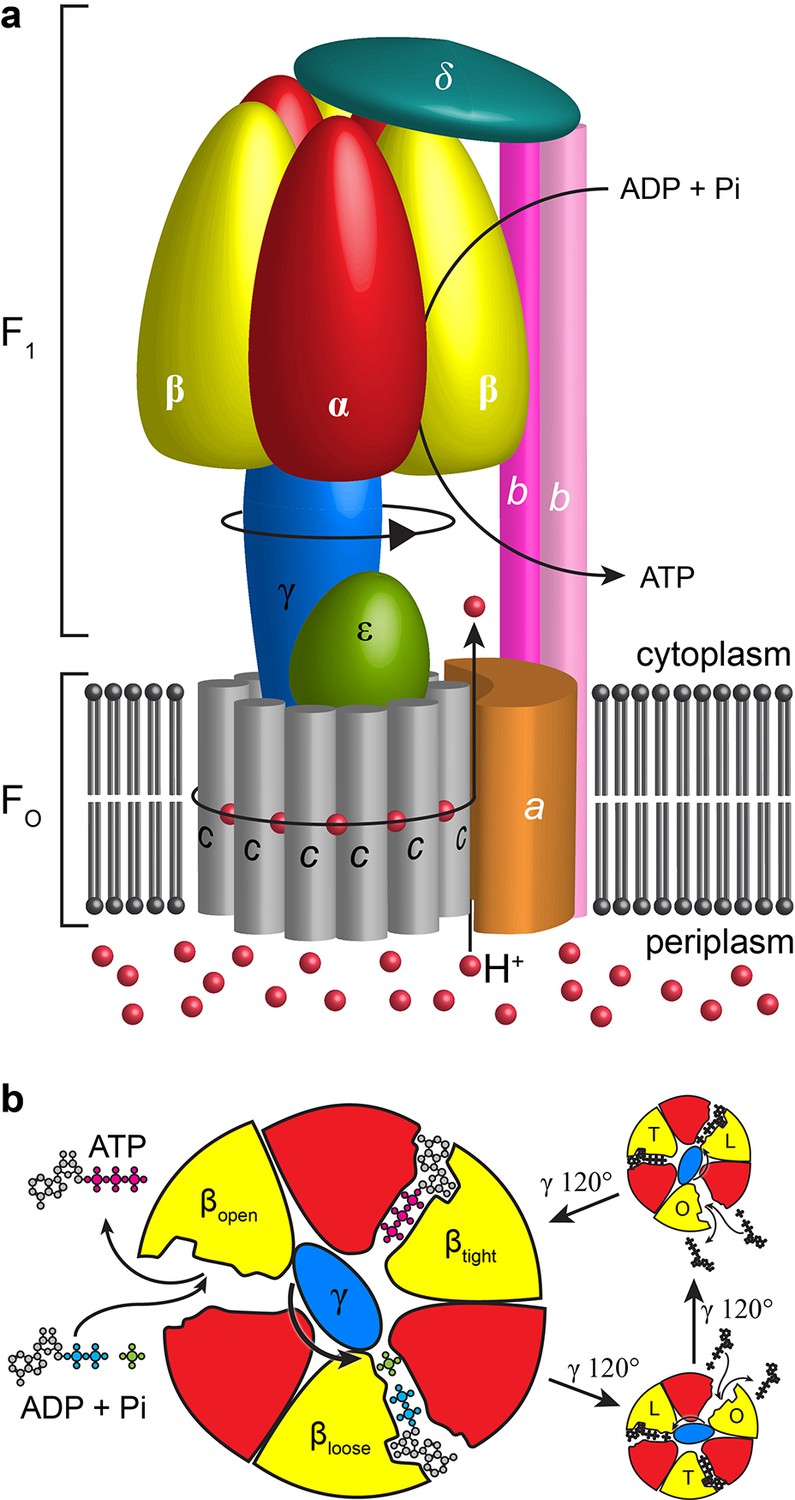
Schematic of E. coli F1Fo ATP synthase.
(a) Schematic representation of the overall architecture of E. coli F1Fo ATP synthase. Subunits are labelled and black arrows show the direction of proton flow, rotation and ATP synthesis. (b) Slice through catalytic subunits in F1 describing rotatory catalytic mechanism.
Figure 1—figure supplement 2
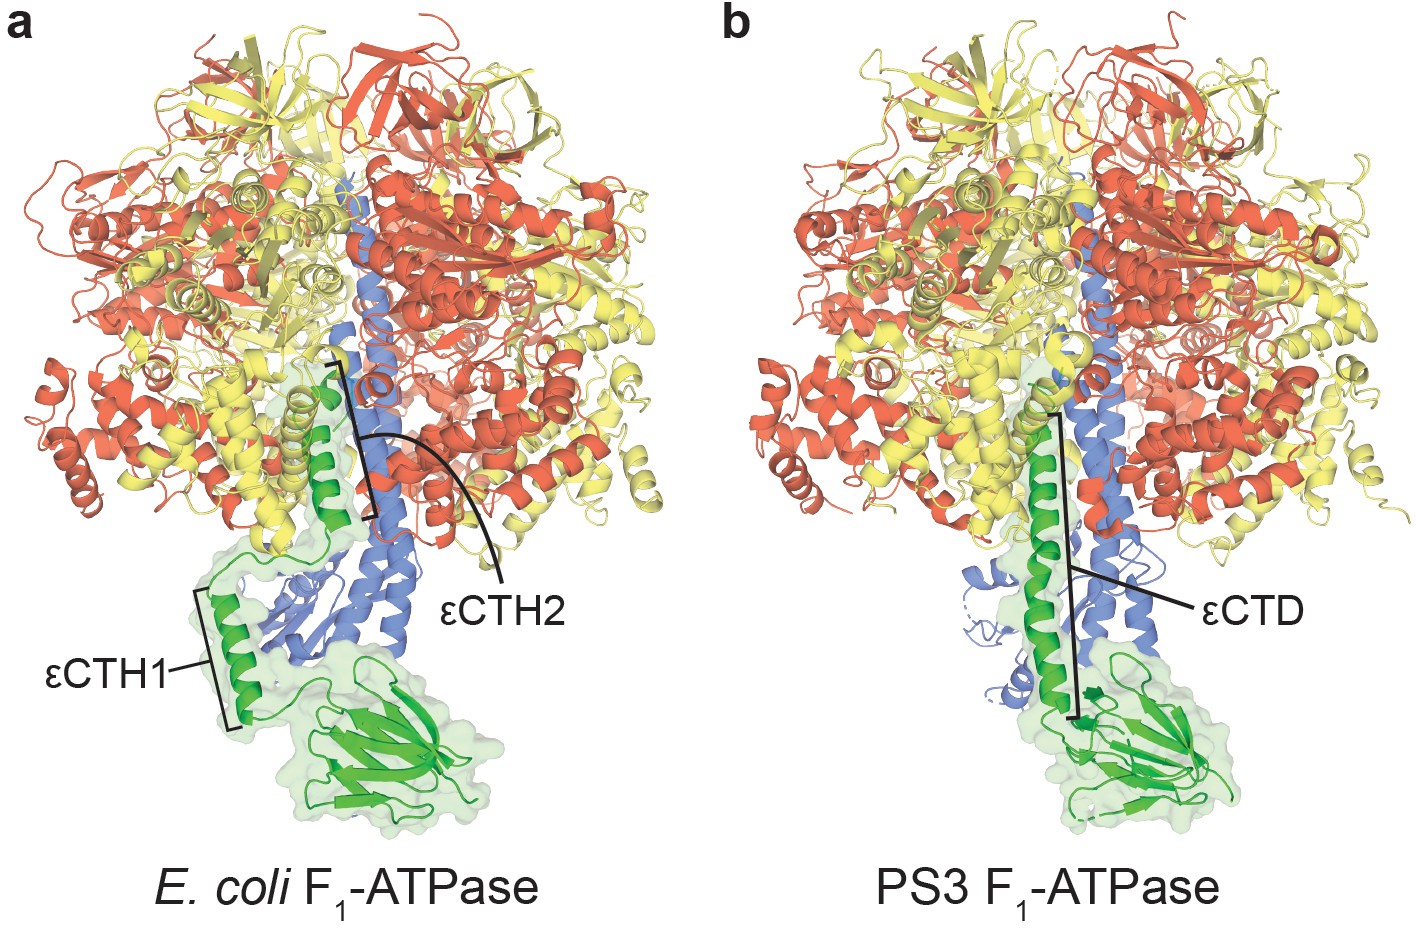
Autoinhibited structures of bacterial F1-ATPases.
Crystal structures of (a) E. coli F1-ATPase (Cingolani and Duncan, 2011), with εCTH1 and εCTH2 labelled, and (b) Bacillus PS3 (Shirakihara et al., 2015), with εCTD labelled, shown as a cartoon with subunits coloured as in Figure 1—figure supplement 1.
Figure 1—figure supplement 3
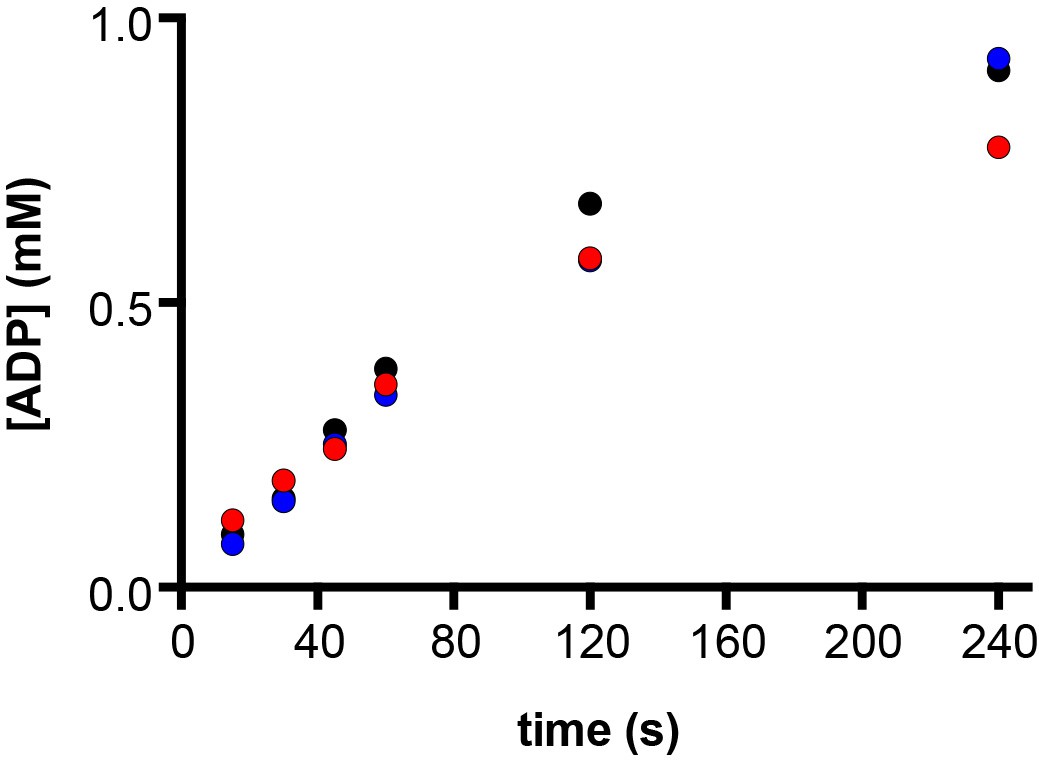
E. coli ATP synthase hydrolyses ATP to ADP.
ATPase enzymatic assays were used to determine changes in ADP concentration over time. At time zero, 10 mM ATP (containing 50 μM ADP) and 10 mM MgCl2 were added to the reaction mixture that contained purified cysteine free E. coli F1F0 ATP synthase and incubated at 22°C. At 15, 30, 45, 60, 120 and 240 s post-ATP addition aliquots of the assay mixture were extracted, and ATP and ADP were quantified using HPLC-UV, with 50 μM ADP subtracted as due to baseline contamination (see Materials and methods). The assay was performed in biological triplicate, using three different protein purifications (labelled black, red and blue). After 45 s, at which point samples were frozen for this cryo-EM study, ~0.25 mM ATP was hydrolysed, and the rate of ADP production was linear. The total concentration of ADP at 45 s was ~0.3 mM.
Figure 1—figure supplement 4

Representative micrograph and top ten 2D classifications.
(a) Representative aligned micrograph showing particle density, white scale bar is 50 nm in length. (b) Output from GCTF showing Fourier transform of micrograph in (a) and CTF fit. (c) Reference free 2D class averages of picked particles show clear ATP synthase molecules. Scale bar is 10 nm in length.
Figure 1—figure supplement 5

Three rotational conformations of the E. coli F1Fo ATP synthase after incubation with ATP.
Cryo-EM maps of ATP synthase+ATP in three conformations, related by a 120° rotation of the central stalk. Central rotor coloured in pale red and stator coloured in pale blue. (a) State 1, (b) State two and (c) State 3 (as designated in Sobti et al., 2016). Rendered as surfaces using ChimeraX (Goddard et al., 2018).
Figure 1—figure supplement 6

Flowchart describing cryo-EM data analysis.
https://doi.org/10.7554/eLife.43864.008
Figure 1—figure supplement 7
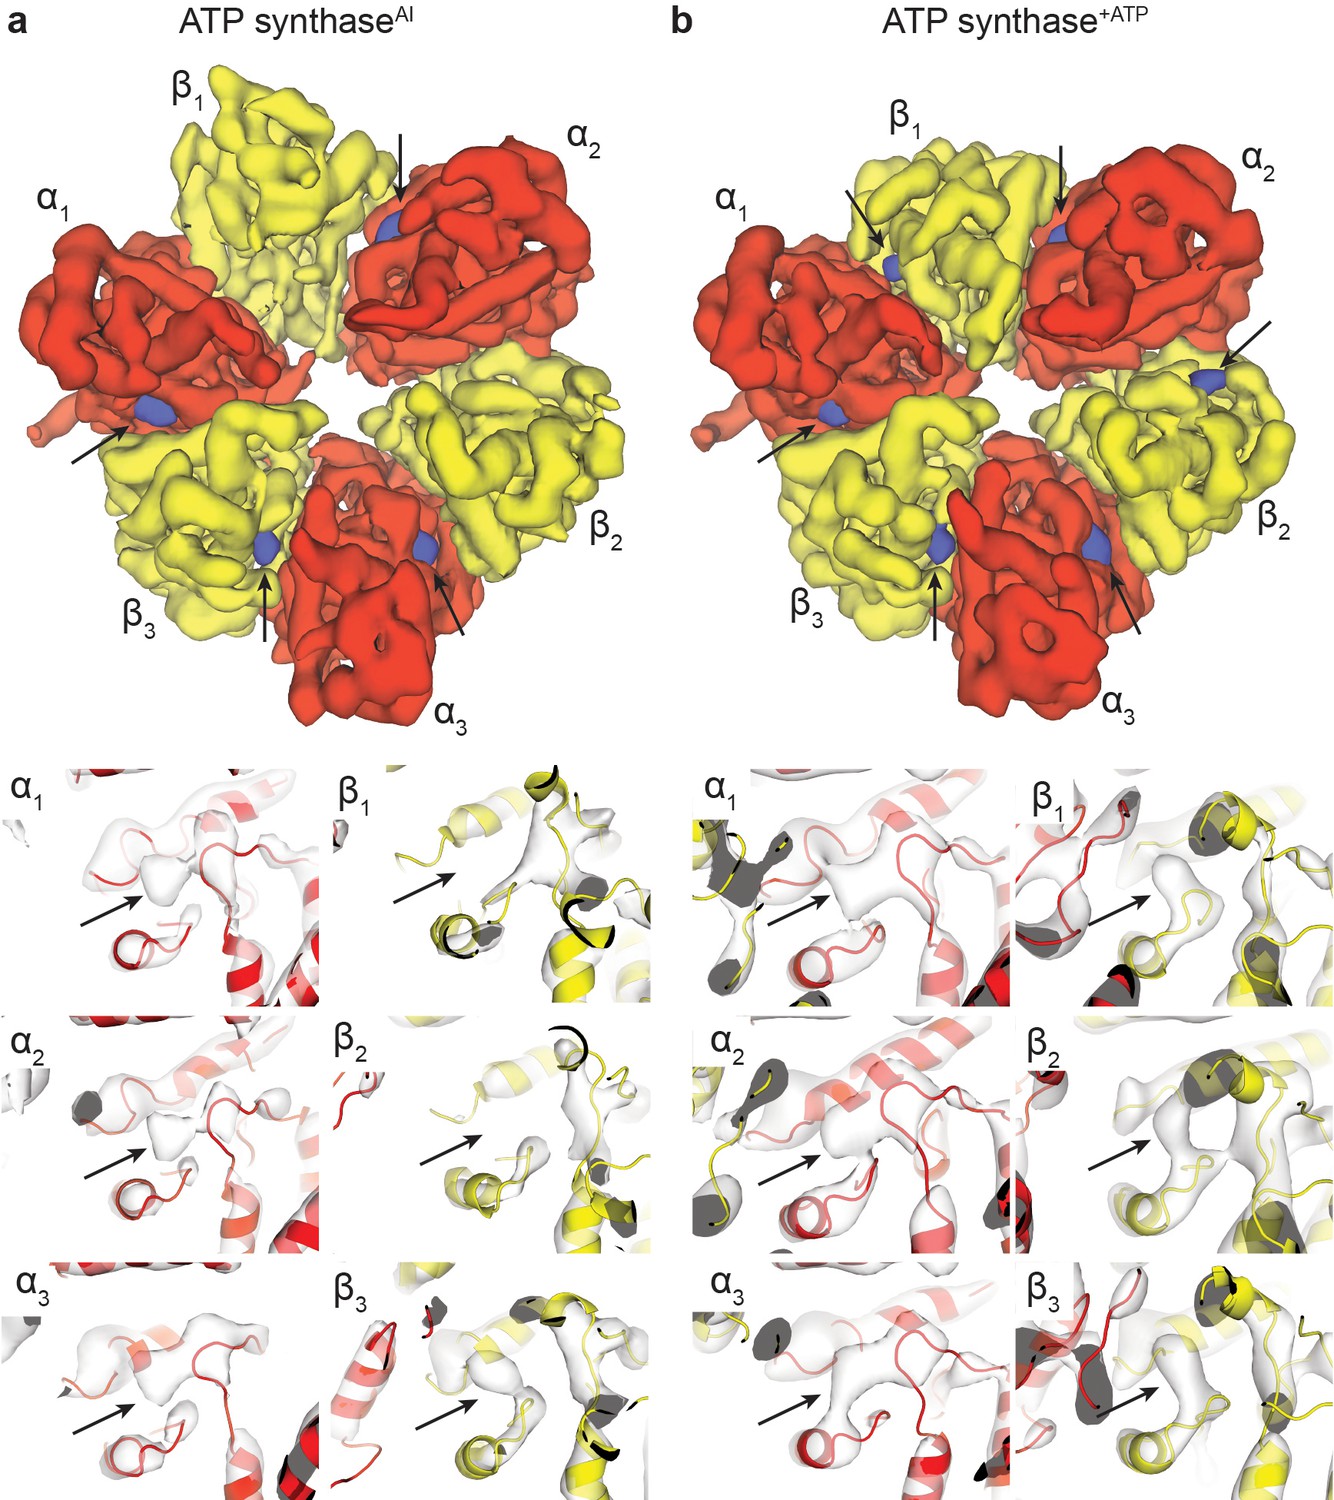
Nucleotide occupancy of the ATP synthaseAI and ATP synthase+ATP maps.
Segmented maps (above) and higher-magnification views of the nucleotide-binding sites (below) show the nucleotide occupancy of the α and β subunits. In segmented maps, the peaks corresponding to density of nucleotide binding are coloured blue, with the α and β subunits in red and yellow, respectively. Black arrows used to highlight nucleotide density. Molecular models of the α and β subunits have been docked to locate the nucleotide-binding domains. (A) ATP synthaseAI and (B) ATP synthase+ATP.
Figure 1—figure supplement 8

Three rotational conformations of the E. coli F1Fo ATP synthase in their autoinhibited form.
Cryo-EM maps of ATP synthaseAI in three conformations, related by a 120° rotation of the central stalk. (a) State 1, (b) State two and (c) State 3 (as designated in Sobti et al., 2016). Rendered as surfaces using ChimeraX (Goddard et al., 2018).
Figure 1—figure supplement 9

The crystal structure of C.thermarum F1 ATPase compared to the ATP synthase+ATP cryo-EM map.
Rigid body fitting of C. thermarum F1 ATPase crystal structure (Ferguson et al., 2016), shown as a cartoon, into the ATP synthase+ATP cryo-EM map, shown as a transparent surface, shows good correlation with the α (red), β (yellow) and γ (blue) subunits, but not the ε subunit (green).
Figure 1—figure supplement 10
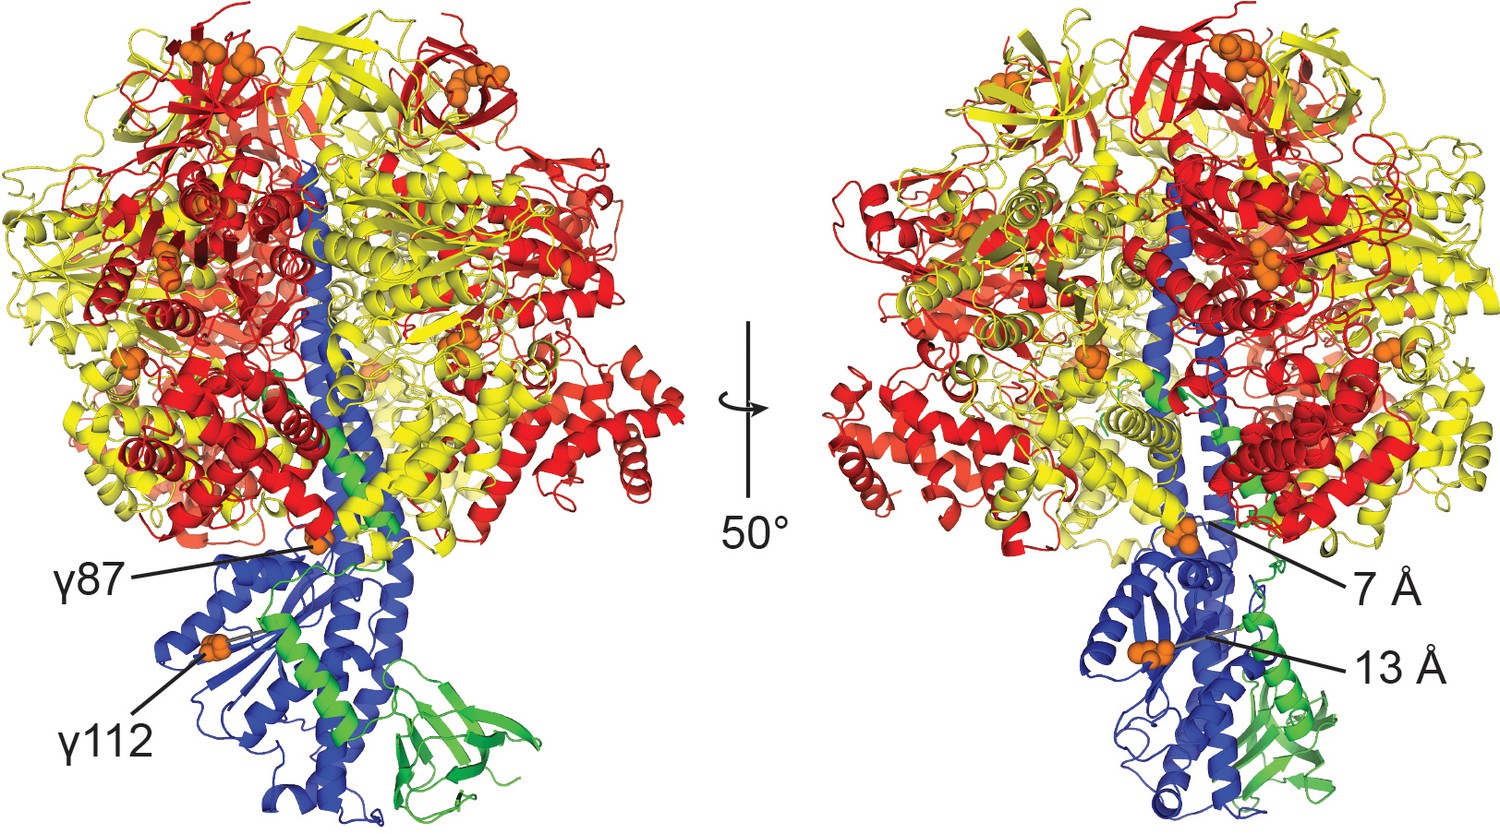
Position of the cysteines in wild-type E. coli F1-ATPase.
Ribbon representation of E. coli F1-ATPase crystal structure (Cingolani and Duncan, 2011). Orange spheres depict the positions of Cys-Ala mutants in the cysteine-free sample used. γC87A and γC112A are closest to the εCTD (7 Å and 13 Å to closest atoms), but are separated from it by loops.
Figure 1—figure supplement 11

Fit of C. thermarum ε subunit into the εCTD ‘down’ ATP synthase+ATP cryo-EM map, highlights density corresponding to the ATP binding site.
Rigid body fitting of the ε subunit from C. thermarum (PDB: 5HKK) shows density at the site of nucleotide binding. (a) Overall map to show threshold used for illustration. (b) Close up, at the same map threshold, of the docked C. thermarum ε subunit and corresponding density. A peak (highlighted blue) can be seen for possible adenine and ribose groups (labelled), but not the phosphate groups.
Figure 1—figure supplement 12
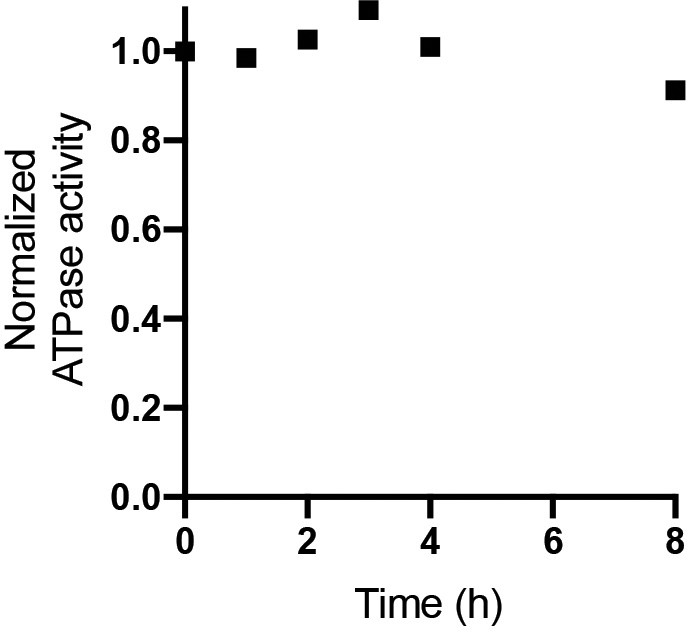
ATPase activity of digitonin solubilized E. coli F1Fo ATP synthase.
E. coli F1Fo ATP synthase purified in digitonin was incubated at room temperature and assessed for ATPase activity at 37°C was measured at 0, 1, 2, 3, 4 and 8 hr time points. ATP regeneration assays were performed as described in. ATPase activity normalized to 80 s−1 showed little change over 8 hr. The rate of ATP hydrolysis was measured with an ATP-regenerating coupled assay that resulted in a final concentration of 50 mM Tris–HCl (pH 8.0), 10 mM KCl, 2.5 mM phosphoenolpyruvate, 0.3 mM NADH, 50 μg/ml pyruvate kinase, 50 μg/ml lactate dehydrogenase, and 2 mM MgCl2 and 1 mM ATP. The rate was determined from the linear change in absorbance at 340 nm, once activity achieved steady-state.
Figure 2 with 1 supplement
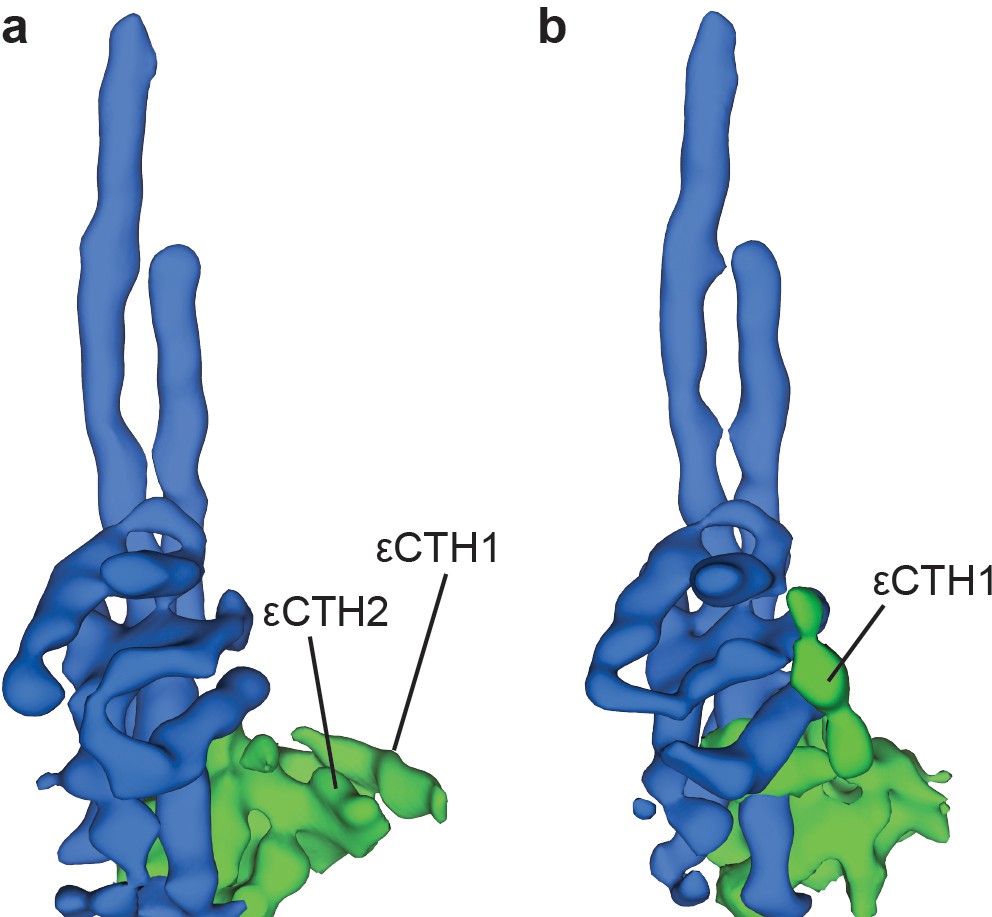
Two conformations of subunit ε are observed in sub-classification of ATP synthase+ATP maps.
Processing and refinement of the ATP synthase+ATP dataset using Relion (Scheres, 2012) identified two conformations for the εCTD. These show a ‘down’ conformation (a) where the εCTH1 and εCTH2 are bound to the N-terminal region of the ε subunit and a ‘half-up’ conformation (b) where the εCTH1 was still bound to the γ subunit but the εCTH2 was not visible even at low thresholds.
Figure 2—figure supplement 1

Two cryo-EM maps filtered from the ATP synthase+ATP dataset show conformational changes in subunit ε.
The majority of subunits show no gross changes in position or conformation, except the ε subunit (green) changes to adopt a ‘down’ position (a) or a ‘half-up’ position (b). Maps of different rotational states are shown, due to clarity of the εCTD in each state.
Figure 3 with 2 supplements

Density observed for the F1Fo ATP synthase peripheral stalk.
The cryo-EM map of ATP synthase+ATP docked with the atomic model of S. oleracea chloroplast ATP synthase peripheral stalk (Hahn et al., 2018), reveal a region of difference density (coloured pink density in a), (b and c) not seen in related F-ATP synthases. (a and b) side views and (c) top view. Coot (Emsley et al., 2010) and PyMol (Schrödinger) were used to create a line object that traced the density believed to be the b subunits. The magenta line (labelled b1) measured 233 Å and the pink line (labelled b2) measured 227 Å (d), suggesting that the difference density seen corresponds to the C-terminus of a single b2 subunit. The b1 and b2 subunits of the E. coli ATP synthase peripheral stalk follow different trajectories across the F1 motor surface.
Figure 3—figure supplement 1
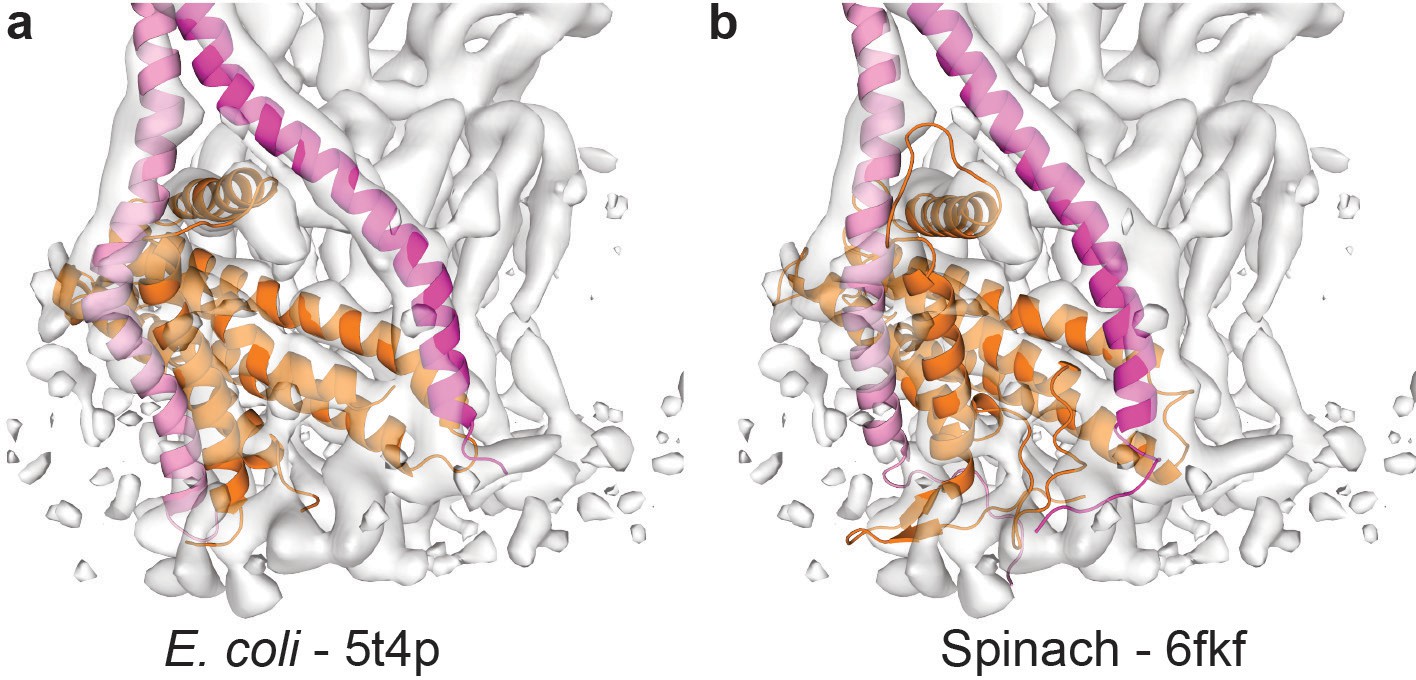
Comparison of the membrane anchoring domain.
Molecular models fitted to the EM density of the Fo motor show subtle differences in the (a) E. coli (Sobti et al., 2016) (pdb-5t4p) and (b) spinach (Hahn et al., 2018) (pdb-6fkf) membrane domains. Subunit a in orange, E. coli b subunits in pink and magenta, and spinach subunit b in magenta and subunit b’ in pink.
Figure 3—figure supplement 2
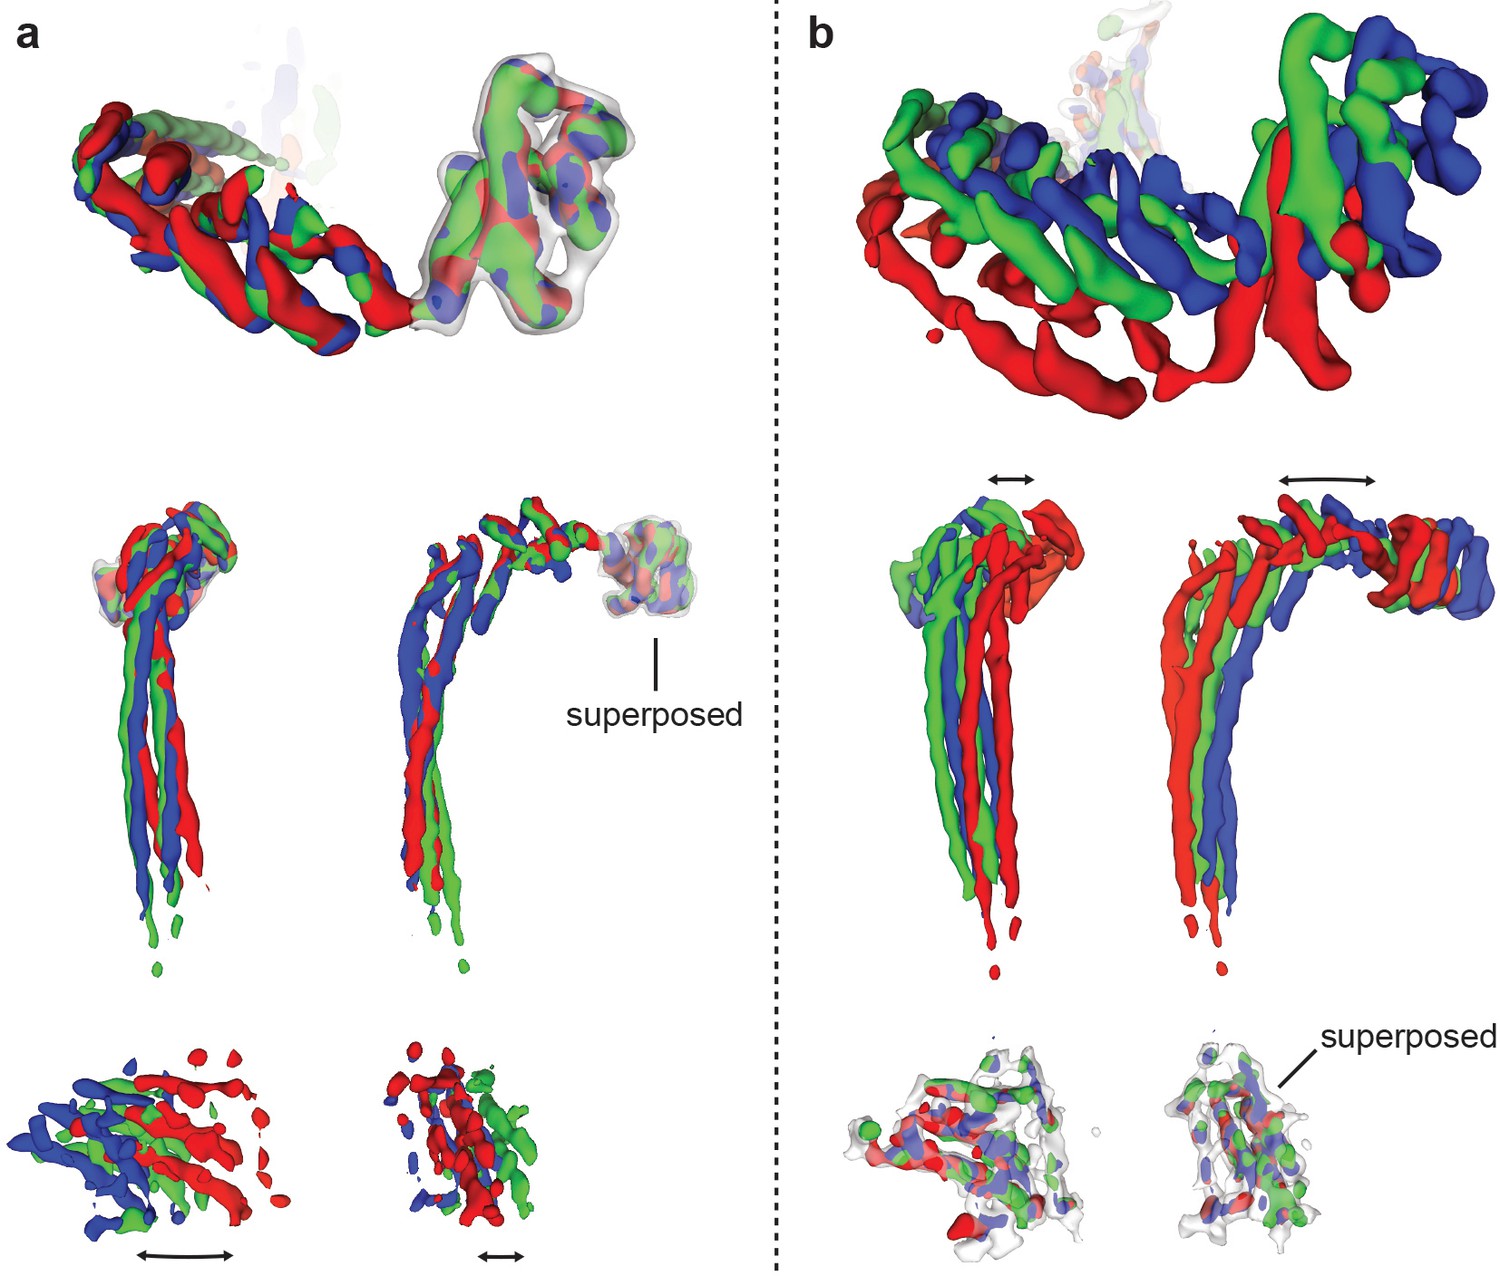
Comparison of peripheral stalk conformations in the three rotational states.
The density corresponding to the peripheral stalk was extracted from the three ATP synthase+ATP maps and superposed on either the C-terminal domain of subunit δ (a) or the stator of Fo (b). Black arrows show the relative movement between the C-terminal domain of subunit δ and stator of Fo, which is likely mediated by flection and twisting in the peripheral stalk.
Figure 4
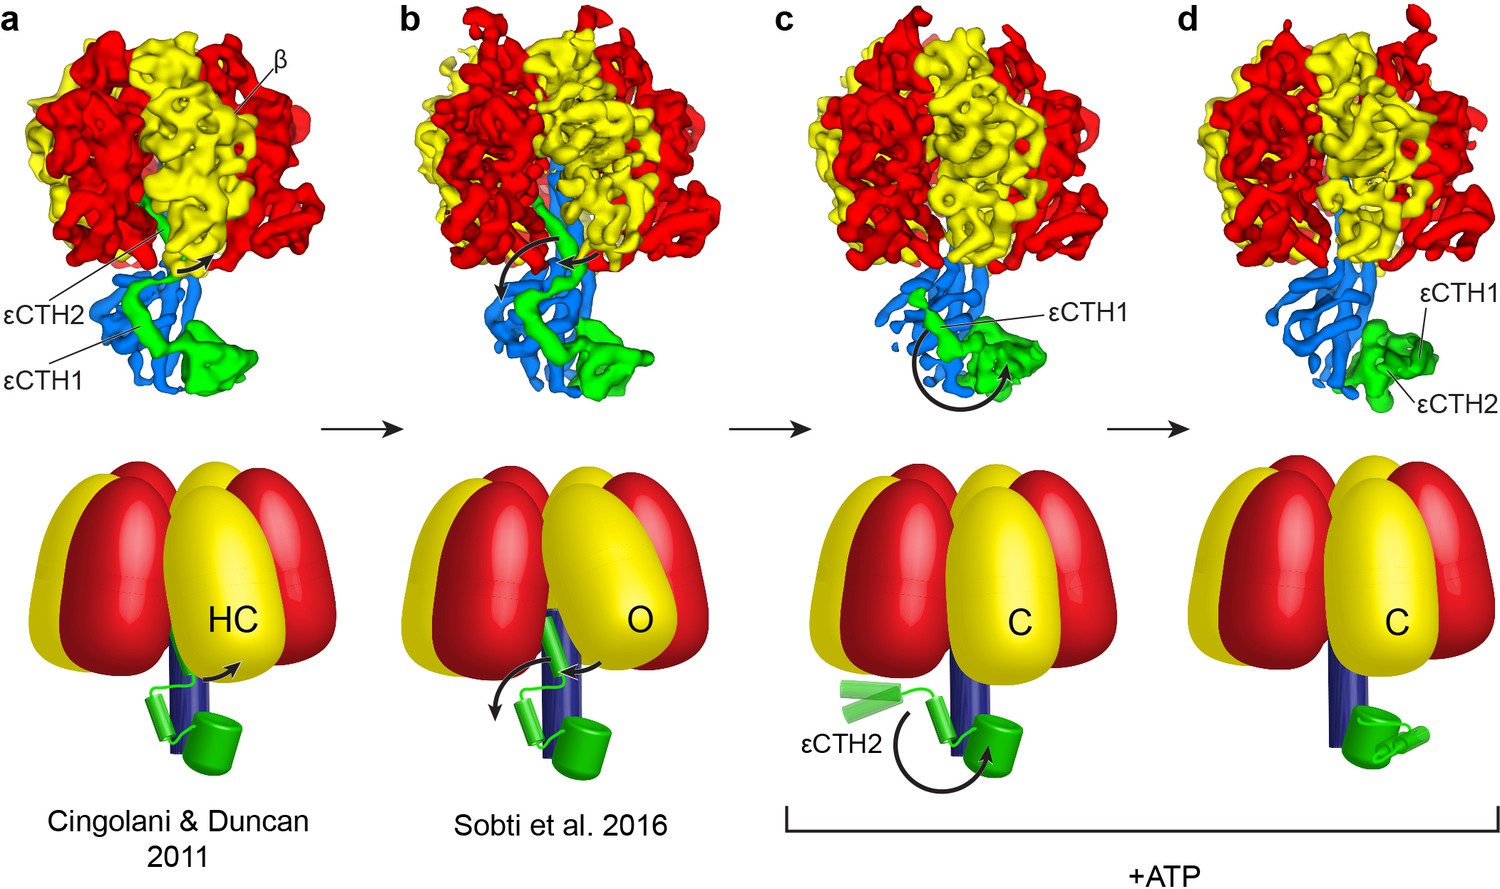
Proposed mechanism for the release of εCTD from the inhibitory ‘up’ conformation in E. coli F1-ATPase.
Structural models presented as maps (above; E. coli crystal structure in (a) presented as low smooth map for comparison) and simple schematics (below) to describe the possible structural movements of E. coli F1-ATPase during activation. In a nucleotide-free solution, the F1-ATPase adopts an inactive state (seen in the crystal structure of isolated E. coli F1-ATPase (Cingolani and Duncan, 2011) and the ATP synthaseAI cryo-EM map (Sobti et al., 2016; (a) and (b) respectively). The isolated F1-ATPase shows one of the β subunits in a ‘half-closed’ state (labelled as HC), interacting with the ‘up’ conformation of the εCTH2 (a). In the cryo-EM maps of the intact enzyme (b), the same β subunit adopts an open conformation (labelled as O) where it no longer interacts with the εCTH2, allowing the reversible release of the helix from its inserted position. In the presence of ATP, the εCTD is seen in two conformations (c and d) that no longer contact the α and β subunits, and the aforementioned β subunit then adopts a closed state (labelled as C) that prevents the εCTD from returning to the ‘up’ conformation. The εCTD can either be in a ‘half-up’ (c) conformation, with the εCTH2 mobile, or a ‘down’ conformation (d) with both εCTH1 and εCTH2 in a condensed form.
Additional files
-
Transparent reporting form
- https://doi.org/10.7554/eLife.43864.021
Download links
A two-part list of links to download the article, or parts of the article, in various formats.
Downloads (link to download the article as PDF)
Open citations (links to open the citations from this article in various online reference manager services)
Cite this article (links to download the citations from this article in formats compatible with various reference manager tools)
Cryo-EM reveals distinct conformations of E. coli ATP synthase on exposure to ATP
eLife 8:e43864.
https://doi.org/10.7554/eLife.43864


