The modular mechanism of chromocenter formation in Drosophila
- University of Michigan, United States
- Howard Hughes Medical Institute, University of Michigan, United States
Figures
Figure 1
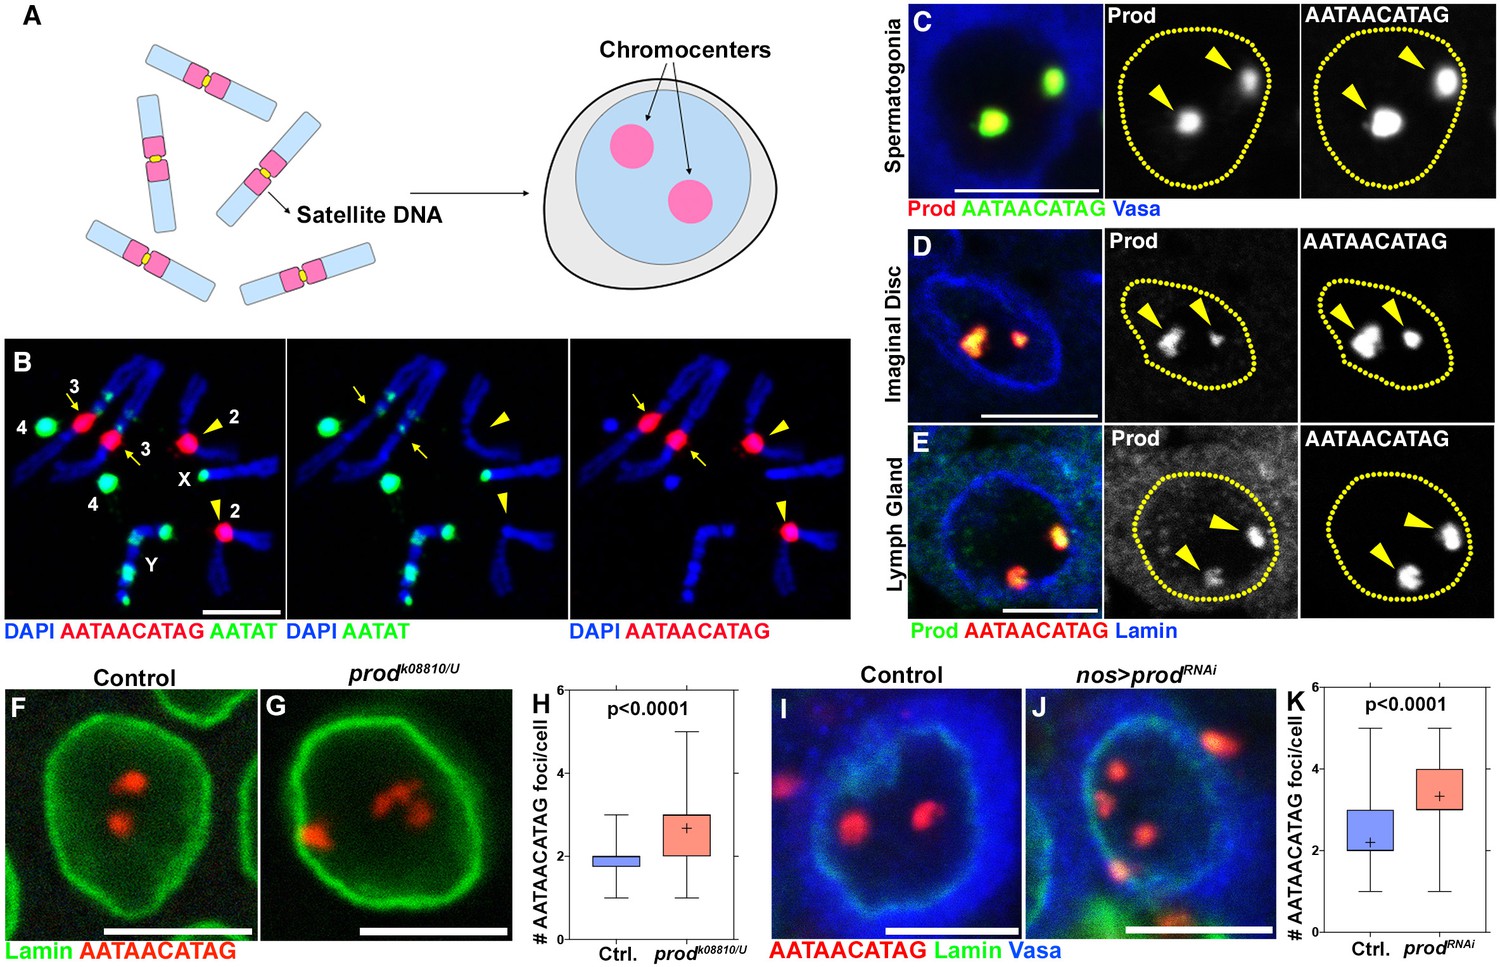
Prod bundles the {AATAACATAG}n satellite DNA on the Drosophila melanogaster major autosomes into chromocenters.
(A) Schematic of chromosomes containing distinct pericentromeric satellite DNAs being organized into chromocenters. (B) FISH against the {AATAACATAG}n satellite (red) and the {AATAT}n satellite (green) on Drosophila larval neuroblast mitotic chromosomes co-stained with DAPI (blue) indicating the locations of these satellites in the Drosophila genome. Chromosome 2 (arrowheads) and chromosome 3 (arrows) were distinguished based on a small amount of {AATAT}n satellite on the chromosome 3. (C) FISH against the {AATAACATAG}n satellite (green) in a spermatogonium co-stained with Prod (red) and Vasa (blue). (D, E) FISH against the {AATAACATAG}n satellite (green) in larval imaginal disc cells (D) and larval lymph gland cells (E) co-stained with Prod (red) and Lamin (blue). (F, G) FISH against the {AATAACATAG}n satellite (red) in heterozygous control (F) and prodk08810/U (G) larval imaginal disc cells co-stained with Lamin (green). (H) Quantification of the number of {AATAACATAG}n chromocenters per larval imaginal disc cell (heterozygous control n = 70, prodk08810/U n = 71). (I, J) FISH against the {AATAACATAG}n satellite (red) in control (nos-gal4/+; UAS-dcr-2/+) (I) and Prod depleted (nos-gal4/UAS-prodRNAi; UAS-dcr-2/+) (J) spermatogonia co-stained with Lamin (green) and Vasa (blue). (K) Quantification of {AATAACATAG}n chromocenters per spermatogonium (control n = 75, nos >prodRNAi n = 75). P values from Student’s t-test are shown and crosshairs mark the mean. All scale bars are 5 μm.
-
Figure 1—source data 1
Number of AATAACATAG foci/cell in control vs prod mutant imaginal discs (corresponding to Figure 1H).
- https://doi.org/10.7554/eLife.43938.003
-
Figure 1—source data 2
Number of AATAACATAG foci/cell in control vs prodRNAi spermatogonia (corresponding to Figure 1K).
- https://doi.org/10.7554/eLife.43938.004
Figure 2 with 2 supplements
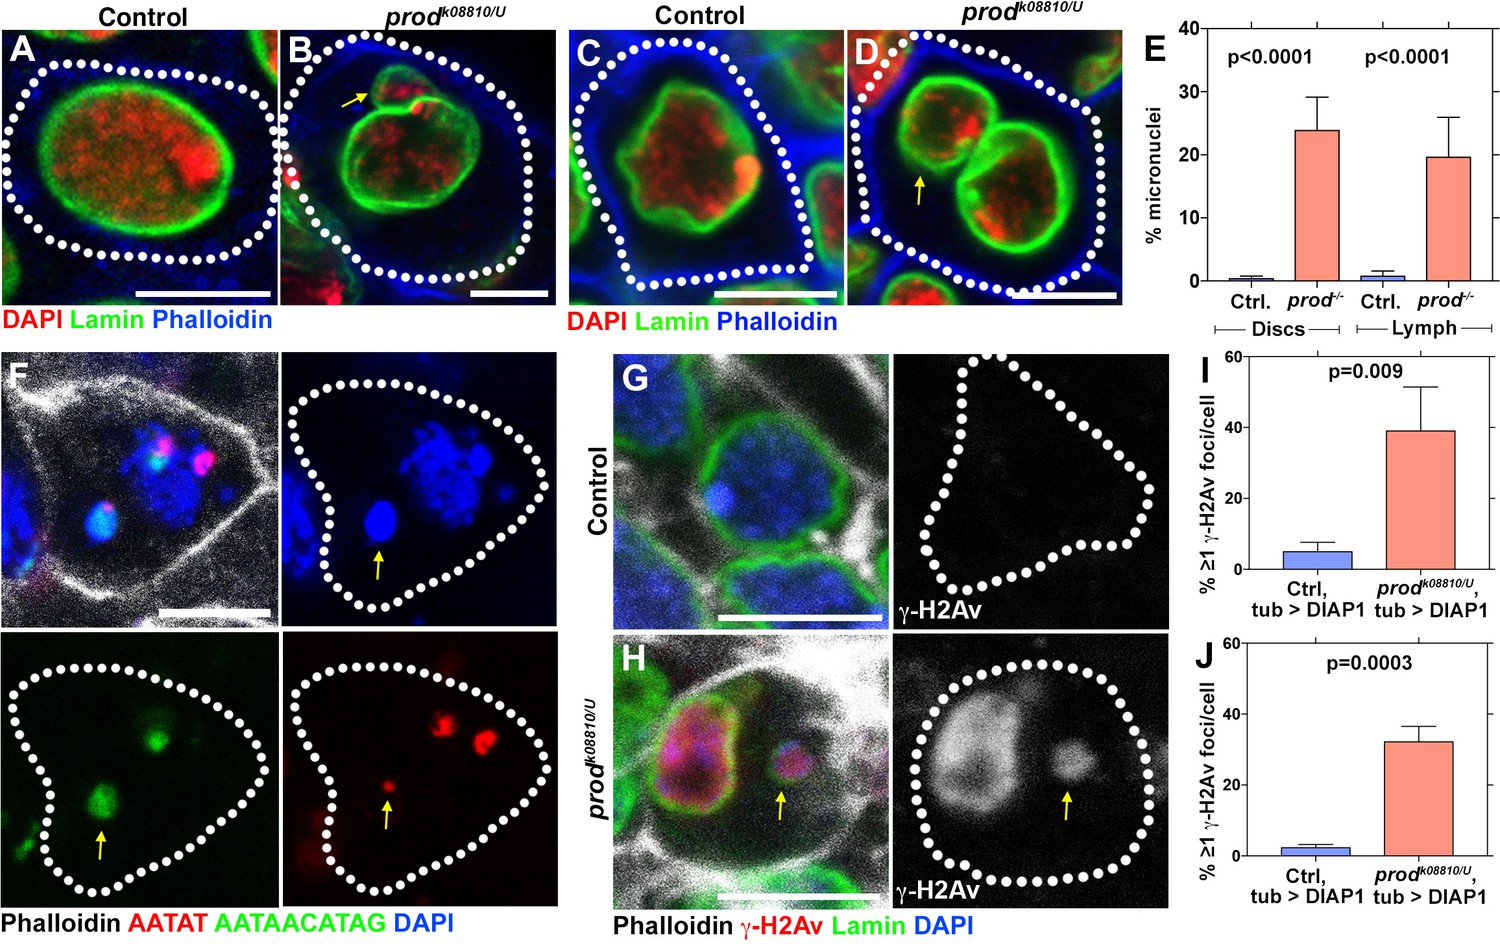
Loss of prod results in micronuclei formation and elevated DNA damage in larval imaginal discs and lymph glands.
(A, B) Heterozygous control (A) and prodk08810/U mutant (B) larval imaginal disc cells stained with DAPI (red), Lamin (green), and Phalloidin (blue). Arrow indicates micronucleus. (C, D) Heterozygous control (C) and prodk08810/U mutant (D) larval lymph gland cells stained with DAPI (red), Lamin (green), and Phalloidin (blue). Arrow indicates micronucleus. (E) Quantification of micronuclei containing cells in heterozygous control and prodk08810/U mutant imaginal discs and lymph glands. Control discs n = 744, prod mutant discs n = 501, Control lymph n = 664, prod mutant lymph n = 345. (F) FISH against the {AATAT}n satellite (red) and the {AATAACATAG}n satellite (green) in a prod mutant larval imaginal disc cell co-stained with Phalloidin (white) and DAPI (blue). Arrow indicates the presence of the third chromosome in the micronucleus. (G, H) Heterozygous control (G) and prodk08810/U mutant (H) larval imaginal disc cells stained with Phalloidin (white), γ-H2Av (red), Lamin (green), and DAPI (blue). Arrow indicates the micronucleus containing DNA damage (γ-H2Av). Note that major nuclei also contain DNA damage upon chromocenter disruption as was observed in D1 mutant (Jagannathan et al., 2018). (I, J) Quantification of cells containing ≥1 γ-H2Av foci in heterozygous control and prodk08810/U imaginal discs (I) and lymph glands (J). In all cases (panels G, (H, I, J), apoptotic cell death was blocked by expressing UAS-DIAP1 with a ubiquitous tub-gal4 driver. Control discs n = 577, prod mutant discs n = 278, Control lymph n = 330, prod mutant lymph n = 216. P values from student’s t-test are shown. All error bars: SD. All scale bars: 5 μm.
-
Figure 2—source data 1
Frequency of micronuclei in control vs prod mutant imaginal disc and lymph gland cells (corresponding to Figure 2E).
- https://doi.org/10.7554/eLife.43938.006
-
Figure 2—source data 2
Frequency of cells containing γ-H2Av foci in control vs prod mutant imaginal discs expressing DIAP1 (corresponding to Figure 2I).
- https://doi.org/10.7554/eLife.43938.007
-
Figure 2—source data 3
Frequency of cells containing γ-H2Av foci in control vs prod mutant lymph glands expressing DIAP1 (corresponding to Figure 2J).
- https://doi.org/10.7554/eLife.43938.008
Figure 2—figure supplement 1
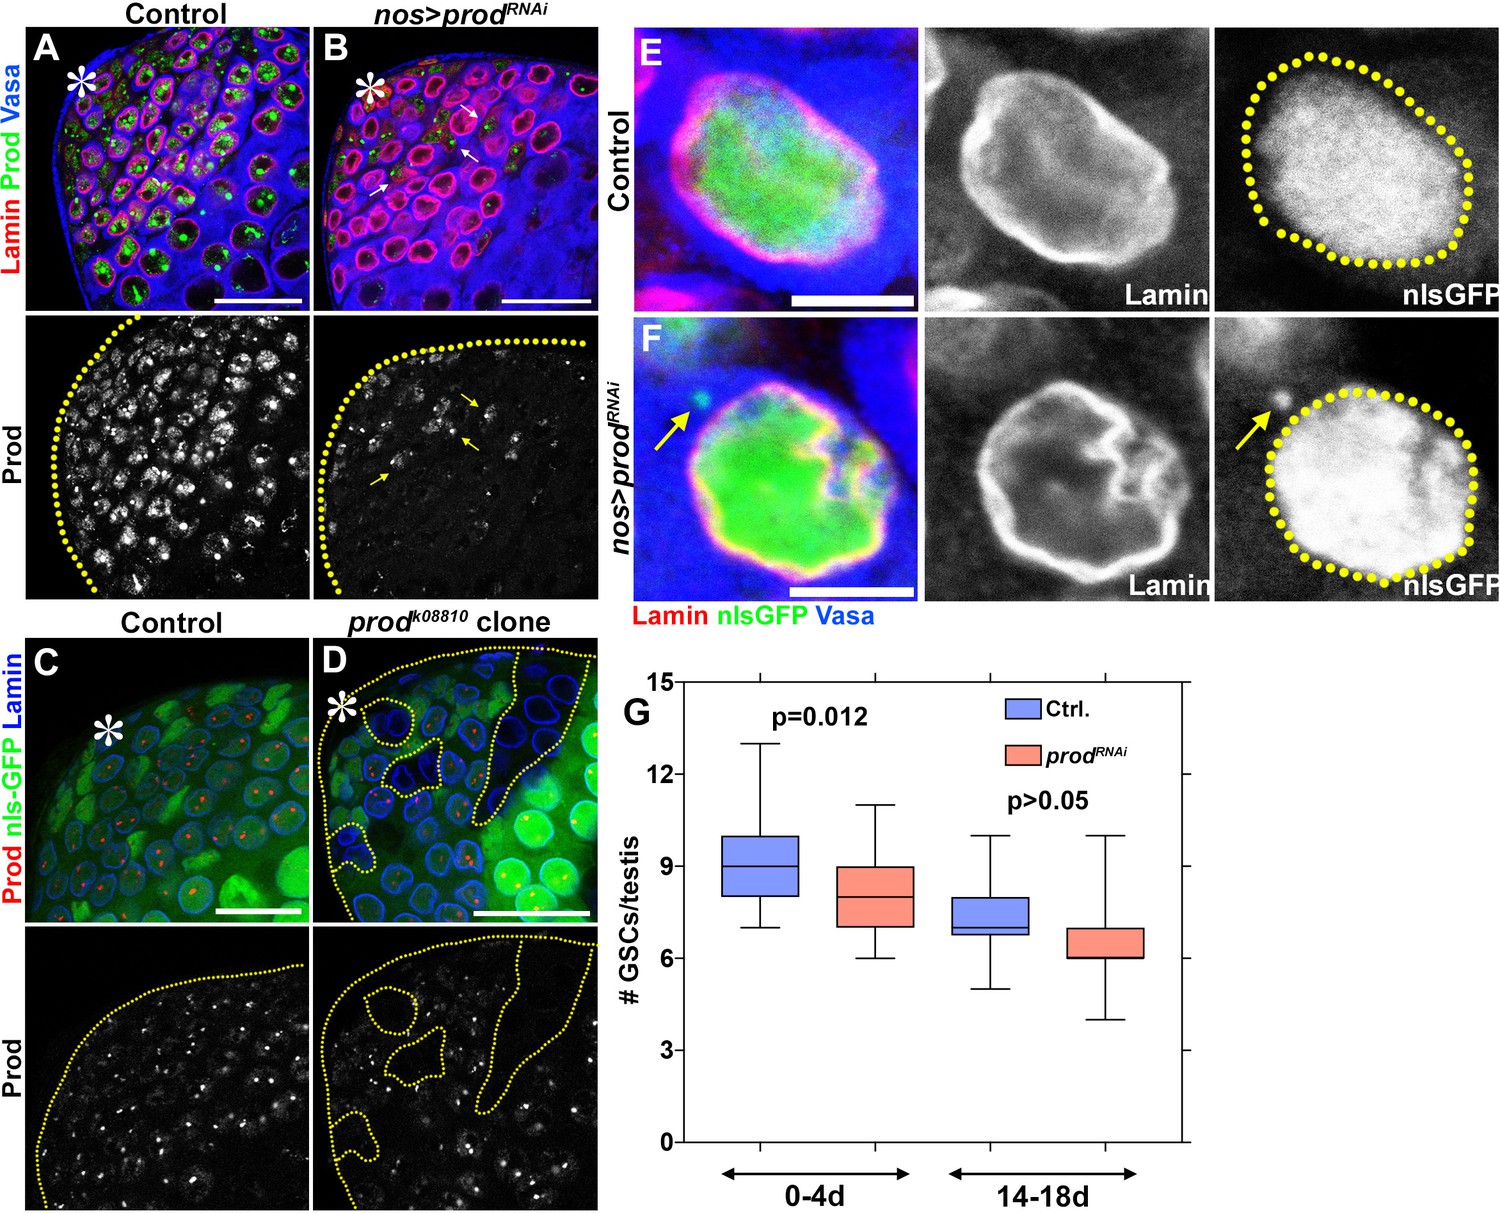
Depletion of prod in spermatogonial cells does not result in micronuclei or loss of cellular viability.
(A, B) Control (nos-gal4/+; UAS-dcr-2/+) (A) and prod-depleted (nos-gal4/UAS-prodRNAi; UAS-dcr-2/+) (B) spermatogonial cells were stained with Lamin (red), Prod (green), and Vasa (blue). Arrows indicate cyst cells with Prod signal. Asterisk indicates the apical tip of the testis. Scale bars: 25 μm. (C, D) Clones of control (heterozygous or wild-type) (C) or prodk08810 (D) were induced in spermatogonial cells and stained with Prod (red) and Lamin (blue). Yellow line indicates testis boundary and demarcates prod-null clones. Scale bars: 25 μm. (E, F) Control (nos-gal4/+; UAS-GFP-nls/UAS-dcr-2) (E) and prod-depleted (nos-gal4/UAS-prodRNAi; UAS-GFP-nls/UAS-dcr-2) (F) spermatogonial cells expressing nls-GFP (green) were stained with Lamin (red) and Vasa (blue). Arrow indicates nls-GFP in the cytoplasm of a prod-depleted spermatogonial cell. Scale bars: 5 μm. (G) Box and whisker plot of the number of germline stem cells per testis across two time windows (control 0-4d n = 26, nos-gal4/UAS-prodRNAi 0-4d n = 50, control 14-18d n = 18, nos-gal4/UAS-prodRNAi 14-18d n = 39). P values from Student’s t-test are shown.
-
Figure 2—figure supplement 1—source data 1
GSC number/testis in control vs prod RNAi testes (corresponding to Figure 2—figure supplement 1G).
- https://doi.org/10.7554/eLife.43938.010
Figure 2—figure supplement 2
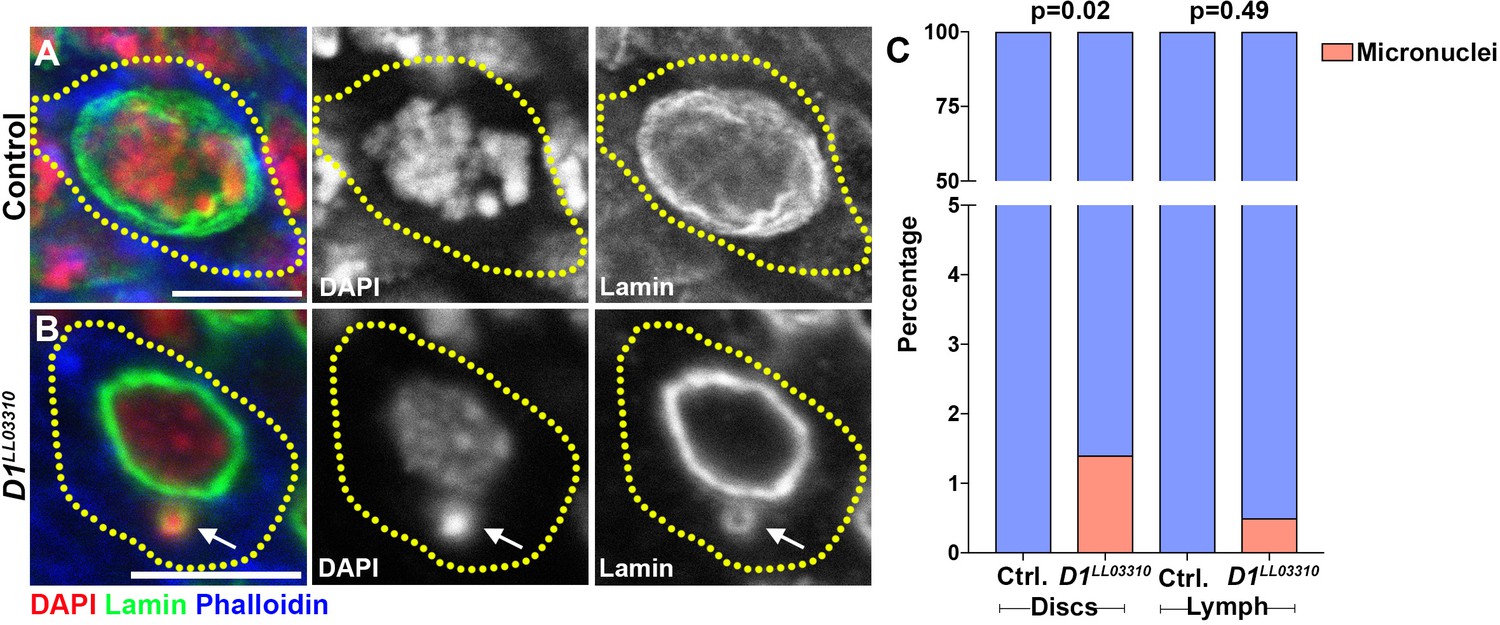
Loss of D1 results in low levels of micronuclei formation in larval imaginal discs and lymph glands.
(A, B) Heterozygous control (A) and homozygous D1LL03310 mutant (B) imaginal disc cells were stained with DAPI (red), Lamin (green), and Phalloidin (blue). Arrow indicates micronucleus. (C) Quantification of micronuclei containing cells in heterozygous control and homozygous D1LL03310 mutant imaginal discs and lymph glands. Control discs n = 360, D1 mutant discs n = 347, Control lymph n = 215, D1 mutant lymph n = 210. P values from Fisher’s exact test are shown. All scale bars are 5 μm.
-
Figure 2—figure supplement 2—source data 1
Frequency of cells containing micronuclei in control vs D1 mutant cells in imaginal discs and lymph glands (corresponding to Figure 2—figure supplement 2C).
- https://doi.org/10.7554/eLife.43938.012
Figure 3 with 1 supplement
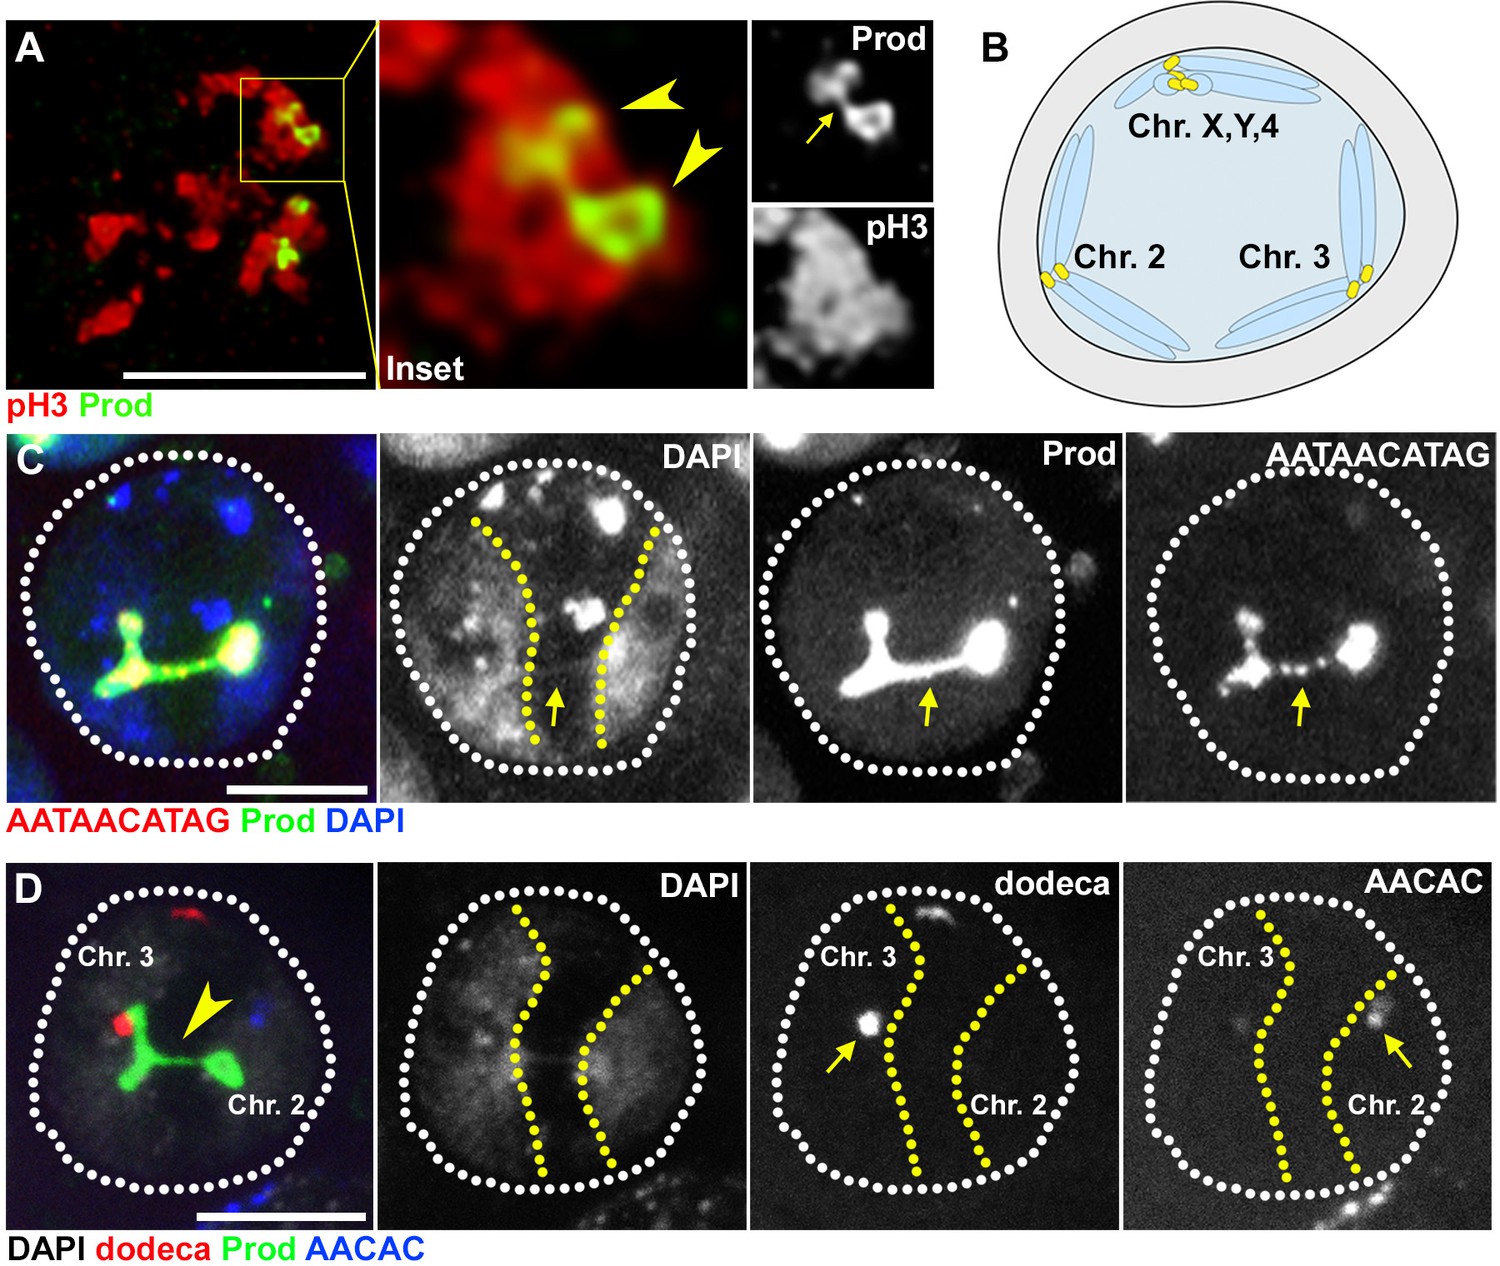
Prod bundles heterologous chromosomes through the {AATAACATAG}n satellite DNA.
(A) Deconvolution microscopy of Drosophila larval neuroblasts in early prophase expressing GFP-Prod (green) under the control of wor-gal4 and stained with pH3 (Ser10) (red). Arrowheads in the inset indicate two of the four Prod loci while the arrow indicates Prod threads connecting the two loci. (B) Schematic depicting how homologous chromosomes separate into distinct ‘territories’ in spermatocytes in preparation of meiotic reductional division. One territory contains the X, Y, and 4th chromosomes, a second territory contains the 2nd chromosomes, and a third territory contains the 3rd chromosomes. (C) FISH against the {AATAACATAG}n satellite (red) in spermatocytes expressing GFP-Prod (green) under the control of bam-gal4 and stained with DAPI (blue). Yellow line demarcates chromosome 2 and chromosome 3 territories. Arrow indicates chromatin thread linking the two territories that is positive for DAPI, Prod, and the {AATAACATAG}n satellite DNA. (D) FISH against the dodeca satellite (red) and the {AACAC}n satellite (blue) in spermatocytes GFP-Prod (green) under the control of bam-gal4 and stained with DAPI (white). Yellow line demarcates chromosome 2 and chromosome 3 territories. Arrowhead indicates chromatin thread linking the two territories that is positive for DAPI and Prod. Arrows indicate location of {AACAC}n satellite DNA that is specific to chromosome 2 and dodeca satellite DNA that is specific to chromosome 3. All scale bars are 5 μm.
Figure 3—figure supplement 1

Prod expression is not observed in Drosophila spermatocytes.
The apical tip of a Drosophila testis is shown that was stained with D1 (red), Prod (green), and Vasa (blue). Asterisk indicates the apical tip. The yellow line separates spermatogonia (upper) from spermatocytes (lower). Scale bar: 25 μm.
Figure 4 with 3 supplements

Dynamic association between D1 and Prod mediates the formation of chromocenters.
(A) Drosophila lymph cells expressing D1-GFP (green) and HP1-RFP (blue) stained with Prod (red). Arrows indicate juxtaposed Prod and D1 foci. Yellow line demarcates the heterochromatic domain based on HP1 localization. Scale bar: 5 μm. (B, C) Particle tracking analysis of single Prod (B) or D1 (C) foci in the XY plane. (D, E) Box-and-whisker plot of the diffusion co-efficients (D) and the slope of momentum scaling spectrum (E) of D1 (n = 25) and Prod (n = 29). (F) Time-lapse imaging of spermatogonia expressing nos-gal4 driven UAS-mCherry-Prod (red) and D1-GFP (green). Arrows indicate Prod and D1 foci coming together in a ‘kiss-and-run’ manner. Time is indicated in mm:ss. (G) Quantification of the distance between the D1 and Prod foci indicated in panel F over time. Arrows indicate the time points shown in panel F. (H, I) Heterozygous control (H) and prodk08810/U mutant (I) larval imaginal disc cells stained with Phalloidin (red), D1 (green), and Lamin (blue). (J) Box-and-whisker plot of the number of D1 foci per larval imaginal disc cell (control n = 72, prodk08810/U n = 65). (K, L) Heterozygous control (K) and D1LL03310 mutant (L) larval lymph gland cells stained with Prod (red), Lamin (green), and Phalloidin (blue). (M) Box-and-whisker plot of the number of Prod foci per larval lymph gland cell (control n = 63, D1LL03310 n = 66). All P values are from student’s t-test. All middle bars: median. All crosshairs: mean. All scale bars: 5 μm.
-
Figure 4—source data 1
Numerical data of particle tracking for Prod foci (corresponding to Figure 4B).
- https://doi.org/10.7554/eLife.43938.016
-
Figure 4—source data 2
Numerical data of particle tracking for D1 foci (corresponding to Figure 4C).
- https://doi.org/10.7554/eLife.43938.017
-
Figure 4—source data 3
Diffusion co-efficients of D1 and Prod (corresponding to Figure 4D).
- https://doi.org/10.7554/eLife.43938.018
-
Figure 4—source data 4
Slope of momentum scaling spectrum of D1 and Prod (corresponding to Figure 4E).
- https://doi.org/10.7554/eLife.43938.019
-
Figure 4—source data 5
Measurements of D1-Prod distance (corresponding to Figure 4G).
- https://doi.org/10.7554/eLife.43938.020
-
Figure 4—source data 6
Number of D1 foci/cell in control vs prod mutant imaginal discs (corresponding to Figure 4J).
- https://doi.org/10.7554/eLife.43938.021
-
Figure 4—source data 7
Number of Prod foci/cell in control vs D1 mutant lymph glands (corresponding to Figure 4M).
- https://doi.org/10.7554/eLife.43938.022
Figure 4—figure supplement 1
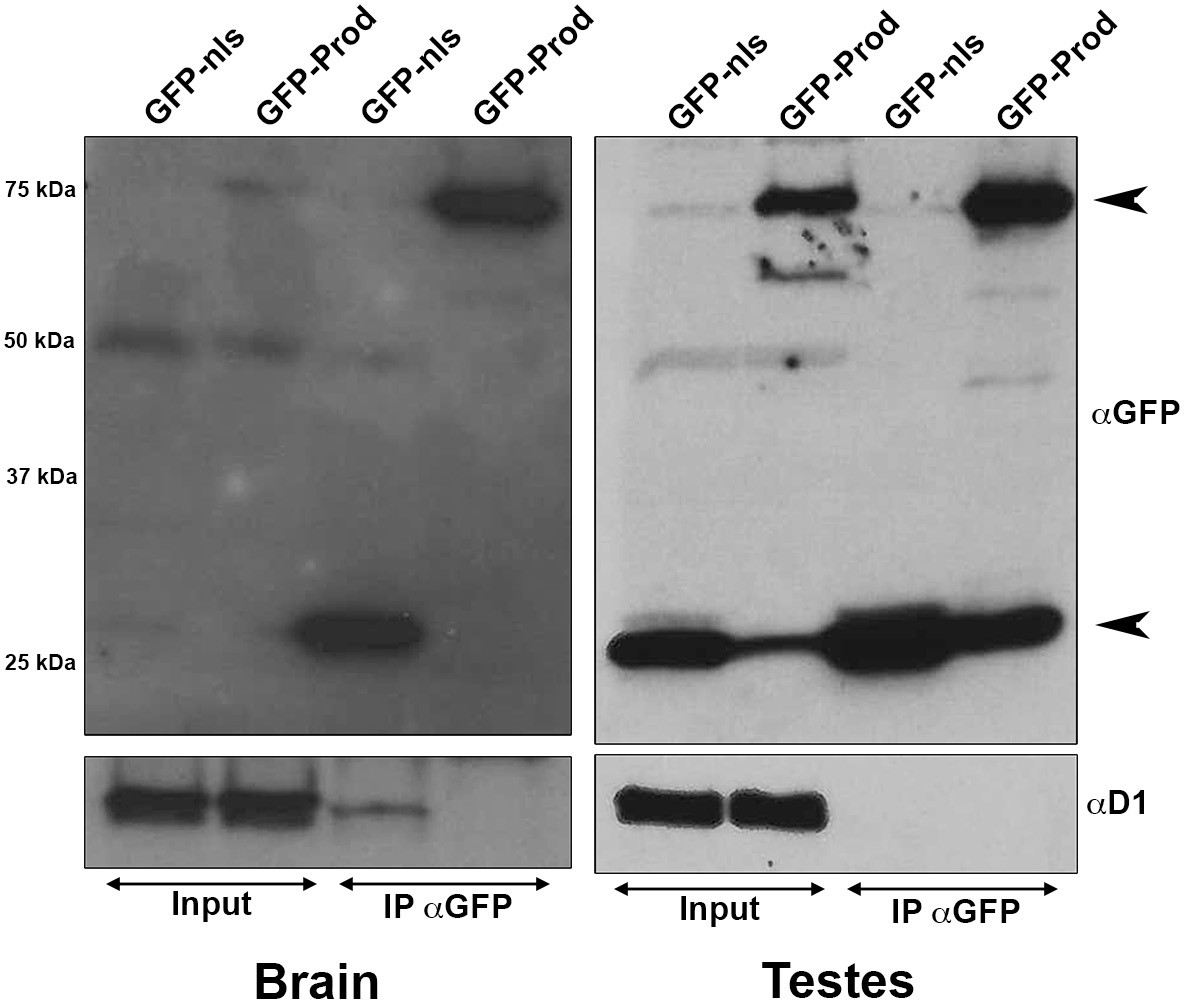
Co-immunoprecipitation experiments from multiple tissue lysates did not detect an interaction between Prod and D1.
(Left) Immunoprecipitation of GFP using GFP-Trap magnetic beads from larval brains expressing UAS-GFP-nls or UAS-GFP-Prod under the control of wor-gal4. (Right) Immunoprecipitation of GFP using GFP-Trap magnetic beads from Upd testis tumors expressing either UAS-GFP or UAS-GFP-Prod under the control of nos-gal4. Immunoprecipitated proteins were blotted using rabbit anti-GFP and guinea pig anti-D1. Expected sizes: GFP: 27 kDa, GFP-Prod: 75 kDa.
Figure 4—figure supplement 2

Mutually dependent clustering of D1 and Prod in multiple cell types.
(A) Drosophila spermatogonia expressing D1-GFP (green) and stained for Prod (red) and Vasa (blue). Arrows indicate D1 and Prod foci in close proximity to each other. (B, C) Larval imaginal disc cells (B) and neuroblasts (C) expressing D1-GFP (green) and stained for Prod (red) and Phalloidin (blue). Arrows indicate D1 and Prod foci in close proximity to each other. (D, E) Heterozygous control (D) and prodk08810/U mutant (E) larval neuroblasts stained with Phalloidin (red), D1 (green), and Lamin (blue). (F) Box-and-whisker plot of the number of D1 foci per neuroblast (control n = 32, prodk08810/U n = 32). (G, H) Control (nos-gal4/+; UAS-dcr-2/+) (G) and prod-depleted (nos-gal4/UAS-prodRNAi; UAS-dcr-2/+) (H) spermatogonia stained with Lamin (red), D1 (green), and Vasa (blue). (I) Box-and-whisker plot of the number of D1 foci per spermatogonial cell (control n = 30, nos-gal4 >UAS prodRNAi n = 30). (J, K) Heterozygous control (J) and D1LL03310 mutant (K) larval neuroblasts stained with Prod (red), Lamin (green) and Phalloidin (blue). (L) Box-and-whisker plot of the number of Prod foci per neuroblast (control n = 45, D1LL03310 n = 40). (M, N) Heterozygous control (M) and D1LL03310 mutant (N) spermatogonia stained with Prod (red), Lamin (green), and Vasa (blue). (O) Box-and-whisker plot of the number of Prod foci per spermatogonial cell (control n = 75, D1LL03310 n = 75). All P values are from student’s t-test. All crosshairs: mean. All scale bars: 5 μm.
-
Figure 4—figure supplement 2—source data 1
Number of D1 foci/cell in control vs prod mutant neuroblasts (corresponding to Figure 4—figure supplement 2F).
- https://doi.org/10.7554/eLife.43938.025
-
Figure 4—figure supplement 2—source data 2
Number of D1 foci/cell in control vs prod RNAi spermatogonia (corresponding to Figure 4—figure supplement 2I).
- https://doi.org/10.7554/eLife.43938.026
-
Figure 4—figure supplement 2—source data 3
Number of Prod foci/cell in control vs D1 mutant neuroblasts (corresponding to Figure 4—figure supplement 2L).
- https://doi.org/10.7554/eLife.43938.027
-
Figure 4—figure supplement 2—source data 4
Number of Prod foci/cell in control vs D1 mutant spermatogonia (corresponding Figure 4—figure supplement 2O).
- https://doi.org/10.7554/eLife.43938.028
Figure 4—figure supplement 3
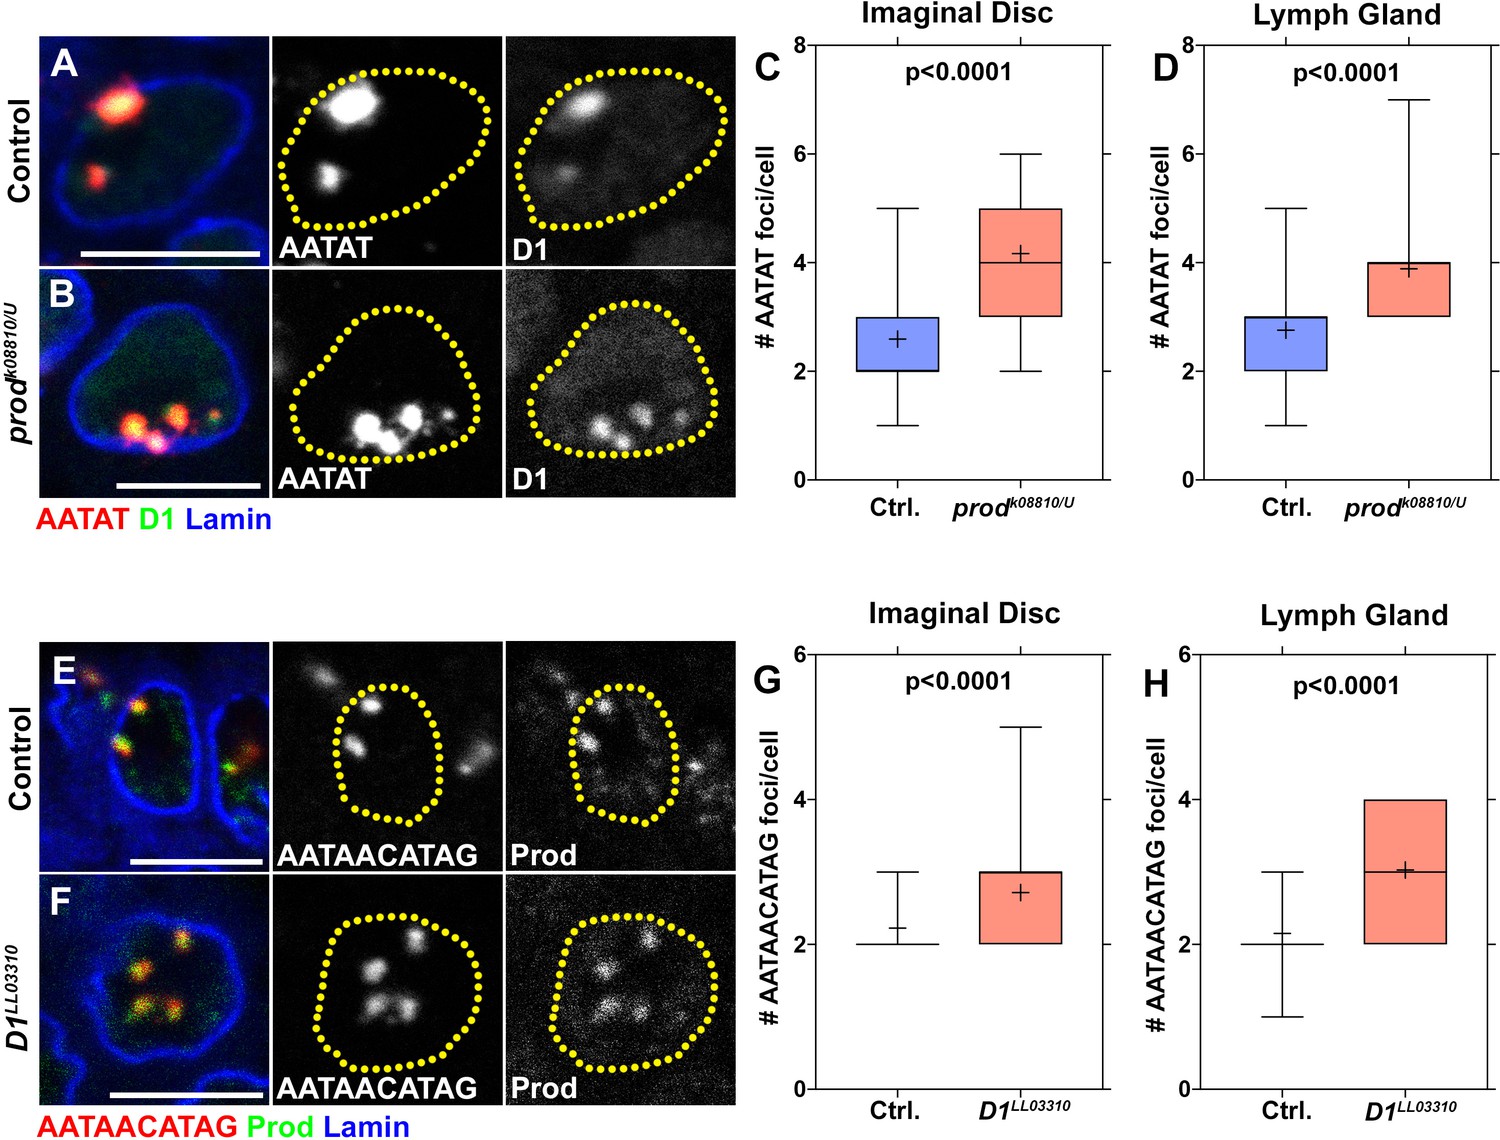
Mutually dependent clustering of the {AATAT}n and {AATAACATAG}n in multiple cell types.
(A, B) FISH was performed against the {AATAT}n satellite DNA (red) in heterozygous control (A) and prodk08810/U mutant (B) larval imaginal discs stained with D1 (green), and Lamin (blue). (C, D) Box-and-whisker plots of the number of {AATAT}n foci per cell in imaginal discs (C, control n = 42, prodk08810/U n = 36) and lymph glands (D, control n = 41, prodk08810/U n = 36). (E, F) FISH was performed against the {AATAACATAG}n satellite DNA (red) in heterozygous control (E) and D1LL03310 mutant (F) larval lymph glands stained with Prod (green), and Lamin (blue). (G, H) Box-and-whisker plots of the number of {AATAACATAG}n foci per cell in imaginal discs (G, control n = 53, D1LL03310 n = 46) and lymph glands (H, control n = 46, D1LL03310 n = 37). All P values are from student’s t-test. All crosshairs: mean. All scale bars: 5 μm.
-
Figure 4—figure supplement 3—source data 1
Number of AATAACATAG foci/cell in control vs D1 mutant imaginal discs (corresponding to Figure 4—figure supplement 3G).
- https://doi.org/10.7554/eLife.43938.030
-
Figure 4—figure supplement 3—source data 2
Number of AATAACATAG foci/cell in control vs D1 mutant lymph gland (corresponding to Figure 4—figure supplement 3H).
- https://doi.org/10.7554/eLife.43938.031
Figure 5

D1 prod double mutation leads to embryonic lethality.
(A) Quantification of GFP-positive and GFP-negative first instar larvae sired by +/CyO, ActGFP; +/TM3, ActGFP and prodk08810/CyO, ActGFP; D1LL03310/TM3, ActGFP adults. GFP-negative larvae from +/CyO, ActGFP; +/TM3, ActGFP parents are wild type while GFP-negative larvae from prodk08810/CyO, ActGFP; D1LL03310/TM3, ActGFP parents are double mutants. P value from student’s t-test is shown. (B, C) Normal (B) and defective (C) embryos from prodk08810/CyO, ActGFP; D1LL03310/TM3, ActGFP are stained with DAPI (red) and Adducin (green). Percentage of normal and defective embryos are indicated from n = 132. Scale bars: 25 μm. (D, E) Close-up view of normal (D) and defective (E) embryos from (B, C). Yellow line indicates cell boundary based on adducin staining. Arrows indicate extra-nuclear DNA and the arrowhead indicates micronuclei. Scale bar: 5 μm. (F) A model depicting the modular architecture of chromocenters in Drosophila melanogaster. Modules of D1-{AATAT}n and Prod-{AATAACATAG}n associate dynamically to bundle the entire chromosome complement into chromocenters.
-
Figure 5—source data 1
Percentages of GFP + vs GFP- larvae in the indicated genetic crosses (corresponding to Figure 5A).
- https://doi.org/10.7554/eLife.43938.033
Additional files
-
Transparent reporting form
- https://doi.org/10.7554/eLife.43938.034
Download links
A two-part list of links to download the article, or parts of the article, in various formats.
Downloads (link to download the article as PDF)
Open citations (links to open the citations from this article in various online reference manager services)
Cite this article (links to download the citations from this article in formats compatible with various reference manager tools)
The modular mechanism of chromocenter formation in Drosophila
eLife 8:e43938.
https://doi.org/10.7554/eLife.43938


