The CUL5 ubiquitin ligase complex mediates resistance to CDK9 and MCL1 inhibitors in lung cancer cells
- University of California, Berkeley, United States
- University of California, San Francisco, United States
- AstraZeneca, United States
Figures
Figure 1
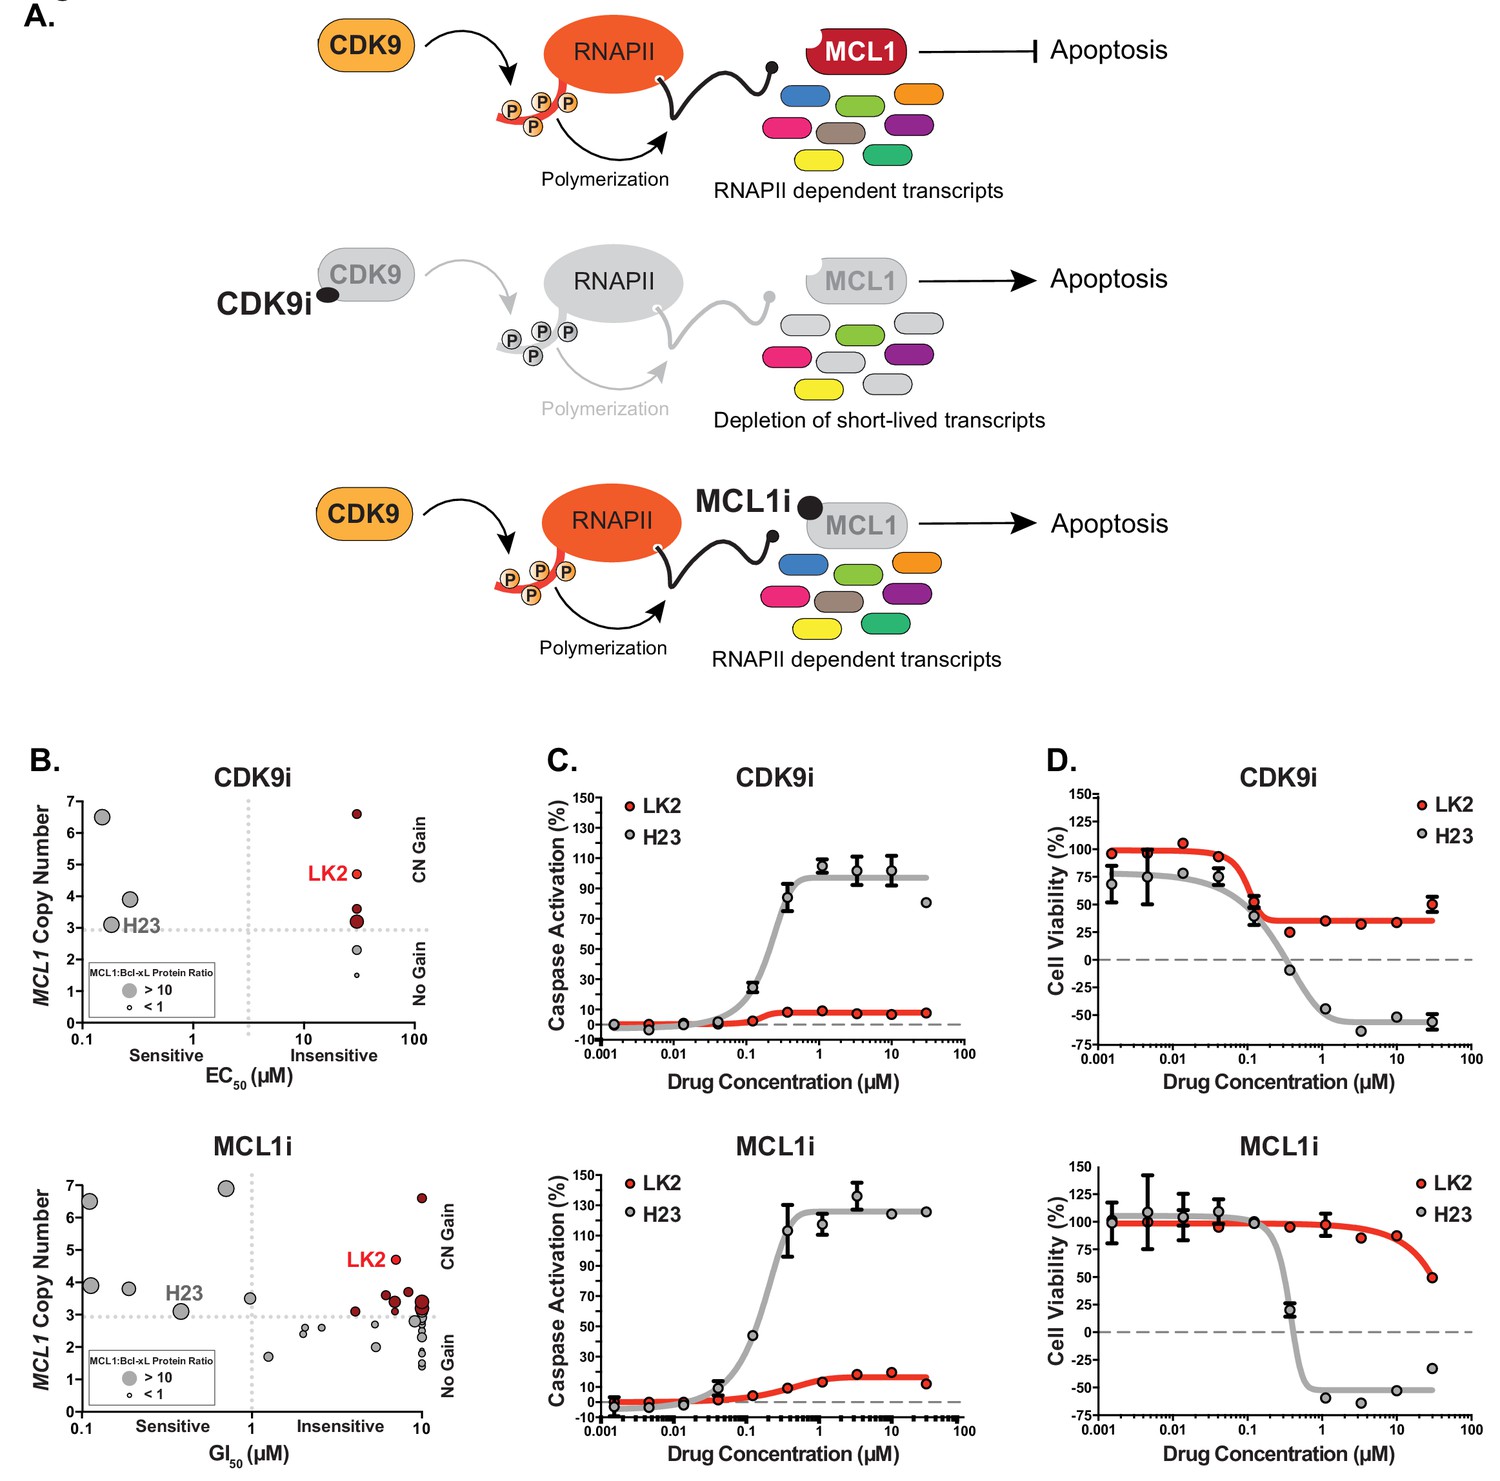
Several MCL1-amplified NSCLC lines are resistant to treatment with CDK9i or MCL1i.
(A) Schematic illustrating the mechanism of action of CDK9 and MCL1 inhibitors. The CDK9 inhibitor (CDK9i) inhibits transcription elongation, thus mRNAs with short half-lives such as MCL1 are highly susceptible to acute CDK9 inhibition. The MCL1 inhibitor (MCL1i) is a BH3-mimetic that binds directly to MCL1. (B) Graphical representation of a panel of cell lines depicting their MCL1 copy number, their ratio of MCL1:Bcl-xL protein and whether they are sensitive to the drug treatment indicated. EC50 values plotted for a 6 hr CDK9i treatment (top graph) derived from Caspase-Glo 3/7 assays. GI50 values plotted for a 24 hr MCL1i treatment (bottom graph) using CellTiter-Glo. Maroon circles indicate cell lines resistant to drug despite being MCL1-amplified. Highlighted in bright red is a resistant cell line (LK2) used for further study in this report and a sensitive cell line (H23) is shown in gray. (C) Dose response curves of LK2 and H23 treated with CDK9i (top) and MCL1i (bottom). Caspase activation was measured at 6 hr post drug treatment at the indicated concentrations by CaspaseGlo 3/7 and normalized to a positive control containing inhibitors of MCL1, BCL2 and Bcl-xL. (D) Cell viability curves of the resistant LK2 and sensitive H23 lines 24 hr following drug treatment with CDK9i (top) or MCL1 (bottom) at increasing concentrations as indicated. Viability was measured using the Cell Titer Glo assay normalized to a DMSO control.
Figure 2 with 1 supplement

Genome-wide CRISPRi screens identify factors that resensitize lung cancer cells to inhibition of CDK9 or MCL1.
(A) Schematic outlining the genome-wide CRISPRi screen in LK2 cells. Cells were exposed to acute drug treatments, fixed and FACS-sorted using the fluorogenic apoptotic detection reagent Cell Event. Enriched and depleted sgRNAs were identified by next-generation sequencing. (B + C) Volcano plots showing sgRNA-targeted genes significantly enriched or depleted in the apoptosing cell population following treatment with CDK9i (B) or MCL1i (C). Average of two independent experiments is graphed. Green highlighted points indicate genes with a known role in apoptosis that had a significant fold change over background. Magenta points highlight members of the CUL5-RNF7-UBE2F ubiquitin complex that were significantly enriched. Beige highlighted points are members of the Eukaryotic Translation Initiation Factor 3 (eIF3) complex. Blue point on CDK9i volcano plot highlights EIF4G2, a gene that may be involved in cap-independent translation of Bcl-xL.
-
Figure 2—source data 1
ScreenProcessing: sgRNA counts.
- https://doi.org/10.7554/eLife.44288.007
-
Figure 2—source data 2
ScreenProcessing: sgRNA phenotype scores.
- https://doi.org/10.7554/eLife.44288.008
-
Figure 2—source data 3
ScreenProcessing: gene phenotype scores.
- https://doi.org/10.7554/eLife.44288.009
-
Figure 2—source data 4
MAGeCK: sgRNA summary for CDK9i.
- https://doi.org/10.7554/eLife.44288.010
-
Figure 2—source data 5
MAGeCK: gene summary for CDK9i.
CDK9i treatment condition compared to ‘background’. Ordered by top enriched genes.
- https://doi.org/10.7554/eLife.44288.011
-
Figure 2—source data 6
MAGeCK: sgRNA summary for MCL1i.
- https://doi.org/10.7554/eLife.44288.012
-
Figure 2—source data 7
MAGeCK: sgRNA summary for MCL1i.
MCL1i treatment condition compared to background. Ordered by top enriched genes.
- https://doi.org/10.7554/eLife.44288.013
Figure 2—figure supplement 1
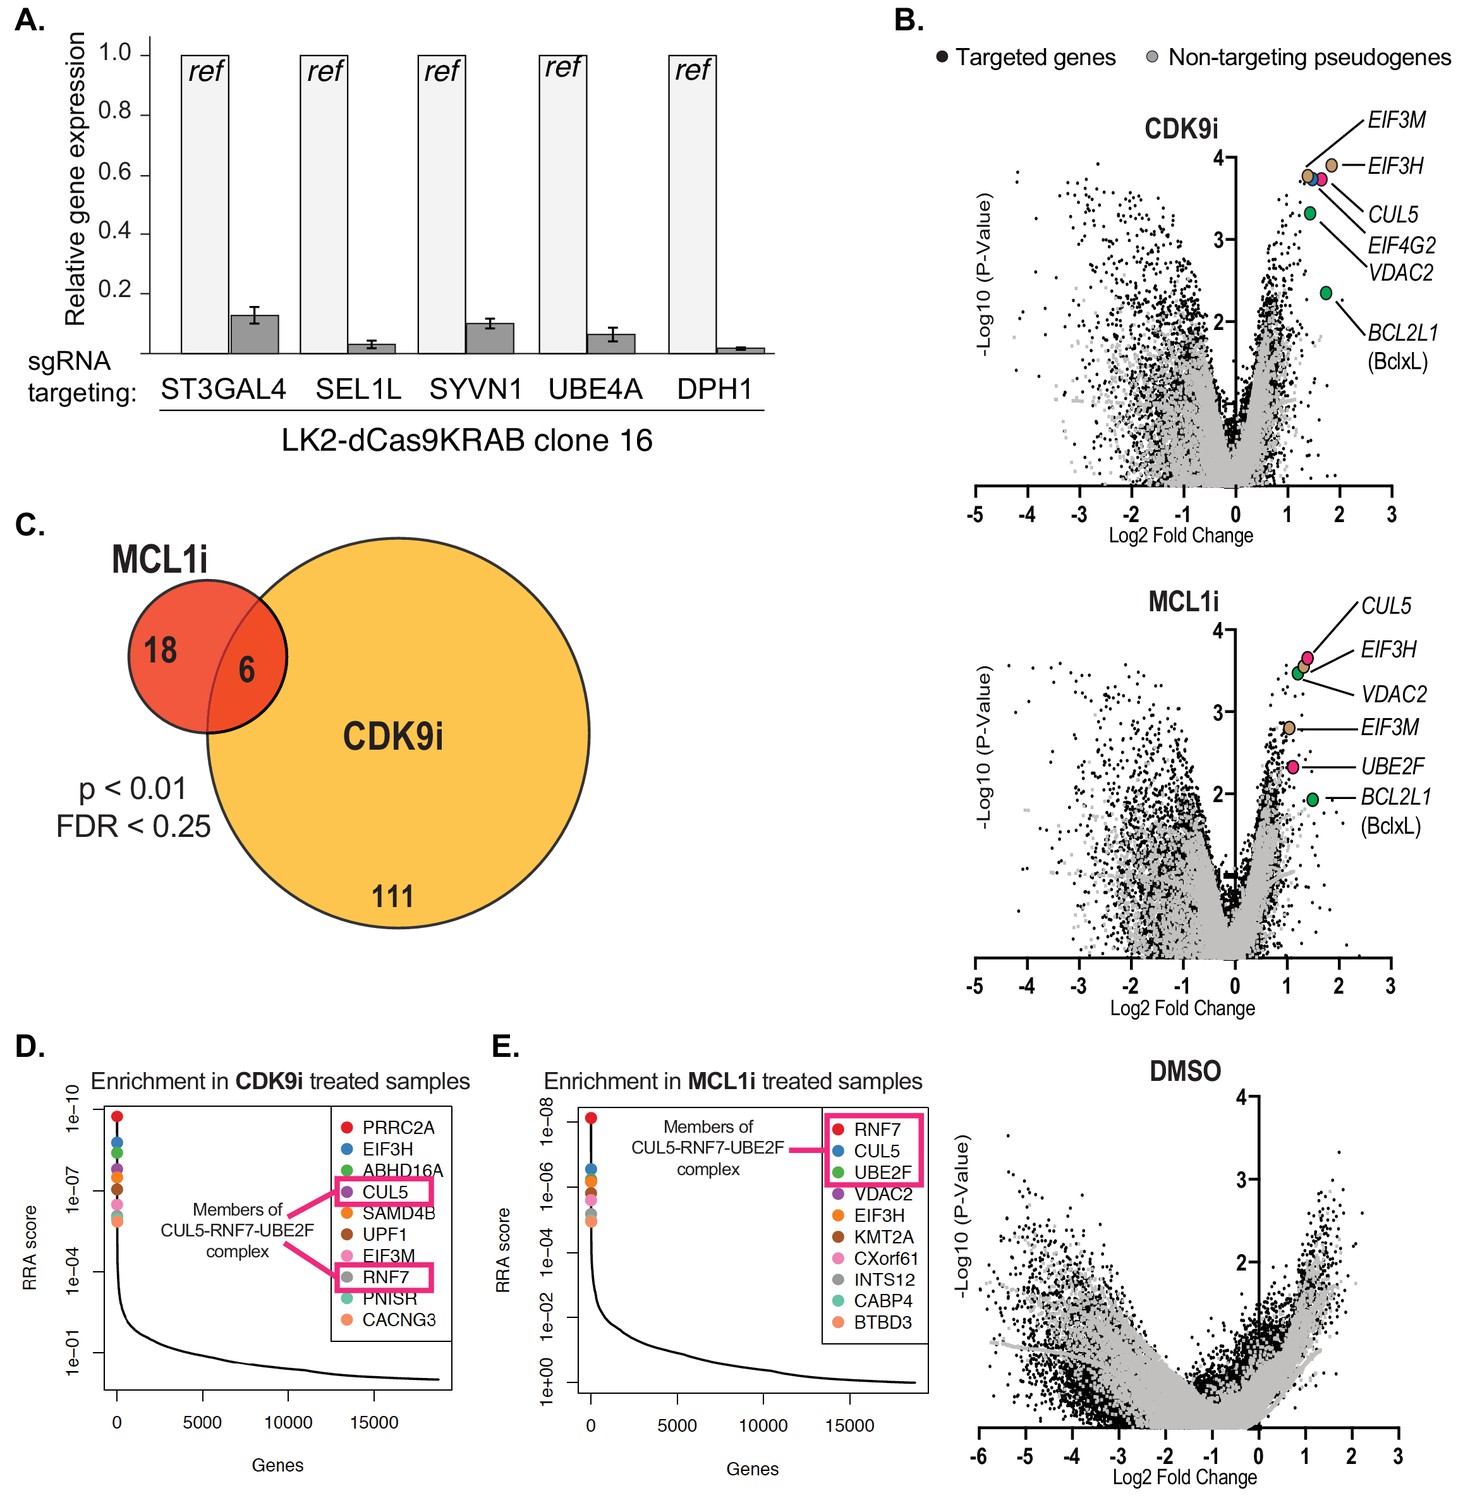
Performing the genome-wide CRISPRi screens and analysis of results.
(A) Bar graph showing knockdown of five genes by qRT-PCR to confirm functionality of the dCas9-KRAB CRISPRi construct in an isolated clone of LK2 cells. (B) Volcano plots (as in Figure 2B) showing significantly enriched and depleted genes when treated with CDK9i (top), MCL1 (middle) and DMSO (bottom). Black dots indicate targeted genes. Gray dots indicate negative control pseudogenes with non-targeting guides. Highlighted points of different colors show genes with significant fold changes with annotated roles in apoptosis (green), factors of the CUL5-RNF7-UBE2F ubiquitin complex (magenta), and members of the eIF3 complex (beige). (C) Venn diagram of overlapping hits between CDK9i and MCL1i screens as determined by MAGeCK analysis using a threshold of p<0.01 and FDR < 0.25. Number of hits listed in circles. (D + E) Relative sgRNA enrichment was also determined by the MAGeCK analysis pipeline. Top 10 targeted genes following CDK9i and MCL1i treatment are shown in (D) and (E), respectively. sgRNAs targeting members of the CUL5-RNF7-UBE2F complex (outlined in magenta box) were once again identified as enriched and were amongst the most significant hits.
Figure 3 with 2 supplements
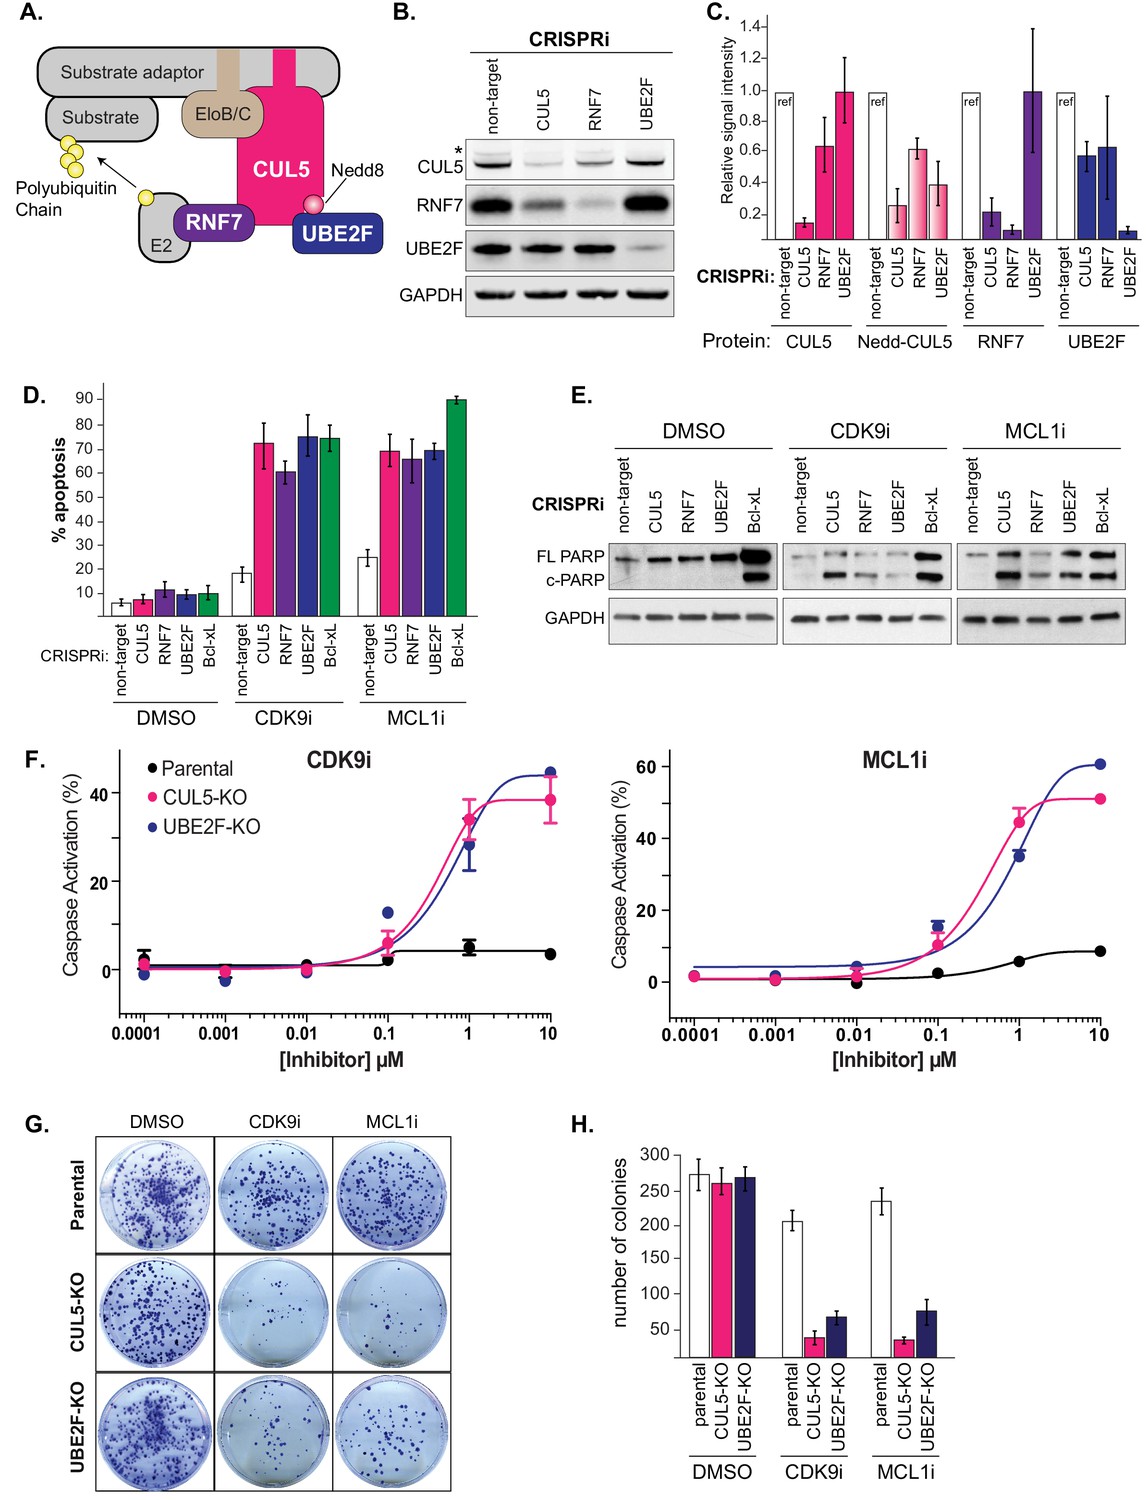
Depletion of the CUL5-RNF7-UBE2F ubiquitin complex induces apoptosis upon treatment with CDK9i or MCL1i.
(A) Schematic depicting the CUL5 ubiquitin ligase scaffold and its interacting partners. (B) Western blots confirming effective knockdown of CUL5, RNF7 and UBE2F by stable lentiviral expression of dCas9-KRAB and corresponding sgRNAs. Asterisk indicates neddylated CUL5. GAPDH serves as loading control. (C) Quantification of western blots as in B. Error bars show standard deviations from three independent biological replicates. (D) Induction of apoptosis when cells depleted of CUL5, RNF7 or UBE2F as in (B) are treated with CDK9i (3 μM for 6 hr), MCL1i (1 μM for 12 hr) or DMSO. Knockdown of Bcl-xL serves as a positive control for induction of apoptosis. Percentage of apoptosis determined by flow cytometry detection of the fluorogenic apoptotic detection reagent, Cell Event. Error bars are standard deviations of three independent biological replicates. (E) Western blotting for cleaved PARP (c-PARP) serves as orthogonal readout for induction of apoptosis following knockdown of target genes and treatment with 3 μM CDK9i for 6 hr or 1 μM MCL1i for 12 hr. Knockdown of Bcl-xL is included as a positive control, however due to extreme toxicity of the combination treatment, cells were harvested 3 hr after treatment with 3 μM CDK9i or 0.5 hr after treatment with 1 μM MCL1i. GAPDH, loading control. (F) Dose response curves of caspase induction showing resensitization of CUL5 knockout (CUL5-KO c3) and UBE2F knockout (UBE2F-KO c1) lines as compared to parental LK2 cells when treated with CDK9i (top) and MCL1i (bottom). Caspase activation was measured at 10 hr post drug treatment at the indicated concentrations by CaspaseGlo 3/7 and normalized to a positive control containing inhibitors of MCL1, BCL2 and Bcl-xL. (G) Colony forming potential is decreased in CUL5-KO and UBE2F-KO as compared to parental LK2 cells after 1 µM treatment with CDK9i or MC1i for 8 hr. Representative images shown of colonies stained 2 weeks after drug treatment with 0.5% crystal violet in 6% glutaraldehyde. Experiments performed in triplicate. (H) Quantification of colonies as in (G), error bars represent standard deviations of three independent experiments.
-
Figure 3—source data 1
Analysis of apoptosis following knockdown of putative CUL5 substrate adaptors challenged with CDK9i or MCL1i.
- https://doi.org/10.7554/eLife.44288.017
Figure 3—figure supplement 1
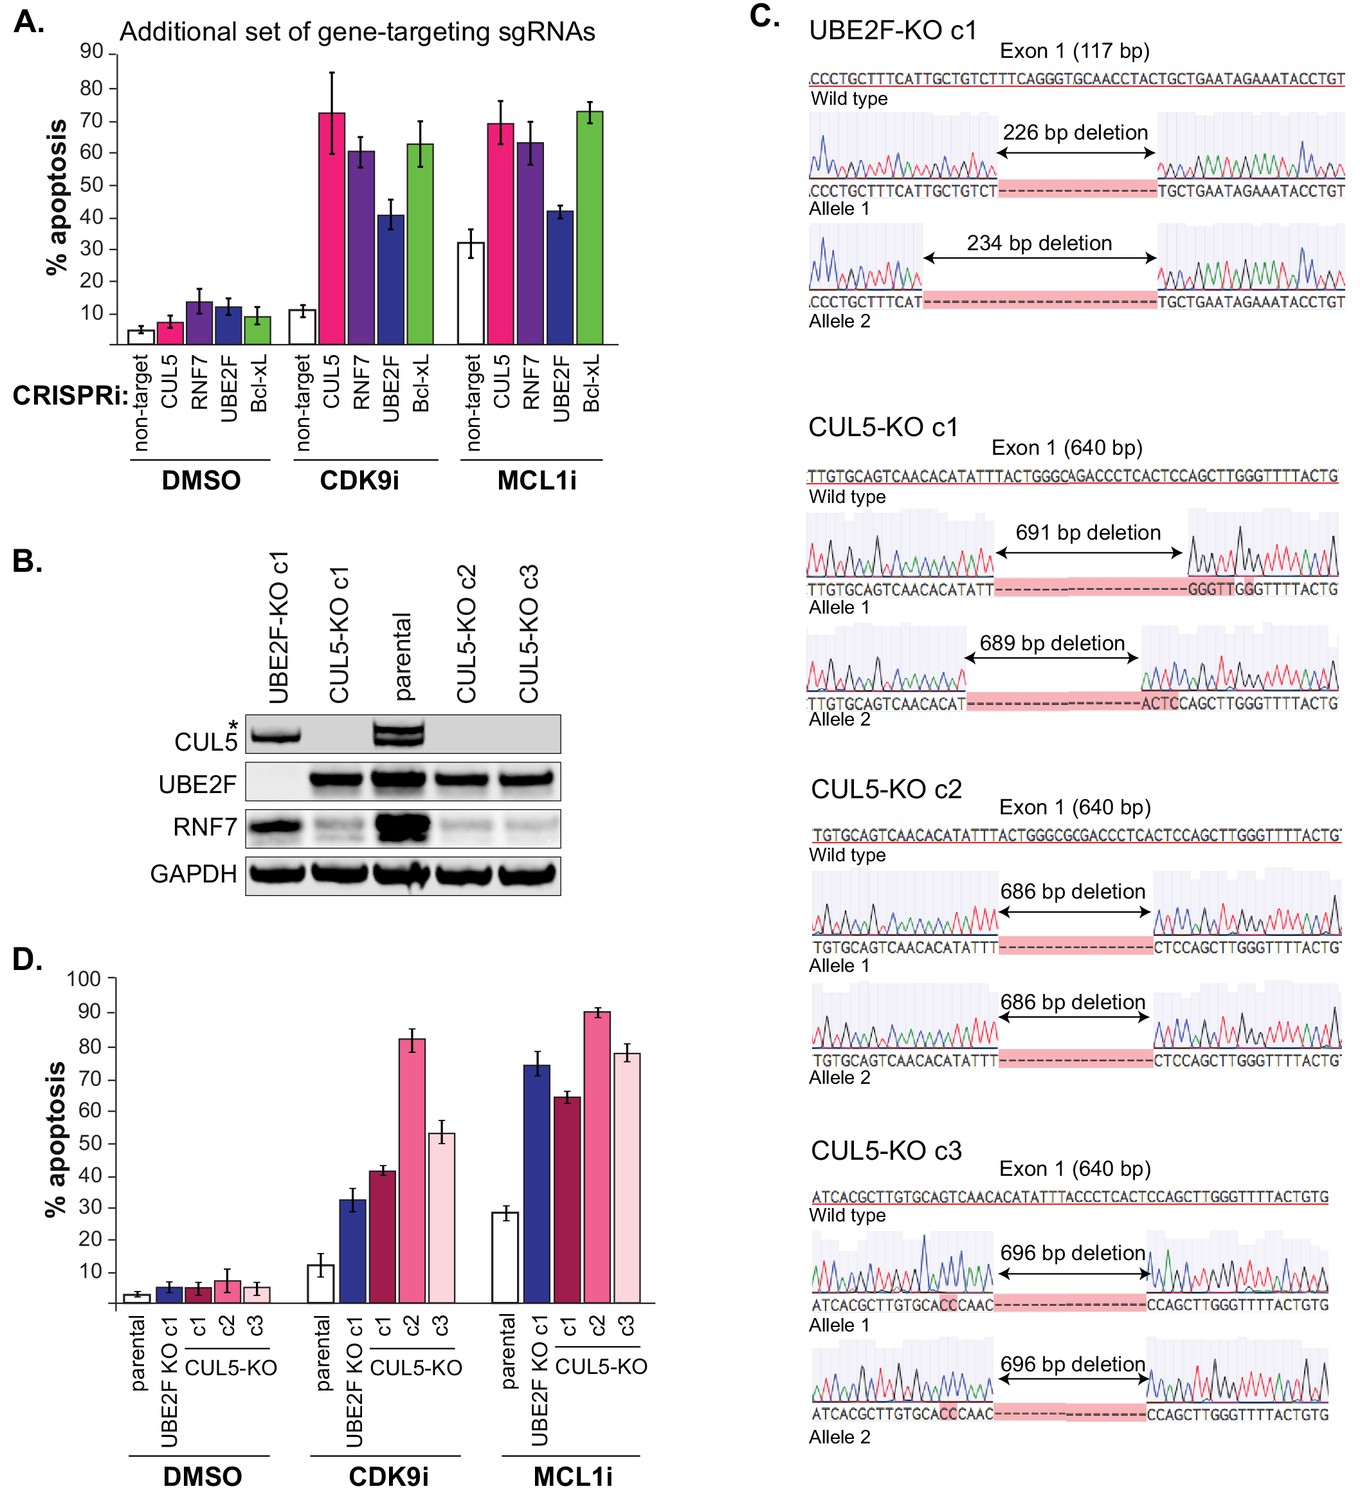
Generation of CUL5 and UBE2F knockouts also resensitize cells to CDK9 and MCL1 inhibition.
(A) Induction of apoptosis when cells are depleted of CUL5, RNF7, UBE2F or Bcl-xL with an additional set of sgRNAs than those used in Figure 3D and are treated with CDK9i (3 μM for 6 hr), MCL1i (1 μM for 12 hr) or DMSO. Percentage of apoptosis determined by flow cytometry for detection of the fluorogenic apoptotic detection reagent Cell Event. Error bars are standard deviations of three biological replicates. (B) Western blotting validating loss of CUL5 and UBE2F protein in the three CUL5-KO clones and one UBE2F-KO clone, respectively. As shown before, protein levels of RNF7 are also reduced when CUL5 is absent. GAPDH, loading control. (C) Sanger sequencing traces of the alleles generated in the CUL5 and UBE2F knockouts. Exon 1 size is indicated, and resulting deletions are shown. (D) CUL5-KO and UBE2F-KO clones were treated with 3 μM CDK9i for 6 hr or 1 μM MCL1i for 12 hr. Percent apoptosis determined using Cell Event detection by flow cytometry. Error bars derived from standard deviations of three biological replicates.
Figure 3—figure supplement 2
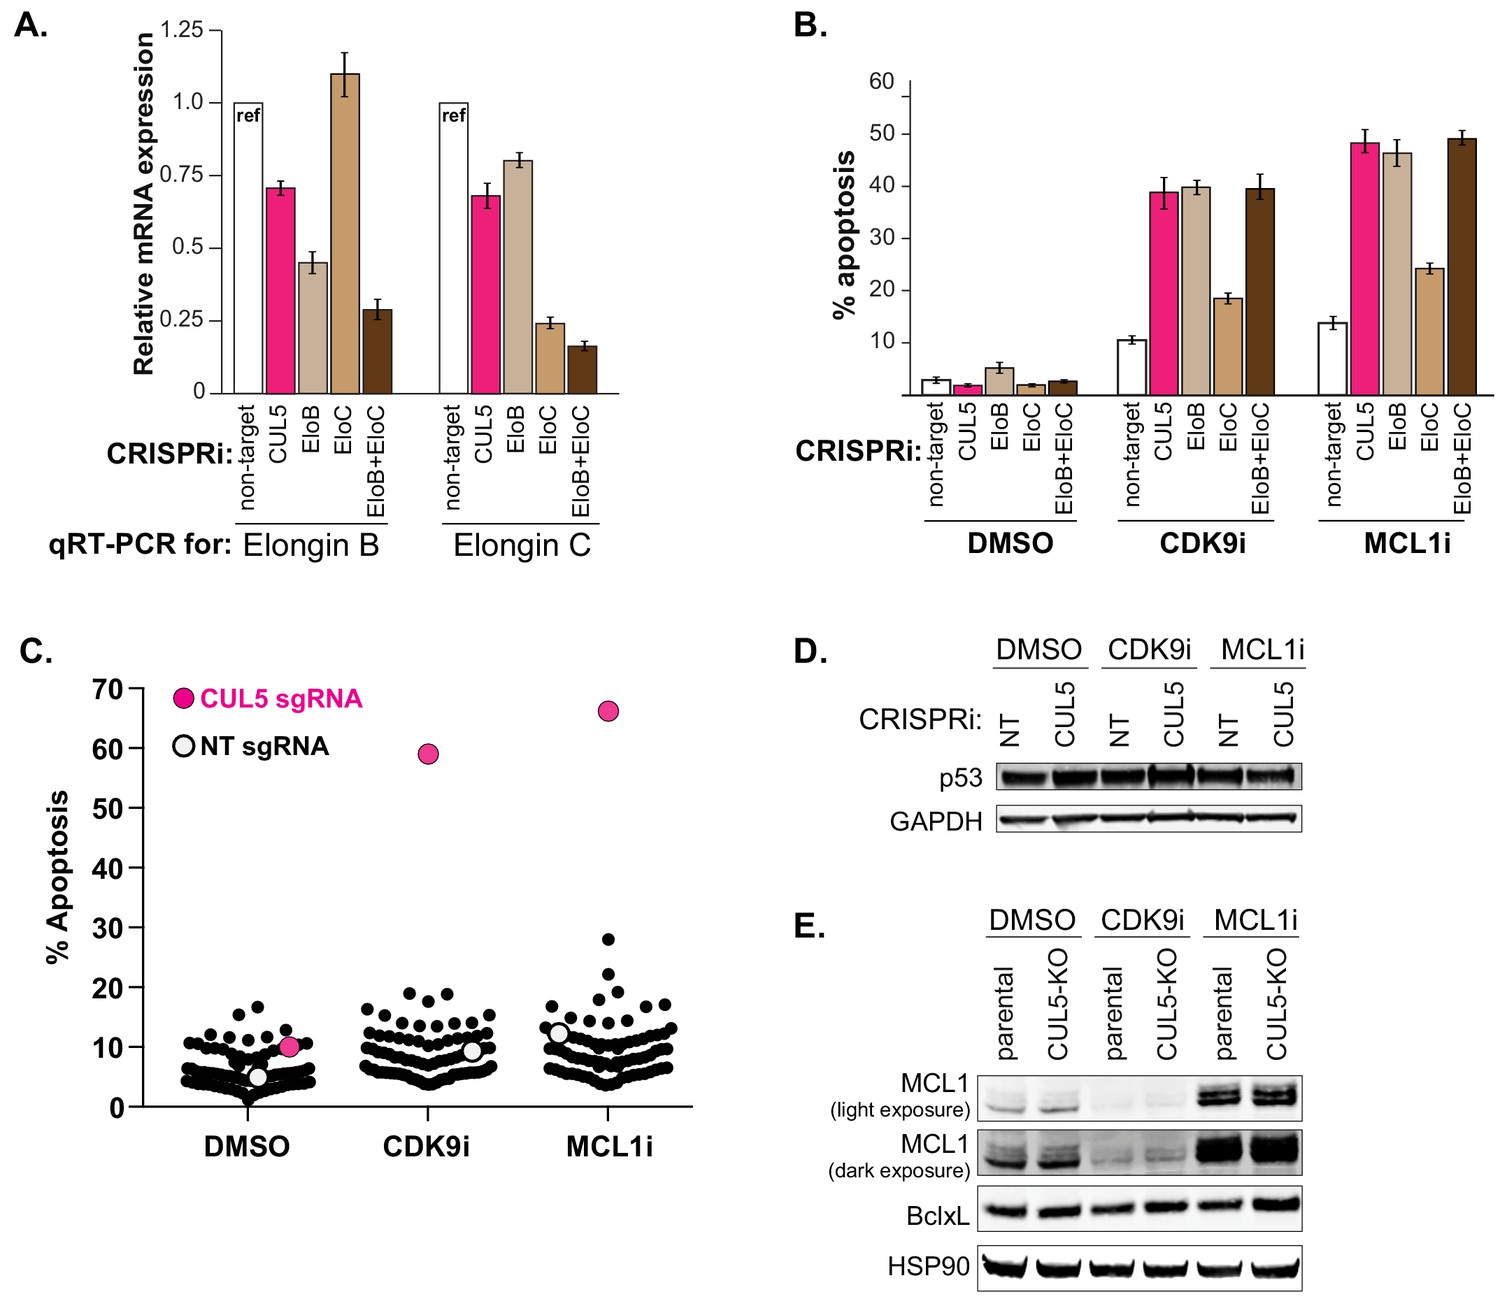
Knockdown of Elongin B but not Elongin C also resensitizes cells to CDK9 and MCL1 inhibition.
(A) qRT-PCR to confirm efficient knockdown of Elongin B and Elongin C. (B) Knockdown of Elongin B (EloB), but not Elongin C (EloC), elicits similar levels of apoptosis as compared to CUL5-knockdown when treated with CDK9i or MCL1i. Apoptosis measured by Cell Event, error bars are standard deviations of three biological replicates. (C) Plotted are percentages of apoptosis as determined by flow cytometry measuring Cell Event fluorescence after 3 μM drug treatment for 6 hr, as indicated on the X-axis. Each dot corresponds to an individual CRISPRi gene knockdown. Non-target (NT) sgRNA serves as the negative control (white) and CUL5 knockdown serves as the positive control (magenta). (D) Western blot for p53 in NT and CUL5-depleted cells treated with DMSO, CDK9i (3 μM for 6 hr) or MCL1i (1 μM for 12 hr). GAPDH serves as loading control. (E) Western blot of MCL1 and Bcl-xL in LK2 and CUL5-KO c1 cells treated with DMSO, CDK9i or MCL1i. HSP90 serves as loading control.
Figure 4 with 1 supplement

The CUL5-RNF7-UBE2F ubiquitin complex regulates levels of BH3-only apoptotic sensitizers Bim and Noxa.
(A) Western blotting of all BH3-only proteins in cell lines with depleted CUL5, RNF7 or UBE2F show increased levels of Bim and Noxa as compared to cells transduced with a non-targeting (NT) sgRNA. GAPDH serves as the loading control. Blots are representative of three independent biological replicates. (B) Western blot of all BH3-only proteins in NT and CUL5-depleted cells treated with DMSO, CDK9i (3 μM for 6 hr) or MCL1i (1 μM for 12 hr). Tubulin serves as loading control. Blots are representative of three independent biological replicates. (C) Quantification of western blots as in (B). Error bars derived from standard deviations of three biological replicates consisting of independently treated and isolated protein samples. Asterisk indicates p value < 0.05 as determined by a paired student T-Test. (D) qRT-PCR showing relative mRNA levels of Noxa, Bim and MCL1 in LK2 parental and CUL5-KO c1 cells treated with DMSO, CDK9i (3 μM for 6 hr) or MCL1i (3 μM for 6 hr). Error bars show standard deviations from three biological replicates on independently treated and isolated RNA samples. (E) Western blot of LK2 and CUL5-KO c1 cells treated for 6 hr with epoxomicin (100 μM), or folimycin (100 μM) or both epoxomicin and folimycin (100 μM each). GAPDH, loading control. Blots are representative of three independent biological replicates.
Figure 4—figure supplement 1
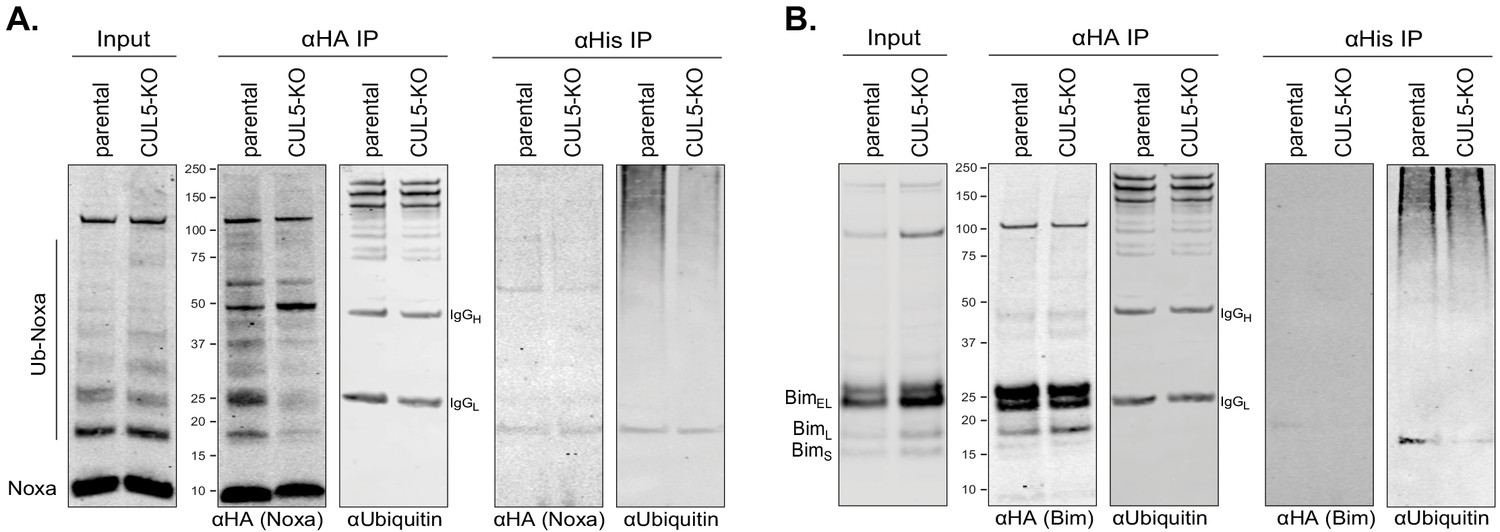
Indirect regulation of Bim and Noxa by the CUL5-RNF7-UBE2F complex.
(A) LK2 and CUL5-KO c1 cells were transiently transfected with HA-Noxa and His-Ubiquitin. 48 hr following transfection cells were incubated with 100 μM epoxomicin for 8 hr and subsequently harvested for immunoprecipitations (IP) with anti-HA or Ni-NTA. Western blot show 1% input and 50% of IP loaded and probed with the indicated antibodies. (B) LK2 and CUL5-KO c1 cells were transiently transfected with HA-Bim and His-Ubiquitin. 48 hr following transfection cells were incubated with 100 μM epoxomicin for 8 hr and subsequently harvested for immunoprecipitations (IP) with anti-HA or Ni-NTA. Western blot show 1% input and 50% of IP loaded and probed with the indicated antibodies.
Figure 5 with 1 supplement
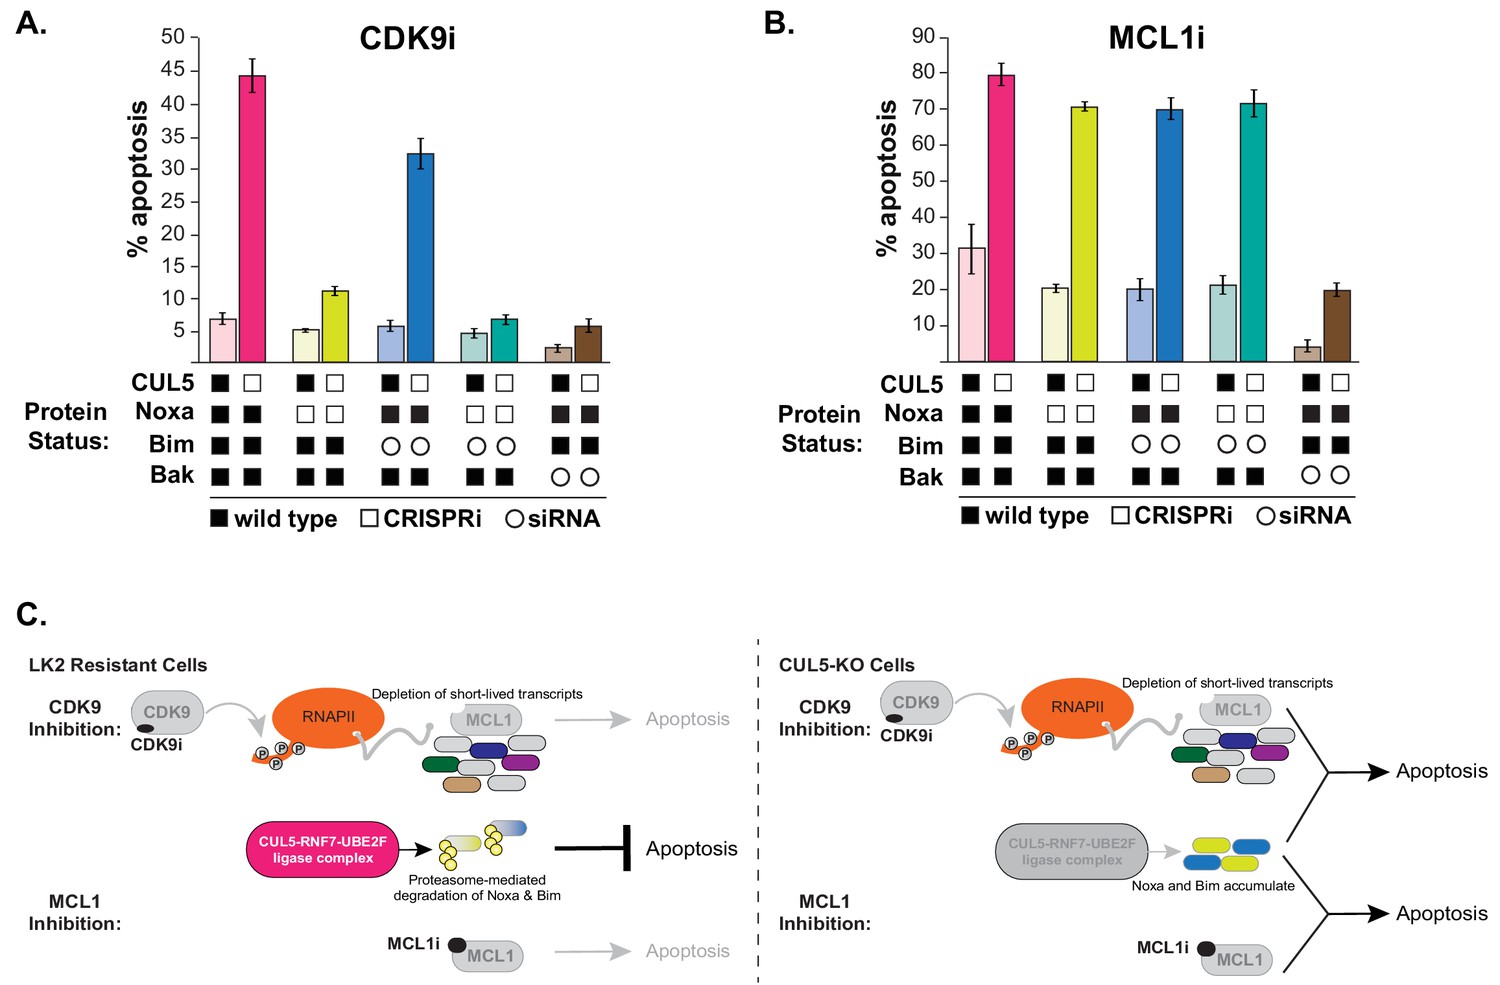
CUL5-depleted cells regain resistance to CDK9i, but not MCL1i, when Noxa is knocked down.
(A) CUL5 and Noxa were knocked down in dCas9-KRAB-expressing LK2 cells by selecting for corresponding sgRNAs. Bim and Bak were knocked down by siRNA. Apoptosis was measured using Cell Event detection by flow cytometry after treatment with 3 μM CDK9i for 6 hr. Error bars are standard deviations of 3 biological drug treatment replicates. (B) Genetic manipulations were performed and apoptosis was measured as in (A) following MCL1i treatment (1 μM for 12 hr). (C) Schematic illustrating potential mechanisms of resensitization of resistant NSCLC lines to inhibition of MCL1.
Figure 5—figure supplement 1
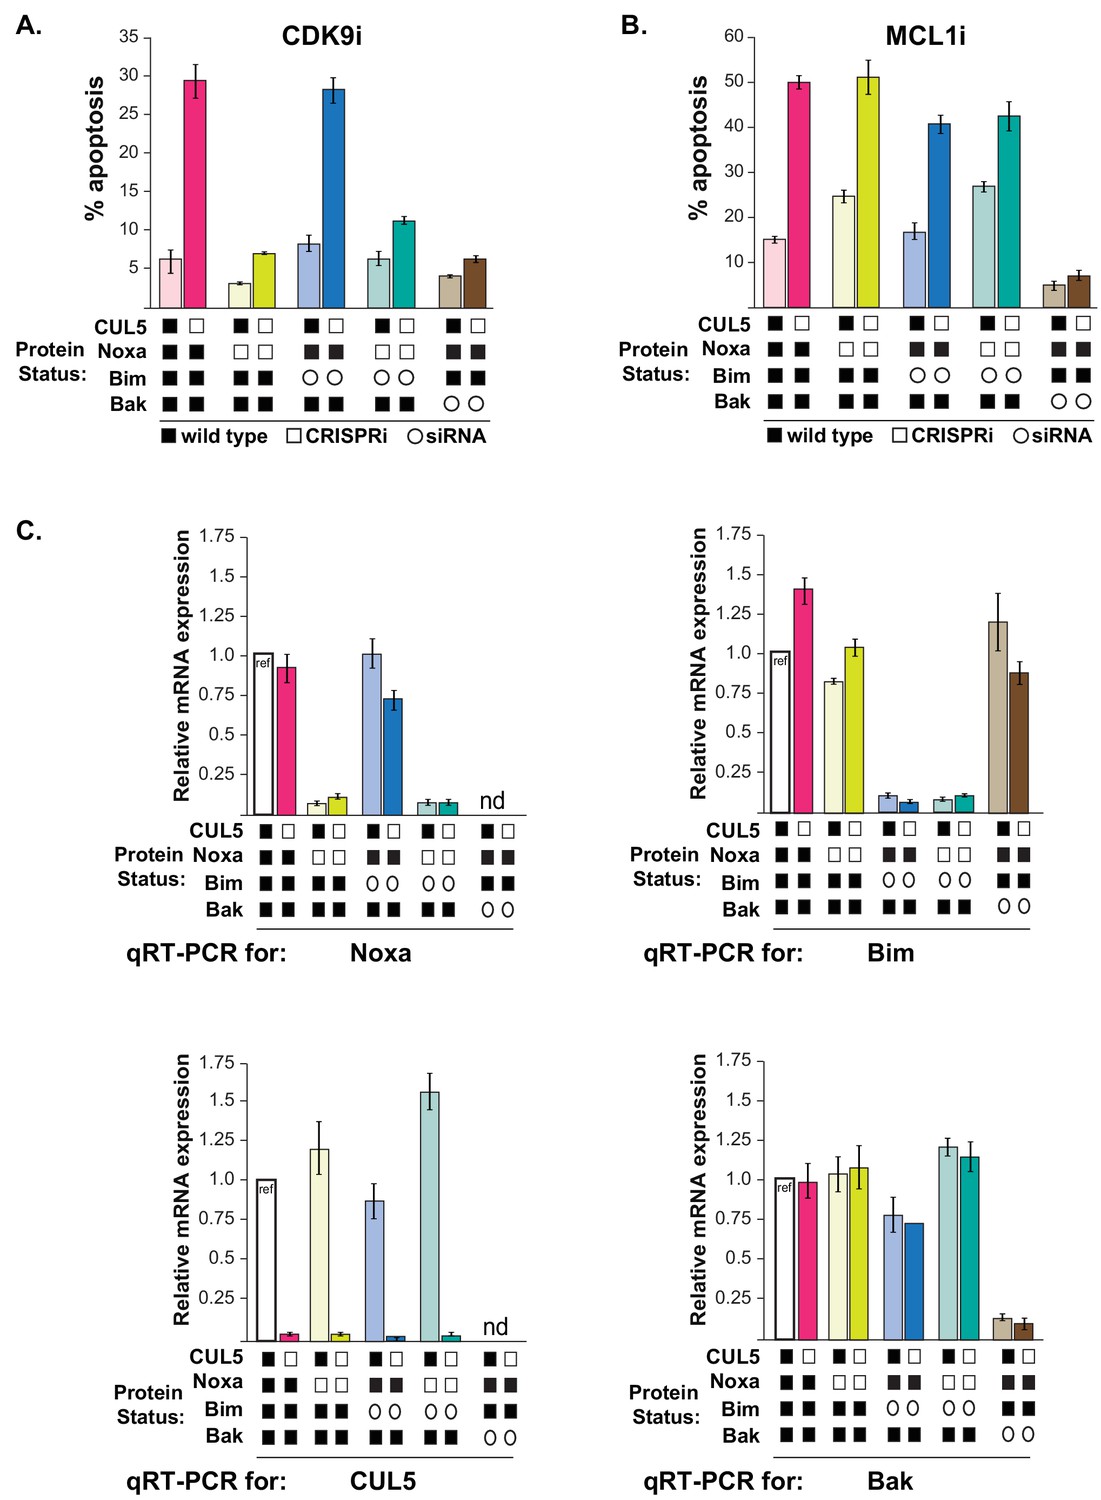
CUL5-kd cells regain resistance to CDK9i when Noxa is depleted.
(A) As in Figure 5, CUL5 and Noxa were knocked down in dCas9-KRAB-expressing LK2 cells by selecting for corresponding sgRNAs. Bim and Bak were knocked down by siRNA. Apoptosis was measured using Cell Event detection by flow cytometry after treatment with 3 μM CDK9i for 6 hr. Bar graphs depict an independent set of transductions and siRNA transfections from Figure 5. Error bars are standard deviations of 3 biological drug treatment replicates. (B) Genetic manipulations were performed and apoptosis was measured as in (A) following MCL1i treatment. (C) Representative data set illustrating knockdown efficiency by qRT-PCR for genetic manipulations shown in (Figure 5A–B). Error bars are standard deviations of technical replicates. qRT-PCR was conducted to validate knockdown for each biological replicate of sgRNA transduction and siRNA transfection. nd, not determined.
Tables
Table 1
A subset of resistant and sensitive NSCLC lines.
For each cell line, the table indicates MCL1 copy number, MCL1:Bcl-xL protein ratio and EC50 concentrations for both CDK9i and MCL1i treatments. Resistant cell lines are in dark pink shaded rows; sensitive cell lines are in light pink shaded rows.
| MCL1 copy number | Mcl1:BclxL protein ratio | MCL1i GI50 (μM) | MCL1i caspase EC50 (μM) | CDK9i caspase EC50 (μM) | |
|---|---|---|---|---|---|
| SKLU1 | 1.5 | 0.41 | 10.000 | 30.000 | 30.000 |
| HCC827 | 2.3 | 4.38 | 10.000 | 30.000 | 30.000 |
| H460 | 3.2 | 16.58 | 10.000 | 30.000 | 30.000 |
| H1734 | 3.6 | 2.63 | 6.150 | 20.056 | 30.000 |
| LK2 | 4.7 | 3.71 | 7.040 | 30.000 | 30.000 |
| H1395 | 6.6 | 3.79 | 10.000 | 15.404 | 30.000 |
| H23 | 3.1 | 39.59 | 0.383 | 0.198 | 0.183 |
| H2110 | 3.9 | 18.29 | 0.113 | 0.226 | 0.270 |
| H1568 | 6.5 | 14.26 | 0.111 | 0.3 | 0.151 |
Additional files
-
Supplementary file 1
Protospacer sequences.
- https://doi.org/10.7554/eLife.44288.022
-
Supplementary file 2
Primer sequences.
- https://doi.org/10.7554/eLife.44288.023
-
Transparent reporting form
- https://doi.org/10.7554/eLife.44288.024
Download links
A two-part list of links to download the article, or parts of the article, in various formats.
Downloads (link to download the article as PDF)
Open citations (links to open the citations from this article in various online reference manager services)
Cite this article (links to download the citations from this article in formats compatible with various reference manager tools)
The CUL5 ubiquitin ligase complex mediates resistance to CDK9 and MCL1 inhibitors in lung cancer cells
eLife 8:e44288.
https://doi.org/10.7554/eLife.44288


