HIF-1α regulates IL-1β and IL-17 in sarcoidosis
- Wayne State University School of Medicine and Detroit Medical Center, United States
- Wayne State University School of Medicine, United States
Figures
Figure 1
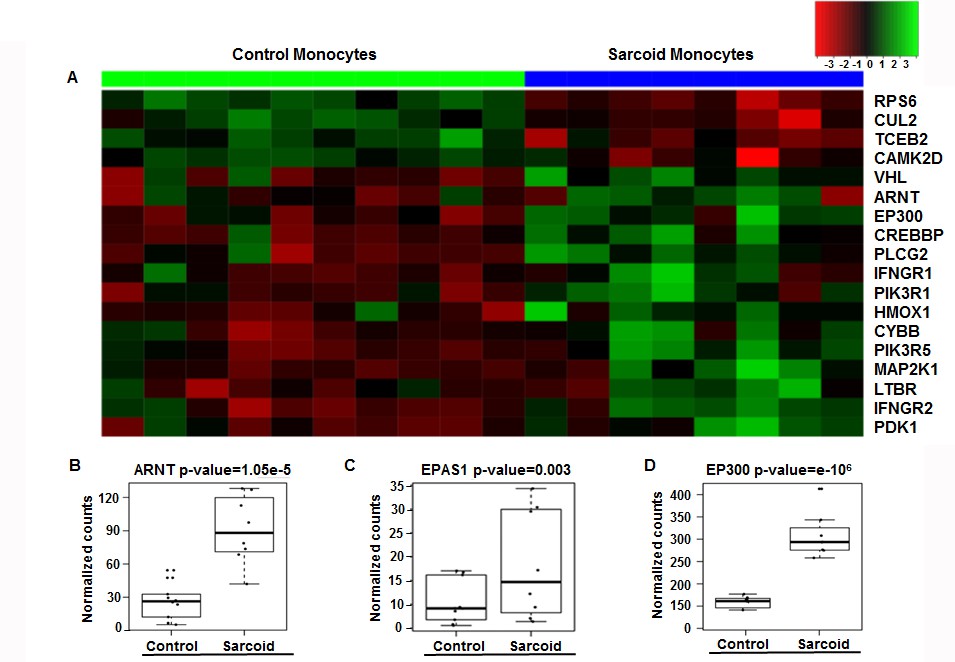
Enrichment of HIF-1α signaling pathways and related genes in sarcoidosis.
Pathway analysis of DE genes between sarcoidosis versus healthy control monocytes was done using the iPathwayGuide tool. (A) Heatmap of genes involved in HIF-1α signaling between sarcoid and healthy control monocytes. Dendrograms according to means identifying genes levels in the heatmap show two distinct clusters. Green shading represents high expression and red shading represents low expression. (B–D) Data presented as box plots of gene counts corrected based on an FDR of 0.05. Boxplots for gene expression in monocytes are shown for ARNT (B), EPAS1 (C), and EP300 (D).
-
Figure 1—source data 1
RNA-seq data of Sarcoid vs Healthy monocytes.
- https://doi.org/10.7554/eLife.44519.004
Figure 2
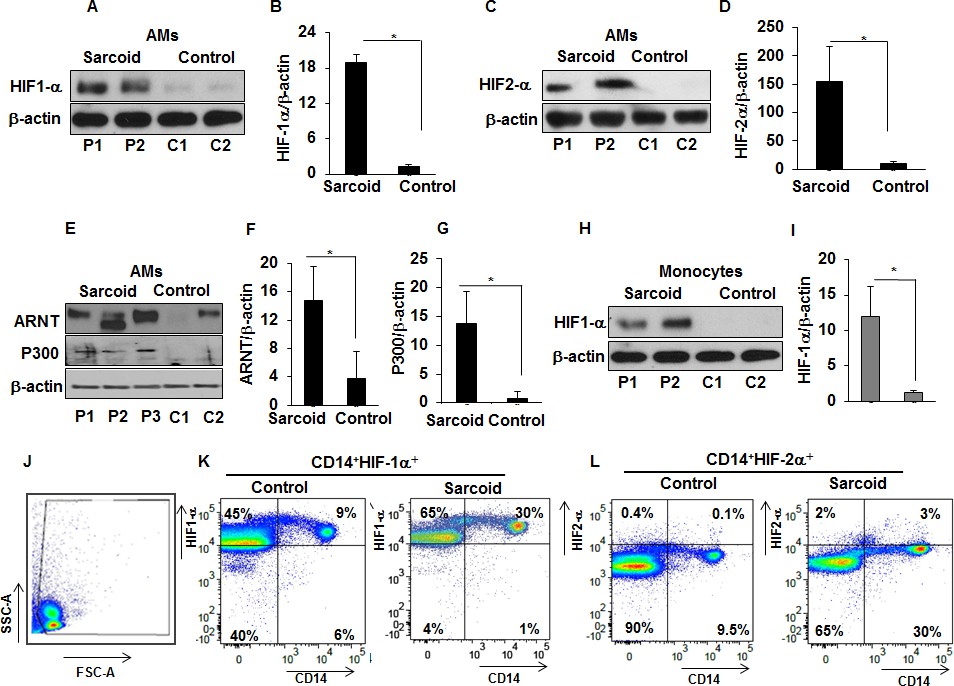
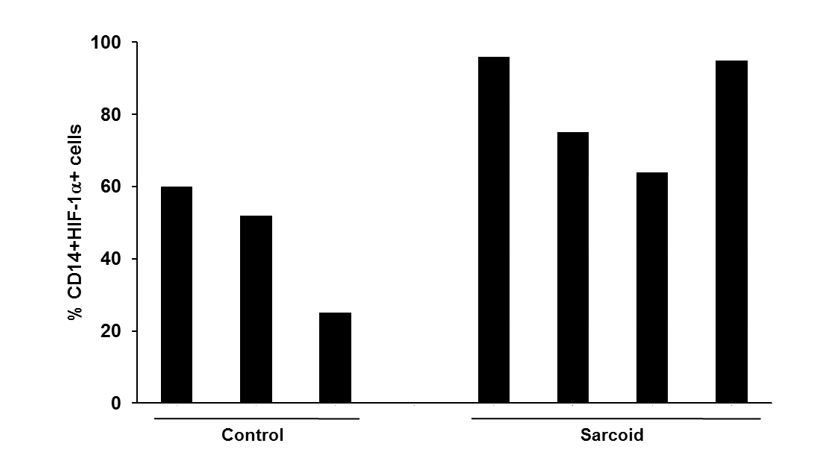
Increased expression of HIF-1α, HIF-2α, ARNT, and p300 in sarcoidosis.
Whole cell extracts of AMs and monocytes were prepared and subjected to SDS-PAGE and western blot analysis using specific antibodies for HIF-1α, HIF-2α, ARNT, and p300. Equal loading was confirmed using antibodies against β-actin. Densitometry analysis is expressed as fold increase of the ratio of specific protein/β-actin. Sarcoid AMs exhibited higher HIF-1α expression (A and B) as compared to healthy controls. Sarcoid AMs expressed higher HIF-2α (C and D), ARNT (E and F) and p300 (E and G) as compared to healthy controls. Sarcoid monocytes exhibited higher HIF-1α expression (H and I) as compared to healthy controls. Representative blots for AMs and monocytes are shown out of a total of 10 patients and seven controls. Flow cytometry of PBMCs double stained for CD14+HIF-1α + and CD14+HIF-2α+ (J and K). PBMCs of healthy controls and sarcoid were stained with CD14-PerCPCy5.5, HIF-1α or CD14-PerCPCy5.5, HIF-2α primary antibodies followed by Alexa 488 secondary antibody and analyzed by flow cytometry using Flow-jo software. Figure 2J shows FSC-A/SSC-A gating. In healthy controls, 5–9% of PBMCs were CD14+HIF-1α+ whereas in sarcoidosis 20% to 35% of PBMCs were CD14+HIF-1α+ (K). HIF-2α expression was negligible in control PBMCs whereas 3% of sarcoid PBMCs were CD14+HIF-2α+ (L). Representative scatter plots from 4 patients and three controls are shown.
Figure 3 with 1 supplement
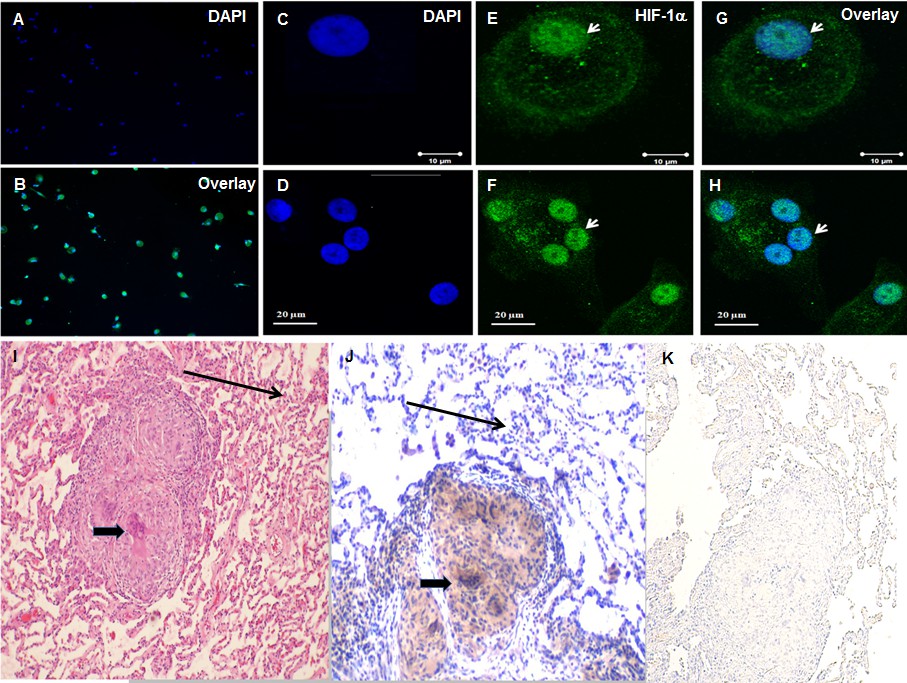
Increased HIF-1α expression in sarcoidosis AMs and granulomatous sarcoidosis lung tissue.
Immunofluorescence staining of sarcoidosis AMs showing presence of HIF-1α in the cytoplasm and nuclei. AMs (1 × 10⁵) were allowed to adhere on chamber slides overnight. The cells were washed with PBST and fixed with 3.7% paraformaldehyde. Cells were permeabilized with 0.1% Triton X-100, blocked (10% FCS), and then incubated with anti-HIF-1α antibody overnight at 4°C. The secondary antibody was Alexa-fluor 488 - conjugated goat anti-rabbit antibody. Images were analyzed by immunofluorescent microscopy (AX10, Zeiss). Images show nuclei staining of AMs (A), overlay image shows nuclear and cytoplasmic co-localization of HIF-1α (Β). Confocal laser scanning microscopy (CLSM-310, Zeiss) images show nuclei stained with DAPI (blue) in a single AM (C) and a multinucleated giant cell (D), nuclear and cytoplasmic accumulation of HIF-1α in green (E and F), overlay image shows nuclear co-localization of HIF-1α (G and H). The images are representative from two patients out of total of 5 patients. The photomicrographs represent in situ immunohistochemistry performed on lung tissues. H and E staining of tissue obtained from transbronchial biopsy (I) 100X, HIF-1α immunostaining (J), negative staining using isotype control antibody (K). The brown color represents an area of precipitate formed by a chromogenic substrate that is transformed by an enzymatic label conjugated to the antibody that has bound to the HIF-1α antigen. Note that the intensity of the staining is most pronounced in the histiocytic cells (i.e., AMs and the multinucleated giant cells, thick arrow), and is not identified in the surrounding alveoli (thin arrow). The immunohistochemistry images are representative from one patient out of total of 5 patients.
Figure 3—figure supplement 1
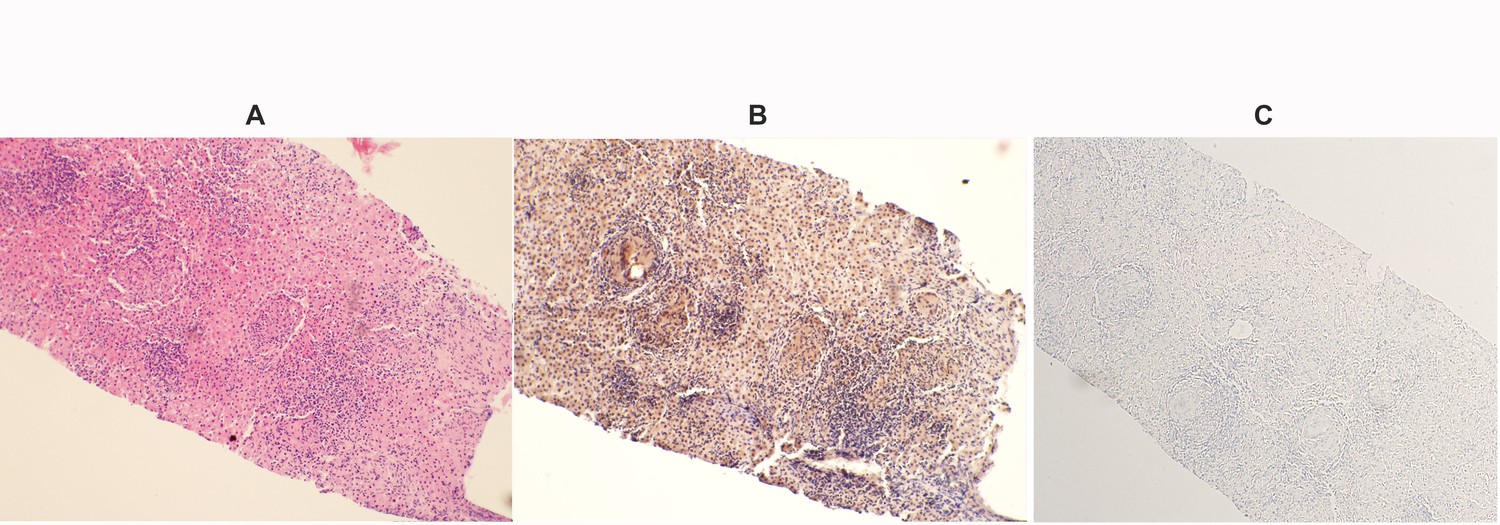
A 28- year-old woman underwent a liver biopsy for evaluation of increased transaminases.
At the age of 21 she developed sarcoidosis involving multiple organs, including lungs, eyes, heart and liver. The increased HIF-1α staining in the hepatocytes may reflect the severity of disease in this patient. (A) Hematoxylin-eosin; original magnification X 200 shows multiple granuloma and increased mononuclear cell infiltrates. No significant fibrosis is seen in the H and E staining. (B) Immunohistochemical analysis using a specific antibody against HIF-1α. Staining intensity of HIF-1α was stronger in the mononuclear cells and granulomatous structures, while hepatocytes showed also HIF-1α staining. (C) Negative staining was performed by using isotype control antibody.
Figure 4
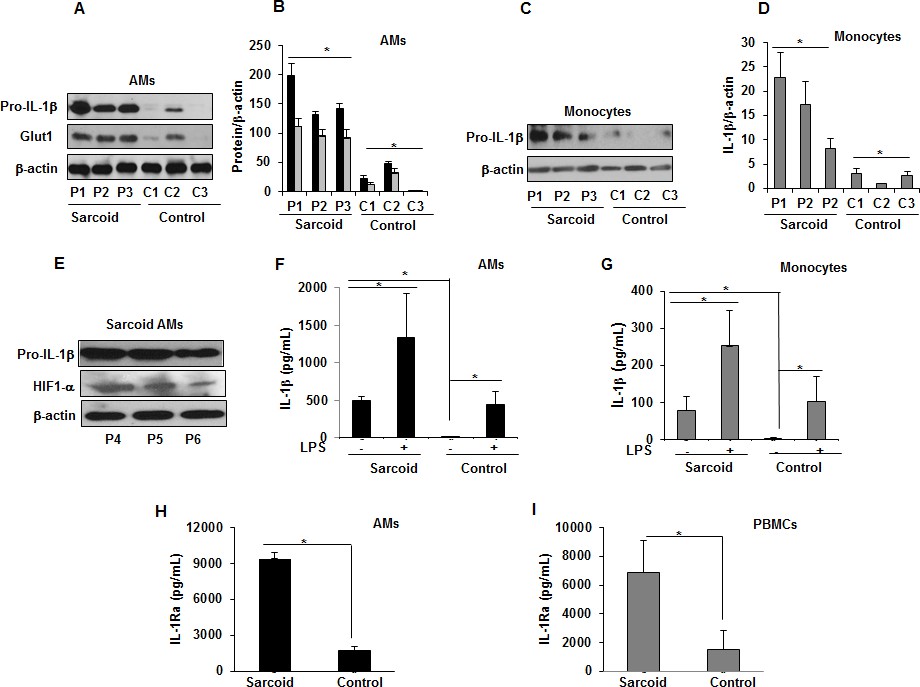
Increased Glut1, pro-IL-1β expression and IL-1β, IL-1Ra in sarcoidosis.
AMs or monocytes from sarcoid subjects and controls were cultured overnight. Whole cell extracts were prepared, and culture supernatants were collected to measure IL-1β. Whole cell extracts were subjected to SDS-PAGE and western blot analysis using specific antibodies for Glut1, pro- IL-1β and HIF-1α. Equal loading was confirmed using β-actin antibody. Densitometry analysis is expressed as fold increase of the ratio of specific protein/β-actin. IL-1β was measured in culture supernatants via ELISA. Sarcoidosis AMs (n = 18) exhibited significantly higher expression of Glut1 and pro- IL-1β as compared to control subjects (n = 10) (A and B). The western blot and densitometric results (black bars for pro- IL-1β and grey bars for Glut1) are representative from three patients out of total of 18 patients and three controls out of total of 10 control subjects. Monocytes from sarcoid subjects also exhibited significantly higher pro-IL-1β as compared to controls (C and D). The western blot and densitometric results are representative from three patients out of total of 10 patients and 3 controls out of 10 control subjects. These data indicate that sarcoid AMs exhibit higher pro-IL-1β at baseline and this highly correlates with HIF-1α expression (E). Sarcoidosis AMs (F) and monocytes (G) produced significantly higher IL-1β cytokine at baseline and after LPS-stimulation as compared to healthy controls. Sarcoidosis AMs (H) and PBMCs (I) produced significantly higher IL-1Ra at baseline as compared to healthy controls. ELISA results represent mean ± SEM from 10 patients and 10 controls (4F and 4G), 10 patients and five controls (4H and 4I). *, p < 0.05 and was considered significant.
-
Figure 4—source data 1
IL-1β and IL-1Ra production in sarcoid AMs,monocytes or PBMCs.
- https://doi.org/10.7554/eLife.44519.010
Figure 5
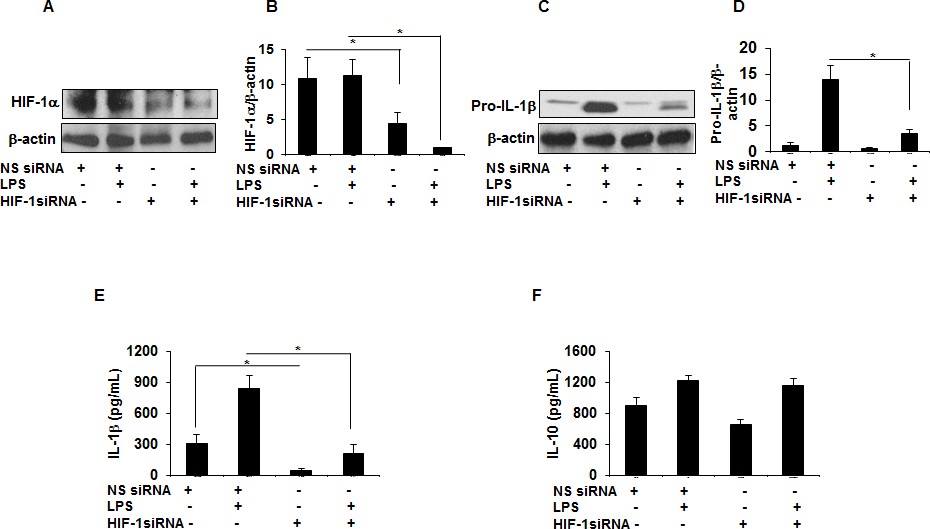
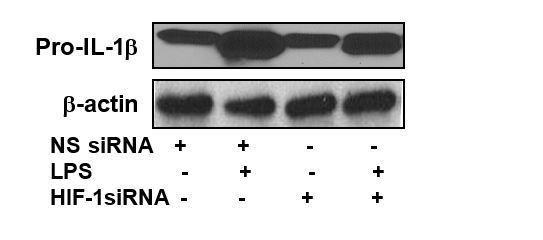
HIF-1α downregulation via siRNA decreases IL-1β production in sarcoid AMs.
AMs from sarcoidosis subjects were transiently transfected with nonsense vector (NS siRNA, 200 pM) or targeted HIF-1α siRNA (200 pM, Thermofisher-Scientific). After 24 hr of transfection, cells were activated with LPS (100 ng/mL) for 3 hr. Whole cell lysates obtained after 3 hr of activation were subjected to immunoblotting to assess the HIF-1α and pro- IL-1β expression. Values were normalized to β-actin and are shown as relative expression to NS siRNA control. Conditioned media were collected after 24 hr and were assessed for different cytokines. HIF-1α siRNA significantly reduced both HIF-1α and pro-IL-1β protein in AMs (A–D). HIF-1α siRNA significantly inhibited IL-1β (E) but had no inhibitory effect on IL-10 (F) in AMs. Western blot data presented is a representative of four independent experiments. ELISA results represent mean ± SEM from four different experiments. *, p < 0.05 and was considered significant.
-
Figure 5—source data 1
Effect of downregulation of HIF-1α via siRNA on IL-1β and IL-10 production in sarcoid AMs.
- https://doi.org/10.7554/eLife.44519.012
Figure 6
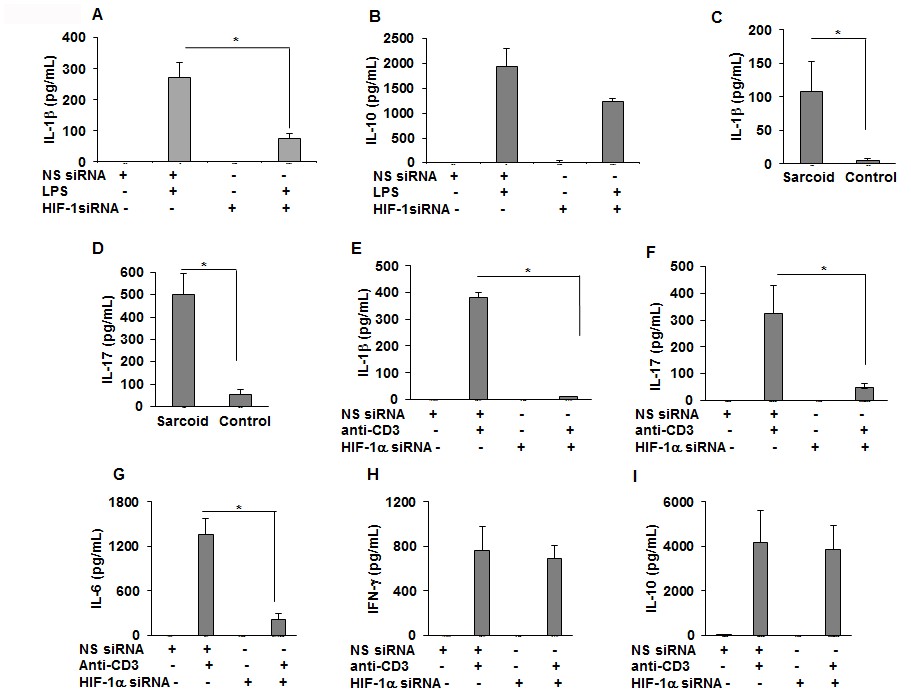
Downregulation of HIF-1α reduces the production of IL-1β, IL-17, and IL-6 in sarcoid PBMCs.
PBMCs were transiently transfected with nonsense vector (NS siRNA, 200 pM) or targeted HIF-1α siRNA (200 pM, Thermofisher-Scientific). After 24 hr of transfection, cells were activated with either LPS (100 ng/mL) or anti-CD3 (1 μg/mL) in the presence of rhIL-2 (10 ng/mL). Conditioned media were collected after 24 hr (stimulated with LPS) or after 72 hr (stimulated with anti-CD3) and were assessed for cytokines via ELISA. HIF-1α siRNA significantly inhibited IL-1β (A) but had no inhibitory effect on IL-10 (B). The conditioned media of anti-CD3 stimulated sarcoidosis PBMCs (n = 11) or healthy control PBMCs (n = 10) show that sarcoidosis PBMCs produced significantly higher IL-1β (C) and IL-17 (D) as compared to healthy control PBMCs. HIF-1α siRNA significantly inhibited IL-1β (E), IL-17 (F) and IL-6 (G). HIF-1α siRNA did not inhibit IFN-γ (H), or IL-10 (I). ELISA results obtained from siRNA experiments represent mean ± SEM of four different experiments. *, p < 0.05 and was considered significant.
-
Figure 6—source data 1
Effect of downregulation of HIF-1α via siRNA on IL-1β , IL-10, IL-17,IL-6 and IFN-γ production in sarcoid PBMCs.
- https://doi.org/10.7554/eLife.44519.014
Figure 7
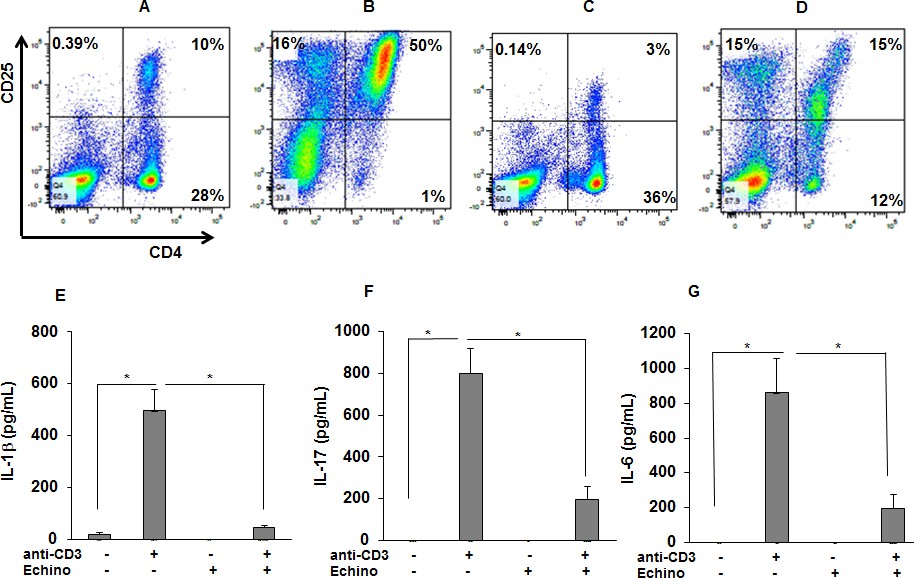
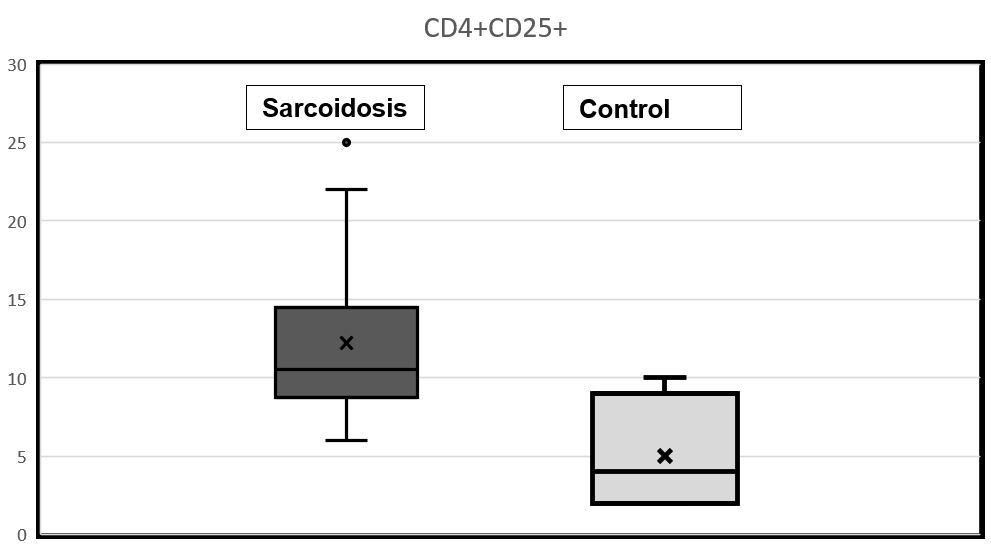
HIF-1α inhibition reduces the percentage of activated CD4 +CD25+cells in anti-CD3 stimulated sarcoid PBMCs and the production of IL-1β, IL-17, and IFN-γ.
PBMCs of sarcoid subjects were pretreated with echinomycin (HIF-1α inhibitor, 10 nM) for 30 min and were stimulated with anti-CD3 (1 μg/mL) in the presence of rhIL-2 (10 ng/mL) for 72 hr. Cells were harvested after 72 hr of culture and immunostained with fluorescein conjugated antibodies CD4 and CD25 and analyzed by flow cytometry using Flow-jo software. (A–D) Representative scatter plots show FACS analysis of CD4 and CD25 expression of sarcoidosis PBMCs. The percentage of CD4 and CD25 double positive, representing activated T-cells, were 10% in untreated PBMCs (A). In sarcoidosis PBMCs stimulated with anti-CD3 the percentage of CD4 and CD25 double positive T-cells increased to 50% (B). Sarcoidosis PBMCs cultured in the presence of echinomycin for 72 hr. The percentage of CD4 and CD25 double positive cells decreased from 10% to 3% (C). Sarcoidosis PBMCs were stimulated with anti-CD3 in the presence of echinomycin. The percentage of activated T-cells decreased from 50% after anti-CD3 challenge to 15% in the presence of echinomycin (D). Data presented is a representative plot of 5 independent experiments. The conditioned medium was assessed for IL-1β, IL-17 and IFN-γ using ELISA. Echinomycin significantly inhibited anti-CD3-induced IL-1β (E), IL-17 (F) and IFN-γ (G). Data represent mean ± SEM from six different experiments. *, p < 0.05 and was considered significant.
-
Figure 7—source data 1
HIF-1α inhibition reduces the production of IL-1β, IL-17, and IFN-γ in anti-CD3 stimulated sarcoid PBMCs.
- https://doi.org/10.7554/eLife.44519.016
Figure 8
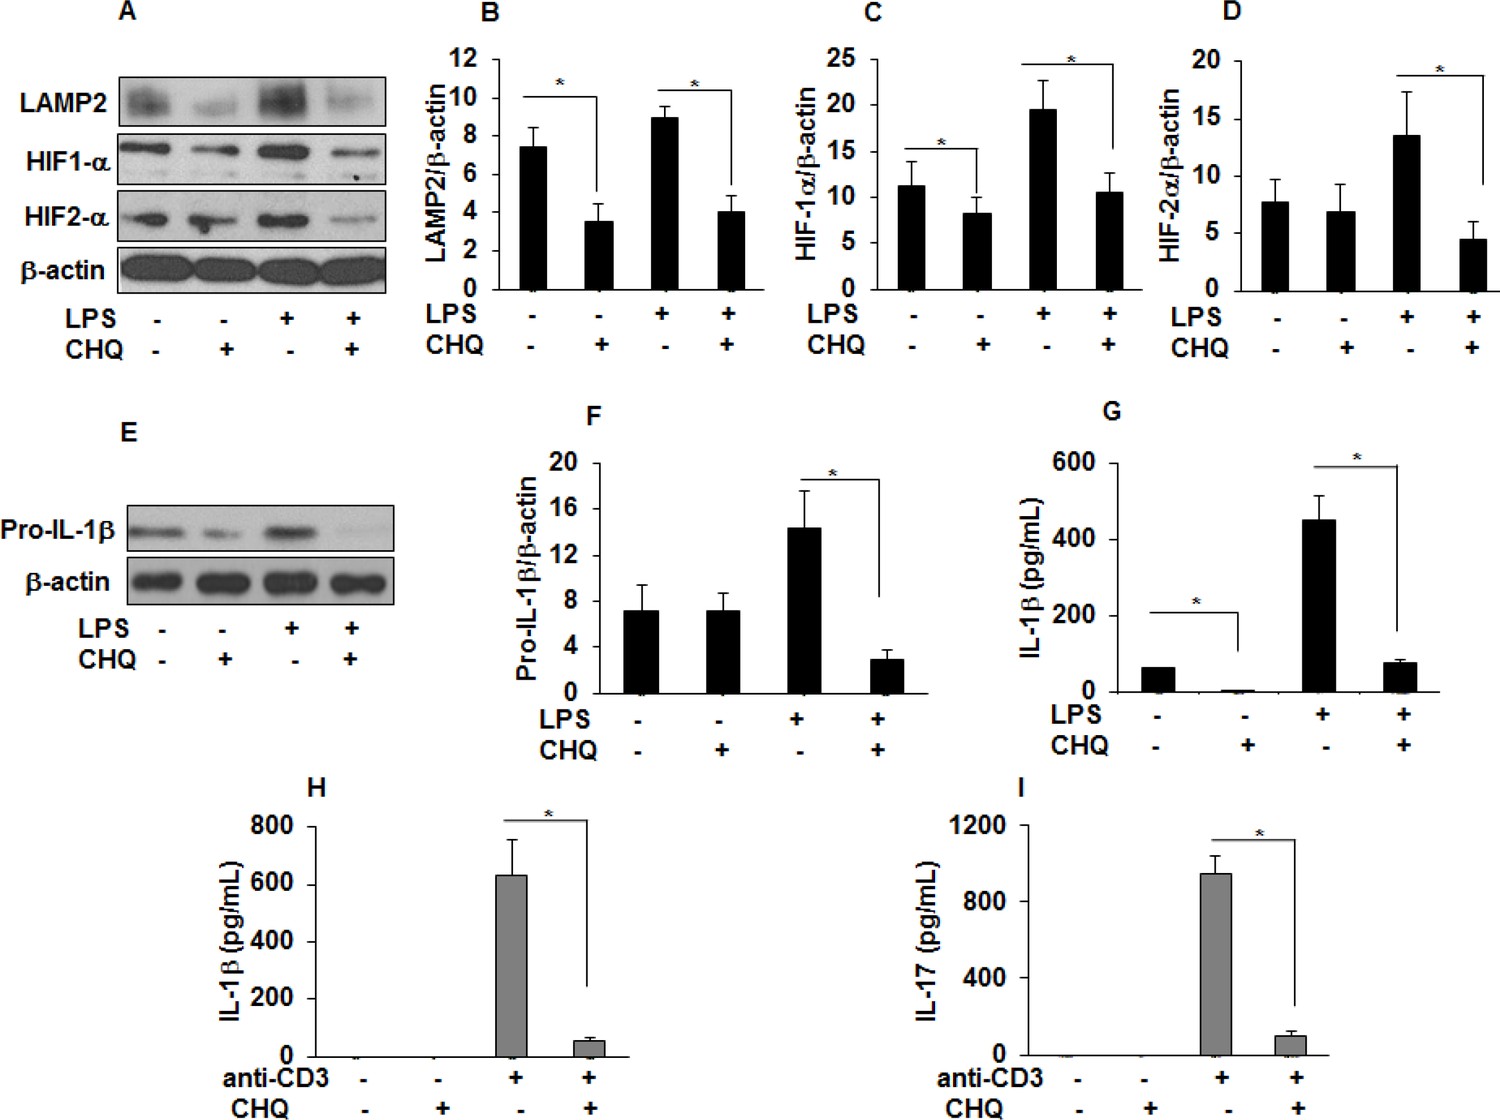
Chloroquine (CHQ) decreases LAMP2, HIF-α, IL-1 β, and IL-17 production in sarcoidosis.
Sarcoidosis AMs were pretreated with CHQ (100 µM) for 30 minutes and activated with LPS (100 ng/mL) for 3 hours. Whole cell lysates obtained after 3 hours of activation were subjected to immunoblotting to assess the LAMP2, HIF-1α, HIF-2α, and pro-IL-1β expression. Values were normalized to β-actin and are shown as relative expression to untreated cells. Densitometry analysis is expressed as fold increase of the ratio of specific protein/ β-actin. Culture supernatants were assessed for IL-1β via ELISA. CHQ significantly inhibited LAMP2 (50%) at baseline and both HIF-1α (50%) and HIF-2α (50%) protein expression in response to LPS challenge (A-D). CHQ significantly inhibited pro-IL-1β (70%) protein expression in response to LPS treatment (E and F) and significantly inhibited IL-1β production both at baseline and in response to LPS (G). Sarcoid PBMCs were pretreated with CHQ (100 µM) for 30 min and activated with anti-CD3 (1 µg/mL) in the presence of rhIL-2 (10 ng/mL). Conditioned media were collected after 72 hours and were assessed for IL-1 β and IL-17 via ELISA. CHQ significantly inhibited anti-CD3 induced IL-1β (H) and IL-17 (I) production. Western blot data presented is representative of five independent experiments. ELISA results represent mean ± SEM from five different experiments. *, p < 0.05 and was considered significant.
-
Figure 8—source data 1
Chloroquine (CHQ) decreases IL-1 β and IL-17 production in sarcoidosis..
- https://doi.org/10.7554/eLife.44519.018
Author response image 1
Author response image 2
Author response image 3

Author response image 4
Tables
Table 1
Subject Demographics.
https://doi.org/10.7554/eLife.44519.005| Characteristic | Patients | Control subjects | |
|---|---|---|---|
| Age, y | 27.7 ± 11.4 | 28 ± 8.4 | |
| BMI | 29 ± 10.4 | 28 ± 3.6 | |
| Gender, N (%) | |||
| Female | 35 (77) | 16(70) | |
| Male | 10 (23) | 7 (30) | |
| Race, N (%) | |||
| African American | 51 (100) | 15 (75) | |
| Caucasian | 0 (0) | 5 (25) | |
| CXR stage, N (%) | |||
| 0 | 0 (0) | NA | |
| 1 | 5 (11) | NA | |
| 2 | 30 (66) | NA | |
| 3 O2 saturation at Room Air | 10 (22) 96–100 | NA 97–100 | |
| Organ Involvements, N (%) | |||
| Neuro-ophtalmologic | 8 (17) | NA | |
| Lung | 43 (95) | NA | |
| Skin | 12 (26) | NA | |
| Multiorgan | 26 (57) | NA | |
| PPD | Negative | NA | |
-
Definition of abbreviations: BMI = body mass index, CXR = chest X-ray, NA = not applicable, PPD = purified protein derivative
Additional files
-
Transparent reporting form
- https://doi.org/10.7554/eLife.44519.020
Download links
A two-part list of links to download the article, or parts of the article, in various formats.
Downloads (link to download the article as PDF)
Open citations (links to open the citations from this article in various online reference manager services)
Cite this article (links to download the citations from this article in formats compatible with various reference manager tools)
HIF-1α regulates IL-1β and IL-17 in sarcoidosis
eLife 8:e44519.
https://doi.org/10.7554/eLife.44519


