NHR-14 loss of function couples intestinal iron uptake with innate immunity in C. elegans through PQM-1 signaling
- University of Utah, United States
Figures
Figure 1

Mutations in nhr-14 rescue the low iron developmental delay in hif-1(ia4) mutants.
(A) Representative images of wild-type N2 worms, hif-1(ia4) mutants and hif-1(qa6909) and hif-1(qa6910) mutant alleles grown for 5 days on NGM plates containing 25 uM BP (bipyridyl, iron chelator). Worm length is expressed as a percentage of wild-type N2 length (n = 2 biological replicates with 10 worms per strain). Values are expressed as mean ± SEM and were compared by unpaired two-tailed Student’s t-test, *p<0.05. (B) CloudMap SNP Mapping are shown as XY-scatter plots where the ratio of Hawaiian SNPs to Bristol SNPs is represented for the qa6909 and qa6910 mutations. (C) Protein alignment of the DNA-binding domains for human HNF4α and NHR-14 with locations of the qa6909 and qa6910 mutations (adapted from Figure 1 from Antebi, 2006, published under the terms of the Creative Commons Attribution License – CC-By 2.5 license; https://creativecommons.org/licenses/by/2.5/). Amino acid mutations are indicated in red. (D) Representative images of wild-type N2, hif-1(ia4), nhr-14(tm1473) and hif-1(ia4); nhr-14(tm1473) worms grown in NGM or NGM-25 uM BP (low iron) after 5 days. Worm length is expressed as a percentage of wild-type N2-NGM length (one experiment, n = 20 - 30 worms per strain). Values are expressed as mean ± SEM and compared by two-way ANOVA with Tukey’s multiple comparisons test, *p < 0.05; ***p < 0.001. Scale bars, 500 um.
Figure 2 with 2 supplements
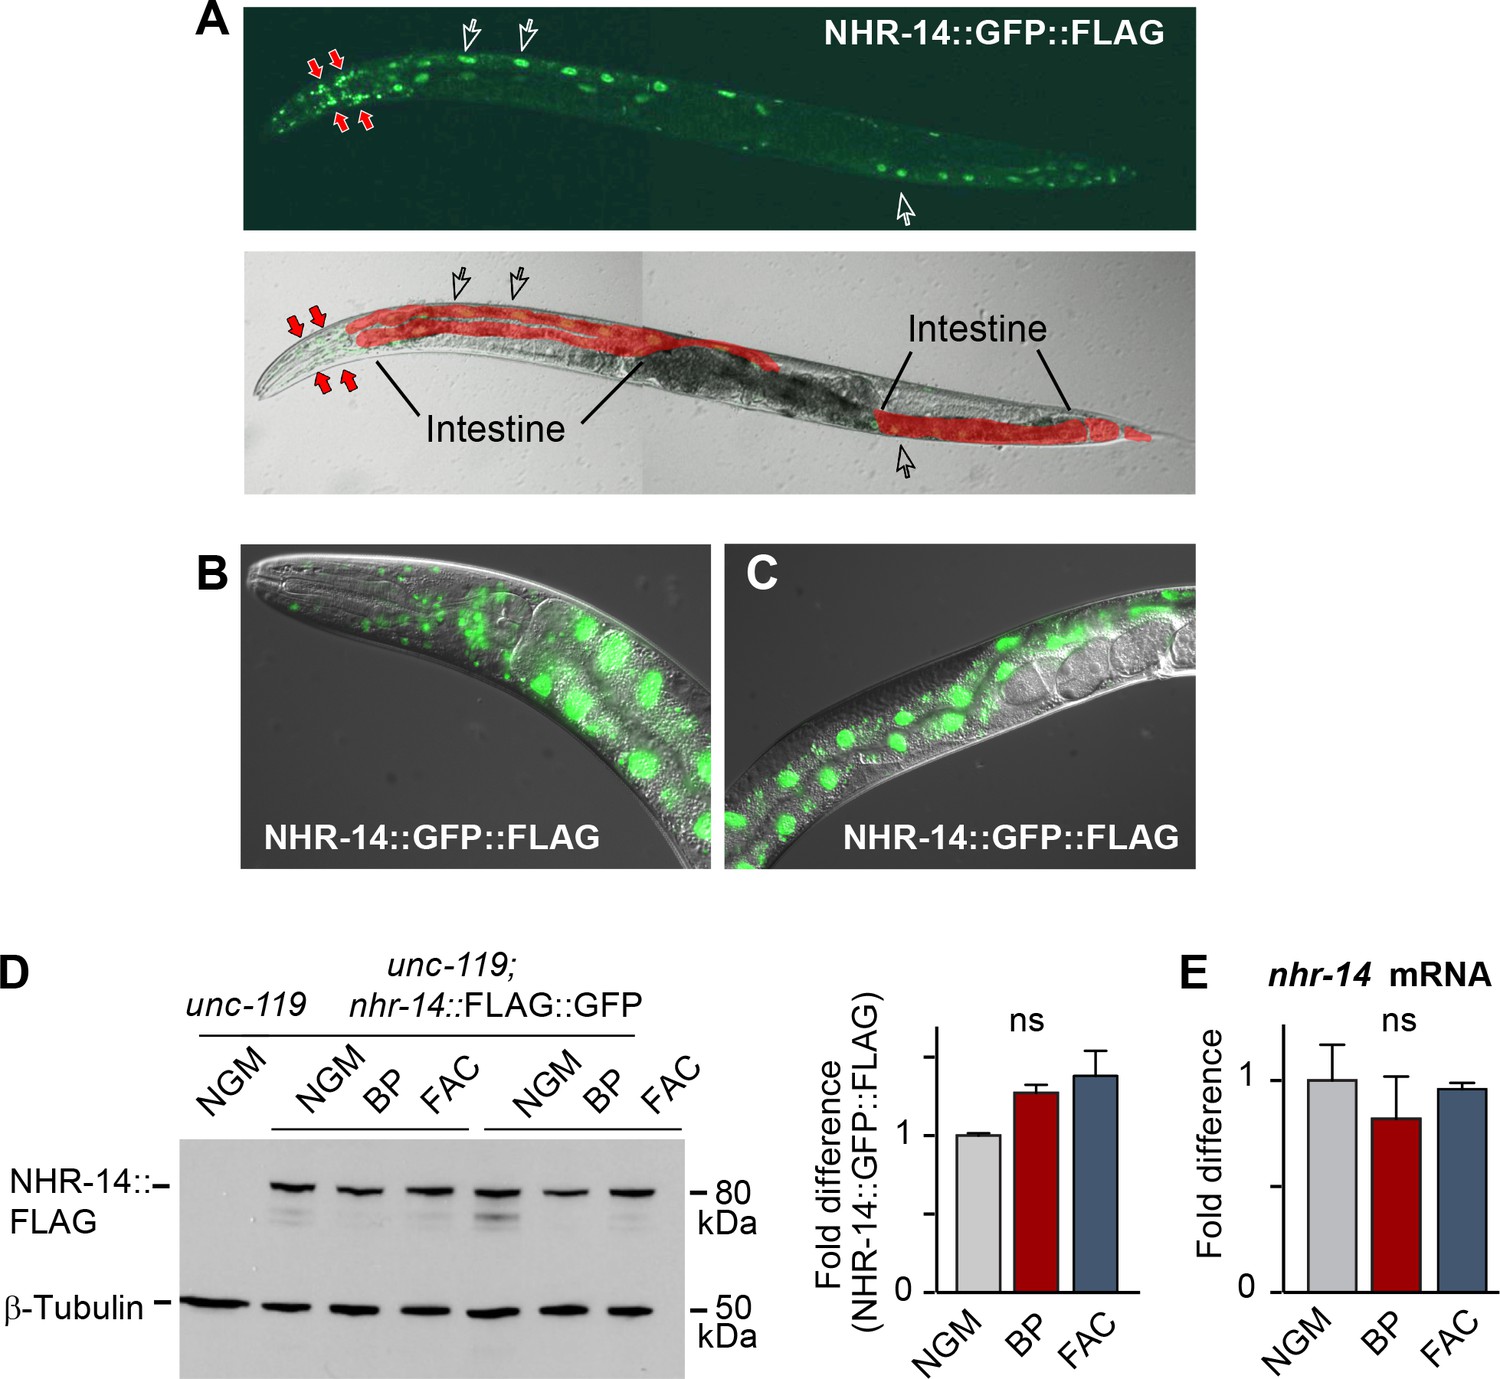
NHR-14 is highly expressed within intestinal and head cell nuclei and is not regulated by iron.
(A) NHR-14::GFP::FLAG expression in young adult transgenic worms assessed by confocal microscopy (40x). Open arrows, intestinal nuclei; red arrows, head cells. (B) GFP expression of NHR-14::GFP::FLAG in cells in the (B) head and (C) intestine (60x). (D) Western blot analysis of NHR-14::GFP::FLAG non-injected worms (unc-119) versus NHR-14::GFP::FLAG worms grown in NGM, NGM-BP (low iron) and NGM-FAC (high iron) (two biological replicates are shown); right panel, quantification of NHR-14::GFP::FLAG expression (n = 3 biological replicates). The blot was simultaneously probed with FLAG and β-tubulin antibodies. (E) qPCR of nhr-14 expression in wild-type N2 adults grown in NGM, NGM-BP and NGM-FAC normalized to N2 worms grown in NGM (n = 3 biological replicates). Values are expressed as mean ± SEM and are compared by unpaired two-tailed Student’s t test; ns, not significant.
Figure 2—figure supplement 1
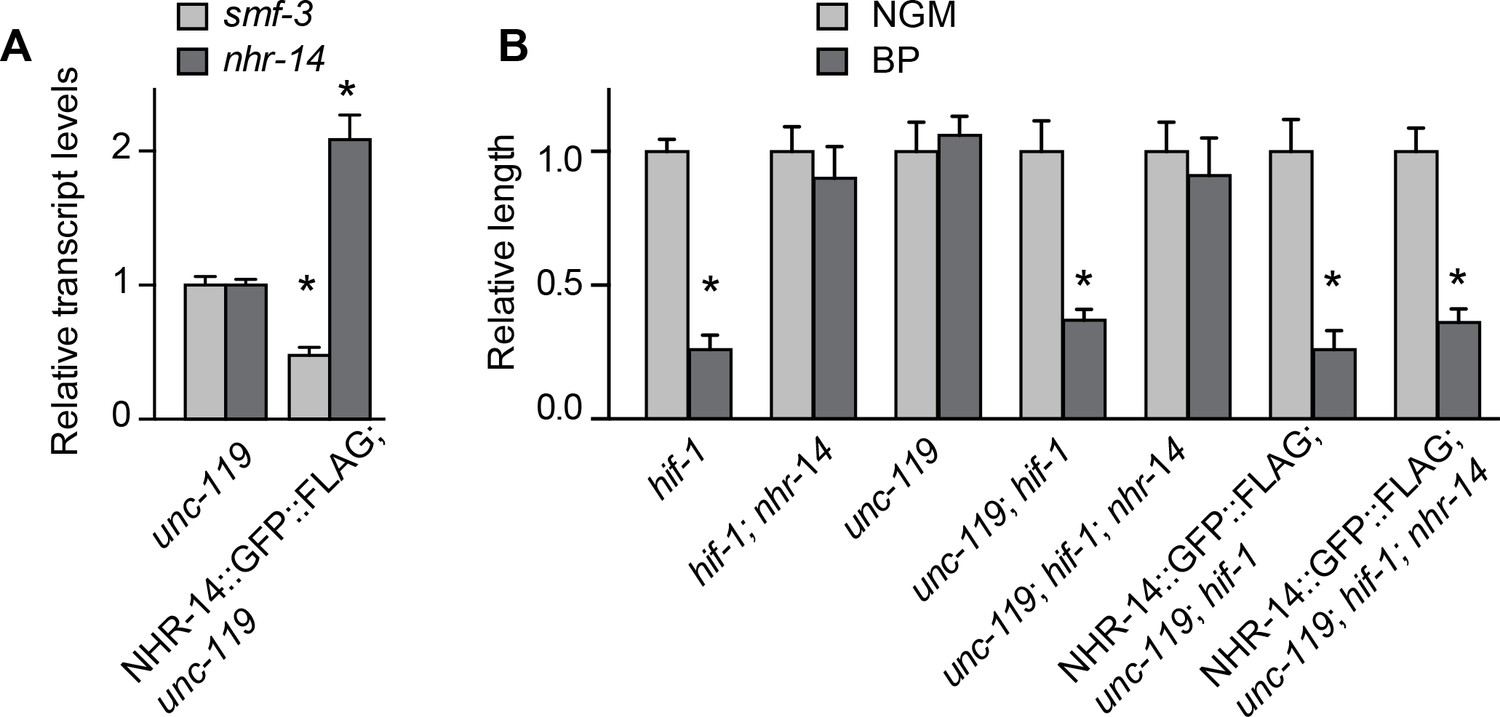
NHR-14::GFP::FLAG functions similarly to endogenous NHR-14.
The functionality of NHR-14::GFP::FLAG was tested by its ability to downregulate smf-3 mRNA levels, as well as replace endogenous NHR-14. (A) smf-3 and nhr-14 mRNAs were measured by qPCR in non-injected worms (unc-119) versus NHR-14::GFP::FLAG; ttTi5606; unc-119 transgenic worms. nhr-14 mRNA levels increased and smf-3 mRNA levels decreased in NHR-14::GFP::FLAG transgenic worms compared to non-injected ttTi5606; unc-119 worms. (B) To test for functional replacement of NHR-14, mutations in hif-1 and nhr-14 were introduced into the ttTi5606; unc-119 mutant and then injected with the NHR-14::GFP::FLAG expressing fosmid. Relative worm length of strains grown under NGM (gray bars) or BP (iron chelator) (black bars) conditions was determined. Data are from at least three independent experiments with a minimum of 20 worms per strain. Values are expressed as the mean NGM length ± SEM and compared by Student's t test, *p<0.05. Note that unc-119; hif-1; nhr-14 mutants expressing NHR-14::GFP::FLAG displayed the HIF-1-dependent growth delay as compared to unc-119; hif-1; nhr-14 mutants, indicating that NHR-14::GFP::FLAG is functional.
Figure 2—figure supplement 2
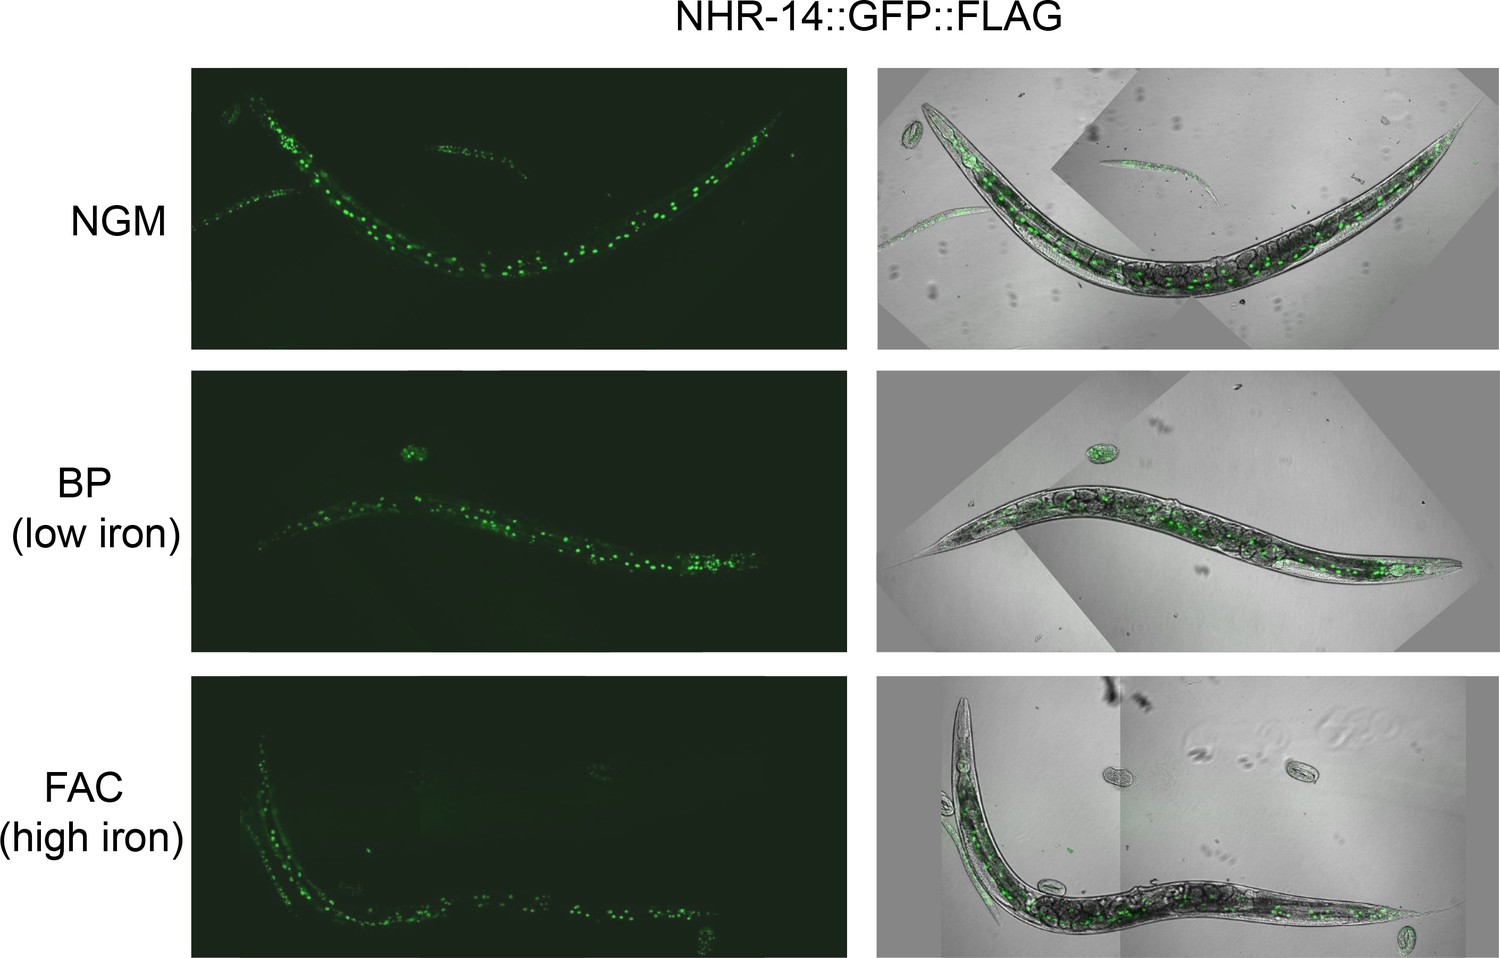
Iron does not affect the nuclear localization of NHR-14::GFP::FLAG.
Representative images of worms expressing NHR-14::GFP::FLAG (Line 3) grown on NGM, NGM-25 µM BP (low iron) or NGM-FAC (high iron) plates (40x).
Figure 3
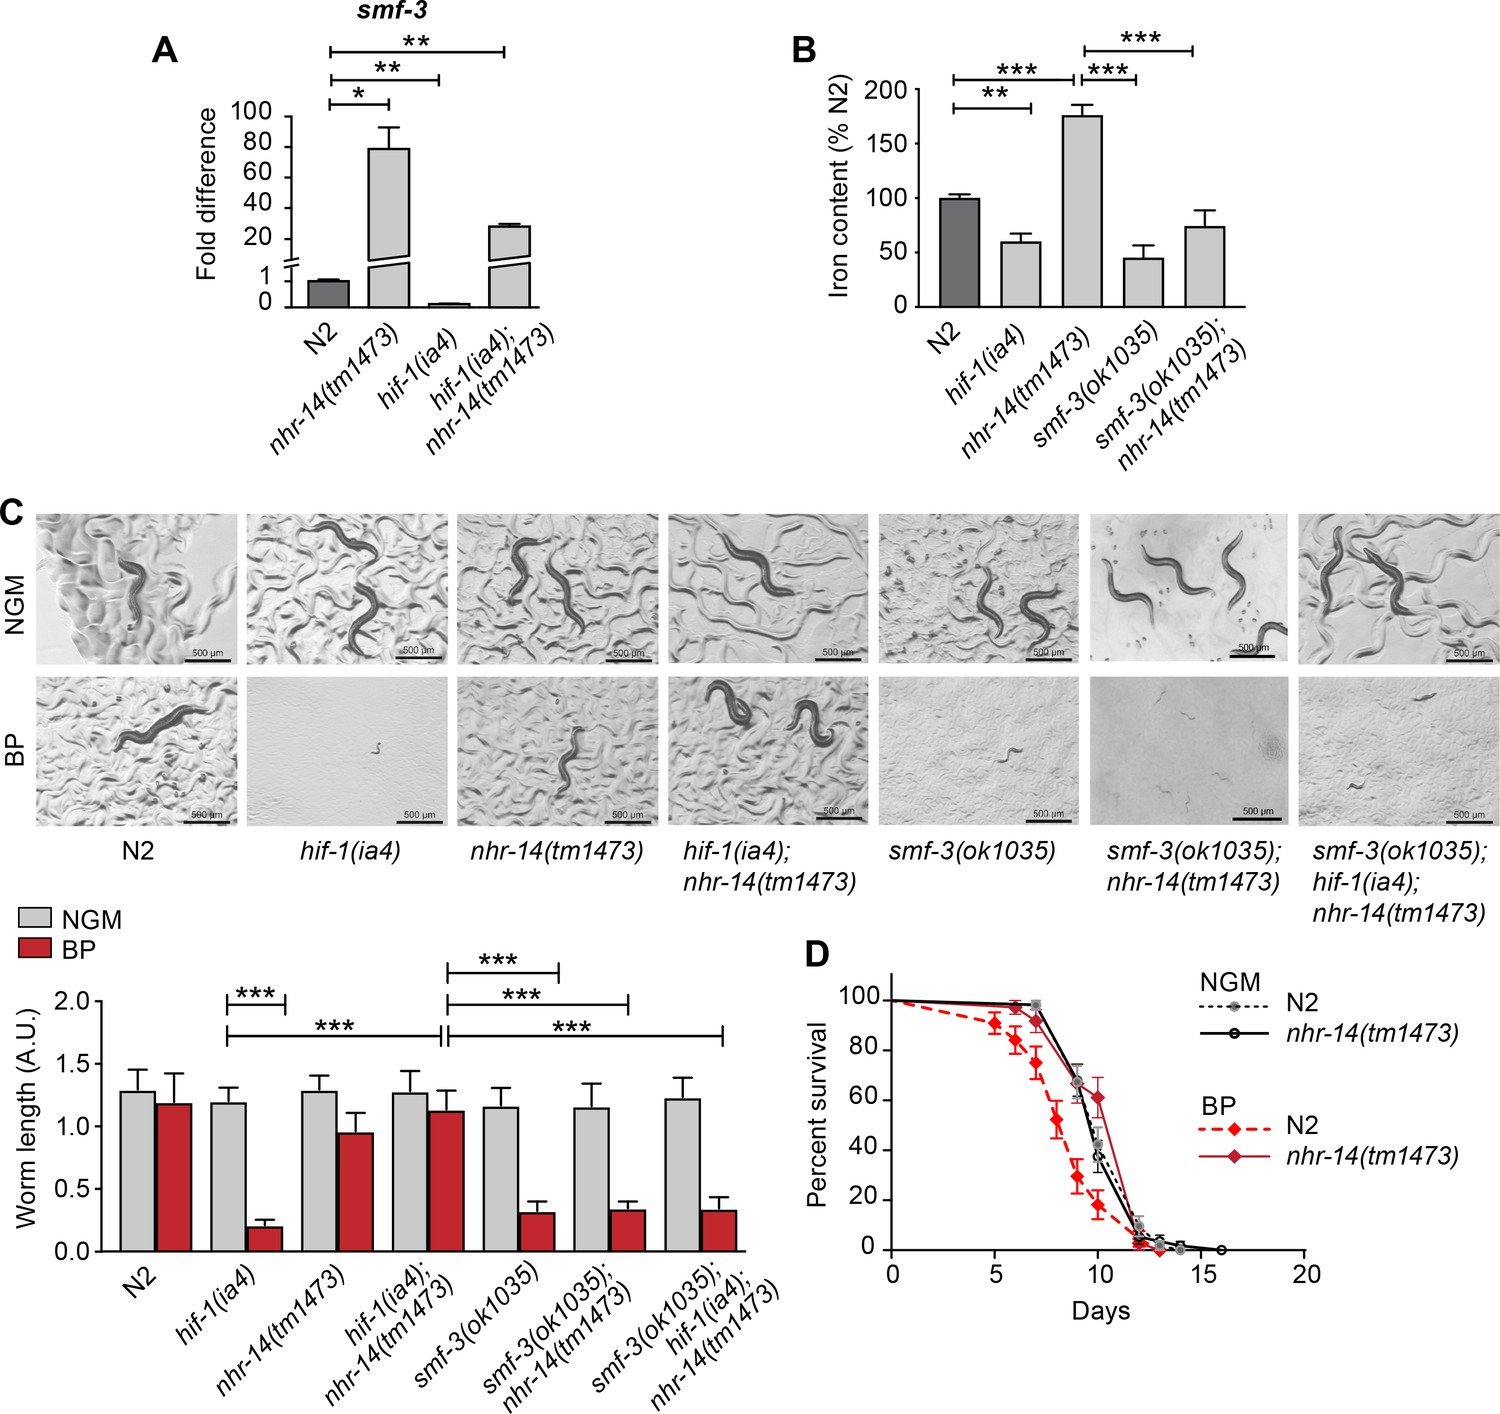
Loss of NHR-14 regulates iron uptake by SMF-3.
(A) qPCR of smf-3 expression measured in wild-type N2, nhr-14(tm1473) and hif-1(ia4) single mutants, and hif-1(ia4); nhr-14(tm1473) double mutants grown in NGM (n = 3 biological replicates). Values are expressed as fold difference compared to wild-type N2 worms. (B) Total iron content of wild-type N2 worms, hif-1(ia4), nhr-14(tm1473) and smf-3(ok1035) single mutants, and smf-3(ok1035); nhr-14(tm1473) double mutants grown in NGM and quantified by ICP-OES (n = 3 biological replicates). For A-B, values are expressed as mean ± SEM, and compared by unpaired two-tailed Student’s t-test for (A) and a two-way ANOVA with Tukey’s multiple comparisons test for (B), *p<0.05, **p<0.01, ***p<0.001. (C) Representative images and quantitation of wild-type N2 worms and indicated mutant strains grown on NGM or NGM-BP (low iron) plates for 5 days. Data are combined from two biological replicates (n = 14–31 worms/strain). Values are expressed as mean worm length ± SEM and compared by two-way ANOVA with Tukey’s multiple comparisons test, ***p<0.001. Scale bar, 500 um. (D) Survival analysis of wild-type N2 and nhr-14(tm1473) worms grown in NGM and NGM-BP (low iron). Median survival time (MS): wild-type N2-NGM (MS = 10 days, n = 52); nhr-14(tm1473)-NGM (MS = 10 days, n = 56); wild-type N2-BP (MS = 9 days, n = 44); nhr-14(tm1473)-BP (MS = 12 days, n = 36), Log-rank Mantel-Cox test, ***p<0.001, wild-type N2-BP versus nhr-14(tm1473)-BP.
-
Figure 3—source data 1
RNA-seq gene list of upregulated and downregulated nhr-14(tm1473) genes.
- https://doi.org/10.7554/eLife.44674.007
Figure 4 with 3 supplements

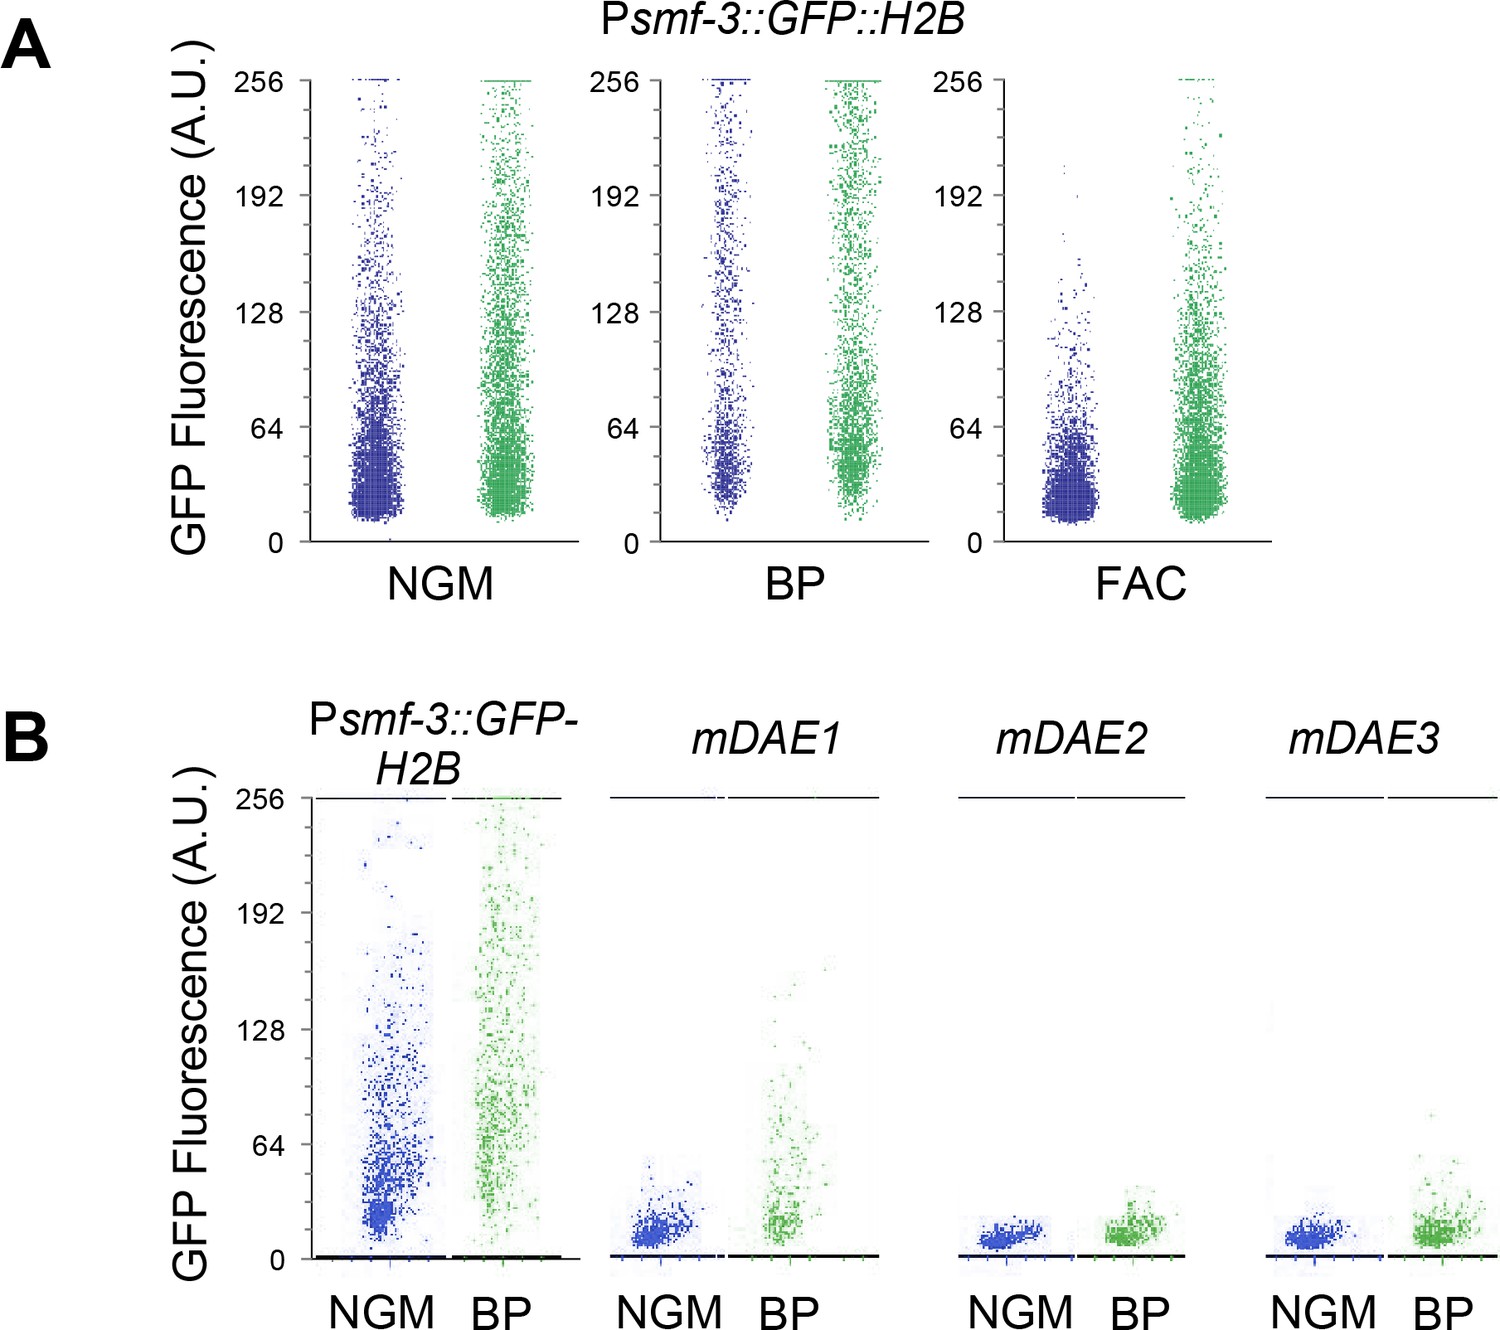
PQM-1 is downstream of NHR-14 and activates smf-3.
(A) Illustration of the Psmf-3::GFP-H2B transcriptional reporter containing 1.5 kb of 5’-promoter sequences of smf-3. The 118 bp iron-dependent element (IDE) harbors two hypoxia-response elements (HREs) and three GATA-like DAE motifs. Single nucleotide mutations in the DAEs are indicated in red. (B) GFP expression in Psmf-3::GFP-H2B worms fed control (empty vector) RNAi or nhr-14 RNAi grown on NGM, NGM-BP (low iron) or NGM-FAC (high iron) plates and quantified using COPAS Biosort (n = 1000 worms/sample). (C) GFP expression in Psmf-3::GFP-H2B worms harboring a nucleotide mutation (G > C) in each DAE grown on NGM or NGM-BP plates and quantified using COPAS Biosort (n = 1000 worms/sample). (D) Endogenous smf-3 expression in wild-type N2 worms versus pqm-1(ok485) mutants grown on NGM plates. (E) smf-3 expression in wild-type N2 worms and nhr-14(tm1473) mutants fed control RNAi or pqm-1 RNAi. (F) Length of wild-type N2, hif-1(ia4) and pqm-1(ok485) mutants grown on NGM or NGM-BP plates for 4 days. (G) PQM-1::GFP nuclear and cytoplasmic localization in L4 stage and adult worms fed control RNAi or nhr-14 RNAi and quantification of PQM-1::GFP expression. L4 stage, control RNAi (n = 29) and nhr-14 RNAi (n = 44); adults, control RNAi (n = 98) and nhr-14 RNAi (n = 88). For B, E and G, values are expressed as mean ± SEM (n ≥ 3 biological replicates) and compared by two-way ANOVA with Tukey’s multiple comparisons test, **p < 0.01, ***p < 0.001. For C, D and F, values are expressed as mean ± SEM (n ≥ 3 biological replicates) and are compared by unpaired two-tailed Student’s t test, *p < 0.05, ***p < 0.001.
Figure 4—figure supplement 1
COPAS Biosort data for Psmf-3::GFP-H2B transgene expression.
(A) GFP expression of Psmf-3::GFP-H2B worms fed control (empty vector) RNAi or nhr-14 RNAi and grown on NGM or NGM-BP (low iron) plates. (B) GFP expression of Psmf-3::GFP-H2B worms harboring a nucleotide mutation (G > C) in each DAE grown on NGM or NGM-25 µM BP plates. Worms were analyzed using COPAS Biosort where L4 stage to young adult worms were gated based on extinction and time of flight parameters (TOF). Extinction and TOF parameters were held constant for subsequent GFP fluorescence acquisition throughout all conditions. GFP fluorescence for 1000 worms was analyzed using FlowJo.
Figure 4—figure supplement 2
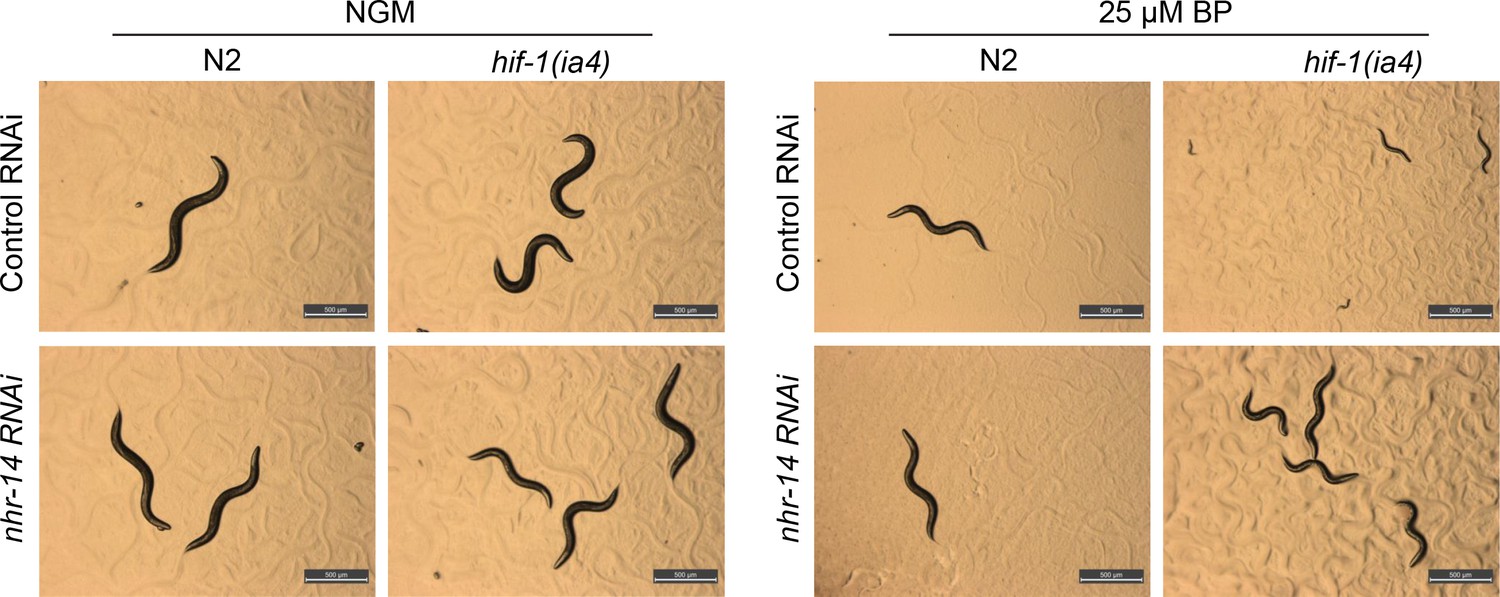
Validation of nhr-14 RNAi potency.
Representative images of wild-type N2 worms and hif-1(ia4) mutants fed control (empty vector) RNAi or nhr-14 RNAi and grown on NGM plates or NGM-25 µM BP (low iron) plates for 4 days. hif-1(ia4) mutants fed control RNAi and grown on NGM-BP plates displayed a growth delay that was rescued by nhr-14 RNAi.
Figure 4—figure supplement 3
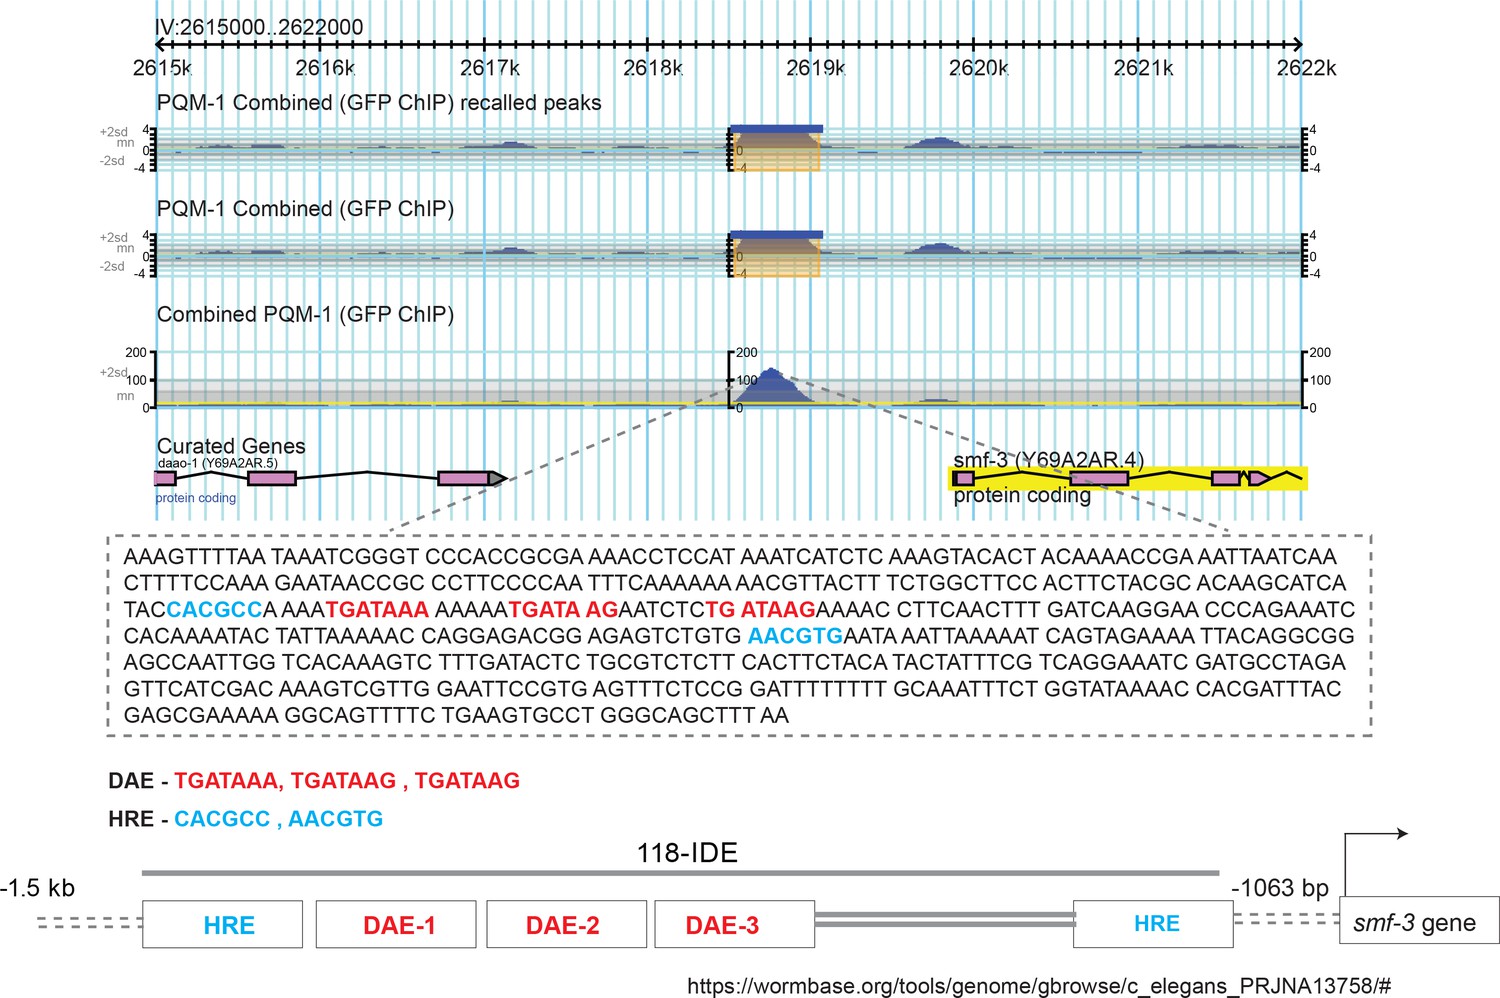
PQM-1 shows significant association with the smf-3 IDE.
Taken from Wormbase dataset containing genome-wide in vivo binding profiles for C. elegans transcription factors (Niu et al., 2011). The 118 bp iron-dependent element (IDE) harboring three GATA-like DAEs and two HIF-1 binding sites (HRE) are shown (Romney et al., 2011).
Figure 5
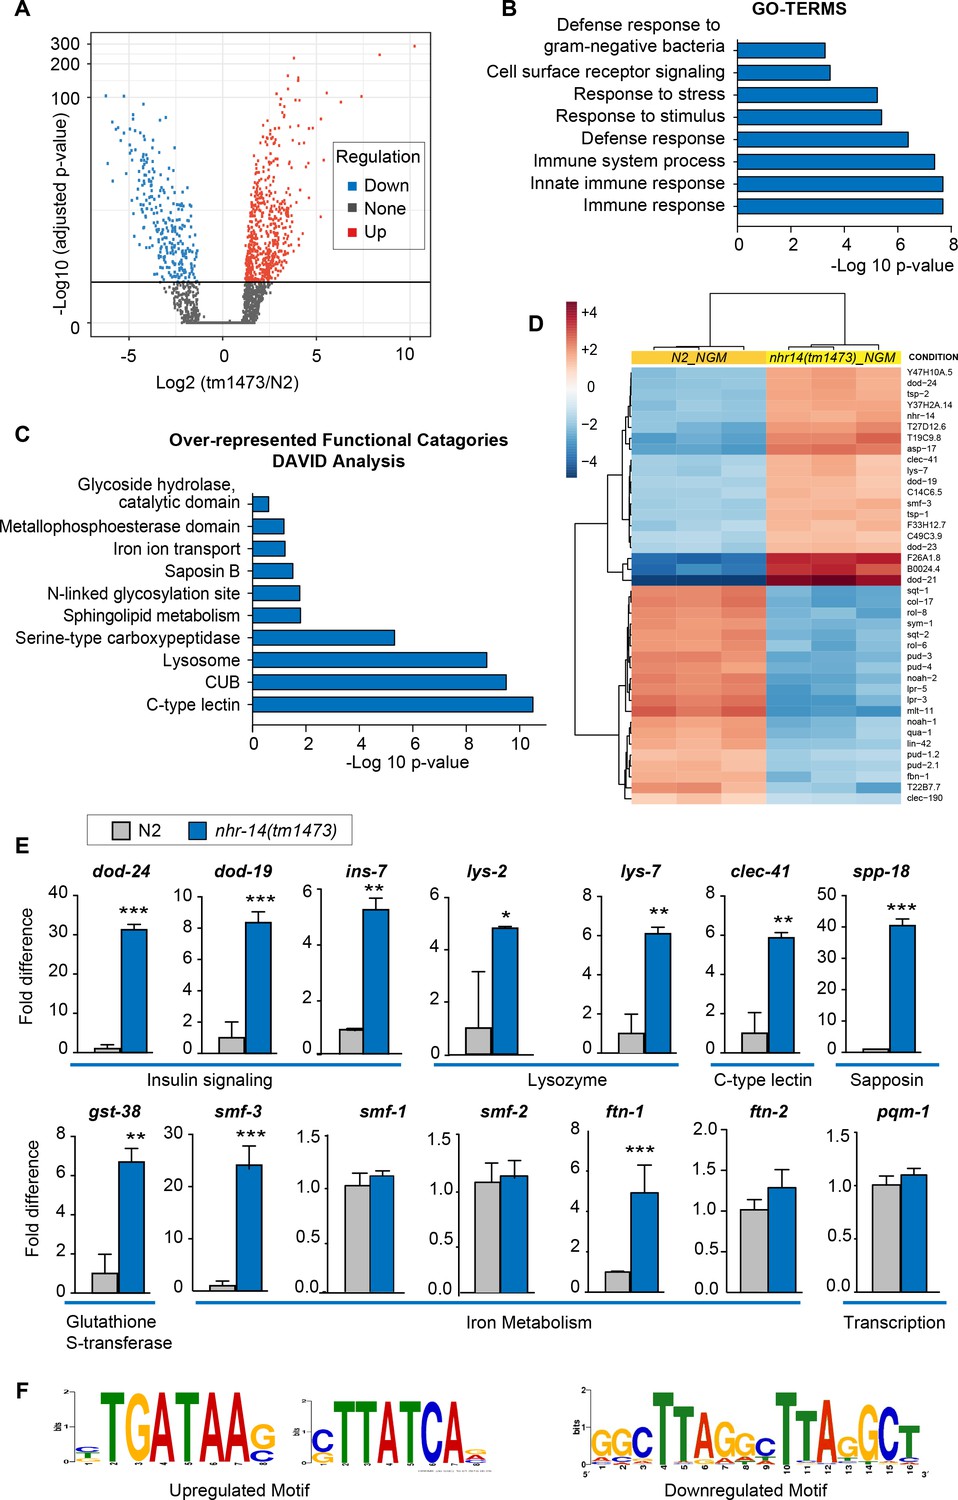
NHR-14 loss of function regulates an innate immune transcriptional program.
(A) Volcano plot of differentially transcribed genes in nhr-14(tm1473) mutants normalized to wild-type N2. The x-axis denotes the fold-changes and the y-axis denotes -log10 of wald test adjusted p-values. The horizontal line represents the p-value threshold of <0.05. (B) Gene ontology (GO) analysis of genes that are upregulated in nhr-14(tm1473) mutants normalized to wild-type N2 worms. (C) DAVID analysis for over-represented functional categories of upregulated genes in nhr-14(tm1473) mutants normalized to wild-type N2 worms. (D) Heat map showing the top 20 upregulated and 20 downregulated genes that are differentially expressed between nhr-14(tm1473) mutants and wild-type N2 worms. The columns represent three biological replicates of wild-type N2 and nhr-14(tm1473) mutants, and the rows represent individual genes. (E) qPCR validation of selected innate immune and iron-related genes that are upregulated in nhr-14(tm1473) mutants (n ≥ 3 biological replicates). Values are expressed as fold difference compared to wild-type N2 worms ± SEM and compared by unpaired two-tailed Student’s t test *p<0.05, **p<0.01, ***p<0.001. (F) Motif enrichment analysis for upregulated and downregulated genes in nhr-14(tm1473) mutants.
-
Figure 5—source data 1
Overlap between upregulated and downregulated nhr-14(tm1473) genes with published C. elegans tissue-specific expression datasets using WormExp v1.
- https://doi.org/10.7554/eLife.44674.013
Figure 6
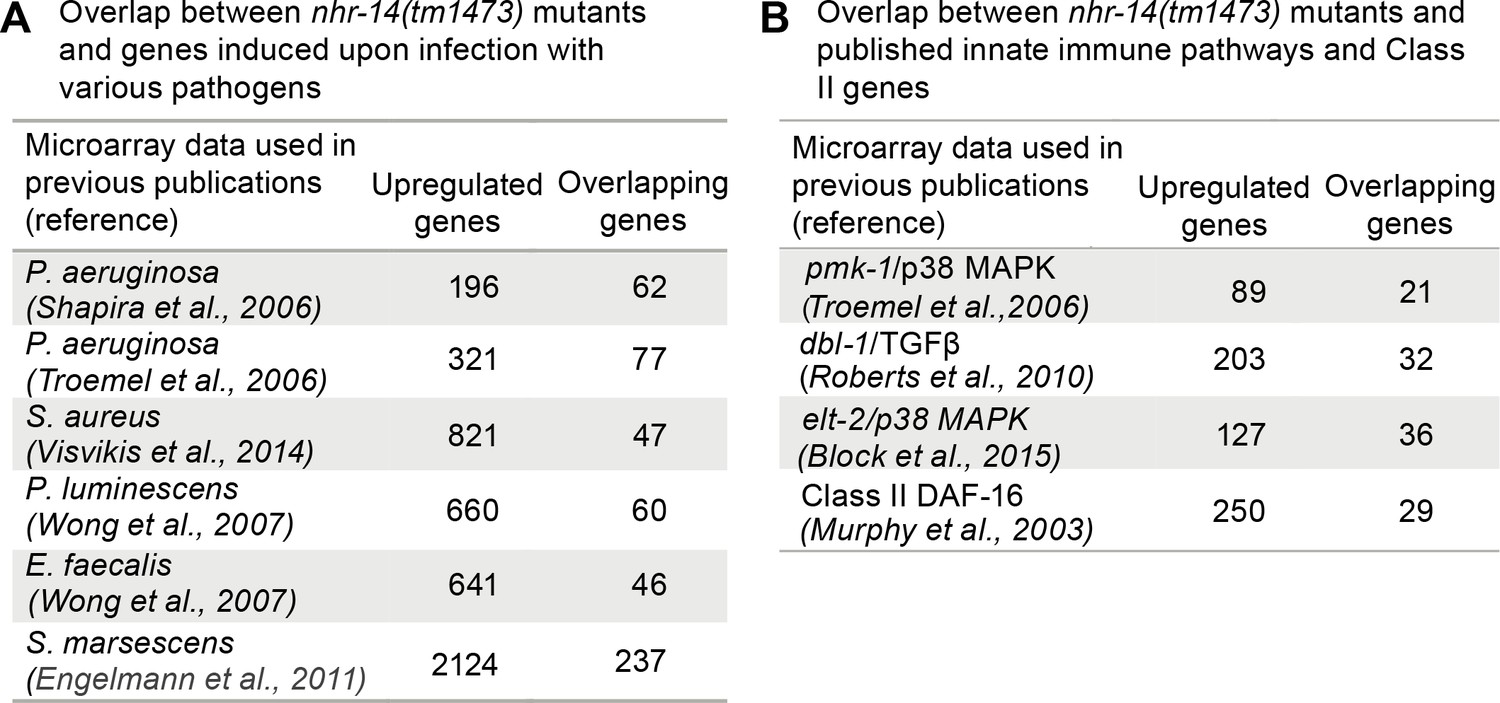
Overlap between pathogen and innate immune pathway datasets and nhr-14(tm1473) mutants.
(A) Number of overlapping genes between nhr-14(tm1473) mutants and published pathogen infection models. (B) Number of overlapping genes between nhr-14(tm1473) mutants and published innate immune pathway datasets.
-
Figure 6—source data 1
Overlap between upregulated nhr-14(tm1473) genes at log fold change >1 and published pathogen infection dataset.
- https://doi.org/10.7554/eLife.44674.015
-
Figure 6—source data 2
Overlap between upregulated nhr-14(tm1473) genes at a log fold change >1 and published datasets for the p38/MAPK, TGFβ and elt-2 pathways.
- https://doi.org/10.7554/eLife.44674.016
-
Figure 6—source data 3
Overlap between upregulated nhr-14(tm1473) genes at log fold change >1 and published datasets of DAF-16/FoxO-Class II genes, and PQM-1 ChIP-seq data.
- https://doi.org/10.7554/eLife.44674.017
-
Figure 6—source data 4
Overlap between upregulated and downregulated nhr-14(tm1473) genes with published C. elegans mutant-specific expression datasets using WormExp v1.
- https://doi.org/10.7554/eLife.44674.018
Figure 7
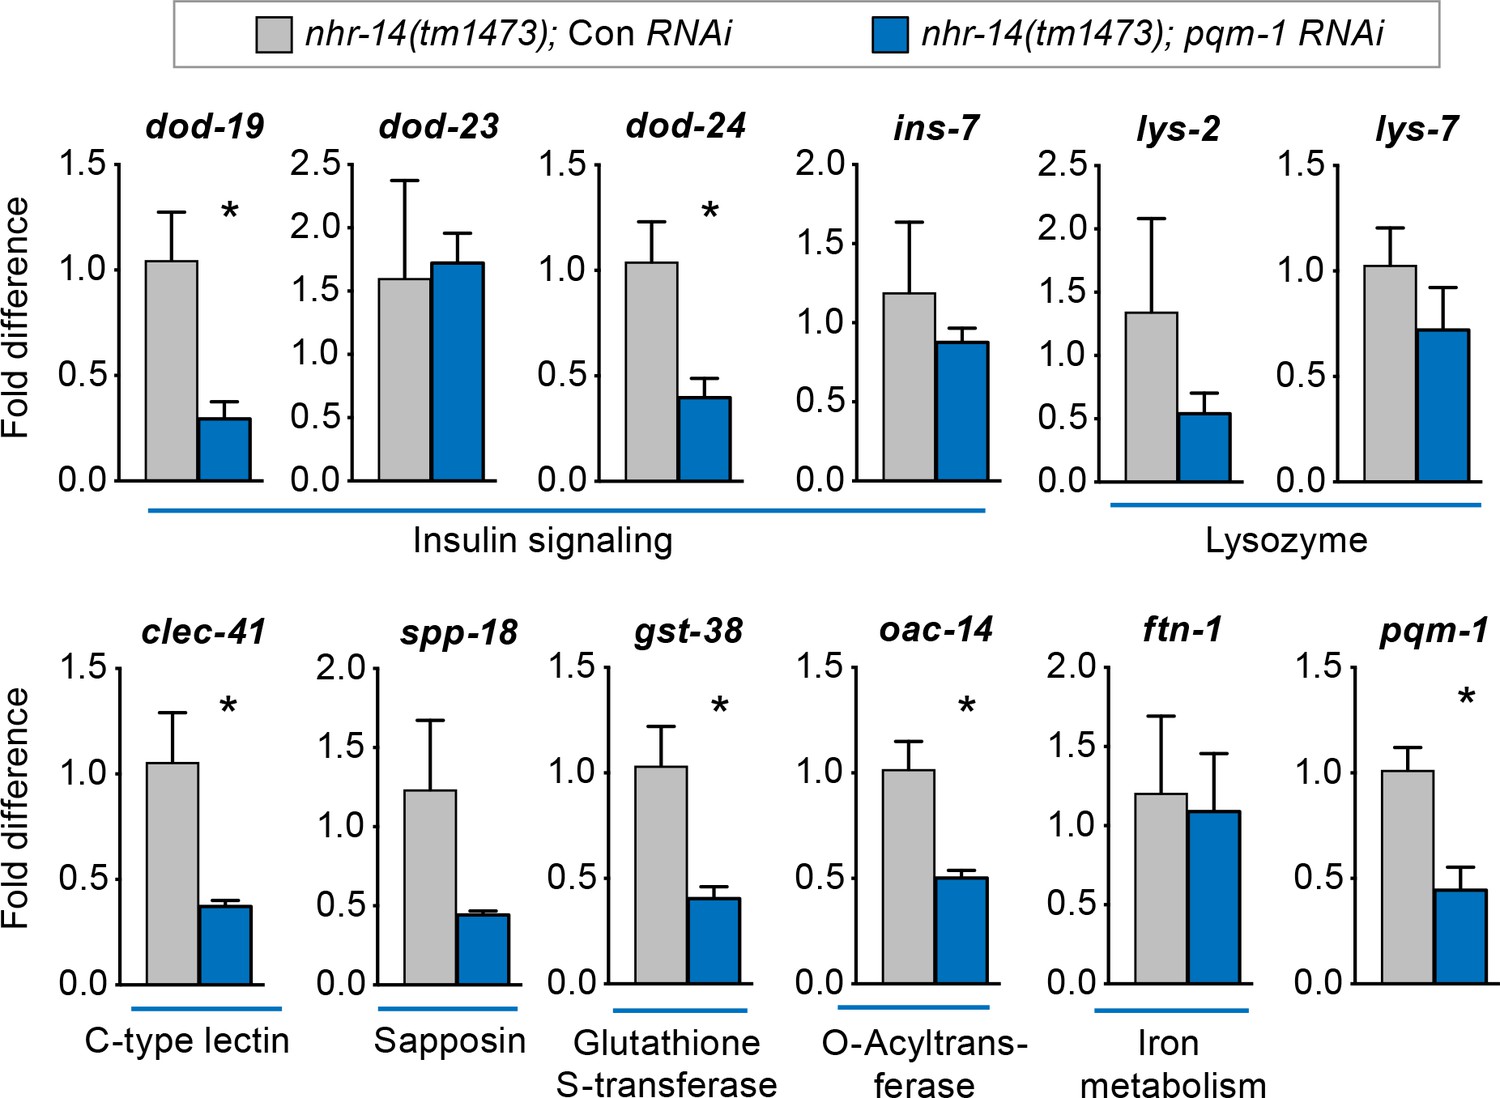
PQM-1 regulates DAF-16/FoxO-Class II genes downstream of nhr-14.
qPCR analysis of upregulated nhr-14 genes in nhr-14(tm1473); pqm-1 RNAi mutants and nhr-14(tm1473); Con RNAi worms (n = 3 biological replicates). Values are expressed as fold difference compared to nhr-14(tm1473); Con RNAi mutants ± SEM and are compared by unpaired two-tailed Student’s t test, *p<0.05.
Figure 8
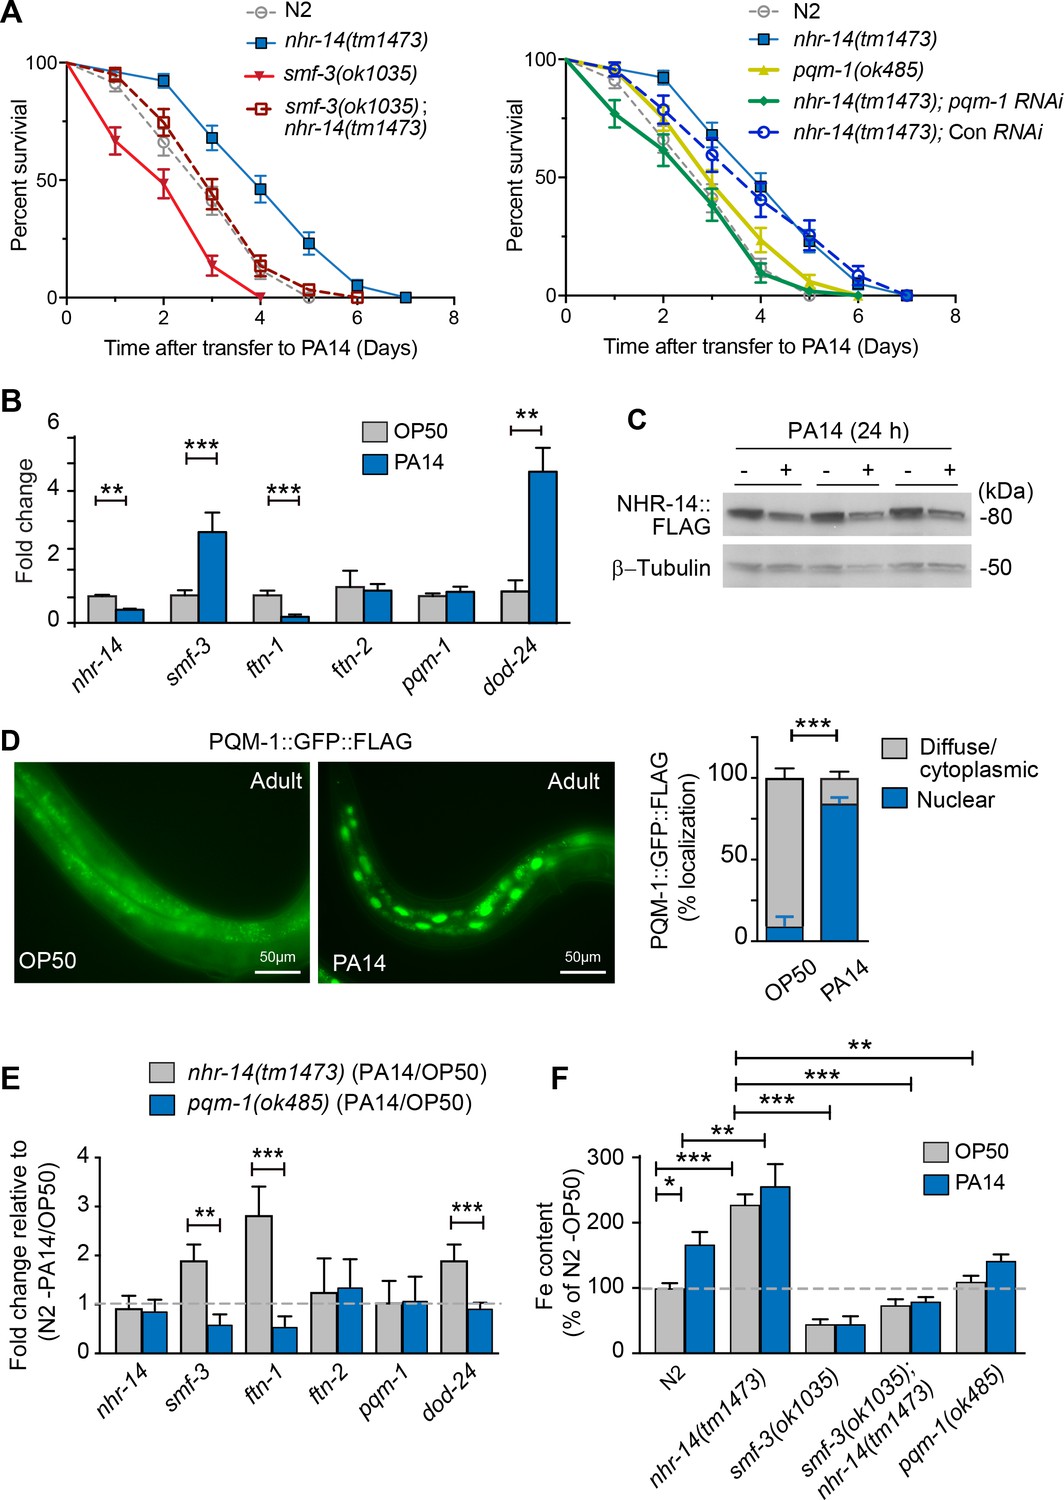
Loss of NHR-14 confers resistance to P. aeruginosa infection.
(A) Survival analysis for the indicated mutants and wild-type N2 worms infected with P. aeruginosa PA14. Data are combined from three biological replicates. Median survival (MS): wild-type N2 (MS = 3 days, n = 68); nhr-14(tm1473) (MS = 4 days, n = 78); pqm-1(ok485) (MS = 3 days, n = 68); smf-3(ok1035) (MS = 2 days, n = 66); smf-3(ok1035); nhr-14(tm1473) (MS = 3 days, n = 59); nhr-14(tm1473); Con (RNAi) (MS = 4 days, n = 47); nhr-14(tm1473); pqm-1 (RNAi) (MS = 3 days, n = 52). Median survival of wild-type N2 worms grown in OP50 is 10 days (see Figure 3D). All survival curves are significantly different from one another, p<0.05, except for wild-type N2 vs pqm-1(ok485) p=0.835; wild-type N2 vs smf-3(ok1035); nhr-14(tm1473) p=0.621; nhr-14(tm1473) vs nhr-14 Con RNAi; Log-rank Mantel-Cox test. (B) qPCR analysis of indicated genes in wild-type N2 worms after feeding on non-pathogenic E. coli OP50 or PA14 for 24 hr. Values are expressed as mean fold change relative to OP50 ± SEM (n = 3 biological replicates) and compared by unpaired two-tailed Student’s t test, **p<0.01, ***p<0.001. (C) Western blot analysis of lysates prepared from NHR-14::GFP::FLAG worms after feeding on OP50 or PA14 for 24 hr (n = 3 biological replicates). (D) PQM-1::GFP::FLAG expression in adult worms exposed to OP50 and PA14 for 24 hr. Quantification of nuclear and diffuse cytoplasmic localization of PQM-1::GFP:FLAG exposed to OP50 (n = 134 worms) and PA14 (n = 169 worms). Values are expressed as percentage PQM-1::GFP::FLAG localization. (E) qPCR analysis of indicated genes in nhr-14(tm1473) and pqm-1(ok485) mutants after feeding on OP50 or PA14 for 24 hr. Values are expressed as mean PA14/OP50 fold change relative to wild-type N2 worms ± SEM (n = 3 biological replicates) and compared by unpaired two-tailed Student’s t test **p<0.01, ***p<0.001. (F) Iron content in wild-type N2 worms and indicated mutants after feeding on OP50 or PA14 for 24 hr as measured using ICP-MS. Values are expressed as mean ± SEM (n = 3–5 biological replicates) and compared by two-way ANOVA with Tukey’s multiple comparisons test, *p<0.05, **p<0.01, ***p<0.001.
-
Figure 8—source data 1
Survival statistics for P. aeruginosa strain PA14 lifespan analysis.
- https://doi.org/10.7554/eLife.44674.021
Figure 9
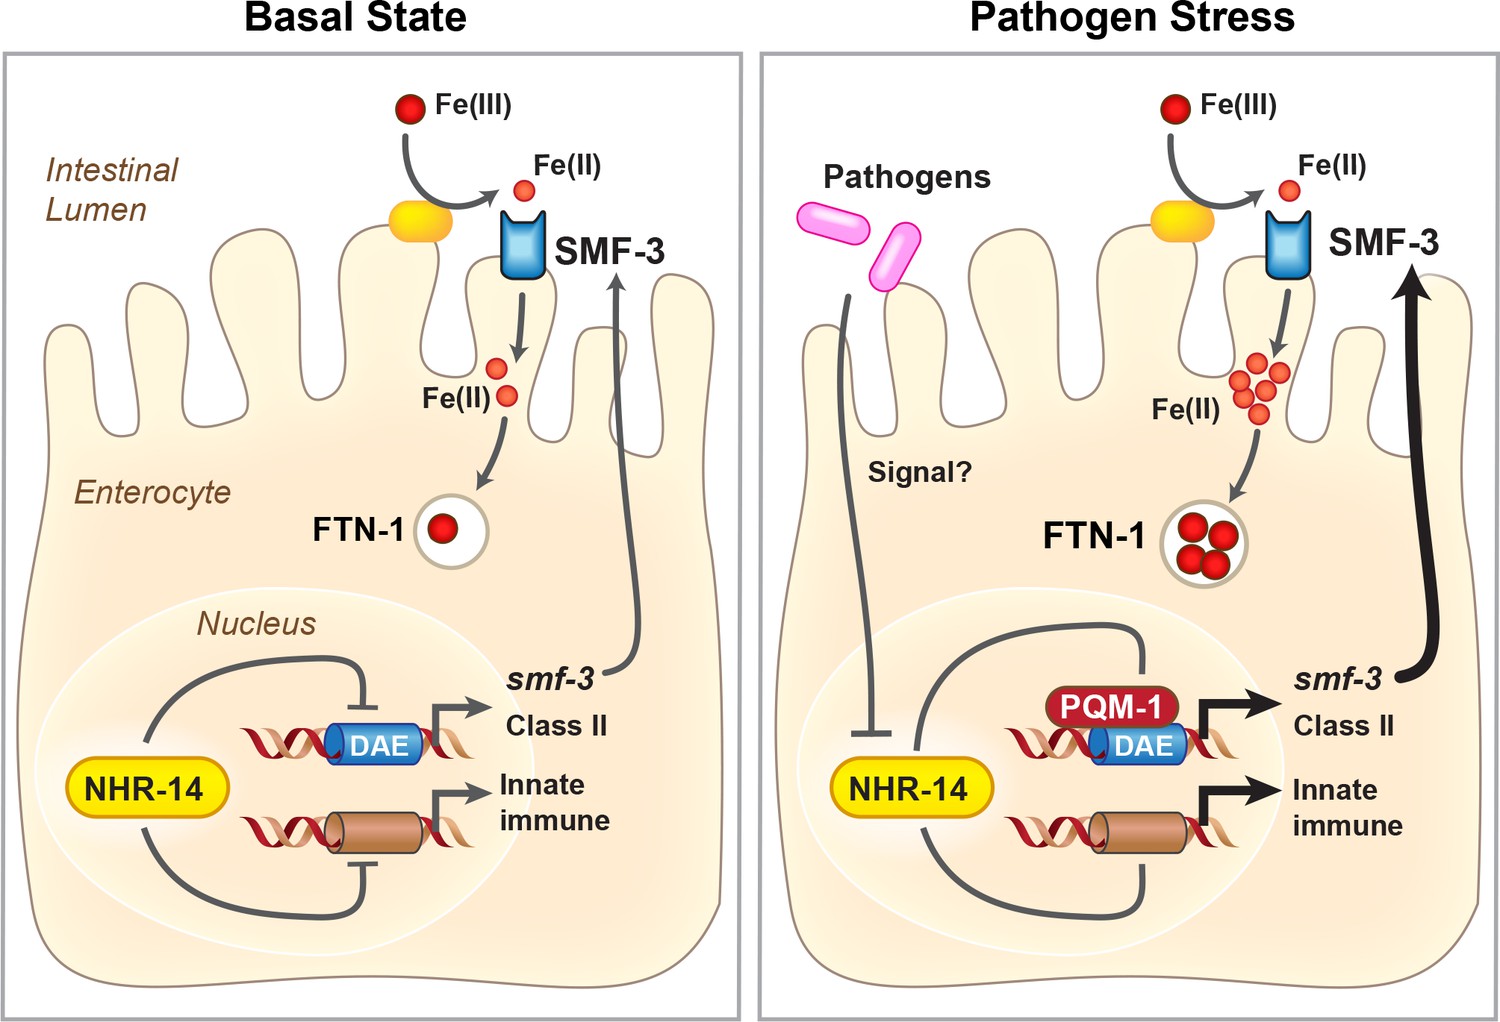
Proposed model for NHR-14-PQM-1 signaling pathway in intestinal regulation of innate immunity and iron metabolism in C. elegans.
Under basal conditions, NHR-14 represses smf-3, specific DAF-16/FoxO-Class II genes and innate immune response genes to promote growth and development. Upon exposure to P. aeruginosa, NHR-14 function/activity is reduced, leading to PQM-1 nuclear localization and transcriptional activation of smf-3 and DAF-16/FoxO-Class II through the GATA-like DAE. SMF-3 mediates Fe(II) uptake after the reduction of Fe(III) by an unknown membrane associated ferrireductase (yellow oval). Increased cellular iron activates ftn-1 transcription through a HIF-1-dependent mechanism (Ackerman and Gems, 2012; Romney et al., 2011), leading to the sequestration of iron within FTN-1. We suggest that increased iron uptake by SMF-3 and sequestration by FTN-1 may provide a strategy to limit P. aeruginosa acquisition of intestinal luminal iron and serves as a component of the host innate immune response. How NHR-14 senses pathogen stress and the identity of NHR-14 downstream effectors remain to be determined.
Tables
Key resources table
| Reagent type (species) or resource | Designation | Source or reference | Identifiers | Additional information |
|---|---|---|---|---|
| Strain (Caenorhabditis elegans) | C. elegans strains used in this study are listed in Supplementary file 1 -Table 1 | This paper | ||
| Strain (Escherichia coli) | OP50 | C. elegans Genetics Center | RRID: WB-STRAIN:OP50 | |
| Strain (Escherichia coli) | HT115(DE3) | C. elegans Genetics Center | RRID: WB-STRAIN:HT115(DE3) | |
| Strain (Pseudomonas aeruginosa) | PA14 | Other | RRID: WB-STRAIN:PA14 | Ausubel Laboratory, The Massachusetts General Hospital |
| Genetic reagent | nhr-14 RNAi (T01B10) | Kamath et al., 2003; PMID: 12828945 | Ahringer RNAi feeding library | |
| Genetic reagent | pqm-1 RNAi (F40F8.7) | Kamath et al., 2003; PMID: 12828945 | Ahringer RNAi feeding library | |
| Antibody | Monoclonal anti-FLAG M2 antibody | Sigma Aldrich | Cat# F3165; RRID: AB_259529 | |
| Antibody | Monoclonal anti β-tubulin antibody | MP Biomedicals LLC | Cat# 08691261; RRID: AB_2335131 | |
| Sequence-based reagent - TaqMan Assay | smf-3 | Thermofisher Scientific | Ce02461546_g1 | |
| Sequence-based reagent - TaqMan Assay | spp-18 | Thermofisher Scientific | Ce02457997_g1 | |
| Sequence-based reagent - TaqMan Assay | nhr-14 | Thermofisher Scientific | Ce02420450_g1 | |
| Sequence-based reagent - TaqMan Assay | act-2 | Thermofisher Scientific | Ce02507510_s1 | |
| Sequence-based reagent - TaqMan Assay | dod-19 | Thermofisher Scientific | Ce02470201_m1 | |
| Sequence-based reagent - TaqMan Assay | dod-24 | Thermofisher Scientific | Ce02466435_g1 | |
| Sequence-based reagent - TaqMan Assay | lys-2 | Thermofisher Scientific | Ce02480494_g1 | |
| Sequence-based reagent - TaqMan Assay | lys-7 | Thermofisher Scientific | Ce02473444_g1 | |
| Sequence-based reagent - TaqMan Assay | clec-41 | Thermofisher Scientific | Ce02483609_g1 | |
| Sequence-based reagent - TaqMan Assay | gst-38 | Thermofisher Scientific | Ce02486571_g1 | |
| Sequence-based reagent - TaqMan Assay | ftn-1 | Thermofisher Scientific | Ce02477612_g1 | |
| Sequence-based reagent - TaqMan Assay | ftn-2 | Thermofisher Scientific | Ce02415799_g1 | |
| Sequence-based reagent - TaqMan Assay | smf-1 | Thermofisher Scientific | Ce02496641_g1 | |
| Sequence-based reagent - TaqMan Assay | smf-2 | Thermofisher Scientific | Ce02496629_g1 | |
| Sequence-based reagent - TaqMan Assay | nhr-23 | Thermofisher Scientific | Ce02405513_g1 | |
| Sequence-based reagent - TaqMan Assay | pqm-1 | Thermofisher Scientific | Ce02438957_g1 | |
| Sequence-based reagent - TaqMan Assay | tba-1 | Thermofisher Scientific | Ce02412618_gH | |
| Sequence-based reagent - TaqMan Assay | ins-7 | Thermofisher Scientific | Ce02458078_g1 | |
| Sequence-based reagent - TaqMan Assay | dod-23 | Thermofisher Scientific | Ce02435949_g1 | |
| Sequence-based reagent - TaqMan Assay | oac-14 | Thermofisher Scientific | Ce02499634_g1 | |
| Recombinant DNA | L440 plasmid | Addgene | Plasmid # 1654; https://www.addgene.org/1654/ RRID: Addgene_1654 | |
| Recombinant DNA | NHR-14::3xFLAG::GFP transgene fosmid | Sarov et al., 2006;PMID: 22901814, TransgeneOME | WBGene0000361 | |
| Chemical compound, drug | 2,2′-Bipyridyl | Sigma Aldrich | Cat# D216305 | |
| Chemical compound, drug | Ferric Ammonium Citrate | Sigma Aldrich | Cat# RES20400-A7 | |
| Chemical compound, drug | 5-fluoro-2-deoxyuridine (FUdR) | Sigma Aldrich | Cat# F0503 | |
| Chemical compound, drug | Coomassie Plus Protein Assay Reagent | Thermofisher Scientific | Cat# 23236 | |
| Chemical compound, drug | Isopropyl β-D-1-thiogalactopyranoside (IPTG) | Thermofisher Scientific | Cat# 15529019 | |
| Chemical compound, drug | TRIzol Reagent | Invitrogen | Cat# 15596018 | |
| Software, algorithm | Prism 6 and 7.04 | Graphpad | https://www.graphpad.com/ RRID: SCR_002798 | |
| Software, algorithm | Image J | National Institute of Health | https://imagej.nih.gov/ij/ | |
| Software, algorithm | Excel 2013 | Microsoft Professional 2013 Spreadsheet Software | https://products.office.com/en-us/excel | |
| Software, algorithm | BioProspector | Liu et al., 2001 | http://ai.stanford.edu/~xsliu/BioProspector/ | |
| Software, algorithm | DAVID Bioinformatics Resources 6.8 | Huang et al., 2009; PMID: 19131956 | https://david.ncifcrf.gov/home.jsp | |
| Commercial assay or kit | Western Lighting Plus-ECL Chemiluminescence | Perkin Elmer | Cat# WP20005 | |
| Commercial assay or kit | qScript XLT cDNA SuperMix | QuantaBio | Cat# 95161–025 | |
| Commercial assay or kit | SuperScript III First-Strand Synthesis SuperMix | Invitrogen | Cat# 18080400 | |
| Commercial assay or kit | Pierce Coomassie Plus (Bradford) Assay Reagent | Thermofisher Scientific | Cat# 23238 | |
| Commerical assay or kit | Pierce BCA Protein Assay | Thermofisher Scientific | Cat# 23227 |
Additional files
-
Supplementary file 1
Table S1.
C. elegans strains used in this study. This table lists worm strains generated in this study as well as previously referenced strains.
- https://doi.org/10.7554/eLife.44674.023
-
Transparent reporting form
- https://doi.org/10.7554/eLife.44674.024
Download links
A two-part list of links to download the article, or parts of the article, in various formats.
Downloads (link to download the article as PDF)
Open citations (links to open the citations from this article in various online reference manager services)
Cite this article (links to download the citations from this article in formats compatible with various reference manager tools)
NHR-14 loss of function couples intestinal iron uptake with innate immunity in C. elegans through PQM-1 signaling
eLife 8:e44674.
https://doi.org/10.7554/eLife.44674


