Reciprocal action of Casein Kinase Iε on core planar polarity proteins regulates clustering and asymmetric localisation
- University of Sheffield, United Kingdom
Figures
Figure 1
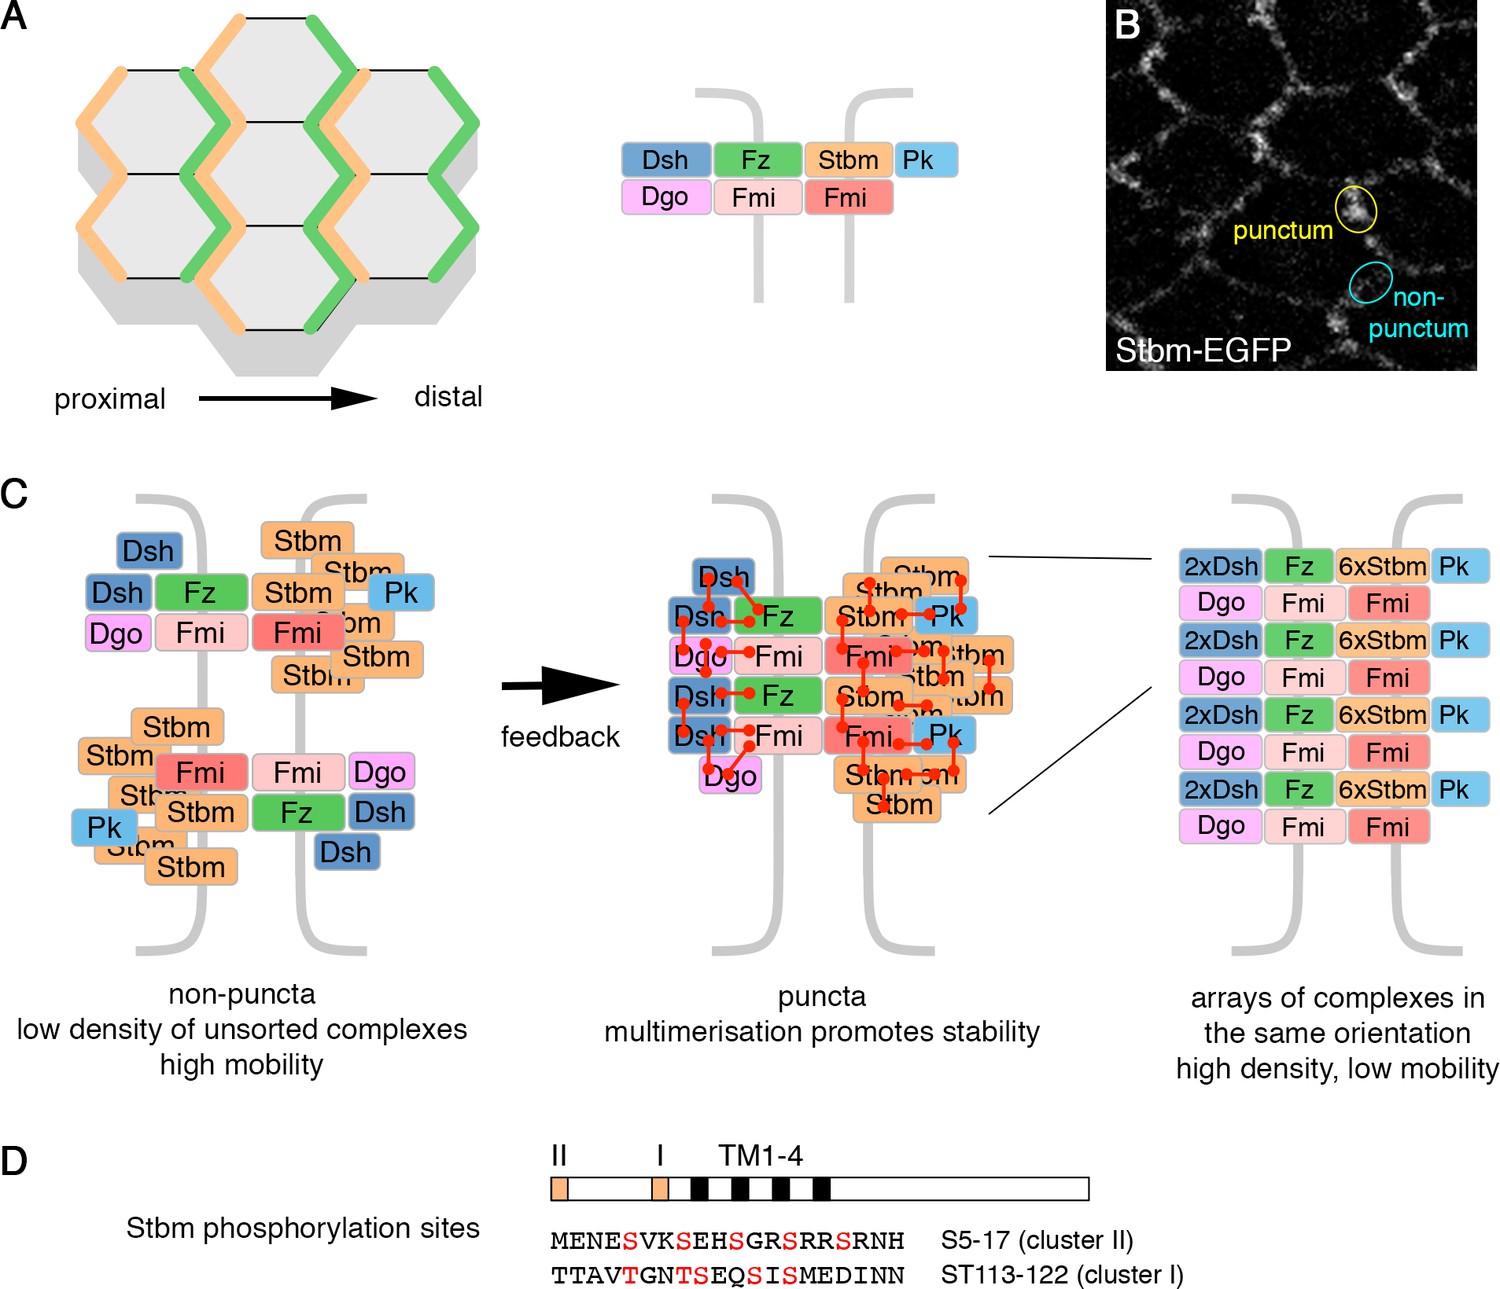
Planar polarity and the cloud model of core protein localisation.
(A) Core polarity proteins localise to proximal or distal edges of pupal wing cells (left), where they form intercellular complexes (right). (B) Live image of a 28 hr APF pupal wing expressing Stbm-EGFP. Asymmetrically localised core proteins cluster into membrane subdomains (puncta, yellow circle). The cyan circle indicates a non-puncta domain on the proximal-distal cell edges. (C) Diagram illustrating the possible organisation of the core polarity proteins. In non-puncta junctional regions, complexes associate at low density, in both orientations, and have relatively high mobility (left). Feedback interactions between the core proteins leads to complex sorting and complexes align in the same orientation. This promotes higher order multimerisation (red connectors) and reduced mobility (middle and right). (D) Diagram illustrating the position of the conserved phosphorylation site clusters (orange boxes) in the Stbm protein. The positions of the four transmembrane domains (black boxes, TM1-4) are also shown.
Figure 2 with 2 supplements
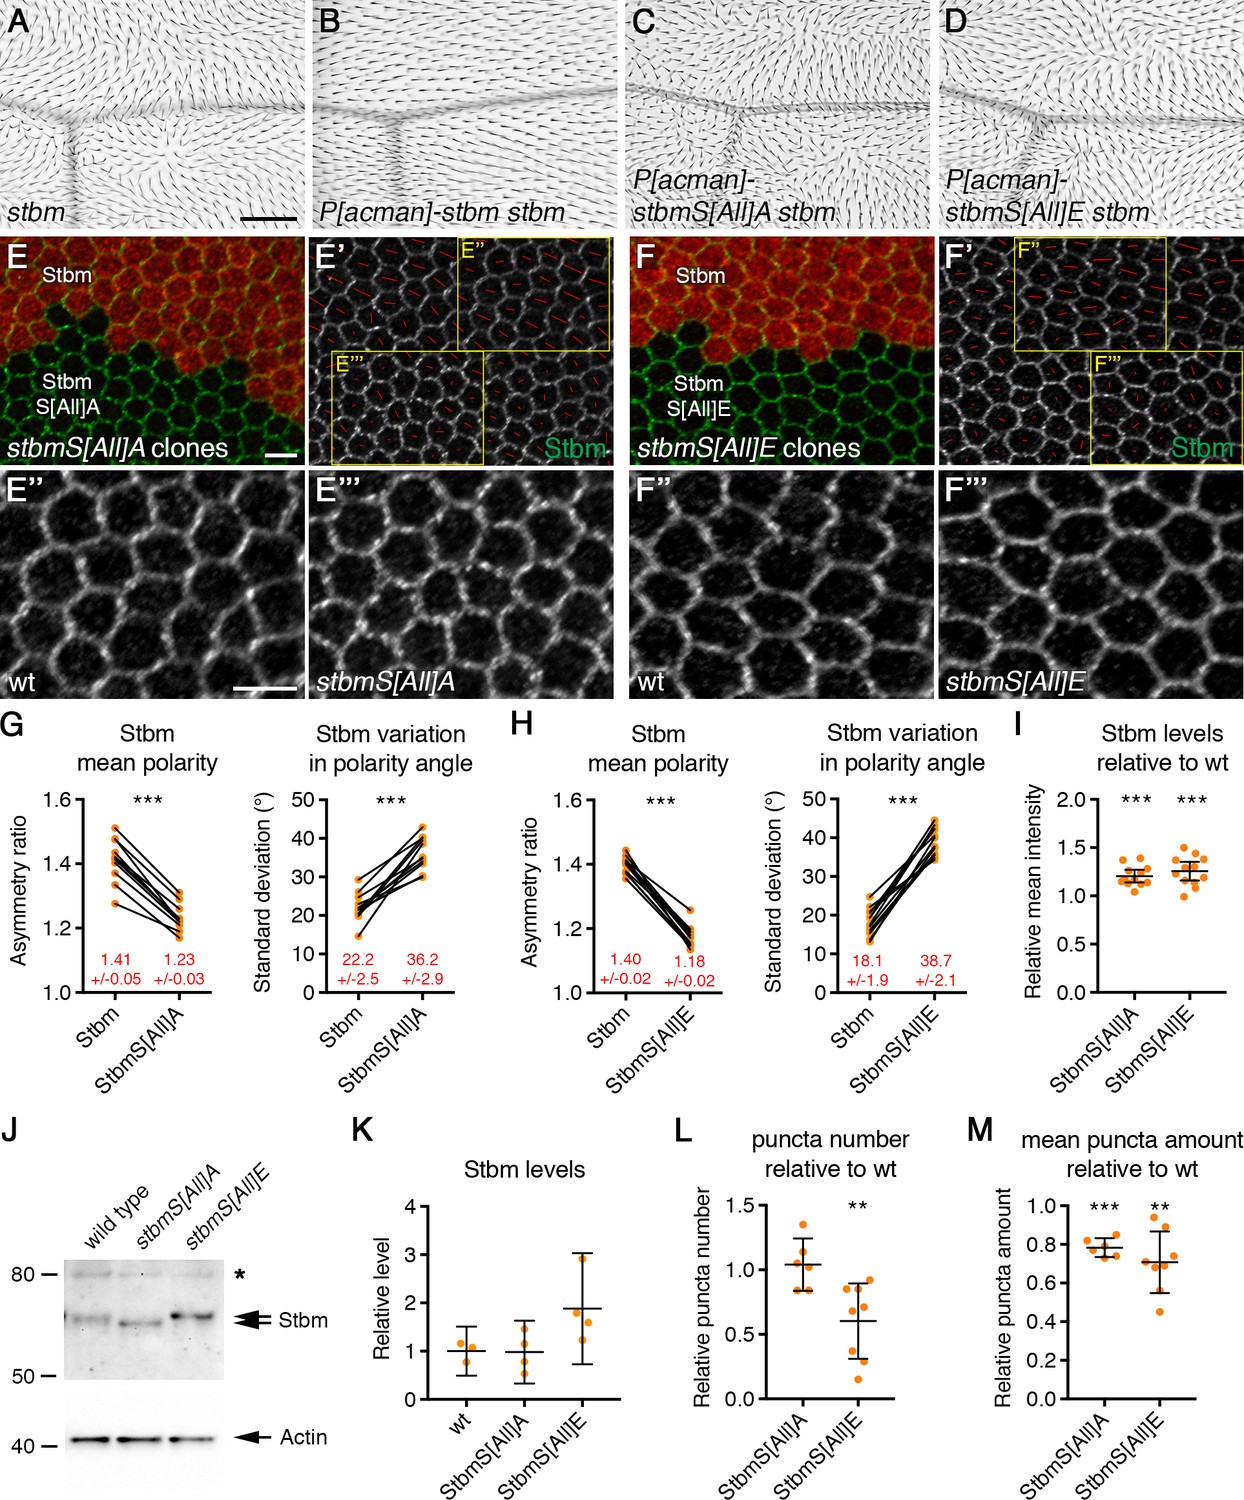
Disrupted trichome orientation in Stbm phosphomutants and phosphomimetics.
(A–D) Adult wings from stbm6 mutant flies (A), P[acman]-stbm stbm6 flies (B), P[acman]-stbmS[All]A stbm6 flies (C), or P[acman]-stbmS[All]E stbm6 flies (D). Scale bar 100 µm. (E,F) 28 hr APF pupal wings, carrying twin clones of P[acman]-stbm stbm6, marked by β-gal immunolabelling (red), next to P[acman]-stbmS[All]A stbm6 (E) or P[acman]-stbmS[All]E stbm6 (F). Wings immunolabelled for Stbm in green. (E',F') Stbm immunolabelling overlaid with polarity nematics (red lines), where the length of line indicates mean cell polarity and the orientation indicates direction of polarity. Yellow boxes indicate zoomed regions shown in E'' and F'' (wild-type regions) or E''' and F''' (mutant regions). Scale bar 5 µm. (G,H) Quantitation of mean polarity and variation in polarity angle, of 28 hr APF pupal wings immunolabelled for Stbm in twin clones of P[acman]-stbm stbm6 and P[acman]-stbmS[All]A stbm6 (G, n = 11) or P[acman]-stbmS[All]E stbm6 (H, n = 13). Values from the same wing are linked by black bars, mean and 95% confidence intervals are listed. Paired t-tests were used to compare values in the same wings, ***p≤0.001. (I) Quantitation of mean intensity of Stbm immunolabelling at junctions of 28 hr APF pupal wings, shown as a ratio of signal in P[acman]-stbmS[All]A stbm6 (n = 12) or P[acman]-stbmS[All]E stbm6 (n = 12) compared to P[acman]-stbm stbm6 (wt) in each wing. Error bars are 95% confidence intervals. One-sample t-tests were used to determine if the ratio differed from 1.0, ***p≤0.001. (J) Western blot probed with Stbm antibody, of extracts from 28 hr APF pupal wings from wild-type, P[acman]-stbmS[All]A stbm6 or P[acman]-stbmS[All]E stbm6 flies. The asterisk indicates a non-specific band. Actin was used as a loading control. (K) Quantitation of Stbm levels from western blots, from wild-type (n = 3), P[acman]-stbmS[All]A stbm6 (n = 4) or P[acman]-stbmS[All]E stbm6 (n = 4) pupal wings. Error bars are 95% confidence intervals. Levels were compared to wild-type by ANOVA with Dunnett’s multiple comparisons test, no significant differences were seen. (L,M) Quantitation of puncta number (L) and mean puncta amount (M), from 28 hr APF pupal wings immunolabelled for Stbm, shown as a ratio of signal in P[acman]-stbmS[All]A stbm6 (n = 6) or P[acman]-stbmS[All]E stbm6 (n = 8) compared to P[acman]-stbm stbm6 (wt) in each wing. Puncta were detected using Fmi immunolabelling. Error bars are 95% confidence intervals. One-sample t-tests were used to determine if the ratio differed from 1.0, **≤0.01, ***p≤0.001.
-
Figure 2—source data 1
Quantification of Stbm levels, asymmetry and puncta size in Stbm phosphomutant and phosphomimetic wings.
- https://doi.org/10.7554/eLife.45107.006
Figure 2—figure supplement 1
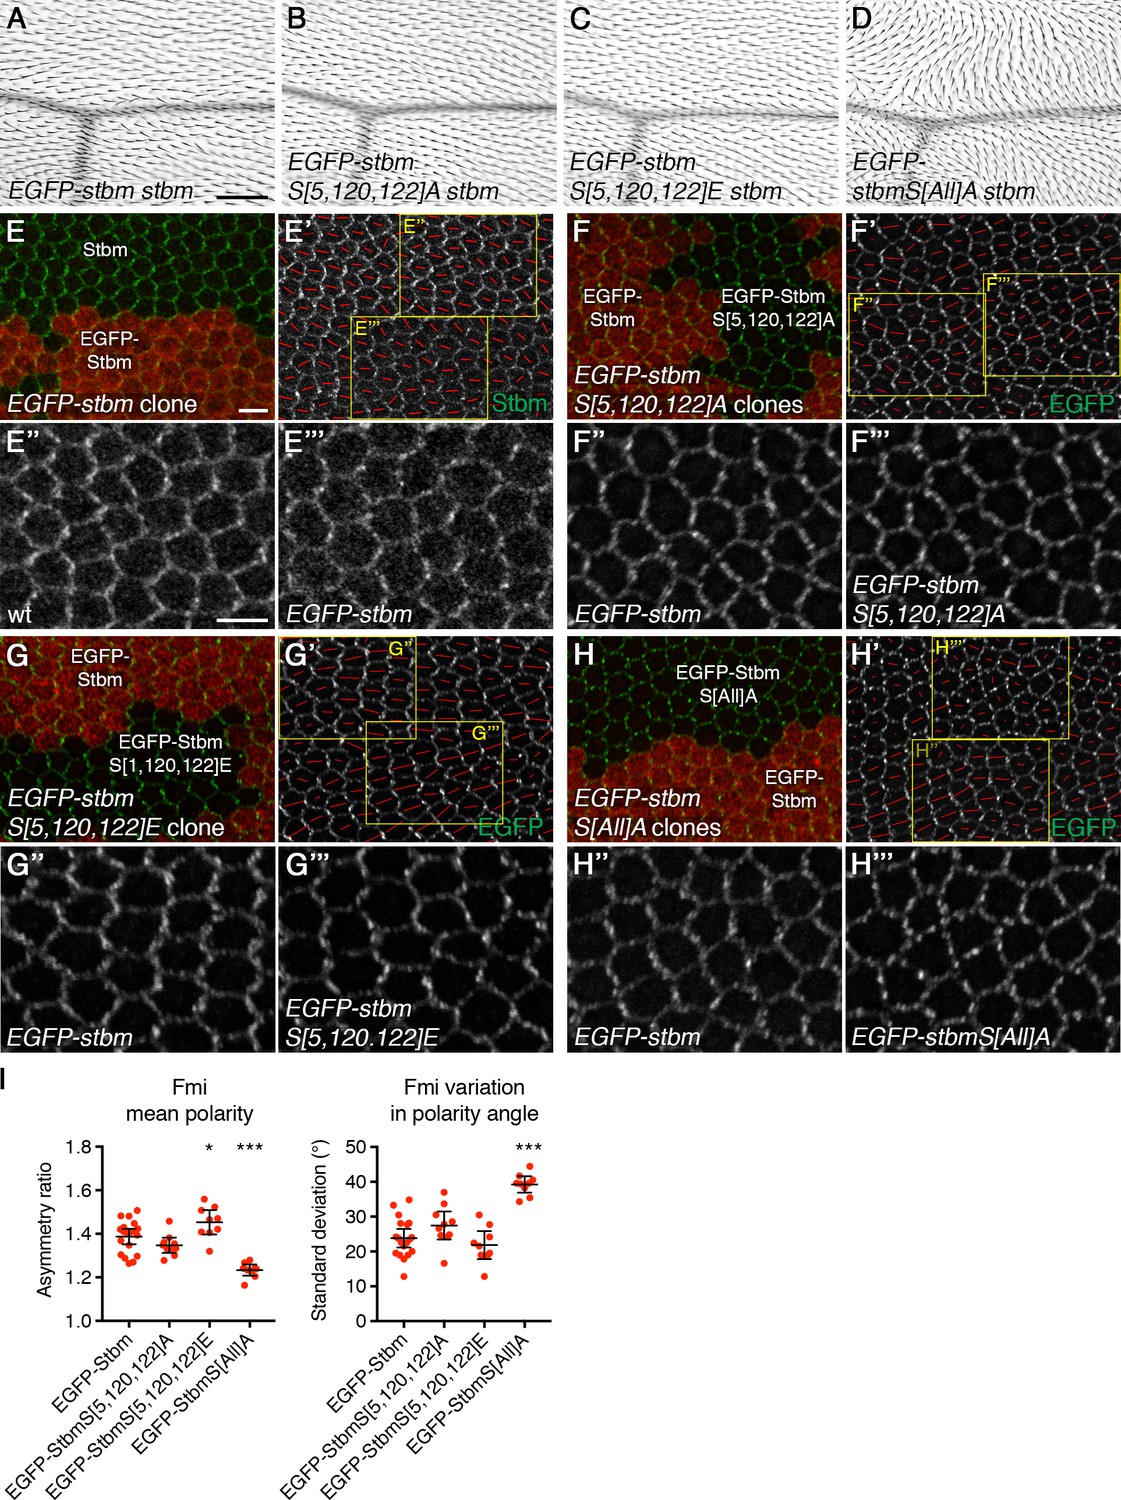
Putative founder site mutants do not disrupt core protein asymmetry.
(A–D) Adult wings from P[acman]-EGFP-stbm stbm6 flies (A), P[acman]-EGFP-stbmS[5,120,122]A stbm6 flies (B), P[acman]-EGFP-stbmS[5,120,122]E stbm6 flies (C) or P[acman]-EGFP-stbmS[All]A stbm6 flies (D). Trichome orientation is normal in P[acman]-EGFP-stbm stbm6 flies (A), or flies carrying founder site mutants (B,C). However, trichome orientation is disrupted if all sites in clusters I and II are mutated to alanine (D). Scale bar 100 µm. (E–H) 28 hr APF pupal wings, carrying twin clones of P[acman]-EGFP-stbm stbm6, marked by β-gal immunolabelling (red), next to P[acman]-stbm stbm6 (E), P[acman]-EGFP-stbmS[S,120,122]A stbm6 (F), P[acman]-EGFP-stbmS[S,120,122]E stbm6 (G) or P[acman]-EGFP-stbmS[All]A stbm6 (H). Wings immunolabelled for Stbm (E) or with EGFP fluorescence (F–H) in green. (E'–H') Stbm immunolabelling (E') or EGFP fluorescence (F'-H') overlaid with polarity nematics (red lines), where the length of line indicates mean cell polarity and the orientation indicates direction of polarity. Yellow boxes indicate zoomed regions shown in (E''-H'') (wild-type regions) or (E'''-H''') (mutant regions). Scale bar 5 µm. Note that tagging Stbm at the N-terminus with EGFP led to a decrease in Stbm levels at junctions; however, core protein asymmetry was normal. EGFP-tagged Stbm proteins did not exhibit a band shift in SDS-PAGE, so phosphorylation status could not be determined directly. (I) Quantitation of mean polarity and variation in polarity angle, of 28 hr APF pupal wings immunolabelled for Fmi from P[acman]-EGFP-stbm stbm6 (n = 19), P[acman]-EGFP-stbmS[5,120,122]A stbm6 (n = 10), P[acman]-EGFP-stbmS[5,120,122]E stbm6 (n = 9) or P[acman]-EGFP-stbmS[All]A stbm6 (n = 9). Error bars are 95% confidence intervals. ANOVA with Dunnett’s multiple comparisons test was used to compare values to the EGFP-Stbm control, p≤0.05*, ***p≤0.001. Core protein asymmetry is normal in flies expressing P[acman]-EGFP-stbm stbm6, or in flies carrying founder site mutants, but is severely reduced in flies carrying P[acman]-EGFP-stbmS[All]A stbm6.
Figure 2—figure supplement 2
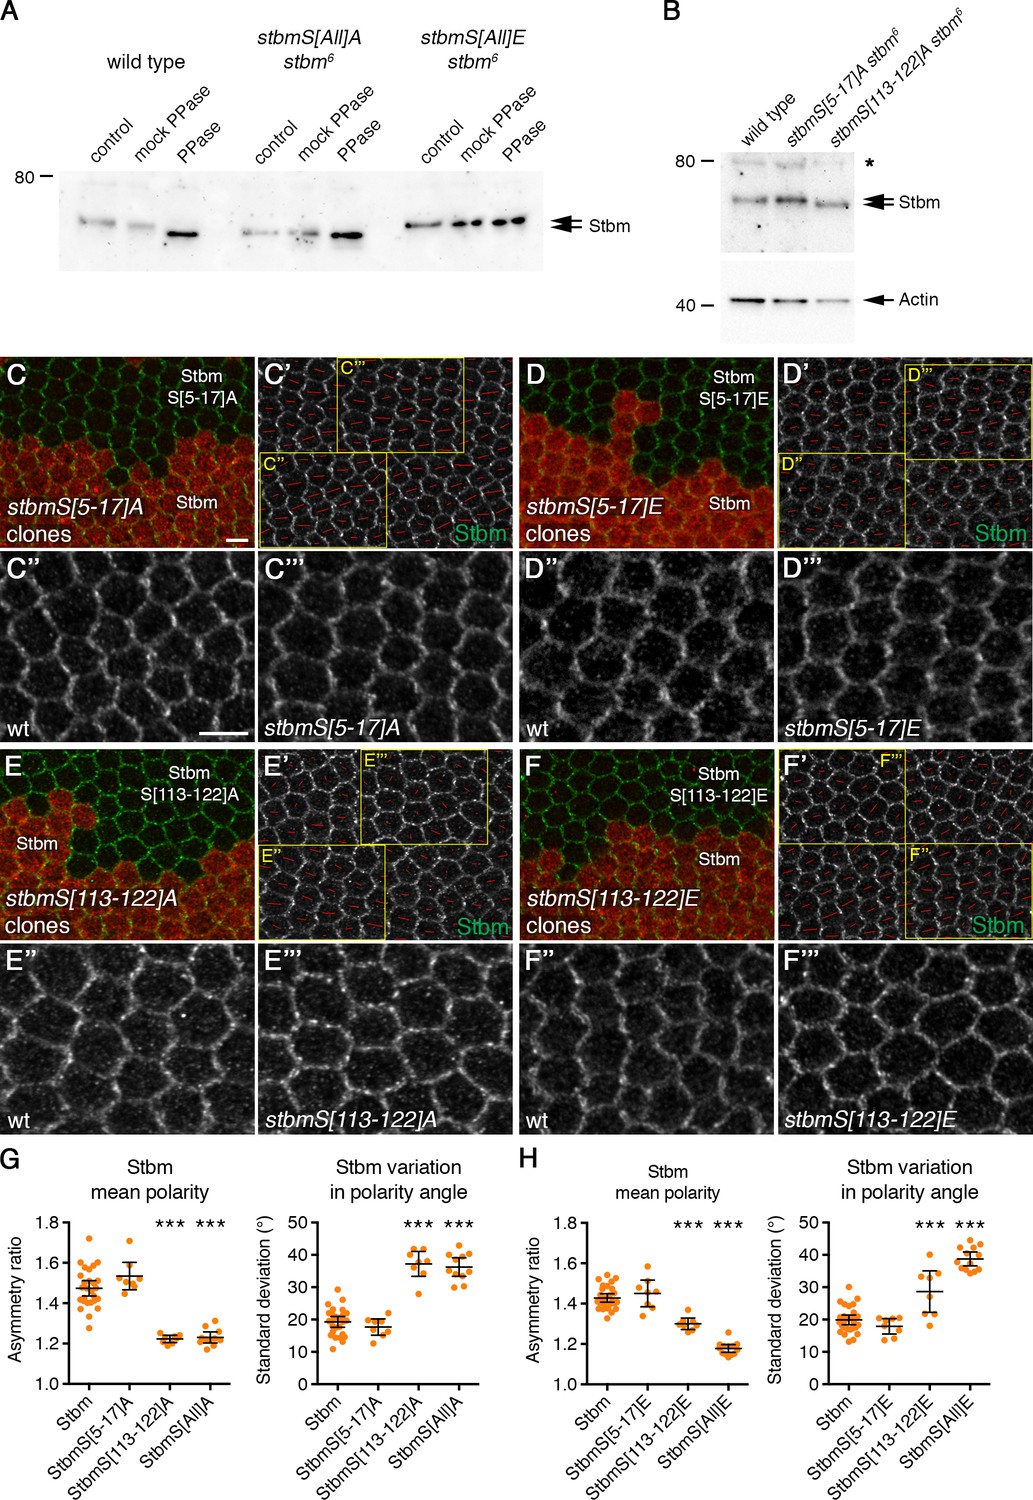
Dissection of Stbm phosphorylation site clusters.
(A) Western blot probed with Stbm antibody, of extracts from 6 hr APF pupal wings from wild-type, P[acman]-stbmS[All]A stbm6 or P[acman]-stbmS[All]E stbm6 flies. Extracts were dissected directly into sample buffer (control) or into lysis buffer (mock PPase) or into lysis buffer and then phosphatase treated. Note that the Actin loading control was not visible after phosphatase treatment. (B) Western blot probed with Stbm antibody, of extracts from 28 hr APF pupal wings from wild-type, P[acman]-stbmS[5-17]A stbm6 or P[acman]-stbmS[113-122]A stbm6 flies. The asterisk indicates a non-specific band. Actin was used as a loading control. Mutation of cluster II to alanine (S5-17A) did not affect Stbm mobility on SDS PAGE compared to wild-type Stbm; while mutation of cluster I (S113-122A) increased Stbm mobility. (C–F) 28 hr APF pupal wings carrying twin clones of P[acman]-stbm stbm6, marked by β-gal immunolabelling (red), next to P[acman]-stbmS[5-17]A stbm6 (C), P[acman]-stbmS[5-17]E stbm6 (D), P[acman]-stbmS[113-122]A stbm6 (E), or P[acman]-stbmS[113-122]E stbm6 (F). Wings immunolabelled for Stbm in green. (C'–F') Stbm immunolabelling overlaid with polarity nematics (red lines), where the length of line indicates mean cell polarity and the orientation indicates direction of polarity. Yellow boxes indicate zoomed regions shown in C''-F'' (wild-type regions) or C'''-F''' (mutant regions). Scale bar 5 µm. (G,H) Quantitation of mean polarity and variation in polarity angle, of 28 hr APF pupal wings immunolabelled for Stbm. (G) P[acman]-stbm stbm6 (n = 27), P[acman]-stbmS[5-17]A stbm6 (n = 8), P[acman]-stbmS[113-122]A stbm6 (n = 8) or P[acman]-stbmS[All]A stbm6 (n = 11). (H) P[acman]-stbm stbm6 (n = 29), P[acman]-stbmS[5-17]E stbm6 (n = 8), P[acman]-stbmS[113-122]E stbm6 (n = 8) or P[acman]-stbmS[All]E stbm6 (n = 13). Error bars are 95% confidence intervals. ANOVA with Dunnett’s multiple comparisons test was used to compare values to the P[acman]-stbm control, ***p≤0.001. Mutation of all cluster II residues (S5-17) to either alanine or glutamic acid had no effect on core protein asymmetry. This suggests that the phosphorylation sites within cluster I are sufficient for correct core protein asymmetry. Mutation of all serine/threonine resides in cluster I to alanine (S113-122A) resulted in a loss of asymmetry similar to that of mutation of both clusters I and II, together. However, mutation of cluster I residues to glutamic acid gave a less severe phenotype than mutation of both clusters, suggesting that under some circumstances cluster II can partially substitute for cluster I.
Figure 3 with 1 supplement
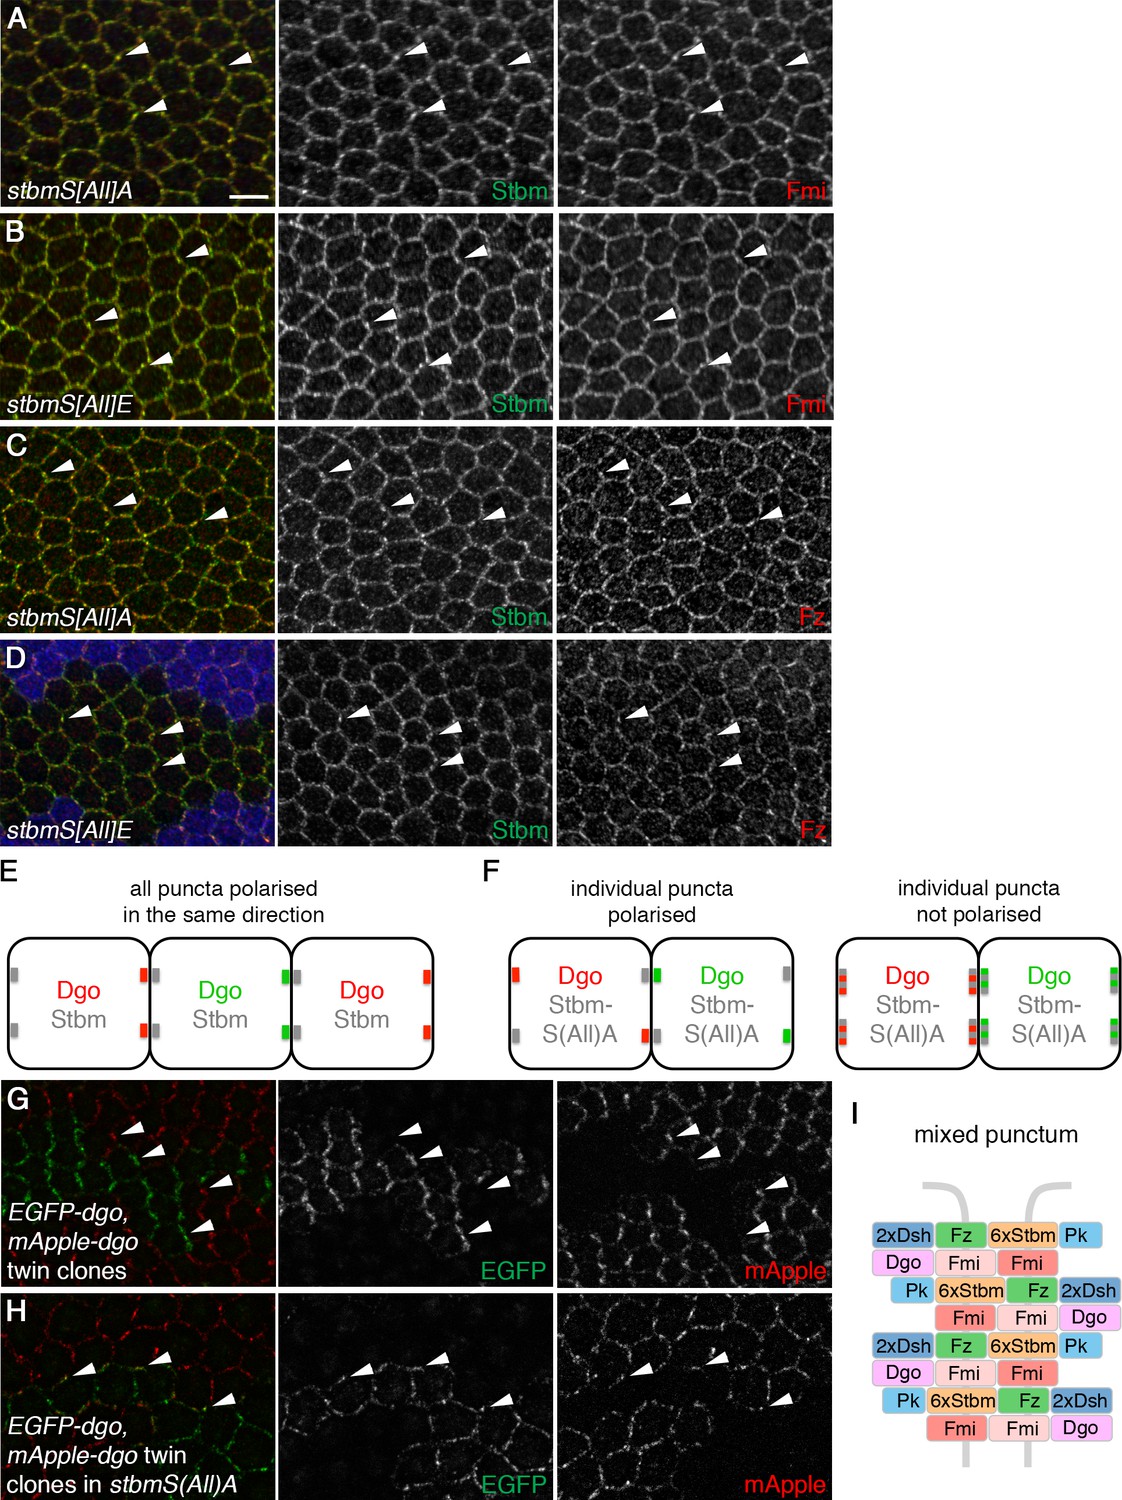
Stbm phosphomutants form ‘mixed’ puncta.
(A–D) 28 hr APF pupal wings expressing P[acman]-stbmS[All]A stbm6 (A,C) or P[acman]-stbmS[All]E stbm6 (B,D). Blue immunolabelled tissue in (D) is wild-type. Wings immunolabelled for Stbm in green and Fmi (A,B) or Fz (C,D) in red. Arrowheads point to examples of puncta in which Stbm and Fmi or Fz co-localise. Scale bar 5 µm. (E,F) Schematic of twin clone experiment. Groups of cells express either EGFP-Dgo (green) or mApple-Dgo (red), and puncta are examined at the boundaries between them. (E) In wild-type wings, Dgo localises to distal cell ends, so puncta on distal clone boundaries contain either only EGFP-Dgo or only mApple-Dgo. (F) In phosphomutant wings, Dgo is not asymmetrically localised. If individual puncta are polarised (left), puncta on clones boundaries will contain either EGFP-Dgo or mApple-Dgo, regardless of whether the boundary is proximal or distal. If individual puncta are not polarised (right), puncta will contain both EGFP-Dgo and mApple-Dgo. (G,H) 28 hr APF pupal wings carrying twin clones of P[acman]-EGFP-dgo dgo380 next to P[acman]-mApple-dgo dgo380, in a wild-type (G) or a P[acman]-stbmS[All]A stbm6 mutant background (H). EGFP fluorescence is in green and mApple fluorescence is in red. White arrowheads indicate specific puncta on clone boundaries. Puncta are labelled with either green or red Dgo in wild-type, but in stbmS[All]A tissue, puncta on clone boundaries appear yellow, as they contain both green and red Dgo. (I) Schematic of ‘mixed’ punctum, containing core protein complexes in both orientations (compare to Figure 1C, right).
-
Figure 3—source data 1
Quantification of core protein levels in Stbm phosphomutant and phosphomimetic wings.
- https://doi.org/10.7554/eLife.45107.009
Figure 3—figure supplement 1
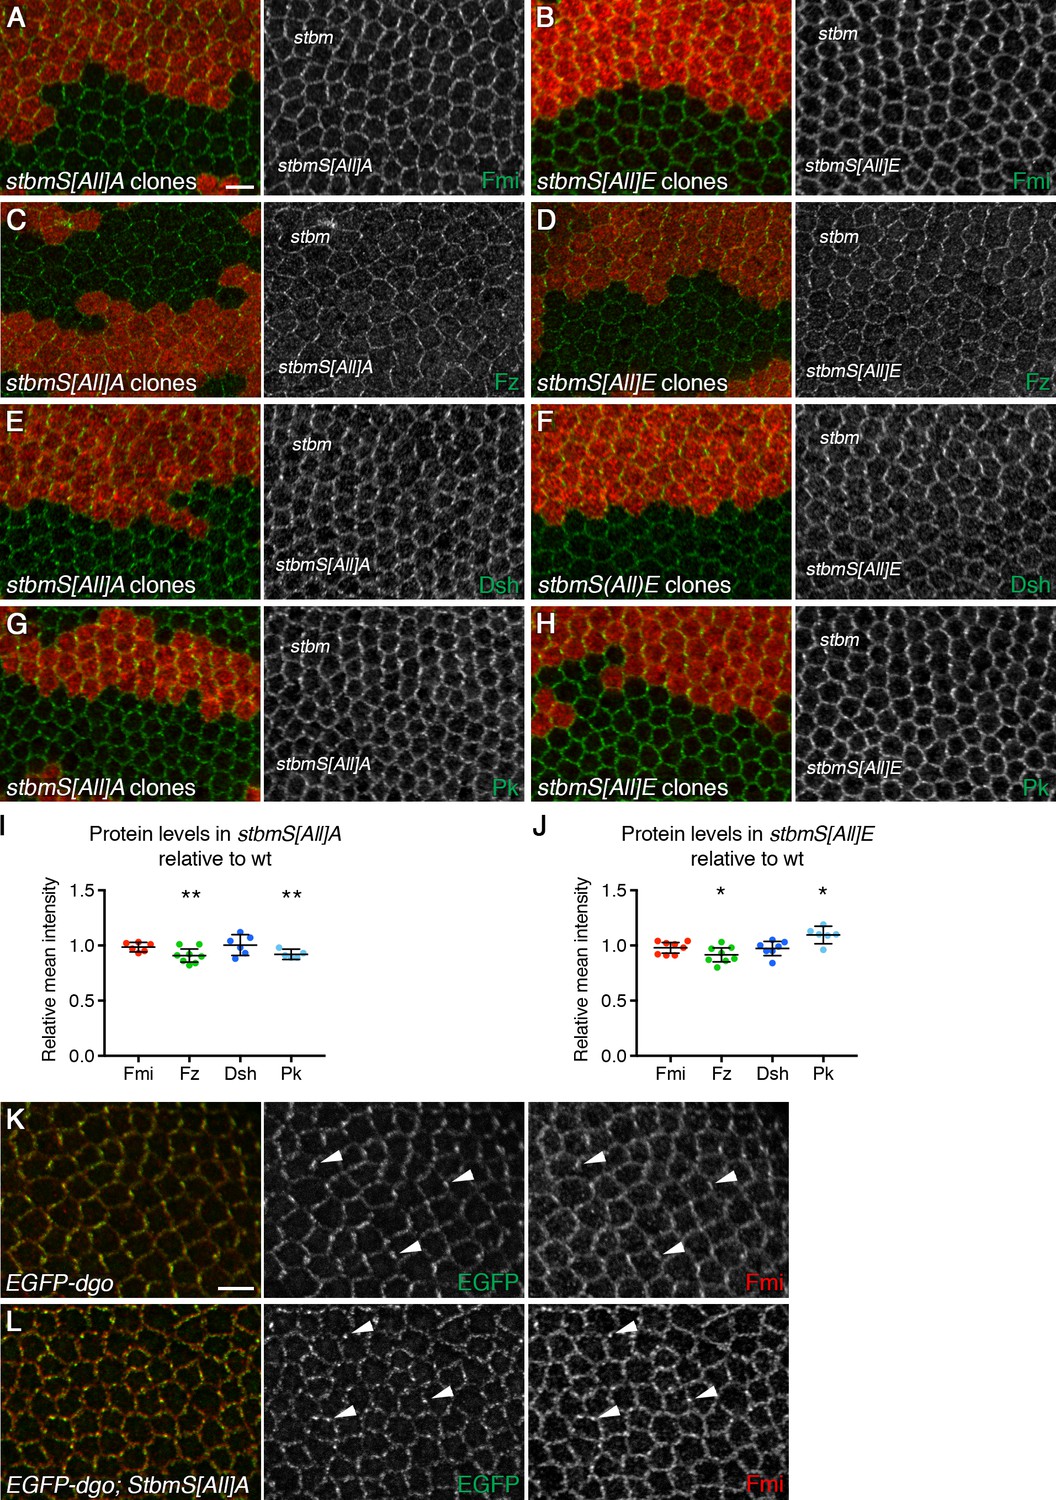
Core protein levels and localisation in Stbm phosphomutant and phosphomimetic wings.
(A–H) 28 hr APF pupal wings, carrying twin clones of P[acman]-stbm stbm6, marked by β-gal immunolabelling (red), next to P[acman]-stbmS[All]A stbm6 (A,C,E,G) or P[acman]-stbmS[All]E stbm6 (B,D,F,H). Wings immunolabelled for Fmi (A,B), Fz (C,D), Dsh (E,F) or Pk (G,H) in green. Scale bar 5 µm. (I,J) Quantitation of mean intensity of Fmi, Fz, Dsh or Pk immunolabelling at junctions of 28 hr APF pupal wings, shown as a ratio of signal in P[acman]-stbmS[All]A stbm6 (I, n = 6 (Fmi), n = 8 (Fz), n = 6 (Dsh), n = 5 (Pk)) or P[acman]-stbmS[All]E stbm6 (J, n = 8 (Fmi), n = 8 (Fz), n = 7 (Dsh), n = 6 (Pk)) compared to P[acman]-stbm stbm6 (wt) in each wing. Error bars are 95% confidence intervals. One-sample t-tests were used to determine if the ratio differed from 1.0, *p≤0.05, **p<0.01. Note that Pk levels are slightly lower in the phosphomutant than in wild-type, and slightly higher in the phosphomimetic. (K,L) 28 hr APF pupal wings, carrying P[acman]-EGFP-dgo in a wild-type (K) or P[acman]-stbmS[All]A stbm6 mutant background (L). EGFP fluorescence is in green and Fmi immunolabelling is in red. Arrowheads point to examples of puncta in which EGFP-Dgo and Fmi co-localise. Scale bar 5 µm.
Figure 4 with 2 supplements
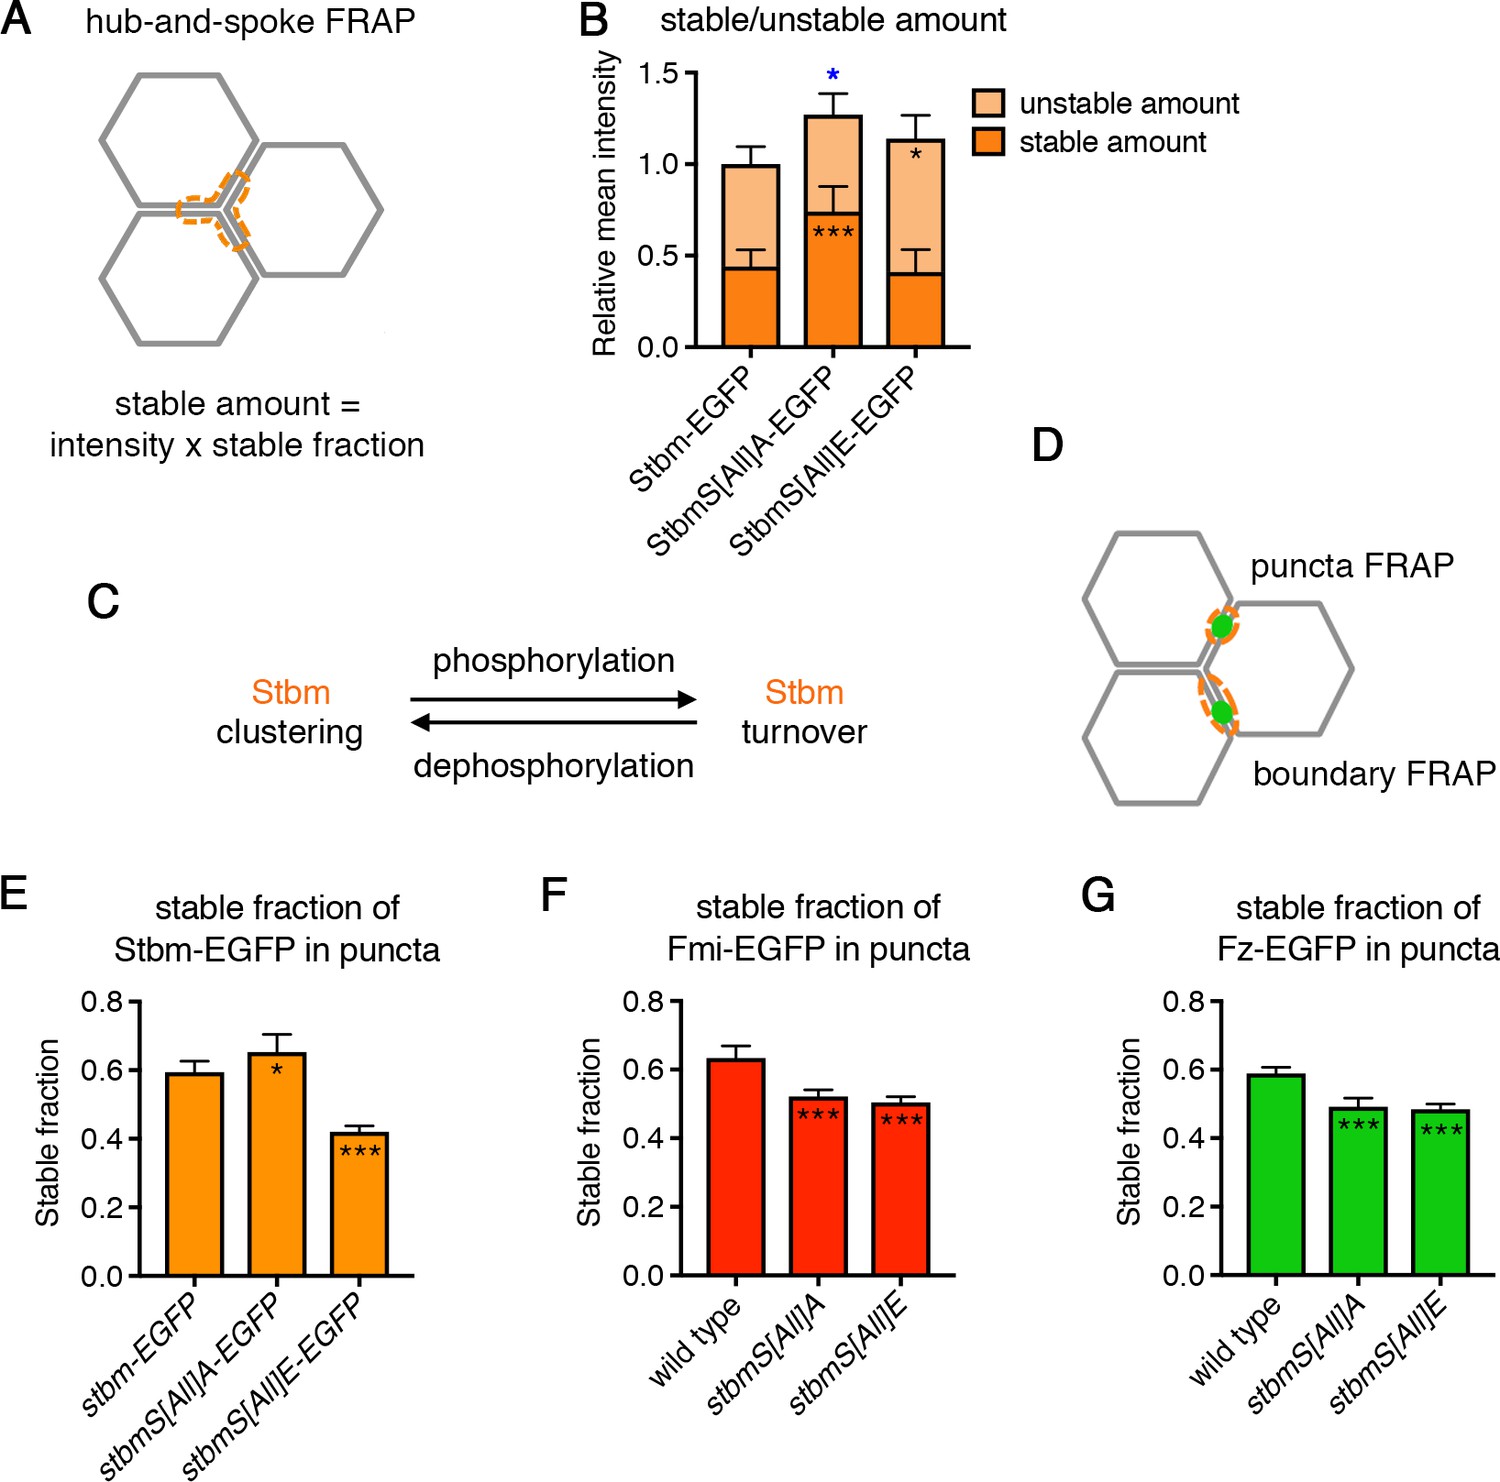
Stbm phosphomutants have increased stability at junctions.
(A) Schematic of hub-and-spoke FRAP. The orange dotted line shows the ‘hub-and-spoke’ region that is bleached, which corresponds to three cell vertices and the equivalent of three cell junctions. The stable fraction, as determined by FRAP, is multiplied by the total initial intensity within the bleached region to give a stable amount of protein at junctions for each wing. (B) Stable and unstable amounts of EGFP-tagged protein in 28 hr APF pupal wings after hub-and-spoke FRAP. Flies were P[acman]-stbm-EGFP stbm6/+ (n = 11), P[acman]-stbmS[All]A-EGFP stbm6/P[acman]-stbmS[All]A stbm6 (n = 9) and P[acman]-stbmS[All]E-EGFP stbm6/P[acman]-stbmS[All]E stbm6 (n = 11). Data are normalised to the total intensity in Stbm-EGFP. Error bars are 95% confidence intervals, and ANOVA with Dunnett’s multiple comparisons test was used to compare stable amounts (asterisks in dark orange columns), unstable amounts (asterisks in light orange columns) or total amounts (blue asterisks above the columns) to the Stbm-EGFP control, p≤0.05*, p≤0.001***. (C) Summary diagram showing the effect of phosphorylation and dephosphorylation on Stbm turnover. (D) Schematic of puncta FRAP and boundary FRAP. In puncta FRAP, an elliptical region surrounding a punctum is bleached (Figure 4E–G), whilst in boundary FRAP an entire junction on a clone boundary is bleached (Figure 6G). Note that as puncta of different genotypes are different sizes, stable fractions in puncta FRAP cannot be translated into stable amounts. (E–G) Stable fraction of EGFP-tagged protein in puncta in 28 hr APF pupal wings. (E) P[acman]-stbm-EGFP stbm6 (n = 6), P[acman]-stbmS[All]A-EGFP stbm6 (n = 7), P[acman]-stbmS[All]E-EGFP stbm6 (n = 9). (F) fmi-EGFP/+ (n = 9), P[acman]-stbmS[All]A stbm6/P[acman]/stbmS[All]A stbm6 fmi-EGFP (n = 10), P[acman]-stbmS[All]E stbm6/P[acman]/stbmS[All]E stbm6 fmi-EGFP (n = 10). (G) fz-EGFP/+ (n = 9), P[acman]-stbmS[All]A stbm6; fz-EGFP/+ (n = 8), P[acman]-stbmS[All]E stbm6; fz-EGFP/+ (n = 7). The fluorescence recovery was fitted to an exponential curve for each genotype, and the graph shows the stable fraction (1-Ymax) and the 95% confidence intervals. Stable fractions were compared to control (wild-type Stbm or Stbm-EGFP) using an extra sum of squares F test, p≤0.05*, p≤0.001***.
-
Figure 4—source data 1
Quantification of Stbm phosphomutant and phosphomimetic stability, and dominant negative effects.
- https://doi.org/10.7554/eLife.45107.013
Figure 4—figure supplement 1
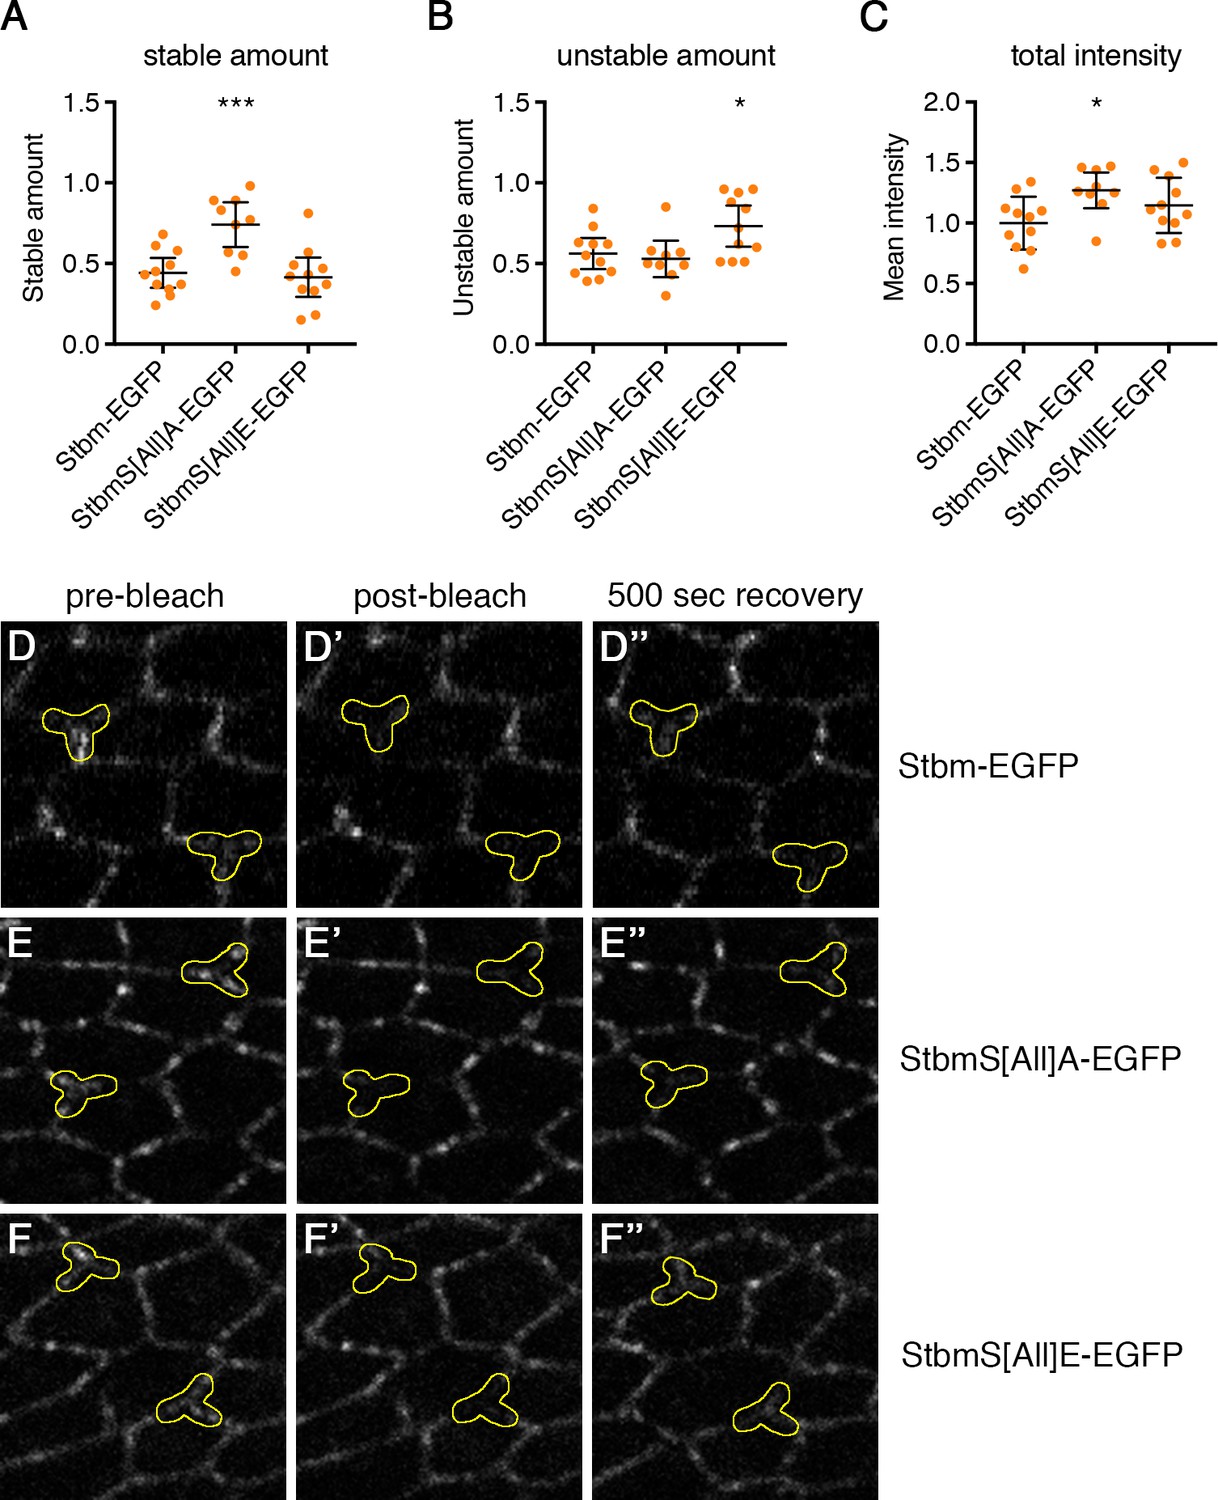
FRAP analysis of Stbm phosphomutant and phosphomimetic wings.
(A–C) Stable amounts (A), unstable amounts (B) and total amounts (C) of EGFP-tagged protein at junctions in 28 hr APF pupal wings after hub-and-spoke FRAP (see Figure 4B). Data are normalised to the total intensity in Stbm-EGFP. Error bars are 95% confidence intervals, and ANOVA with Dunnett’s multiple comparisons test was used to compare levels to the Stbm-EGFP control, p≤0.05*, p≤0.001***. (D–F) Example images from the FRAP experiment in Figure 4B, before bleaching (left), immediately after bleaching (middle) and after 500 s recovery (right). Bleached regions are outlined in yellow. StbmS[All]A-EGFP (E) recovers less than Stbm-EGFP (D), while more recovery is seen for StbmS[All]E-EGFP (F).
Figure 4—figure supplement 2
Dominant negative effects of Stbm phosphomutant and phosphomimetic.
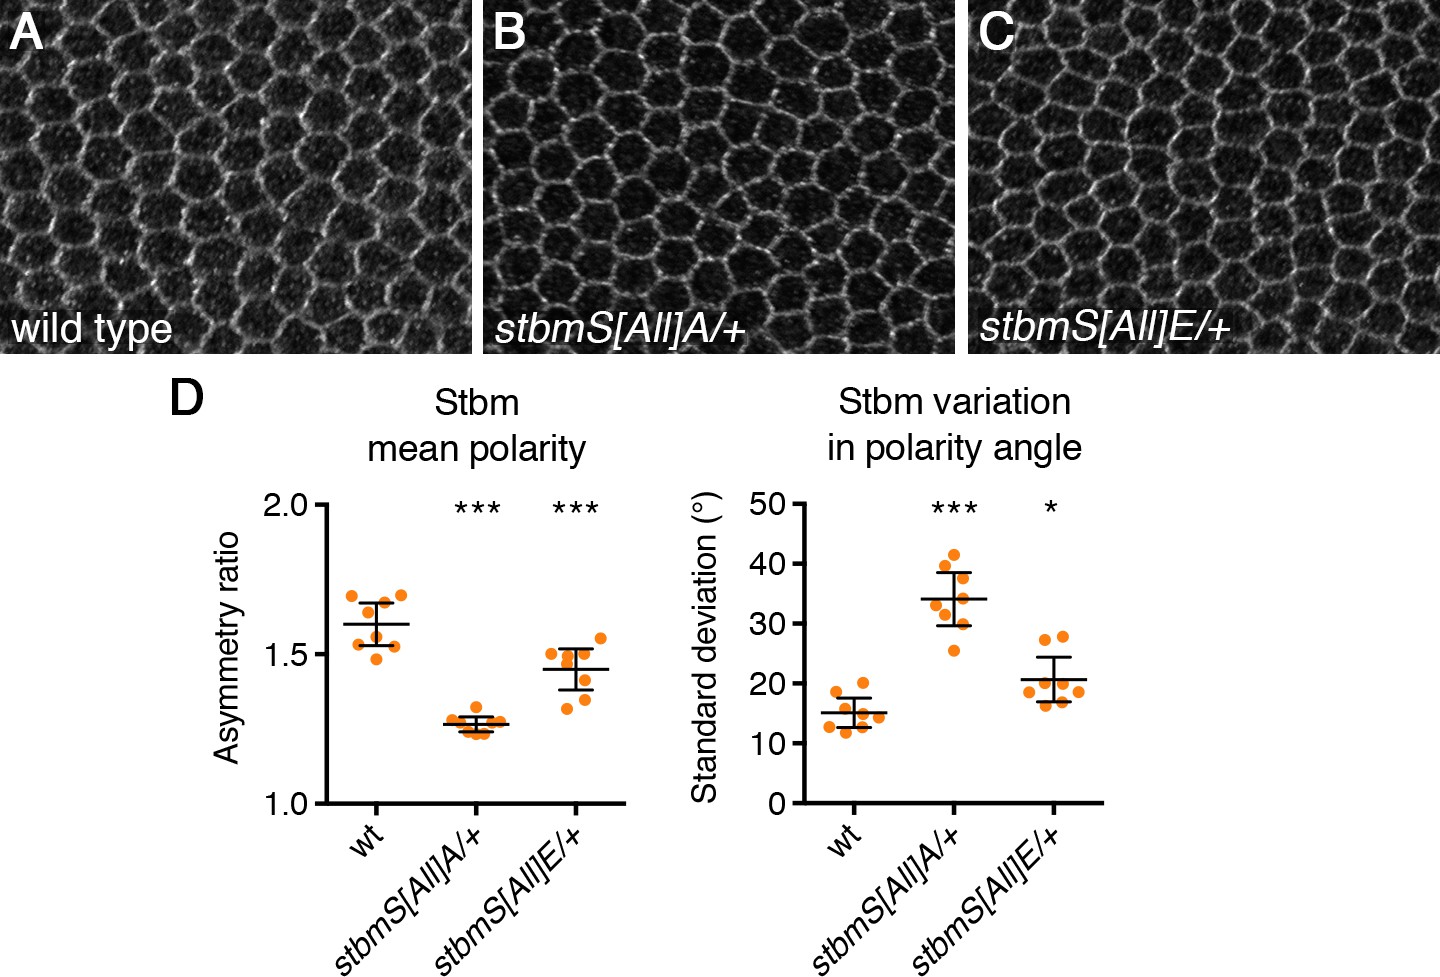
(A–C) 28 hr APF pupal wings from wild-type (A), P[acman]-stbmS[All]A stbm6/+ (B) or P[acman]-stbmS[All]E stbm6/+ (C), immunolabelled for Stbm. (D) Quantitation of mean polarity and variation in polarity angle, of 28 hr APF pupal wings immunolabelled for Stbm from wild-type (n = 8), P[acman]-stbmS[Al]]A stbm6/+ (n = 8) or P[acman]-stbmS[All]E stbm6/+ (n = 8). Error bars are 95% confidence intervals. ANOVA with Dunnett’s multiple comparisons test was used to compare values to the wild-type control, p≤0.05*, ***p≤0.001.
Figure 5 with 2 supplements
Regulation of Stbm phosphorylation and turnover by Dco.
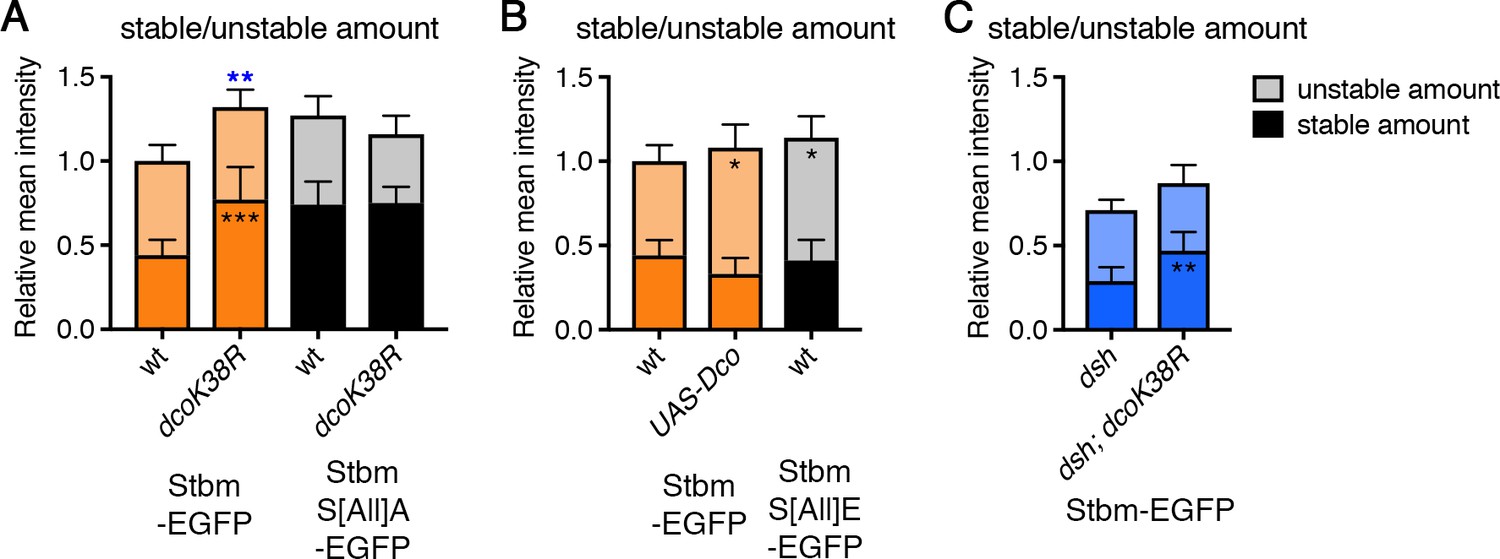
(A–C) Stable and unstable amounts of EGFP-tagged protein, in 28 hr APF pupal wings after hub-and-spoke FRAP. Flies were (A) P[acman]-stbm-EGFP stbm6/+ (n = 11), P[acman]-stbm-EGFP stbm6/en-GAL4; UAS-dcoK38R/+ (n = 11), P[acman]-stbmS[All]A-EGFP stbm6/P[acman]-stbmS[All]A stbm6 (n = 9) and P[acman]-stbmS[All]A-EGFP stbm6/P[acman]-stbmS[All]A stbm6 en-GAL4; UAS-dcoK38R/+ (n = 15); (B) P[acman]-stbm-EGFP stbm6/+ (n = 11), UAS-Dco/+; P[acman]-stbm-EGFP-stbm6/en-GAL4 (n = 11) and P[acman]-stbmS[All]E-EGFP stbm6/P[acman]-stbmS[All]E stbm6 (n = 11); (C) dsh1; P[acman]-stbm-EGFP stbm6/+ (n = 12) and dsh1; P[acman]-stbm-EGFP stbm6/en-GAL4; UAS-dcoK38R/+ (n = 10). Wings were imaged in the posterior compartment. Data are normalised to the total intensity in Stbm-EGFP and error bars are 95% confidence intervals. Stable amounts (asterisks in dark shaded columns), unstable amounts (asterisks in light shaded columns) or total amounts (blue asterisks above the columns) were compared between genotypes, using ANOVA with Holm-Sidak’s multiple comparisons test to compare pairs of samples with and without DcoK38R (A), ANOVA with Dunnett’s multiple comparisons test to compare with the Stbm-EGFP control (B) or an unpaired t-test (C). p≤0.05*, p≤0.01**, p≤0.001***.
-
Figure 5—source data 1
Quantification of Stbm stability in dco mutant wings.
- https://doi.org/10.7554/eLife.45107.017
Figure 5—figure supplement 1
Analysis of Stbm phosphorylation in dco mutant backgrounds.
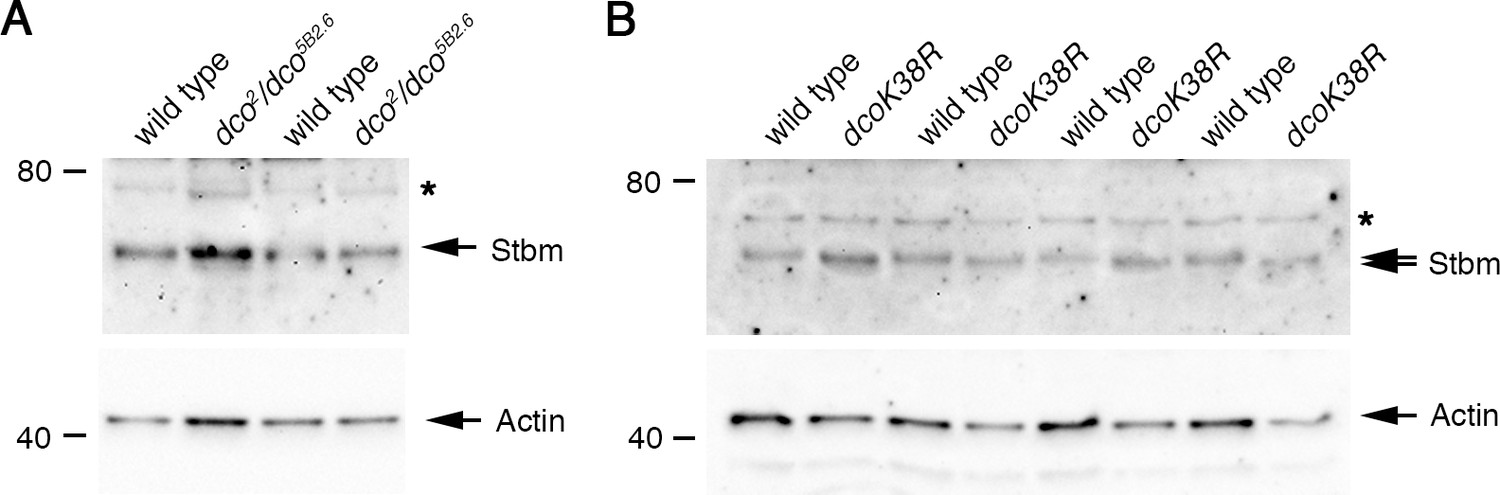
(A) Western blot probed with Stbm antibody, of extracts from 28 hr APF pupal wings of wild-type or dco2/dco5B2.6 flies. Two biological replicates are shown for each genotype. The asterisk indicates a non-specific band. Actin was used as a loading control. No change in Stbm migration is seen. (B) Western blot probed with Stbm antibody, of extracts from pupal wings of wild-type or Actin-GAL4, tub-GAL80ts, UAS-dcoK38R flies, raised at 29°C for 25 hr APF. Four biological replicates are shown for each genotype. The asterisk indicates a non-specific band. Actin was used as a loading control.
Figure 5—figure supplement 2
FRAP analysis of Stbm in dco mutant backgrounds.
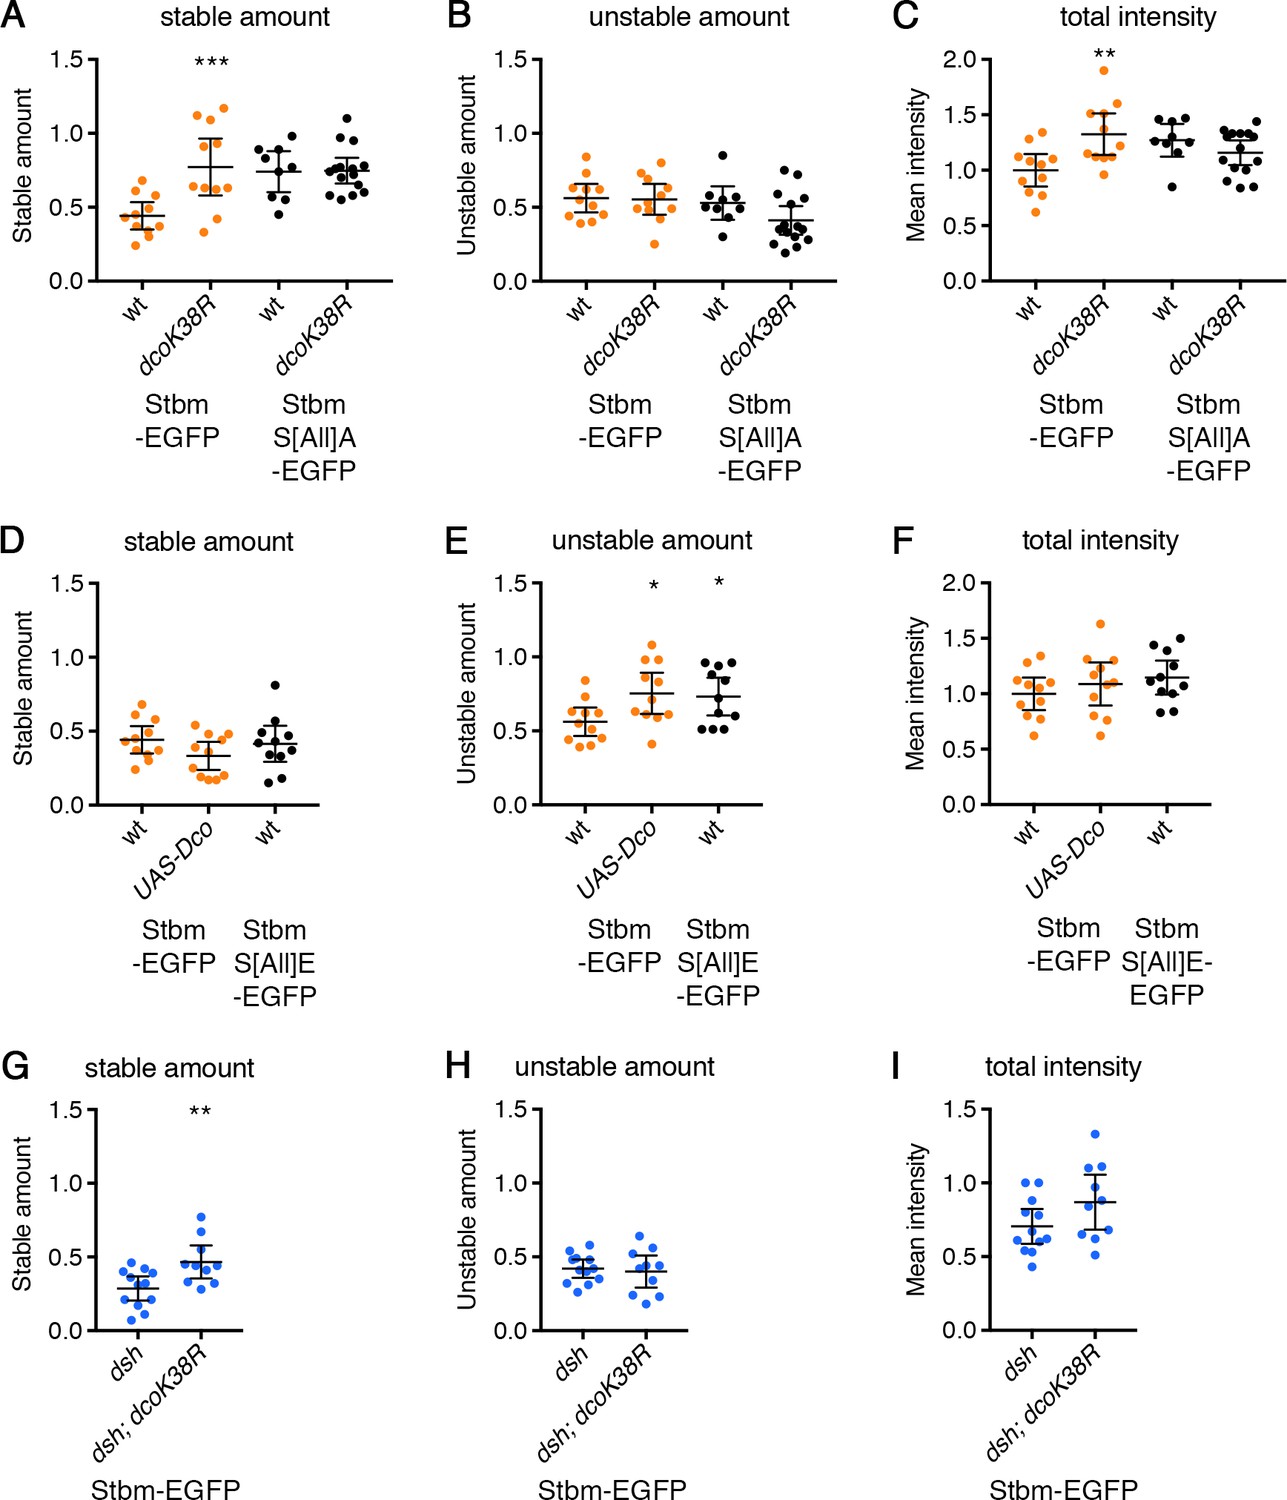
Stable amounts (A,D,G), unstable amounts (B,E,H) or total amounts (C,F,I) of EGFP-tagged protein, in 28 hr APF pupal wings after hub-and-spoke FRAP (see Figure 5A–C). Data are normalised to the total intensity in Stbm-EGFP and error bars are 95% confidence intervals. (A–C) ANOVA with Holm-Sidak’s multiple comparisons test was used to compare pairs of samples with and without DcoK38R. (D–F) ANOVA with Dunnett’s multiple comparisons test was used to compare with the Stbm-EGFP control. (G–I) Samples were compared using an unpaired t-test. p≤0.05*, p≤0.01**, p≤0.001***.
Figure 6 with 4 supplements
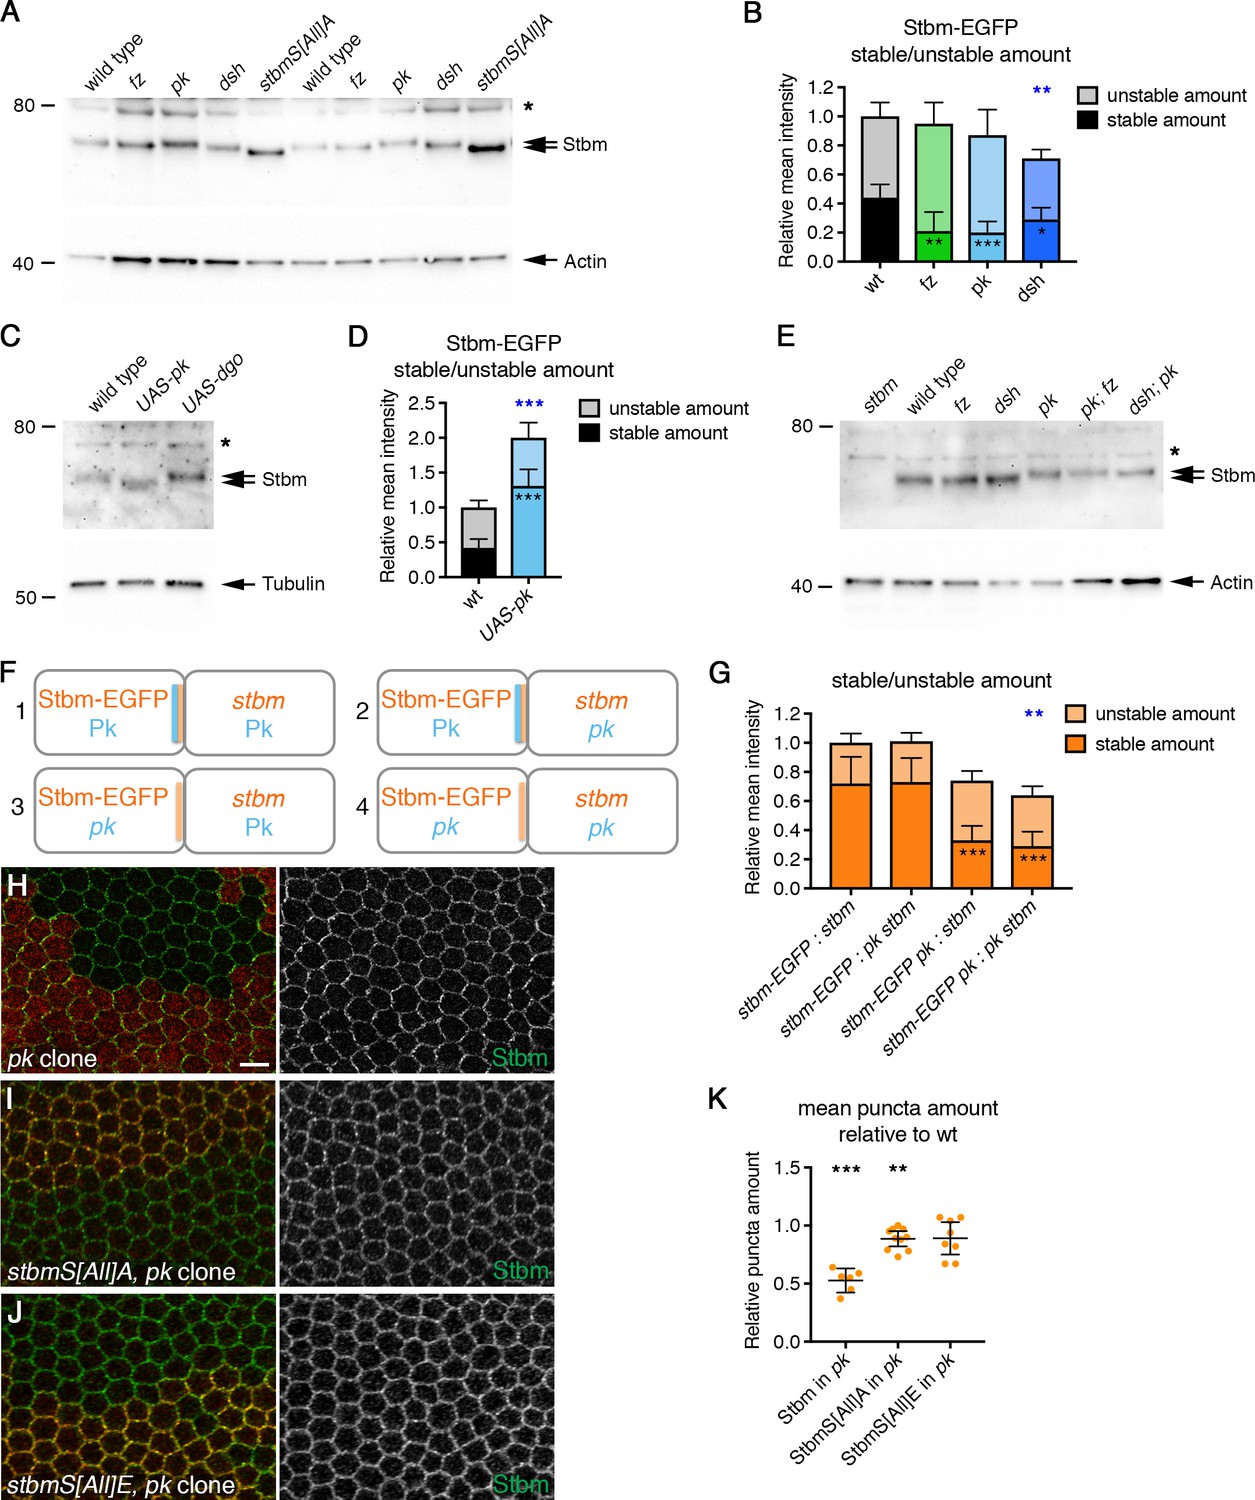
Pk reduces Stbm phosphorylation and promotes Stbm stability.
(A,C,E) Western blots probed with Stbm antibody, of pupal wing extracts. (A) Wings from wild-type, fzP21, pkpk-sple13, dsh1 or P[acman]-stbmS[All]A stbm6 flies at 28 hr APF, two biological replicates are shown for each genotype. (C) Wings from wild-type, Actin-GAL4, tub-GAL80ts, UAS-pk or Actin-GAL4, tub-GAL80ts, UAS-dgo flies, raised at 29°C for 25 hr APF. (E) Wings from wild-type, fzP21, dsh1, pkpk-sple13, pkpksple13; fzP21 or dsh1; pkpk-sple13 flies at 28 hr APF. The asterisk indicates a non-specific band. Actin (A,E) or α-Tubulin (C) was used as a loading control. (B,D) Stable and unstable amounts of Stbm-EGFP in pupal wings after hub-and-spoke FRAP. Flies were (B) P[acman]-stbm-EGFP stbm6/+ in a wild-type (n = 11), fzP21 (n = 9), pkpk-sple13 (n = 10) or dsh1 (n = 12) background, at 28 hr APF; (D) P[acman]-stbm-EGFP stbm6/+ in a wild-type (n = 9) or Actin-GAL4, tub-GAL80ts, UAS-pk (n = 8) background, flies raised at 29°C for 25 hr APF. Data are normalised to the total intensity in Stbm-EGFP. Error bars are 95% confidence intervals, and stable amounts (asterisks in dark shaded columns), unstable amounts (asterisks in light shaded columns) or total amounts (blue asterisks above the columns) were compared to the control (Stbm-EGFP) using ANOVA with Dunnett’s multiple comparisons test (B) or an unpaired t-test (D), p≤0.05*, p≤0.001**, p≤0.001***. (F,G) Diagram to illustrate boundary FRAP experiment (F), and stable and unstable amounts of Stbm-EGFP on illustrated clone boundaries in 28 hr APF pupal wings (G). Flies were P[acman]-stbm-EGFP stbm6 next to stbm6 (column 1, n = 10), P[acman]-stbm-EGFP stbm6 next to pkpk-sple13 stbm6 (column 2, n = 10), P[acman]-stbm-EGFP pkpk-sple13 stbm6 next to stbm6 (column 3, n = 12) and P[acman]-stbm-EGFP pkpk-sple13 stbm6 next to stbm-EGFP pkpk-sple13 stbm6 (column 4, n = 10). Error bars are 95% confidence intervals, and ANOVA with Tukey’s multiple comparisons test was used to compare stable amounts (asterisks in dark shaded columns), unstable amounts (no significant differences were seen) or total amounts (blue asterisks above the columns) between all genotypes. Comparisons to column one are shown, p≤0.001**, p≤0.001***. (H–J) 28 hr APF pupal wings from flies carrying pkpk-sple13 clones in a wild-type background (H), in a P[acman]-stbmS[All]A stbm6 background (I) or in a P[acman]-stbmS[All]E stbm6 background (J). Clones immunolabelled for Stbm (green) and marked by loss of β-gal immunolabelling (H) or loss of Pk immunolabelling (I,J) in red. Scale bar 5 µm. (K) Quantitation of mean puncta amount in 28 hr APF pupal wings, shown as a ratio of puncta amount in pkpk-sple13 mutant tissue compared to wild-type tissue in the same wing. Puncta amount is quantitated from wings immunostained for Stbm in a wild-type background (n = 6), a P[acman]-stbmS[All]A stbm6 background (n = 10) or a P[acman]-stbmS[All]E stbm6 background (n = 8). Error bars are 95% confidence intervals. One-sample t-tests were used to determine if the ratio differed from 1.0, **≤0.01, ***p≤0.001.
-
Figure 6—source data 1
Quantification of Stbm stability and puncta size in core protein mutants.
- https://doi.org/10.7554/eLife.45107.023
Figure 6—figure supplement 1
FRAP analysis of Stbm-EGFP in wings lacking core protein activity.
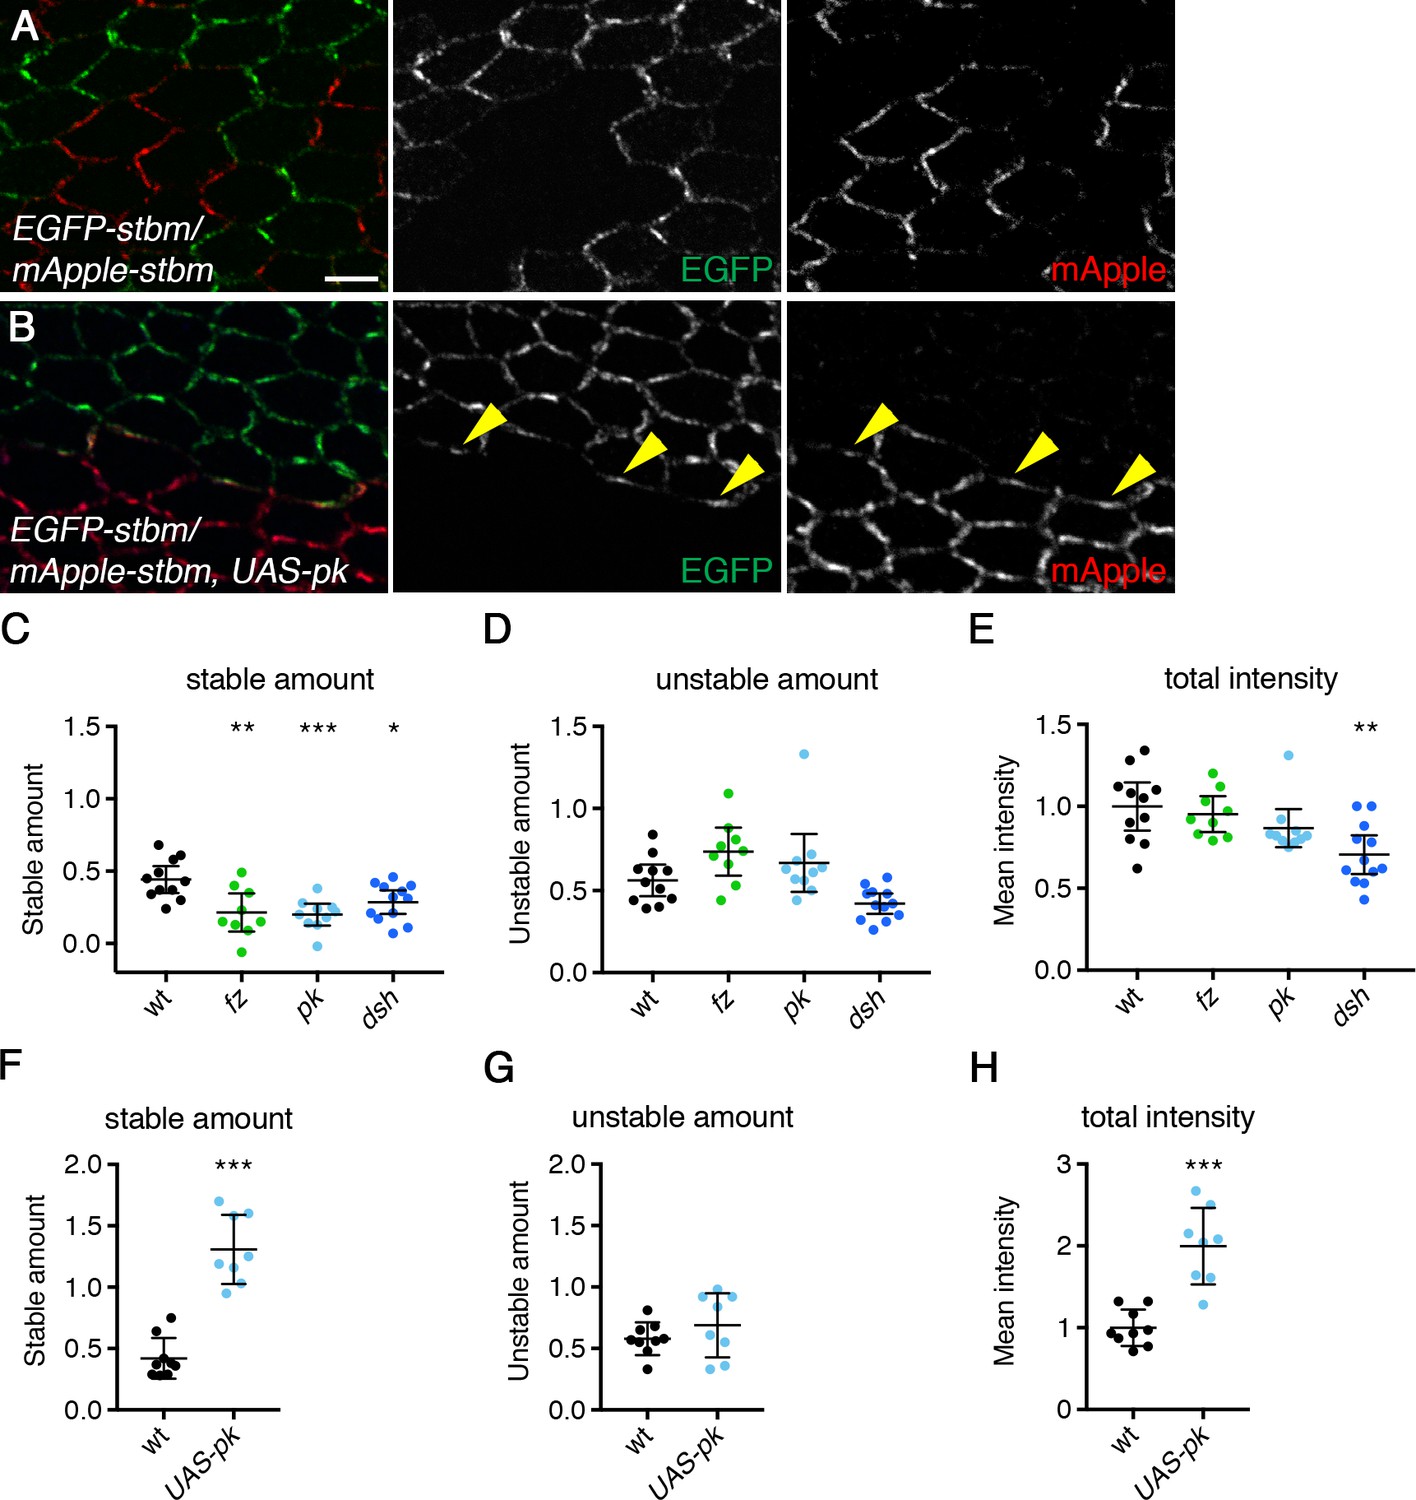
(A,B) 28 hr APF pupal wings carrying twin clones of P[acman]-EGFP-stbm stbm6 next to P[acman]-mApple-stbm stbm6, in a wild-type (A) or a ptc-GAL4, UAS-pk mutant background (B, note that UAS-pk is expressed throughout the region imaged). EGFP fluorescence is in green and mApple fluorescence is in red. Yellow arrowheads point to puncta on clone boundaries which contain both EGFP-Stbm and mApple-Stbm. Scale bar 5 µm. (C–E) Stable amounts (C), unstable amounts (D) and total amounts (E) of Stbm-EGFP in pupal wings after hub-and-spoke FRAP (see Figure 6B). Data are normalised to the total intensity in Stbm-EGFP and error bars are 95% confidence intervals. Levels were compared to the control (Stbm-EGFP) using ANOVA with Dunnett’s multiple comparisons test, p≤0.05*, p≤0.001**, p≤0.001***. (F–H) Stable amounts (F), unstable amounts (G) and total amounts (H) of Stbm-EGFP in pupal wings after hub-and-spoke FRAP (see Figure 6D). Data are normalised to the total intensity in Stbm-EGFP and error bars are 95% confidence intervals. Levels were compared to the control (Stbm-EGFP) using an unpaired t-test, p≤0.001***.
Figure 6—figure supplement 2
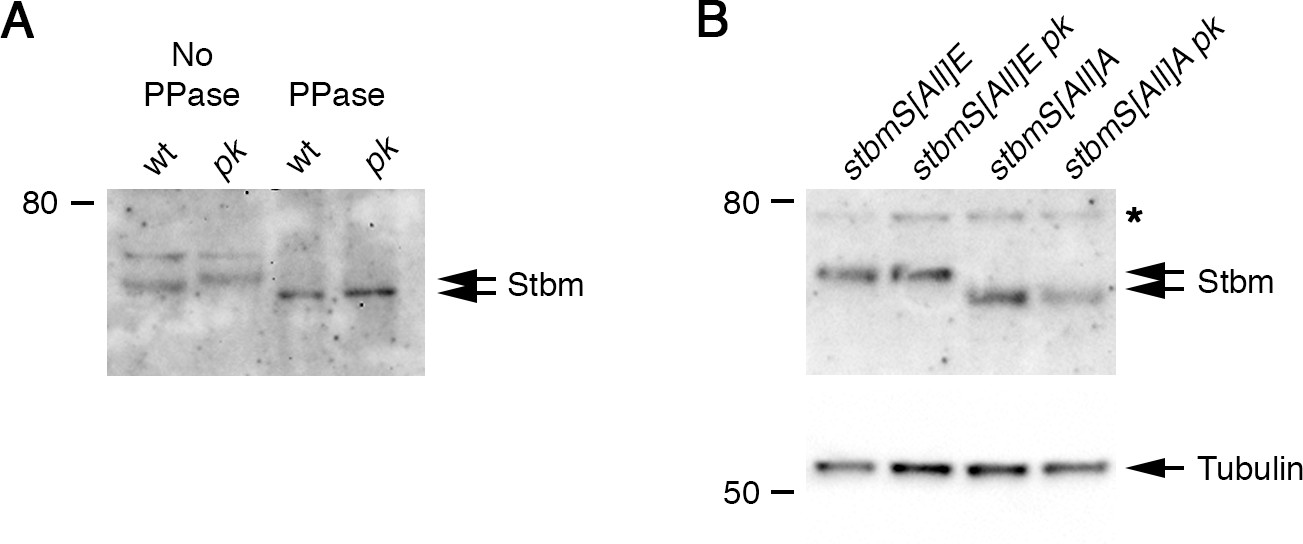
Pk does not affect phosphorylation and clustering of Stbm phosphorylation site mutants.
(A) Western blot probed with Stbm antibody, of extracts from 28 hr APF pupal wings from wild-type or pkpk-sple13 flies. Extracts were dissected directly into sample buffer (No PPase) or into lysis buffer and then phosphatase treated (PPase). Note that the Actin loading control was not visible after phosphatase treatment. (B) Western blot probed with Stbm antibody, of extracts from 28 hr APF pupal wings from P[acman]-stbmS[All]E stbm6, P[acman]-stbmS[All]E pkpk-sple13 stbm6, P[acman]-stbmS[All]A stbm6 or P[acman]-stbmS[All]A pkpk-sple13 stbm6 flies. The asterisk indicates a non-specific band. α-Tubulin was used as a loading control.
Figure 6—figure supplement 3
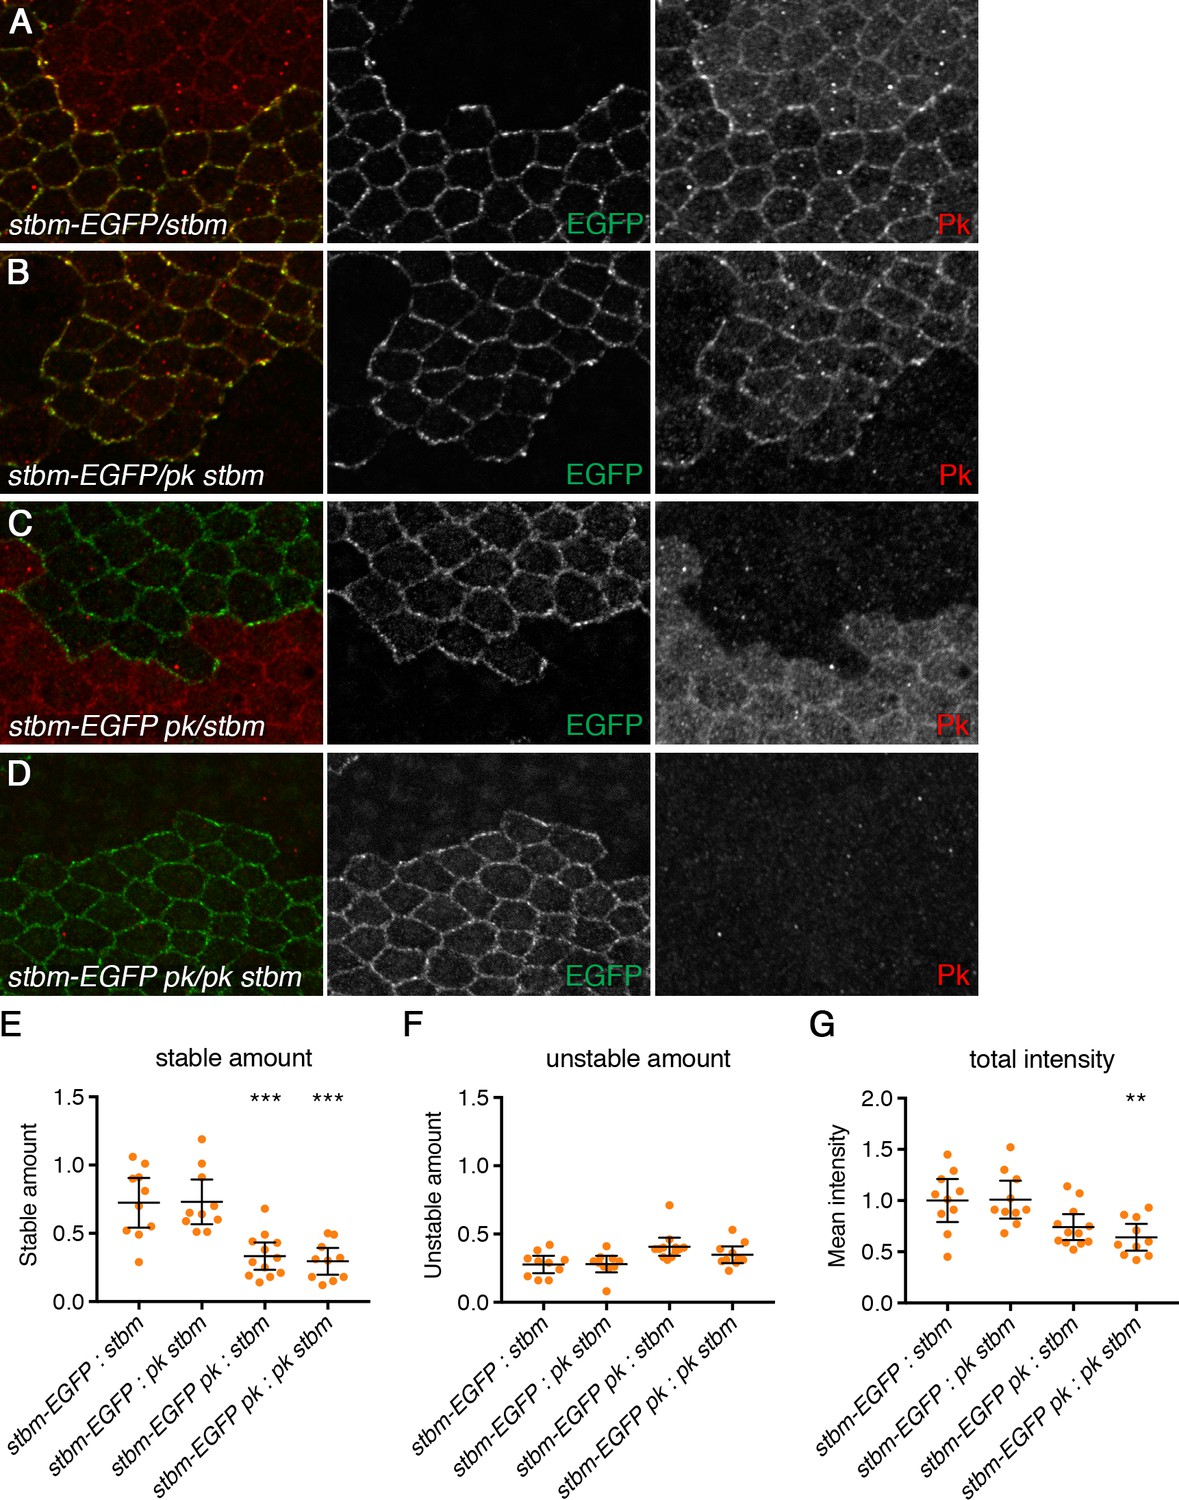
Pk cell autonomously regulates Stbm clustering.
(A–D) 28 hr APF pupal wings carrying clones of P[acman]-stbm-EGFP next to stbm mutant tissue, with and without Pk activity. Flies were P[acman]-stbm-EGFP stbm6 next to stbm6 (A), P[acman]-stbm-EGFP stbm6 next to pkpk-sple13 stbm6 (B), P[acman]-stbm-EGFP pkpk-sple13 stbm6 next to stbm6 (C) and P[acman]-stbm-EGFP pkpk-sple13 stbm6 next to pkpk-sple13 stbm6 (D). EGFP fluorescence is in green, and Pk immunolabelling is in red. (E–G) Stable amounts (E), unstable amounts (F) or total amounts (G) of Stbm-EGFP on clone boundaries in 28 hr APF pupal wings (see Figure 6G). Error bars are 95% confidence intervals, and ANOVA with Tukey’s multiple comparisons test was used to compare levels between all genotypes. Comparisons to column one are shown, p≤0.001**, p≤0.001***.
Figure 6—figure supplement 4
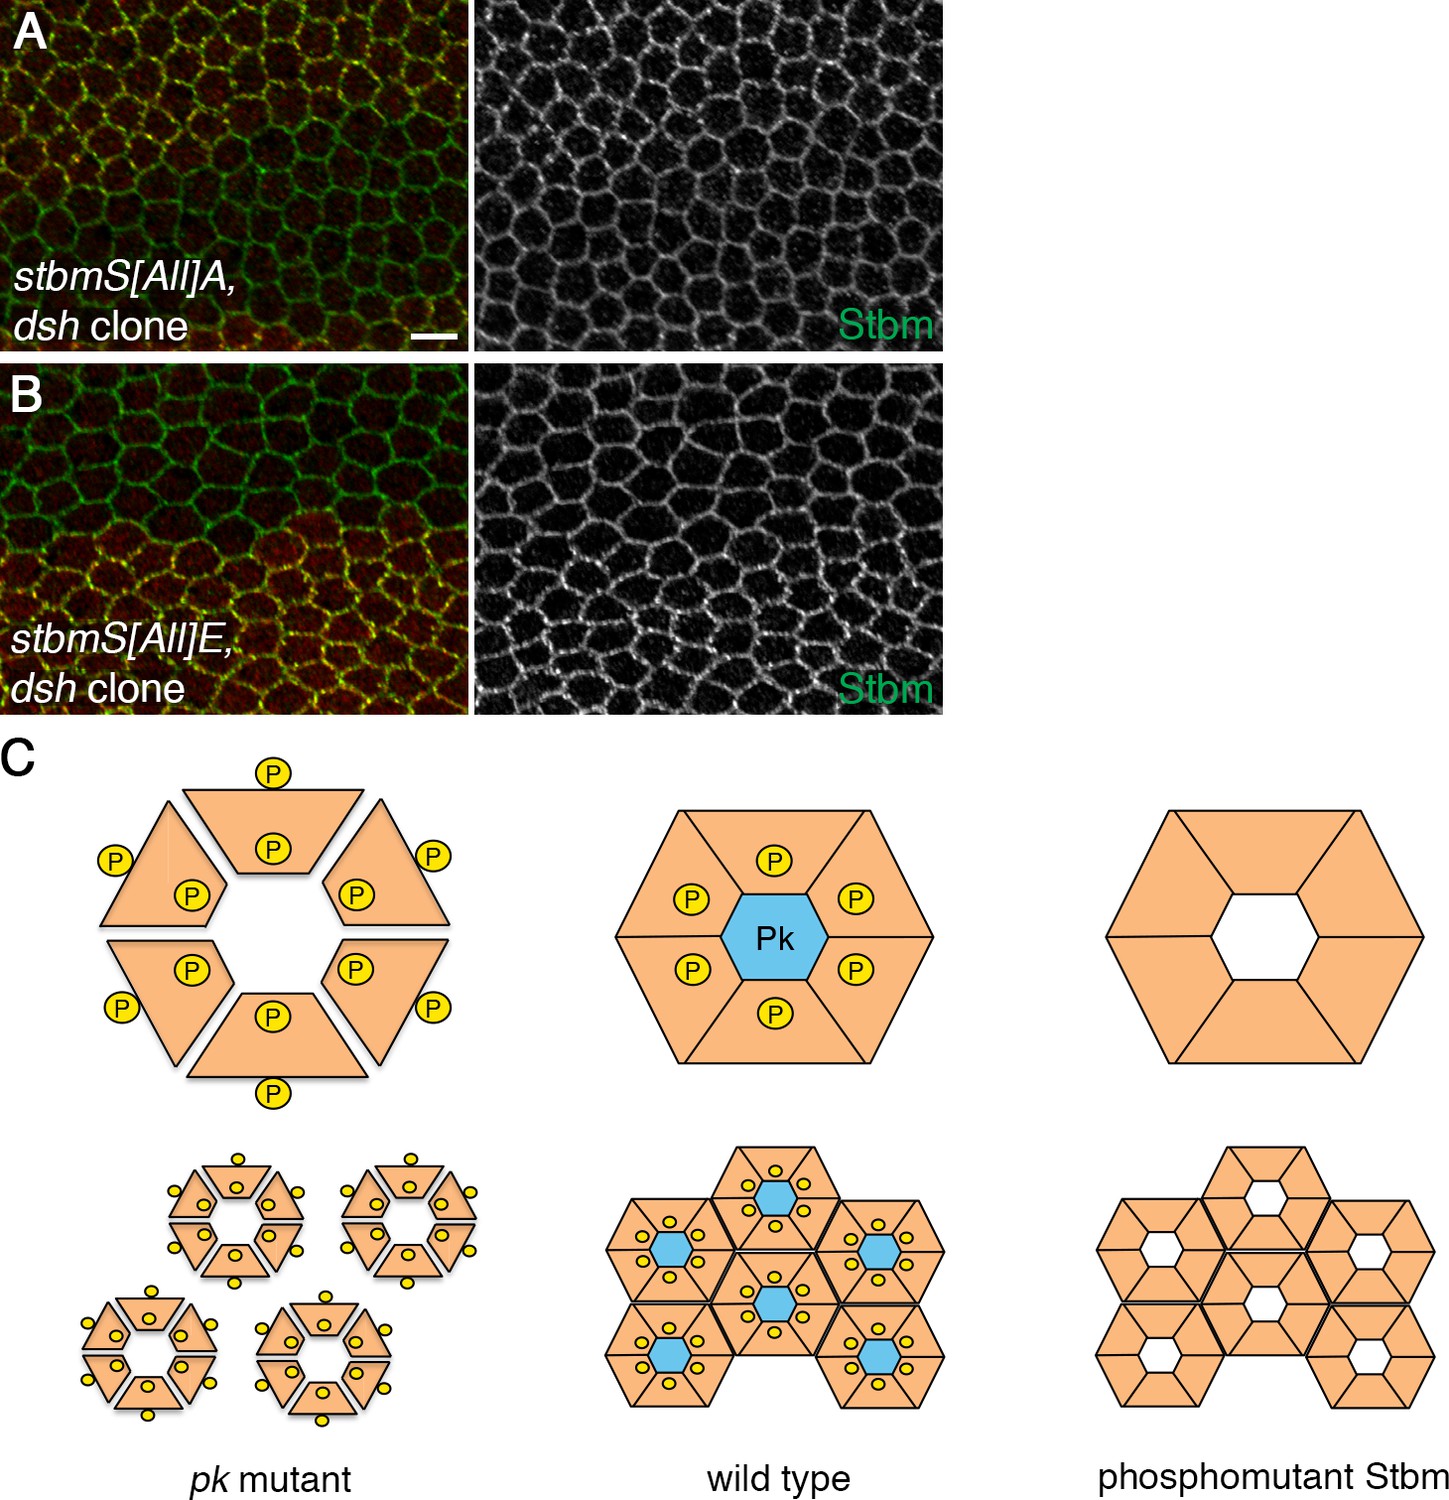
Regulation of Stbm clustering by Dsh and Pk.
(A,B) 28 hr APF pupal wings from flies carrying dshV26 clones in a P[acman]-stbmS[All]A stbm6 background (A) or in a P[acman]-stbmS[All]E stbm6 background (B), immunolabelled for Stbm (green) and Dsh (red, note that cytoplasmic as well as junctional Dsh can be seen). Scale bar 5 µm. (C) Speculative model to explain how Pk might reduce Stbm phosphorylation and increase its stability. In the absence of Pk, Stbm (orange boxes) loosely associates into multimers, which are accessible to Dco and highly phosphorylated (yellow circles, top left). This phosphorylation prevents clustering into higher order structures (bottom left). Binding of Pk to Stbm multimers could cause a conformational change that reduces accessibility to Dco (top middle). Reduced phosphorylation would allow clustering of multimers into higher order structures (bottom middle). Phosphomutant Stbm multimerises in the absence of Pk (right), while phosphomimetic Stbm acts like a pk mutant.
Figure 7 with 3 supplements
Phosphorylation of Dsh by Dco promotes core protein asymmetry.
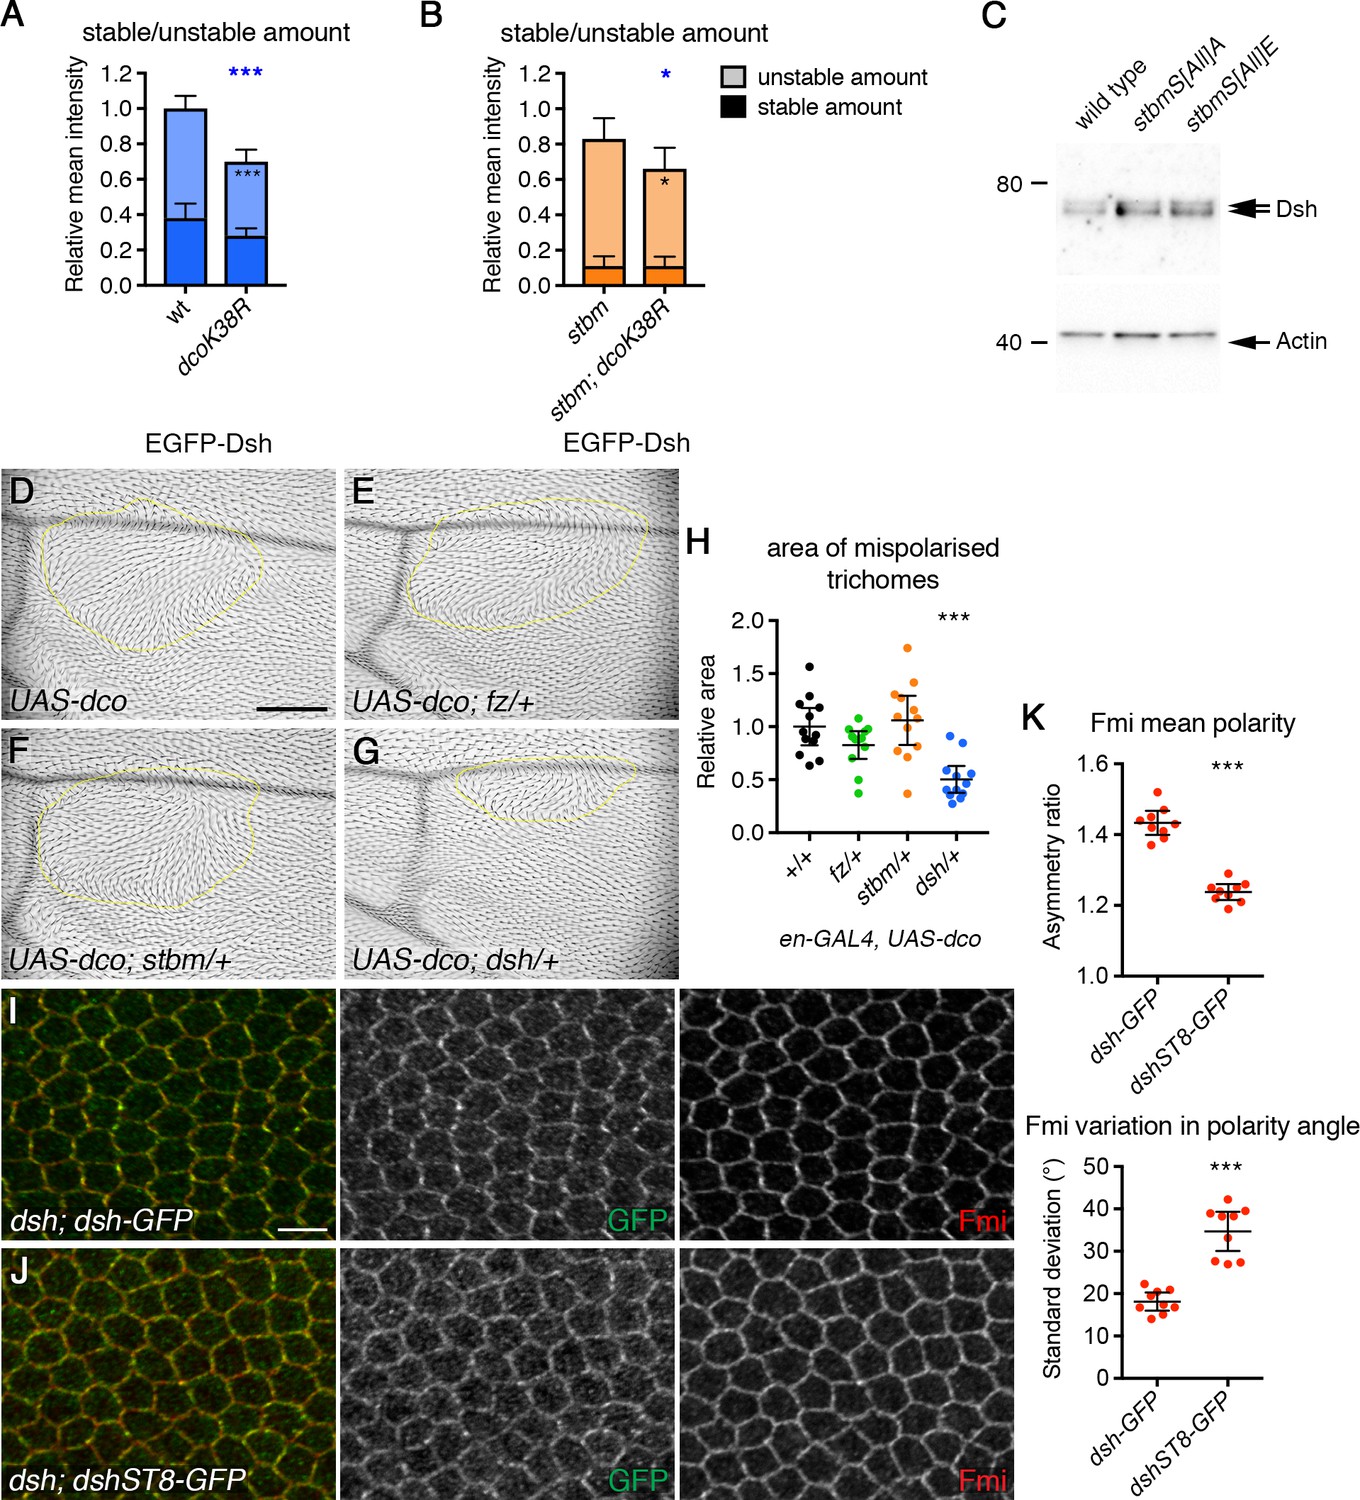
(A,B) Stable and unstable amounts of EGFP-Dsh in 28 hr APF pupal wings after hub-and-spoke FRAP. (A) Flies were dshV26/+; P[acman]-EGFP-dsh/+ (n = 14), and dshV26/+; P[acman]-EGFP-dsh/en-GAL4; UAS-dcoK38R/+ (n = 10). (B) Flies were dshV26/+; P[acman]-EGFP-dsh stbm6/stbm6 (n = 12), and dshV26/+; P[acman]-EGFP-dsh stbm6/stbm6 en-GAL4; UAS-dcoK38R/+ (n = 7). Wings were imaged in the posterior compartment. Data are normalised to the total intensity in EGFP-Dsh. Error bars are 95% confidence intervals, and unpaired t-tests were used to compare stable amounts (asterisks in dark shaded columns), unstable amounts (asterisks in light shaded columns) or total amounts (blue asterisks above the columns) between samples with and without DcoK38R, p≤0.05*, p≤0.001***. (C) Western blot probed with Dsh antibody, of extracts from 28 hr APF pupal wings from wild-type, P[acman]-stbmS[All]A stbm6 or P[acman]-stbmS[All]E stbm6 flies. Actin was used as a loading control. (D–G) Adult wings expressing en-GAL4, UAS-dco in a wild-type background (D) or in flies heterozygous for fzP21 (E), stbm6 (F) or dshV26 (G). Regions of the wing with abnormal trichome polarity are outlined in yellow. Scale bar 100 µm. (H) Quantitation of trichome swirling in UAS-dco/+; en-GAL4/+ (n = 12), UAS-dco/+; en-GAL4/+; fzP21/+ (n = 12), UAS-dco/+; en-GAL4/stbm6 (n = 12) and UAS-dco/dshV26; en-GAL4/+ (n = 12). Graph shows the wing area next to the posterior cross vein in which trichome polarity was abnormal. Data are normalised to the area of the swirl in the UAS-dco control. Error bars are 95% confidence intervals, and ANOVA with Dunnett’s multiple comparisons test was used to compare to the UAS-dco control, p≤0.001***. (I,J) 28 hr APF pupal wings from dshV26; dsh-GFP/+ (I) or dshV26; dshST8-GFP/+ (J). Wings immunolabelled for GFP (green) or Fmi (red). Scale bar 5 µm. (K) Quantitation of mean polarity and variation in polarity angle, of 28 hr APF pupal wings immunolabelled for Fmi in dshV26; dsh-GFP/+ (n = 9) or dshV26; dshST8-GFP/+ (n = 9) flies. Error bars are 95% confidence intervals, and samples were compared using an unpaired t-test, ***p≤0.001.
-
Figure 7—source data 1
Quantification of Dsh stability and asymmetry.
- https://doi.org/10.7554/eLife.45107.028
Figure 7—figure supplement 1
FRAP analysis of Stbm in dco mutant backgrounds.
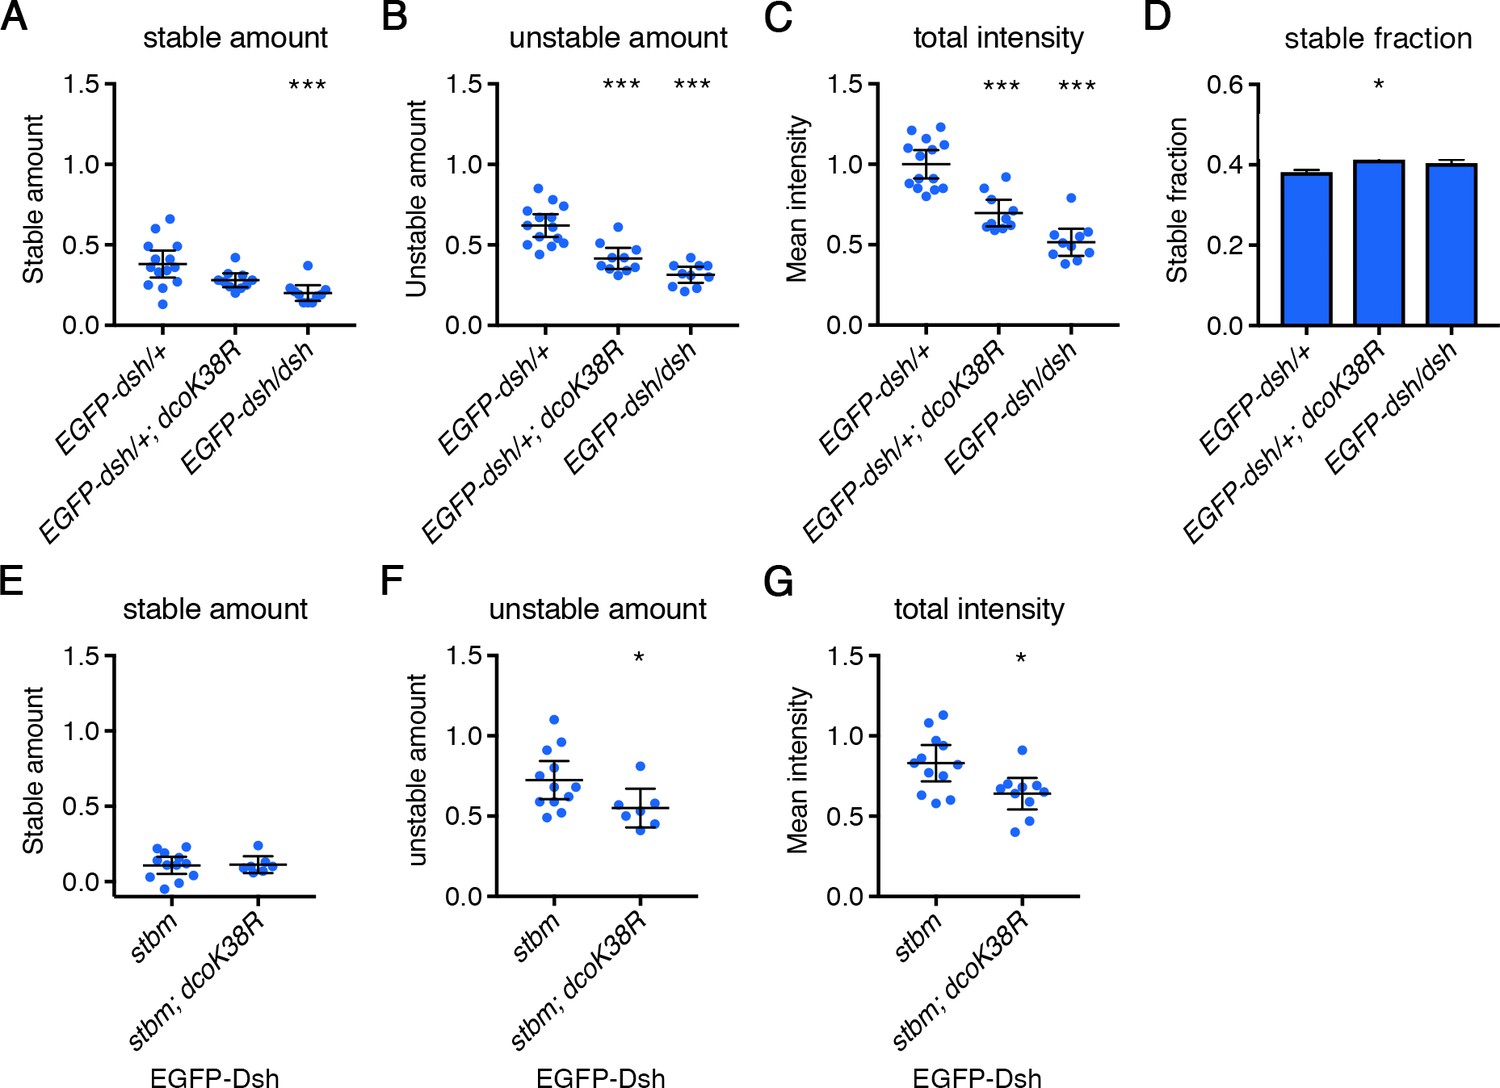
Stable amounts (A,E), unstable amounts (B,F), total amounts (C,G) or stable fraction (D) of EGFP-Dsh in 28 hr APF pupal wings after hub-and-spoke FRAP. (A–D) Flies were dshV26/+; P[acman]-EGFP-dsh/+ (n = 14), dshV26/+; P[acman]-EGFP-dsh/en-GAL4; UAS-dcoK38R/+ (n = 10) and dshV26; P[acman]-EGFP-dsh/+ (n = 10). (A–C) In the control genotype with a wild-type copy of endogenous dsh, intensities were plotted as double that of the measured EGFP-Dsh intensity, as EGFP-Dsh expression levels are the same as endogenous Dsh (Strutt et al., 2016). Error bars are 95% confidence intervals, and intensities were compared to control (EGFP-dsh/+) using ANOVA with Tukey’s multiple comparisons test, p≤0.05*, p≤0.001***. (D) The fluorescence recovery was fitted to an exponential curve for each genotype, and the graph shows the stable fraction (1-Ymax). Stable fractions were compared using an extra sum-of-squares F test, p≤0.05*, p≤0.01**. EGFP-dsh/+; dcoK38R and EGFP-dsh/dsh were not significantly different to each other, but EGFP-dsh/+; dcoK38R was significantly different from the control (EGFP-dsh/+). (E–G) Flies were dshV26/+; P[acman]-EGFP-dsh stbm6/stbm6 (n = 12), and dshV26/+; P[acman]-EGFP-dsh stbm6/stbm6 en-GAL4; UAS-dcoK38R/+ (n = 7). Data are normalised to the total intensity in EGFP-Dsh. Error bars are 95% confidence intervals, and unpaired t-tests were used to compare levels between samples with and without DcoK38R, p≤0.05*, p≤0.001***.
Figure 7—figure supplement 2
Regulation of Dsh phosphorylation by Dco.
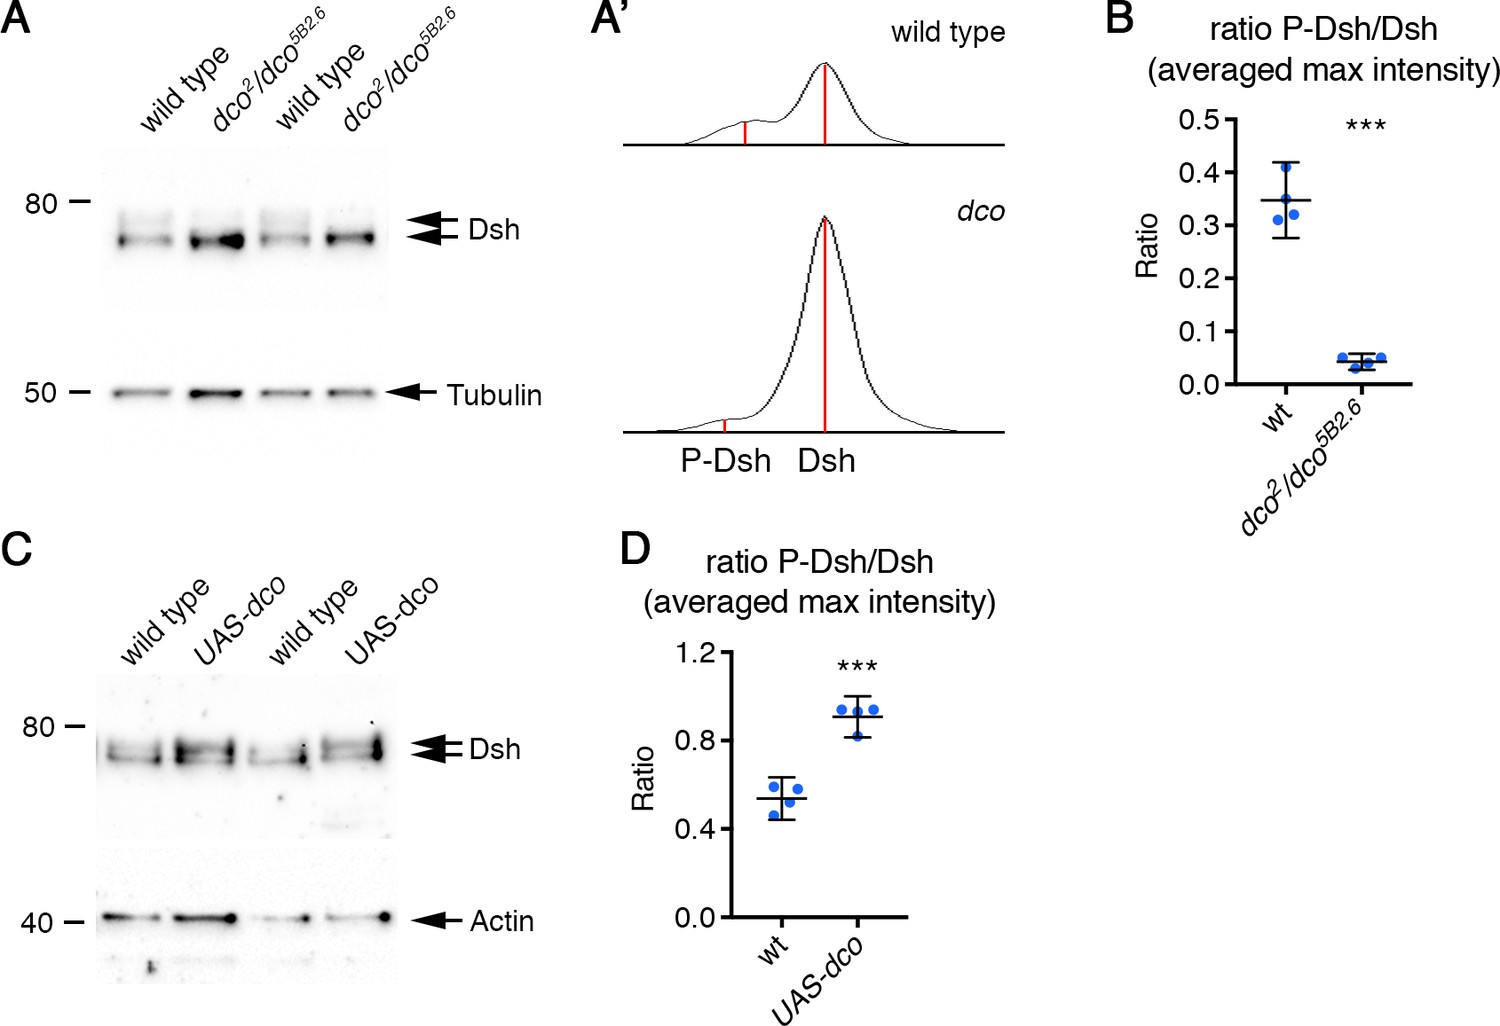
(A,C) Western blots probed with Dsh antibody, of extracts from pupal wings of wild-type or dco2/dco5B2.6 flies (A), or UAS-dco/+; en-GAL4/+ flies, raised at 25°C for 28 hr APF (C). Two biological replicates are shown for each genotype. Note a decrease in levels of the upper (phosphorylated) band in dco2/dco5B2.6, and an increase in UAS-dco. α-Tubulin (A) or Actin (C) was used as a loading control. (A') Diagram to illustrate quantitation of phosphorylated and unphosphorylated Dsh. ImageJ was used to draw a box around each lane and to generate lane profiles. The peak intensities of the phosphorylated and unphosphorylated bands were measured (red lines). Phosphorylated and unphosphorylated proteins were not well enough separated to quantitate absolute band intensities. (B,D) Quantitation of phosphorylated and unphosphorylated Dsh, from western blots with four biological replicates of wild-type, or dco2/dco5B2.6 flies (B), or UAS-dco/+; en-GAL4/+ flies (D). The graphs show the ratio of the peak intensity of each band. Ratios were compared using an unpaired t-test, p≤0.001***.
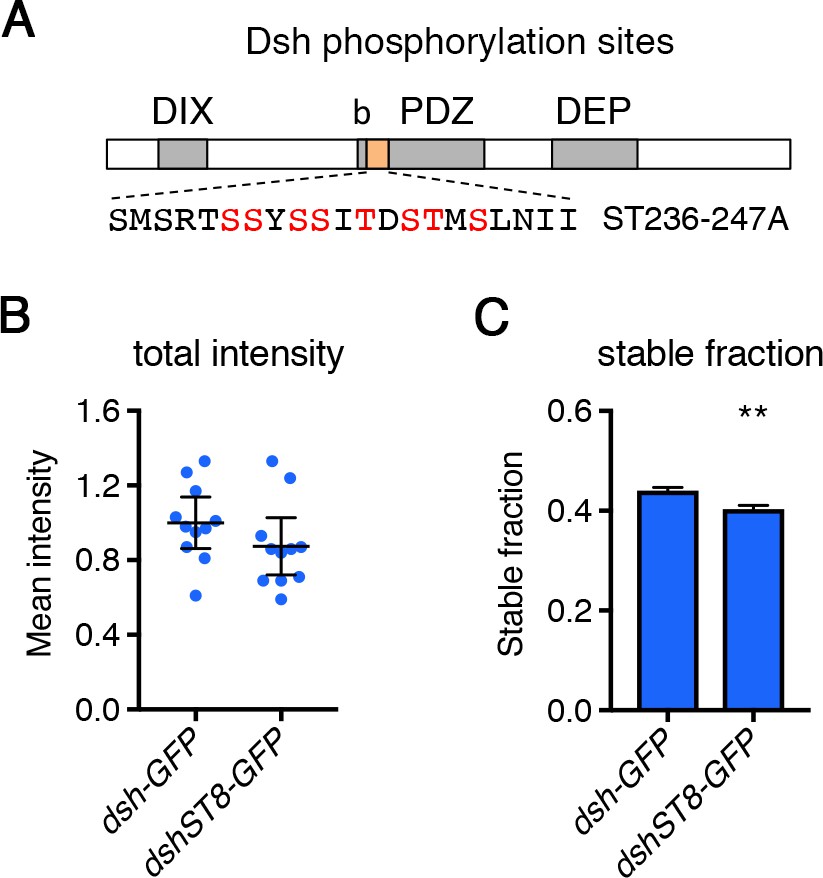
Figure 7—figure supplement 3
FRAP analysis of Stbm in dco mutant backgrounds.
(A) Diagram illustrating the conserved phosphorylation sites mutated in DshST8 (orange box). Also shown are the DIX, PDZ and DEP domains, and a conserved basic region (b). (B,C) Total amounts (B) or stable fraction (C) of Dsh-GFP or DshST8-GFP in 28 hr APF pupal wings after hub-and-spoke FRAP. Flies were in a dshV26 mutant background. Error bars are 95% confidence intervals. (B) Junctional intensities were compared using an unpaired t-test, no significant difference was seen. Note that these constructs were P element insertions and thus are likely to be expressed at different levels. This means that we cannot determine if DshST8-GFP levels are reduced, as would be expected considering the effect of dominant negative Dco on wild-type Dsh. (C) The fluorescence recovery was fitted to an exponential curve for each genotype, and the graph shows the stable fraction (1-Ymax). Stable fractions were compared using an extra sum-of-squares F test, p≤0.01**.
Figure 8
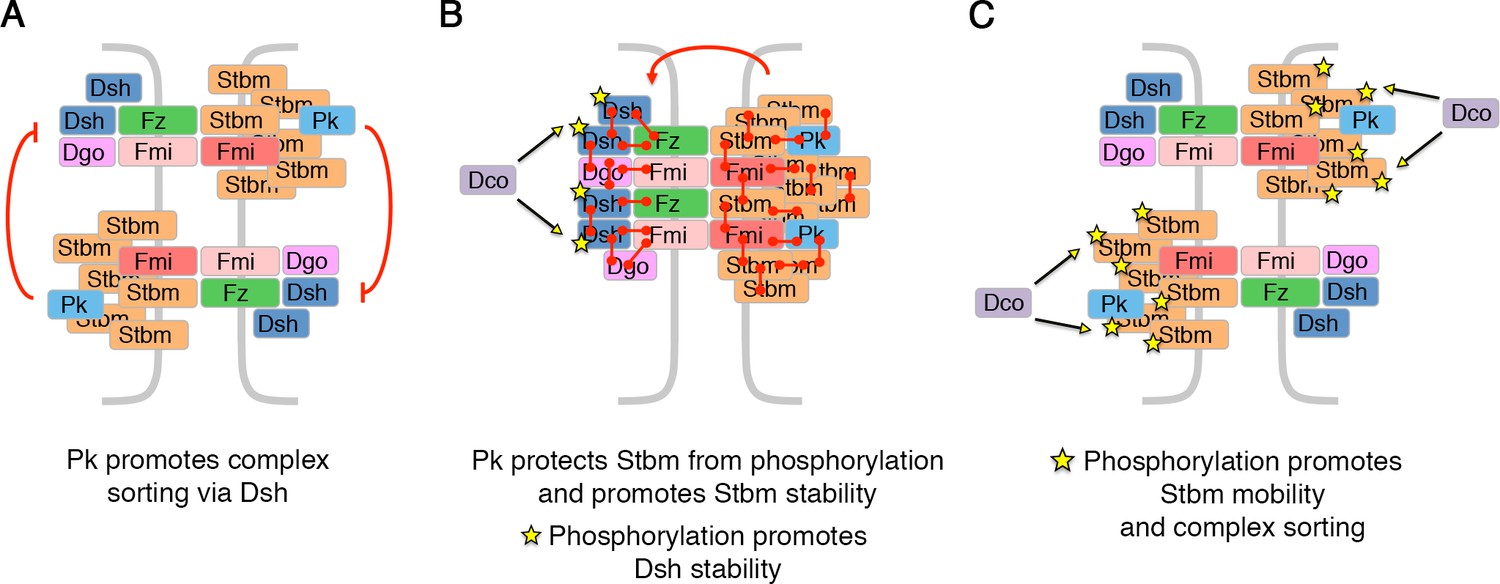
Model for how Pk and phosphorylation of Stbm regulate complex sorting and clustering.
(A) Pk regulates complex sorting by destabilising Fz, in a Dsh-dependent manner (Warrington et al., 2017). (B) Pk also acts via Stbm to stabilise Fz (red arrow, Warrington et al., 2017). Our new data suggest that Pk promotes Stbm stability by protecting Stbm from phosphorylation by Dco. Furthermore, phosphorylation of Dsh (yellow stars) by Dco promotes Dsh stability. (C) When Stbm is hyperphosphorylated (yellow stars) it is more mobile and promotes complex sorting.
Tables
Key resources table
| Reagent type (species) or resource | Designation | Source or reference | Identifiers | Additional information |
|---|---|---|---|---|
| Genetic reagent (Drosophila melanogaster) | stbm6 | Wolff and Rubin, 1998, PMID 9463361 | BDSC:6918; FLYB:FBal0062423; RRID:BDSC_6918 | FlyBase symbol: Vangstbm-6 |
| Genetic reagent (Drosophila melanogaster) | pkpk-sple13 | Gubb et al., 1999, PMID:10485852 | BDSC:41790; FLYB:FBal0060943; RRID:BDSC_41790 | FlyBase symbol: pkpk-sple-13 |
| Genetic reagent (Drosophila melanogaster) | dshV26 | Perrimon and Mahowald, 1987, PMID:3803719 | BDSC:6331; FLYB:FBal0003140; RRID:BDSC_6331 | FlyBase symbol: dsh3 |
| Genetic reagent (Drosophila melanogaster) | dsh1 | Bloomington Drosophila Stock Center | BDSC:5298; FLYB FBal0003138; RRID:BDSC_5298 | |
| Genetic reagent (Drosophila melanogaster) | dgo380 | Feiguin et al., 2001, PMID:11703927 | BDSC:41786; FLYB:FBal0141190; RRID:BDSC_41786 | |
| Genetic reagent (Drosophila melanogaster) | fmi-EGFP | Strutt et al., 2016, PMID:27926869 | Knock-in of EGFP to the C-terminus of fmi in the endogenous locus | |
| Genetic reagent (Drosophila melanogaster) | fz-EGFP | Strutt et al., 2016, PMID:27926869 | Knock-in of EGFP to the C-terminus of fz in the endogenous locus | |
| Genetic reagent (Drosophila melanogaster) | P[acman]-EGFP-dsh attP40 (2L) 25C6 | Strutt et al., 2016, PMID:27926869 | P[acman] transgene with EGFP recombineered at the N-terminus of dsh | |
| Genetic reagent (Drosophila melanogaster) | P[acman]-EGFP-dgo attP40 (2L) 25C6 | Strutt et al., 2016, PMID:27926869 | P[acman] transgene with EGFP recombineered at the N-terminus of dgo | |
| Genetic reagent (Drosophila melanogaster) | P[acman]-stbm attP40 (2L) 25C6 | Strutt et al., 2016, PMID:27926869 | P[acman] transgene | |
| Genetic reagent (Drosophila melanogaster) | P[acman]-stbm-EGFP attP40 (2L) 25C6 | Strutt et al., 2016, PMID:27926869 | P[acman] transgene with EGFP recombineered at the C-terminus of stbm | |
| Genetic reagent (Drosophila melanogaster) | P[acman]-stbm-EGFP VK1 (2R) 59D3 | This paper | P[acman] transgene with EGFP recombineered at the C-terminus of stbm | |
| Genetic reagent (Drosophila melanogaster) | P[acman]-EGFP-stbm attP40 (2L) 25C6 | This paper | P[acman] transgene with EGFP recombineered at the N-terminus of stbm | |
| Genetic reagent (Drosophila melanogaster) | P[acman]-mApple-stbm attP40 (2L) 25C6 | This paper | P[acman] transgene with mApple recombineered at the N-terminus of stbm | |
| Genetic reagent (Drosophila melanogaster) | P[acman]-mApple-dgo attP40 (2L) 25C6 | This paper | P[acman] transgene with mApple recombineered at the N-terminus of dgo | |
| Genetic reagent (Drosophila melanogaster) | P[acman]-EGFP-stbmS[5,120,122]A attP40 (2L) 25C6 | This paper | P[acman] transgene with EGFP at the N-terminus of stbm, and with phosphorylation site mutations S[5,120,122]A | |
| Genetic reagent (Drosophila melanogaster) | P[acman]-EGFP-stbmS[5,120,122]E attP40 (2L) 25C6 | This paper | P[acman] transgene with EGFP at the N-terminus of stbm, and with phosphorylation site mutations S[5,120,122]E | |
| Genetic reagent (Drosophila melanogaster) | P[acman]-EGFP-stbmS[All]A attP40 (2L) 25C6 | This paper | P[acman] transgene with EGFP at the N-terminus of stbm, and with phosphorylation site mutations S[5-17, 113-122]A | |
| Genetic reagent (Drosophila melanogaster) | P[acman]-stbmS[All]A attP40 (2L) 25C6 | This paper | P[acman] transgene with phosphorylation site mutations S[5-17, 113-122]A | |
| Genetic reagent (Drosophila melanogaster) | P[acman]-stbmS[All]A VK31 (3L) 62E1 | This paper | P[acman] transgene with phosphorylation site mutations S[5-17, 113-122]A | |
| Genetic reagent (Drosophila melanogaster) | P[acman]-stbmS[All]E attP40 (2L) 25C6 | This paper | P[acman] transgene with phosphorylation site mutations S[5-17, 113-122]E | |
| Genetic reagent (Drosophila melanogaster) | P[acman]-stbmS[5-17]A attP40 (2L) 25C6 | This paper | P[acman] transgene with phosphorylation site mutations S[5-17]A | |
| Genetic reagent (Drosophila melanogaster) | P[acman]-stbmS[113-122]A attP40 (2L) 25C6 | This paper | P[acman] transgene with phosphorylation site mutations S[113-122]A | |
| Genetic reagent (Drosophila melanogaster) | P[acman]-stbmS[5-17]E attP40 (2L) 25C6 | This paper | P[acman] transgene with phosphorylation site mutations S[5-17]E | |
| Genetic reagent (Drosophila melanogaster) | P[acman]-stbmS[113-122]E attP40 (2L) 25C6 | This paper | P[acman] transgene with phosphorylation site mutations S[113-122]E | |
| Genetic reagent (Drosophila melanogaster) | P[acman]-stbmS[All]A-EGFP attP40 (2L) 25C6 | This paper | P[acman] transgene with EGFP at the C-terminus of stbm, and with phosphorylation site mutations S[5-17, 113-122]A | |
| Genetic reagent (Drosophila melanogaster) | P[acman]-stbmS[All]E-EGFP VK31 (3L) 62E1 | This paper | P[acman] transgene with EGFP at the C-terminus of stbm, and with phosphorylation site mutations S[5-17, 113-122]E | |
| Genetic reagent (Drosophila melanogaster) | attB-UAS-pk VK20 (3R) 99F8 | This paper | pk gene under control of the UAS promoter | |
| Genetic reagent (Drosophila melanogaster) | attB-UAS-dgo VK20 (3R) 99F8 | This paper | dgo gene under control of the UAS promoter | |
| Genetic reagent (Drosophila melanogaster) | CaSpeR-dsh-GFP | Axelrod, 2001, PMID:11358862 | dsh genomic rescue construct, with GFP at the C-terminus | |
| Genetic reagent (Drosophila melanogaster) | CaSpeR-dshST8-GFP | Strutt et al., 2006, PMID:16824921 | dsh genomic rescue construct with GFP at the C-terminus, and with phosphorylation site mutations S[236-247]A | |
| Genetic reagent (Drosophila melanogaster) | UAS-dcoK38R | Strutt et al., 2006, PMID:16824921 | Dominant negative dco, under control of the UAS promoter | |
| Genetic reagent (Drosophila melanogaster) | UAS-dco | Sekine et al., 2008, PMID:18258753 | dco gene under control of the UAS promoter | |
| Genetic reagent (Drosophila melanogaster) | ptc-GAL4 | Bloomington Drosophila Stock Center | BDSC:2017; FLYB:FBti0002124; RRID:BDSC_2017 | FlyBase symbol: P{GawB}ptc559.1 |
| Genetic reagent (Drosophila melanogaster) | en-GAL4 | Bloomington Drosophila Stock Center | BDSC:30564; FLYB:FBti0003572; RRID:BDSC_30564 | FlyBase symbol: P{en2.4-GAL4}e16E |
| Genetic reagent (Drosophila melanogaster) | Actin-GAL425 | Bloomington Drosophila Stock Center | BDSC:3953; FLYB:FBti0012293; RRID:BDSC_3953 | FlyBase symbol: P{AyGAL4}25 |
| Genetic reagent (Drosophila melanogaster) | tub-GAL80ts20 | Bloomington Drosophila Stock Center | BDSC:7019; FLYB:FBti0027796; RRID:BDSC_7019 | FlyBase symbol: P{tubP-GAL80ts}20 |
| Genetic reagent (Drosophila melanogaster) | Ubx-FLP | Bloomington Drosophila Stock Center | BDSC:42718; FLYB:FBti0150334: RRID:BDSC_42718 | FlyBase symbol: P{Ubx-FLP}1 |
| Genetic reagent (Drosophila melanogaster) | hs-FLPG5 attP2 | Bloomington Drosophila Stock Center | BDSC:55816; FLYB:FBti0160507: RRID:BDSC_55816 | FlyBase symbol: P{hs-FLPG5}attP2 |
| Antibody | rabbit polyclonal anti-Stbm | Warrington et al., 2013, PMID:23364328 | RRID:AB_2570077 | 1/1000 (immunolabelling) |
| Antibody | rat polyclonal anti-Stbm | Strutt and Strutt, 2008, PMID:18804371 | RRID:AB_2569716 | 1/1000 (immunolabelling) |
| Antibody | affinity purified rabbit polyclonal anti-Fz | Bastock and Strutt, 2007, PMID:17652348 | RRID:AB_2801421 | 1/300 (immunolabelling) |
| Antibody | affinity purified rat polyclonal anti-Pk | Strutt et al., 2013a, PMID:23487316 | RRID:AB_2569720 | 1/25 (immunolabelling) |
| Antibody | rat polyclonal anti-Dsh | Strutt et al., 2006, PMID:16824921 | RRID:AB_2801419 | 1/1000 (immunolabelling) |
| Antibody | mouse monoclonal anti-Fmi #74 | Usui et al., 1999, PMID:10490098 | RRID:AB_2619583 | 3 µg/ml (immunolabelling) |
| Antibody | affinity purified rabbit polyclonal anti-GFP | Abcam | Abcam:ab6556; RRID:AB_305564 | 1/4000 (immunolabelling) |
| Antibody | mouse monoclonal anti-ß-gal 40-1a | DSHB | RRID:AB_2314509 | 1/200 (immunolabelling) |
| Antibody | rabbit polyclonal anti-ß-gal | MP Biomedicals/ Cappel | MP Biochemicals:0855976 (Cappel:55976); RRID:AB_2334934 | 1/4000 (immunolabelling) |
| Antibody | rabbit polyclonal anti-Stbm | Rawls and Wolff, 2003 PMID:12642492 | 1/20000 (western blotting) | |
| Antibody | affinity purified rabbit polyclonal anti-Dsh | Strutt et al., 2006, PMID:16824921 | RRID:AB_2801420 | 1/200 (western blotting) |
| Antibody | mouse monoclonal anti-Actin AC40 | Sigma-Aldrich | Sigma:A4700; RRID:AB_476730 | 1/5000 (western blotting) |
| Antibody | mouse monoclonal anti-Tubulin DM1A | Sigma-Aldrich | Sigma:T9026; RRID:AB_477593 | 1/10000 (western blotting) |
| Software, algorithm | ProgResC14 version 1.7.3 | Jenoptik | ||
| Software, algorithm | NIS Elements AR version 4.60 | Nikon | ||
| Software, algorithm | Image Lab version 4.1 | BioRad Laboratories | ||
| Software, algorithm | ImageJ version 2.0.0-r65/1.51 s | https://fiji.sc | ||
| Software, algorithm | Packing Analyzer | Aigouy et al., 2010, PMID:20813263 | ||
| Software, algorithm | MATLAB_R2014b | Mathworks | ||
| Software, algorithm | Membrane intensity and Polarity measurement scripts (MATLAB) | Strutt et al., 2016, PMID:27926869 | ||
| Software, algorithm | Puncta measurement script (MATLAB) | Strutt et al., 2019, PMID: 30661800 | ||
| Software, algorithm | GraphPad Prism version 7.0 c | GraphPad Software, Inc. |
Table 1
List of full genotypes used in each figure.
https://doi.org/10.7554/eLife.45107.030| Figure | |
|---|---|
| Figure 2A | w; stbm6 |
| Figure 2B | w; P[acman]-stbm [attP40] FRT40 stbm6 |
| Figure 2C | w; P[acman]-stbmS[All]A [attP40] FRT40 stbm6 |
| Figure 2D | w; P[acman]-stbmS[All]E [attP40] FRT40 stbm6 |
| Figure 2E, G, I, L, M | y w Ubx-FLP; P[acman]-stbm [attP40] arm-lacZ FRT40 stbm6 / P[acman]-stbmS[All]A [attP40] FRT40 stbm6 |
| Figure 2F, H, I, L, M | y w Ubx-FLP; P[acman]-stbm [attP40] arm-lacZ FRT40 stbm6 / P[acman]-stbmS[All]E [attP40] FRT40 stbm6 |
| Figure 2J, K | w w; P[acman]-stbmS[All]A [attP40] FRT40 stbm6 w; P[acman]-stbmS[All]E [attP40] FRT40 stbm6 |
| Figure 3A, C | y w Ubx-FLP; P[acman]-stbm [attP40] arm-lacZ FRT40 stbm6 / P[acman]-stbmS[All]A [attP40] FRT40 stbm6 |
| Figure 3B, D | y w Ubx-FLP; P[acman]-stbm [attP40] arm-lacZ FRT40 stbm6 / P[acman]-stbmS[All]E [attP40] FRT40 stbm6 |
| Figure 3G | w hs-FLP; P[acman]-EGFP-dgo [attP40] FRT40 dgo380 / P[acman]-mApple-dgo [attP40] FRT40 dgo380 |
| Figure 3H | w; P[acman]-EGFP-dgo [attP40] FRT40 stbm6 dgo380 / P[acman]-mApple-dgo [attP40] FRT40 stbm6 dgo380; P[acman-stbmS[All]A [VK31] / P[acman]-stbmS[All]A [VK31] hs-FLPG5 [attP2] |
| Figure 4B | w; P[acman]-stbm-EGFP [attP40] FRT40 stbm6 / + w; P[acman]-stbmS[All]A [attP40] FRT40 stbm6 / P[acman]-stbmS[All]A-EGFP [attP40] FRT40 stbm6 w; P[acman]-stbmS[All]E [attP40] FRT40 stbm6 / stbm6; P[acman]-stbmS[All]E-EGFP [VK31] / + |
| Figure 4E | w; P[acman]-stbm-EGFP [attP40] FRT40 stbm6 w; P[acman]-stbmS[All]A-EGFP [attP40] FRT40 stbm6 w; stbm6; P[acman]-stbmS[All]E-EGFP [VK31] |
| Figure 4F | w; fmi-EGFP/+ w; P[acman]-stbmS[All]A [attP40] FRT42 stbm6fmi-EGFP/P[acman]-stbmS[All]A [attP40] FRT40 stbm6 w; P[acman]-stbmS[All]E [attP40] FRT42 stbm6 fmi-EGFP/P[acman]-stbmS[All]E [attP40] FRT40 stbm6 |
| Figure 4G | w; fz-EGFP/+ w; P[acman]-stbmS[All]A [attP40] FRT40 stbm6/stbm6; P[acman]-stbmS[All]A [VK31] fz-EGFP / + w; P[acman]-stbmS[All]E [attP40] FRT40 stbm6; fz-EGFP / + |
| Figure 5A | w; P[acman]-stbm-EGFP [attP40] FRT40 stbm6 / + w; P[acman]-stbm-EGFP [attP40] FRT40 stbm6 / en-GAL4; UAS-dcoK38R / + w; P[acman]-stbmS[All]A [attP40] FRT40 stbm6 / P[acman]-stbmS[All]A-EGFP [attP40] FRT40 stbm6 w; P[acman]-stbmS[Al]A-EGFP [attP40] FRT40 stbm6 / P[acman]-stbmS[All]A [attP40] en-GAL4, stbm6; UAS-dcoK38R / + |
| Figure 5B | w; P[acman]-stbm-EGFP [attP40] FRT40 stbm6 / + w UAS-dco/w; P[acman]-stbm-EGFP [attP40] FRT40 stbm6/en-GAL4 w; P[acman]-stbmS[All]E [attP40] FRT40 stbm6 / stbm6; P[acman]-stbmS[All]E-EGFP [VK31] / + |
| Figure 5C | w dsh1; P[acman]-stbm-EGFP [attP40] FRT40 stbm6 / + w dsh1; P[acman]-stbm-EGFP [attP40] FRT40 stbm6/ en-GAL4; UAS-dcoK38R / + |
| Figure 6A | w w; fzP21 w; pkpk-sple13 w dsh1 w; P[acman]-stbmS[All]A [attP40] FRT40 stbm6 |
| Figure 6B | w; P[acman]-stbm-EGFP [attP40] FRT40 stbm6 / +w; P[acman]-stbm-EGFP [attP40] FRT40 stbm6 / +; fzP21 w; P[acman]-stbm-EGFP [attP40] FRT42 pkpk-sple13 stbm6 / FRT42 pkpk-sple13 w dsh1; P[acman]-stbm-EGFP [attP40] FRT40 stbm6 / + |
| Figure 6C | w w; Actin-GAL4, tub-GAL80ts / +; UAS-pk [VK20] / +w; Actin-GAL4, tub-GAL80ts / +; UAS-dgo [VK20] / + |
| Figure 6D | w; P[acman]-stbm-EGFP [attP40] FRT40 stbm6 / +w; P[acman]-stbm-EGFP [attP40] FRT40 stbm6 /Actin-GAL4, tub-GAL80ts; UAS-pk [VK20] / + |
| Figure 6E | w; stbm6 w w; fzP21 w dsh1 w; pkpk-sple13 w; pkpk-sple13; fzP21 w dsh1; pkpk-sple13 |
| Figure 6G | y w Ubx-FLP; FRT42 stbm6 P[acman]-stbm-EGFP [VK1] / FRT42 stbm6, Ubi-mRFP-nls y w Ubx-FLP; FRT42 stbm6 P[acman]-stbm-EGFP [VK1] / FRT42 pkpk-sple13 stbm6, Ubi-mRFP-nls y w Ubx-FLP; FRT42 pkpk-sple13 stbm6P[acman]-stbm-EGFP [VK1] / FRT42 stbm6, Ubi-mRFP-nls y w Ubx-FLP; FRT42 pkpk-sple13 stbm6P[acman]-stbm-EGFP [VK1] / FRT42 pkpk-sple13 stbm6, Ubi-mRFP-nls |
| Figure 6H, K | y w Ubx-FLP; FRT42 arm-lacZ / FRT42 pkpk-sple13 |
| Figure 6I, K | y w Ubx-FLP; P[acman]-stbmS[All]A [attP40] FRT42 stbm6 / P[acman]-stbmS[All]A [attP40] FRT42 pkpk-sple13 stbm6 |
| Figure 6J, K | y w Ubx-FLP; P[acman]-stbmS[All]E [attP40] FRT42 stbm6 / P[acman]-stbmS[All]E [attP40] FRT42 pkpk-sple13 stbm6 |
| Figure 7A | y w dshV26 FRT18 / w; P[acman]-EGFP-dsh [attP40]/+ y w dshV26 FRT18 / w; P[acman]-EGFP-dsh [attP40] / en-GAL4; UAS-dcoK38R / + |
| Figure 7B | y w dshV26 FRT18 / w; P[acman]-EGFP-dsh [attP40] stbm6 / stbm6 y w dshV26 FRT18 / w; P[acman]-EGFP-dsh [attP40] stbm6 / en-GAL4, stbm6; UAS-dcoK38R / + |
| Figure 7C | w w; P[acman]-stbmS[All]A [attP40] FRT40 stbm6 w; P[acman]-stbmS[All]E [attP40] FRT40 stbm6 |
| Figure 7D, H | w UAS-dco/w; en-GAL4/+ |
| Figure 7E, H | w UAS-dco/w; en-GAL4 / +; fzP21 / + |
| Figure 7F, H | w UAS-dco / w; en-GAL4 / stbm6 |
| Figure 7G, H | w UAS-dco / w dshV26; en-GAL4 / + |
| Figure 7I, H | y w dshV26 FRT18; pCaSpeR-dsh-GFP / + |
| Figure 7J, K | y w dshV26 FRT18; pCaSpeR-dshST8-GFP / + |
| Figure 2—figure supplement 1A | w; P[acman]-EGFP-stbm [attP40] FRT40 stbm6 |
| Figure 2—figure supplement 1B | w; P[acman]-EGFP-stbmS[5,120,122]A [attP40] FRT40 stbm6 |
| Figure 2—figure supplement 1C | w; P[acman]-EGFP-stbmS[5,120,122]E [attP40] FRT40 stbm6 |
| Figure 2—figure supplement 1D | w; P[acman]-EGFP-stbmS[All]A [attP40] FRT40 stbm6 |
| Figure 2—figure supplement 1E, I | y w Ubx-FLP; P[acman]-EGFP-stbm [attP40] arm-lacZ FRT40 stbm6 / P[acman]-stbm [attP40] FRT40 stbm6 |
| Figure 2—figure supplement 1F, I | y w Ubx-FLP; P[acman]-EGFP-stbmS[5,120,122]A [attP40] FRT40 stbm6 / P[acman]-EGFP-stbm [attP40] arm-lacZ FRT40 stbm6 |
| Figure 2—figure supplement 1G, I | y w Ubx-FLP; P[acman]-EGFP-stbmS[5,120,122]E [attP40] FRT40 stbm6 / P[acman]-EGFP-stbm [attP40] arm-lacZ FRT40 stbm6 |
| Figure 2—figure supplement 1H, I | y w Ubx-FLP; P[acman]-EGFP-stbmS[All]A [attP40] FRT40 stbm6 / P[acman]-EGFP-stbm [attP40] arm-lacZ FRT40 stbm6 |
| Figure 2—figure supplement 2A | w w; P[acman]-stbmS[All]A [attP40] FRT40 stbm6 w; P[acman]-stbmS[All]E [attP40] FRT40 stbm6 |
| Figure 2—figure supplement 2B | w w; P[acman]-stbmS[5-17]A [attP40] FRT40 stbm6 w; P[acman]-stbmS[113-122]A [attP40] FRT40 stbm6 |
| Figure 2—figure supplement 2C, G | y w Ubx-FLP; P[acman]-stbmS[5-17]A [attP40] FRT40 stbm6 / P[acman]-stbm [attP40] arm-lacZ FRT40 stbm6 |
| Figure 2—figure supplement 2D, H | y w Ubx-FLP; P[acman]-stbmS[5-17]E [attP40] FRT40 stbm6 / P[acman]-stbm [attP40] arm-lacZ FRT40 stbm6 |
| Figure 2—figure supplement 2E, G | y w Ubx-FLP; P[acman]-stbmS[113-122]A [attP40] FRT40 stbm6 / P[acman]-stbm [attP40] arm-lacZ FRT40 stbm6 |
| Figure 2—figure supplement 2F, H | y w Ubx-FLP; P[acman]-stbmS[113-122]E [attP40] FRT40 stbm6 / P[acman]-stbm [attP40] arm-lacZ FRT40 stbm6 |
| Figure 3–figure supplement 1A, C, E, G, I | y w Ubx-FLP; P[acman]-stbm [attP40] arm-lacZ FRT40 stbm6] / P[acman]-stbmS[All]A [attP40] FRT40 stbm6 |
| Figure 3–figure supplement 1B, D, F, H, J | y w Ubx-FLP; P[acman]-stbm [attP40] arm-lacZ FRT40 stbm6 / P[acman]-stbmS[All]E [attP40] FRT40 stbm6 |
| Figure 3—figure supplement 1K | w; P[acman]-EGFP-dgo [attP40] FRT40 dgo380 |
| Figure 3—figure supplement 1L | w; P[acman]-EGFP-dgo [attP40] FRT40 stbm6dgo380; P[acman-stbmS[All]A [VK31] |
| Figure 4—figure supplement 1A, C, D | w; P[acman]-stbm-EGFP [attP40] FRT40 stbm6 / + |
| Figure 4—figure supplement 1A, C, E | w; P[acman]-stbmS[All]A [attP40] FRT40 stbm6 / P[acman]-stbmS[All]A-EGFP [attP40] FRT40 stbm6 |
| Figure 4—figure supplement 1A, C, F | w; P[acman]-stbmS[All]E [attP40] FRT40 stbm6 / stbm6; P[acman]-stbmS[All]E-EGFP [VK31] / + |
| Figure 4—figure supplement 2A-D | w |
| Figure 4—figure supplement 2B, D | w; P[acman]-stbmS[All]A [attP40] FRT40 stbm6 / + |
| Figure 4—figure supplement 2C, D | w; P[acman]-stbmS[All]E [attP40] FRT40 stbm6 / + |
| Figure 5—figure supplement 1A | w w; FRT82 dco2 / FRT82 dco5B2.6 |
| Figure 5—figure supplement 1B | w w; Actin-GAL4, tub-GAL80ts / +; UAS-dcoK38R / + |
| Figure 5—figure supplement 2A-C | w; P[acman]-stbm-EGFP [attP40] FRT40 stbm6/+w; P[acman]-stbm-EGFP [attP40] FRT40 stbm6 / en-GAL4; UAS-dcoK38R / + w; P[acman]-stbmS[All]A [attP40] FRT40 stbm6 / P[acman]-stbmS[All]A-EGFP [attP40] FRT40 stbm6 w; P[acman]-stbmS[Al]A-EGFP [attP40] FRT40 stbm6 / P[acman]-stbmS[All]A [attP40] en-GAL4, stbm6; UAS-dcoK38R / + |
| Figure 5—figure supplement 2D-F | w; P[acman]-stbm-EGFP [attP40] FRT40 stbm6 / + w UAS-dco / w; P[acman]-stbm-EGFP [attP40] FRT40 stbm6 / en-GAL4 w; P[acman]-stbmS[All]E [attP40] FRT40 stbm6 / stbm6; P[acman]-stbmS[All]E-EGFP [VK31] / + |
| Figure 5—figure supplement 2G-I | w dsh1; P[acman]-stbm-EGFP [attP40] FRT40 stbm6 / + w dsh1; P[acman]-stbm-EGFP [attP40] FRT40 stbm6 / en-GAL4; UAS-dcoK38R / + |
| Figure 6—figure supplement 2A | w w; pkpk-sple13 |
| Figure 6—figure supplement 2B | w; P[acman]-stbmS[All]E [attP40] FRT40 stbm6 w; P[acman]-stbmS[All]E [attP40] FRT42 pkpk-sple13 stbm6 w; P[acman]-stbmS[All]A [attP40] FRT40 stbm6 w; P[acman]-stbmS[All]A [attP40] FRT42 pkpk-sple13 stbm6 |
| Figure 6—figure supplement 1A | y w Ubx-FLP; P[acman]-EGFP-stbm [attP40] FRT40 stbm6 / P[acman]-mApple-stbm [attP40] FRT40 stbm6 |
| Figure 6—figure supplement 1B | y w Ubx-FLP; P[acman[-EGFP-Stbm [attP40] FRT40 ptc-GAL4 stbm6 / P[acman]-mApple-Stbm [attP40] FRT40 stbm6; UAS-Pk [VK20] / + |
| Figure 6—figure supplement 1C-E | w; P[acman]-stbm-EGFP [attP40] FRT40 stbm6/+ w; P[acman]-stbm-EGFP [attP40] FRT40 stbm6/+; fzP21 w; P[acman]-stbm-EGFP [attP40] FRT42 pkpk-sple13 stbm6 / FRT42 pkpk-sple13 w dsh1; P[acman]-stbm-EGFP [attP40] FRT40 stbm6 / + |
| Figure 6—figure supplement 1F-H | w; P[acman]-stbm-EGFP [attP40] FRT40 stbm6 / +w; P[acman]-stbm-EGFP [attP40] FRT40 stbm6 /Actin-GAL4, tub-GAL80ts; UAS-pk [VK20] / + |
| Figure 6—figure supplement 3A, E-G | y w Ubx-FLP; FRT42 stbm6 P[acman]-stbm-EGFP [VK1] / FRT42 stbm6, Ubi-mRFP-nls |
| Figure 6—figure supplement 3B, E-G | y w Ubx-FLP; FRT42 stbm6 P[acman]-stbm-EGFP [VK1] / FRT42 pkpk-sple13 stbm6, Ubi-mRFP-nls |
| Figure 6—figure supplement 3C, E-G | y w Ubx-FLP; FRT42 pkpk-sple13 stbm6P[acman]-stbm-EGFP [VK1] / FRT42 stbm6, Ubi-mRFP-nls |
| Figure 6—figure supplement 3D, E-G | y w Ubx-FLP; FRT42 pkpk-sple13 stbm6P[acman]-stbm-EGFP [VK1]/ FRT42 pkpk-sple13 stbm6, Ubi-mRFP-nls |
| Figure 6—figure supplement 4A | w dshV26 FRT19A/y w Ubx-FLP FRT19A; P(acman)-StbmS(All)A [attP40] FRT40 stbm[6] |
| Figure 6—figure supplement 4B | w dshV26 FRT19A / y w Ubx-FLP FRT19A; P(acman)-StbmS(All)E [attP40] FRT40 stbm[6] |
| Figure 7—figure supplement 1A-D | y w dshV26 FRT18 / w; P[acman]-EGFP-dsh [attP40] / + y w dshV26 FRT18 / w; P[acman]-EGFP-dsh [attP40] / en-GAL4; UAS-dcoK38R / + y w dshV26 FRT18; P[acman]-EGFP-dsh [attP40] / + |
| Figure 7—figure supplement 1E-G | y w dshV26 FRT18 / w; P[acman]-EGFP-dsh [attP40] stbm6 / stbm6 y w dshV26 FRT18 / w; P[acman]-EGFP-dsh [attP40] stbm6 / en-GAL4, stbm6; UAS-dcoK38R / + |
| Figure 7—figure supplement 2A, B | w w; FRT82 dco2 / FRT82 dco5B2.6 |
| Figure 7—figure supplement 2C, D | w UAS-dco / w; en-GAL4 / + |
| Figure 7—figure supplement 3B, C | y w dshV26 FRT18; pCaSpeR-dsh-GFP / + y w dshV26 FRT18; pCaSpeR-dshST8-GFP / + |
Additional files
-
Transparent reporting form
- https://doi.org/10.7554/eLife.45107.031
Download links
A two-part list of links to download the article, or parts of the article, in various formats.
Downloads (link to download the article as PDF)
Open citations (links to open the citations from this article in various online reference manager services)
Cite this article (links to download the citations from this article in formats compatible with various reference manager tools)
Reciprocal action of Casein Kinase Iε on core planar polarity proteins regulates clustering and asymmetric localisation
eLife 8:e45107.
https://doi.org/10.7554/eLife.45107


