Junction Mapper is a novel computer vision tool to decipher cell–cell contact phenotypes
- National Heart and Lung Institute, National Institutes of Health, United Kingdom
- Imperial College London, United Kingdom
- Amsterdam UMC, University of Amsterdam, Netherlands
Figures
Figure 1
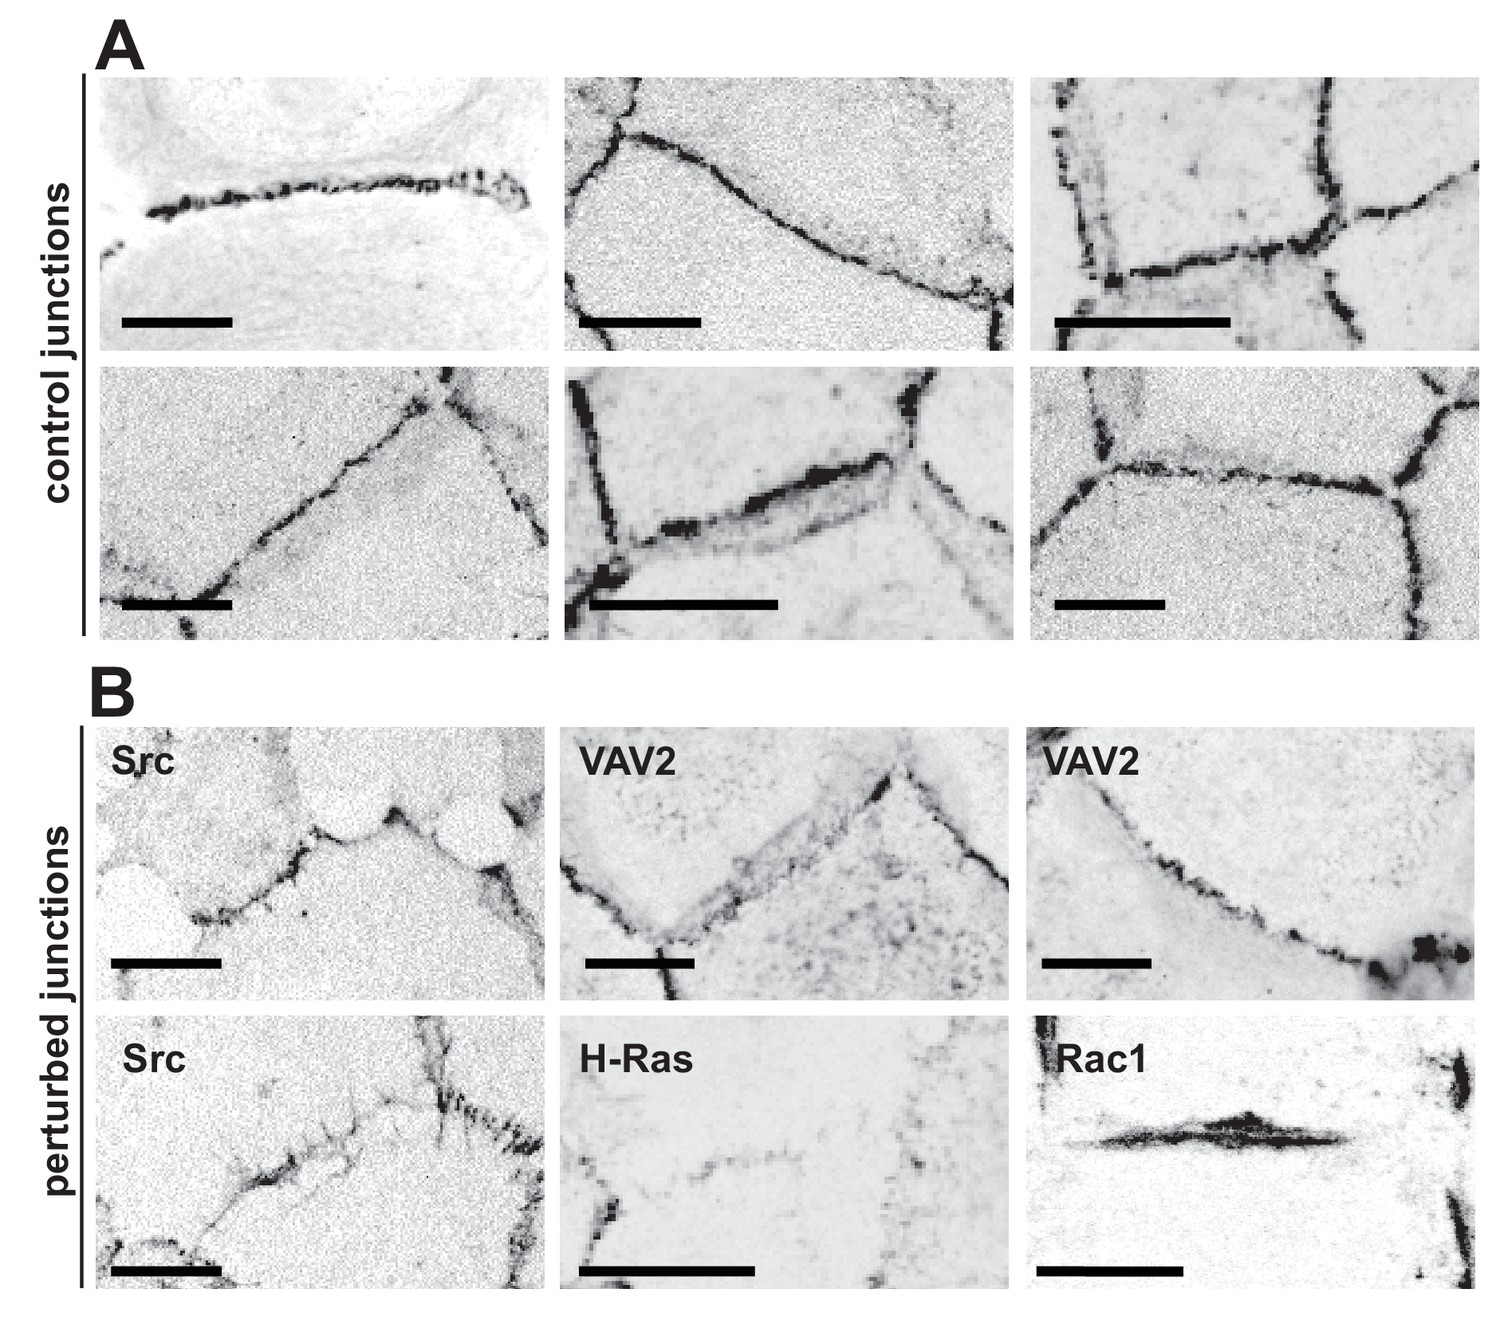
Appearance of normal and perturbed junctions.
(A) Representative images of junctions from normal epithelial cells, which are characterized by cell–cell contacts between neighbouring cells appearing as a straight line, with E-cadherin receptors uniformly distributed along the contacting interface. Junctions are delimited by corners between three or more cells, where a specialised type of contact is formed (tricellular junctions). (B) Distinct stimuli disrupt the above junction architecture in different ways, from minor reduction in levels to complete removal of adhesion receptors from contacting cells. Concomitant with changes in receptor levels, junction configuration and architecture are also compromised, alterations which are not always captured by intensity measurements. Scale bars = 10 μM.
Figure 2 with 2 supplements

Junction Mapper – overview of quantification process.
The original grey scale image stained for a junctional marker (E-cadherin) is uploaded in the program, which identifies the edge map of each cell semi-automatically to define the cell boundaries onto which measurements are made (skeleton, one pixel wide). This is superimposed onto the images to allow correction of missing boundaries and small errors interactively by the user. The image is then segmented to identify each cell to be quantified. A threshold is set to remove non-specific staining, and the skeleton is dilated (pixels) to select the area to be quantified that includes all staining at cell–cell contacts. Finally, cell corners are defined automatically or manually. Thresholded images are then quantified using the dilated mask and results are shown in Excel files as individual measurements of specific junctions as defined by the pairing of two different corners. Detailed steps are described in Figure 2—figure supplement 1 and Appendix 1.
Figure 2—figure supplement 1
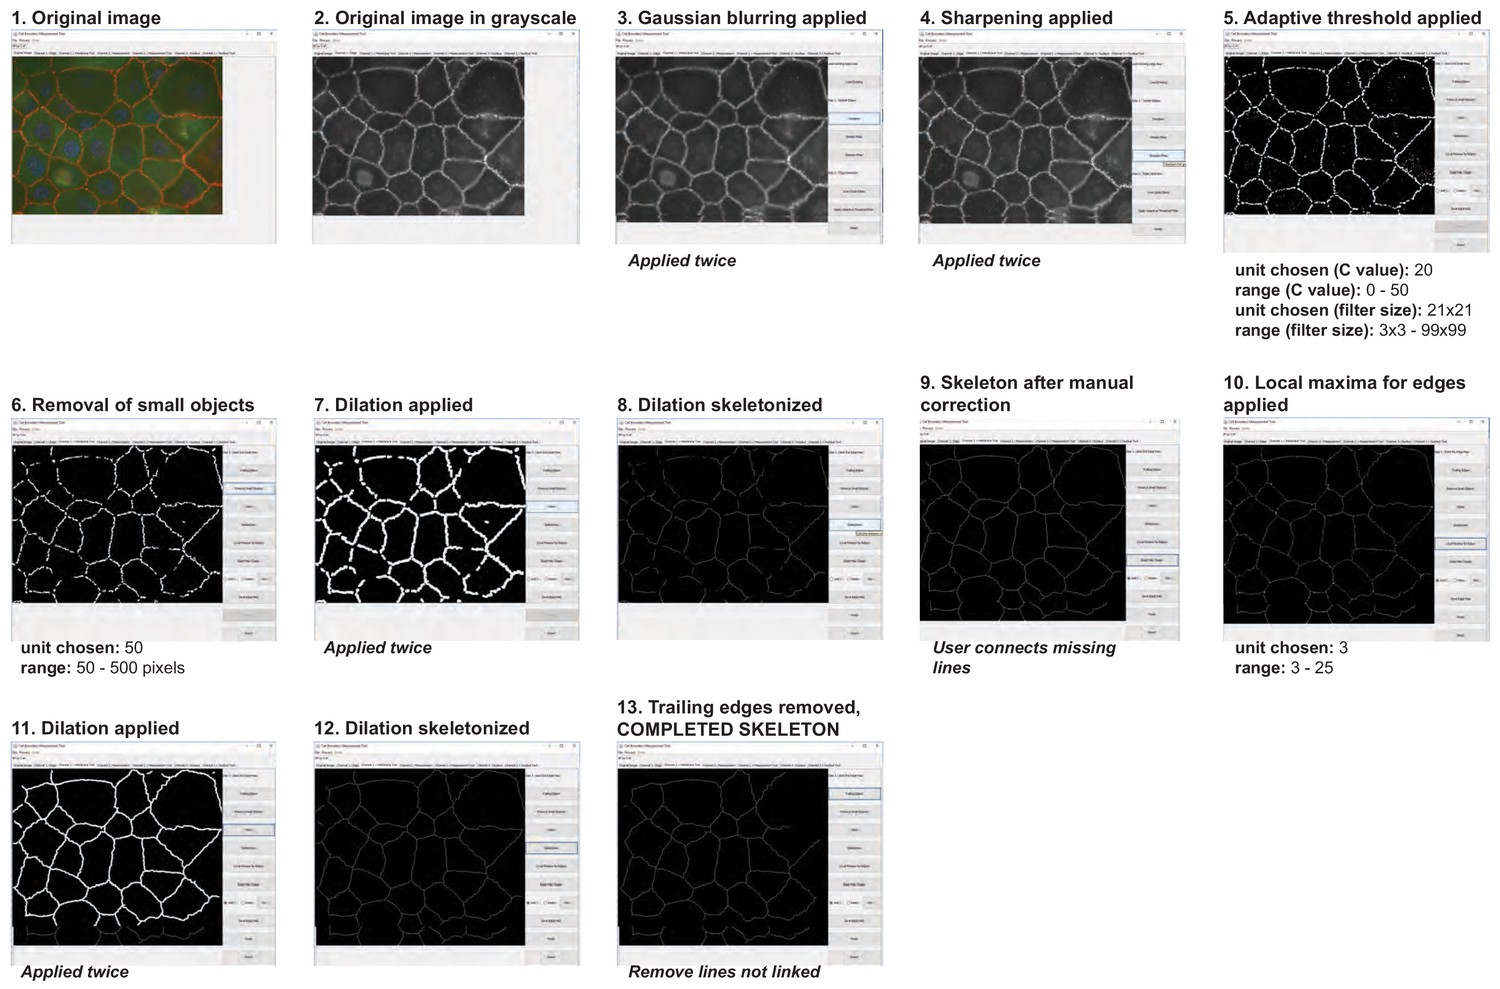
Summary of the automatic detection of cell–cell borders by Junction Mapper and user-controlled adjustments.
Snapshot images of Junction Mapper user interface showing the sequential steps (automatic and user-controlled) to obtain the edge map of cell–cell contacts in a monolayer.
Figure 2—figure supplement 2
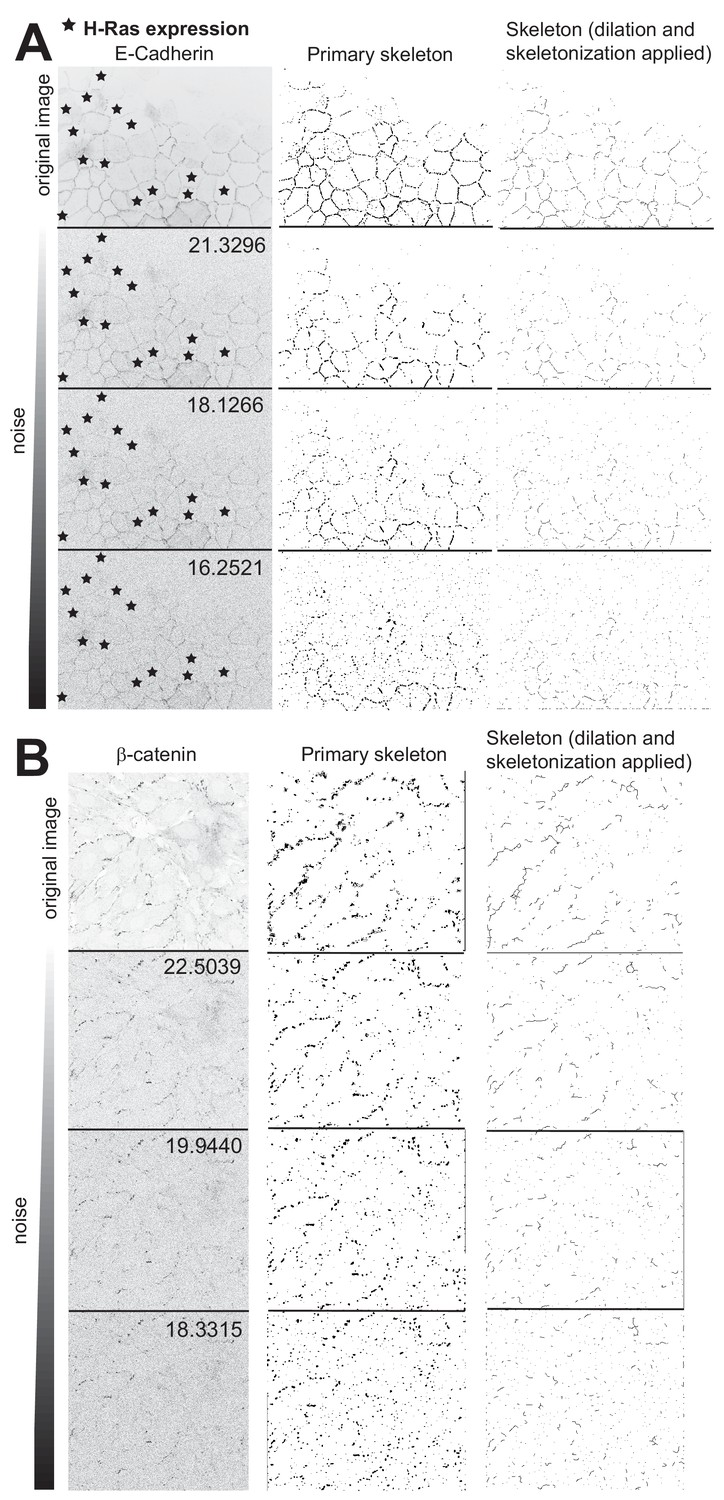
Impact of signal-to-noise on identification of the edge map.
Three different noise levels were applied to two original images (epithelial (A) or endothelial (B) monolayers) stained for E-cadherin (A) or VE-cadherin (B). The original and modified images (left column) were analysed with Junction Mapper to identify the edge map for quantification. The primary skeleton (identified automatically by the software) is shown in the middle column and the modified edge map (after dilation and erosion to a pixel-width skeleton, but without manual corrections) is shown in the right column. The peak signal to noise ratio values (PSNR) are shown on the top right of each modified image. The higher the noise in the image, the worse is the ability of the program to identify the edge map. *, denotes cells expressing activated Rac1.
-
Figure 2—figure supplement 2—source data 1
Peak Signal to Noise Ratio (PSNR) values of images with increasing noise added.
- https://cdn.elifesciences.org/articles/45413/elife-45413-fig2-figsupp2-data1-v2.xlsx
Figure 3 with 2 supplements
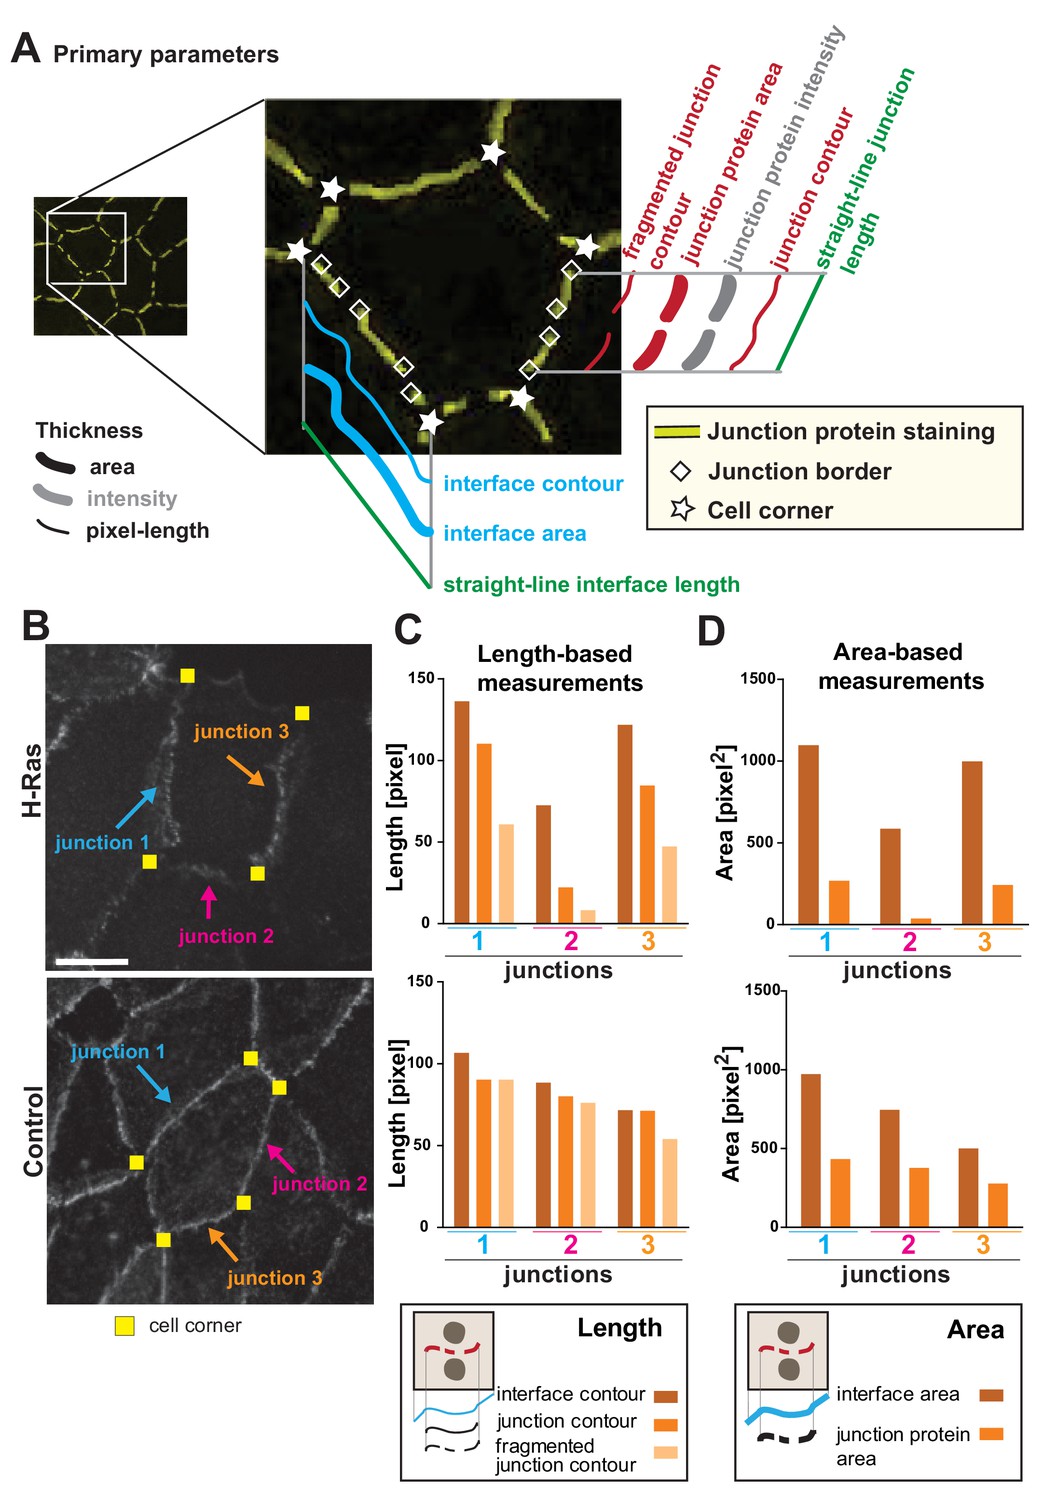
Junction Mapper – parameters.
(A) Diagram highlighting the concepts that underpin the primary parameters measured by the software. An image of a cell with a hypothetical disruption of E-cadherin at cell–cell contacts is shown: stars mark the corners delimiting each contacting interface, and rhombus shapes mark the edges of each fragment of cadherin staining that we define as junctions. In each cell, measurements are made to assess the properties of each interface (corner-to-corner) and each junction (may be adjoining or disrupted in multiple fragments): the hypothetical length (straight line interface length or Euclidian distance between two points), the contour (connection of brightest pixels along the curvature of the staining/interface) and area (defined dilated region around cell–cell borders). Intensity is also measured within the dilated area. (B-D) The primary parameters were validated to assess measurements were as predicted from their definition. Selected junctions from cells expressing activated H-Ras or controls (B) were quantified for length-based measurements (C, contours of interface, junction or fragmented junctions) or area-based measurements (D, areas of interface or junction). Diagrams at the bottom of graphs in C and D show the measurements performed. Coloured arrows point to selected junctions quantified. Each contacting interface is delimited by corners visualized by yellow squares. Scale bar = 10 μm. Detailed steps are described in Appendix 2.
-
Figure 3—source data 1
Data used to validate length- and area-based primary parameters.
- https://cdn.elifesciences.org/articles/45413/elife-45413-fig3-data1-v2.xlsx
Figure 3—figure supplement 1
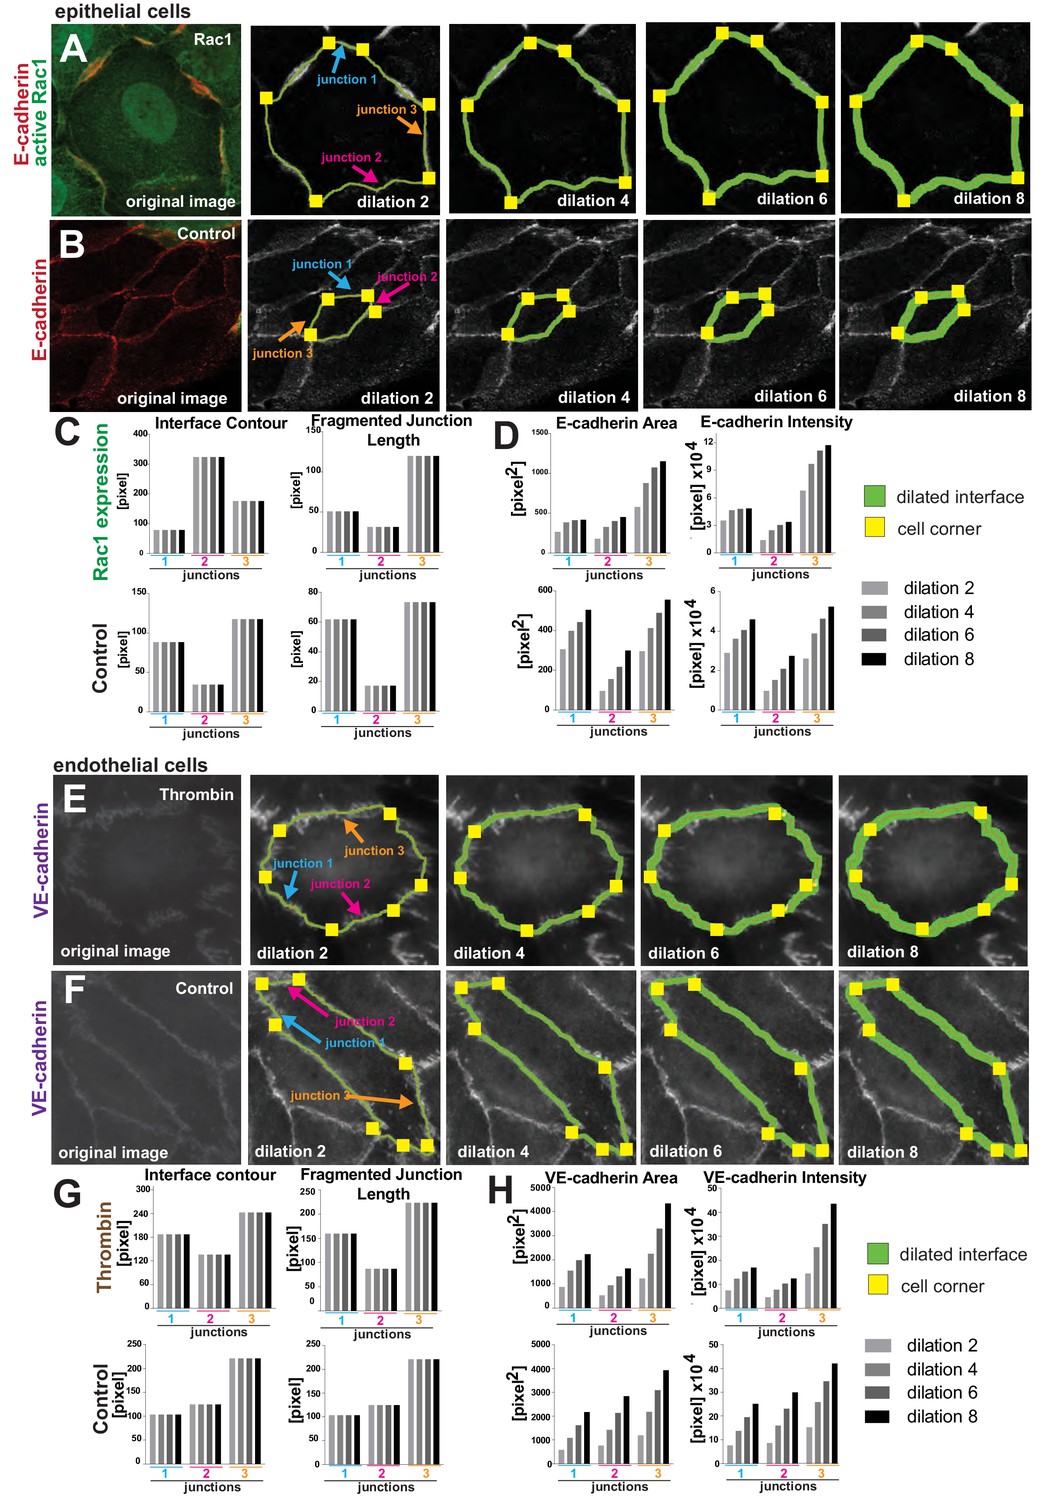
The impact of user-controlled dilation step settings on measurements.
(A-D) Epithelial cells expressing active Rac1 (A) or controls (B) were stained for cadherin receptors. Screenshots of Junction Mapper analyses shows different dilation values (green outline of different widths). Corners delimiting each contacting interface are shown as yellow squares. Selected junctions were quantified with different dilation settings and impact on primary parameters is exemplified on length-based measurements (C, Interface Contour, Fragmented Junction Length) and area-based parameters (D, E-cadherin Area, E-cadherin intensity). Increasing the dilation values modifies the area-based (D) but not the length-based measurements (C). (E-H) Similar analyses were performed on images of endothelial cells treated with thrombin (E) or controls (F) and corresponding graphs show the primary parameters quantifications (G,H). Junction undulation caused by thrombin treatment is not captured by the edge map, which is seen as a comparatively straight line (G). Larger dilation values obtained higher VE-cadherin area measurements at the undulated contacts (H). Values obtained are from selected junctions shown and under the different conditions applied.
-
Figure 3—figure supplement 1—source data 1
Data to validate the impact of user-controlled dilation settings.
- https://cdn.elifesciences.org/articles/45413/elife-45413-fig3-figsupp1-data1-v2.xlsx
Figure 3—figure supplement 2
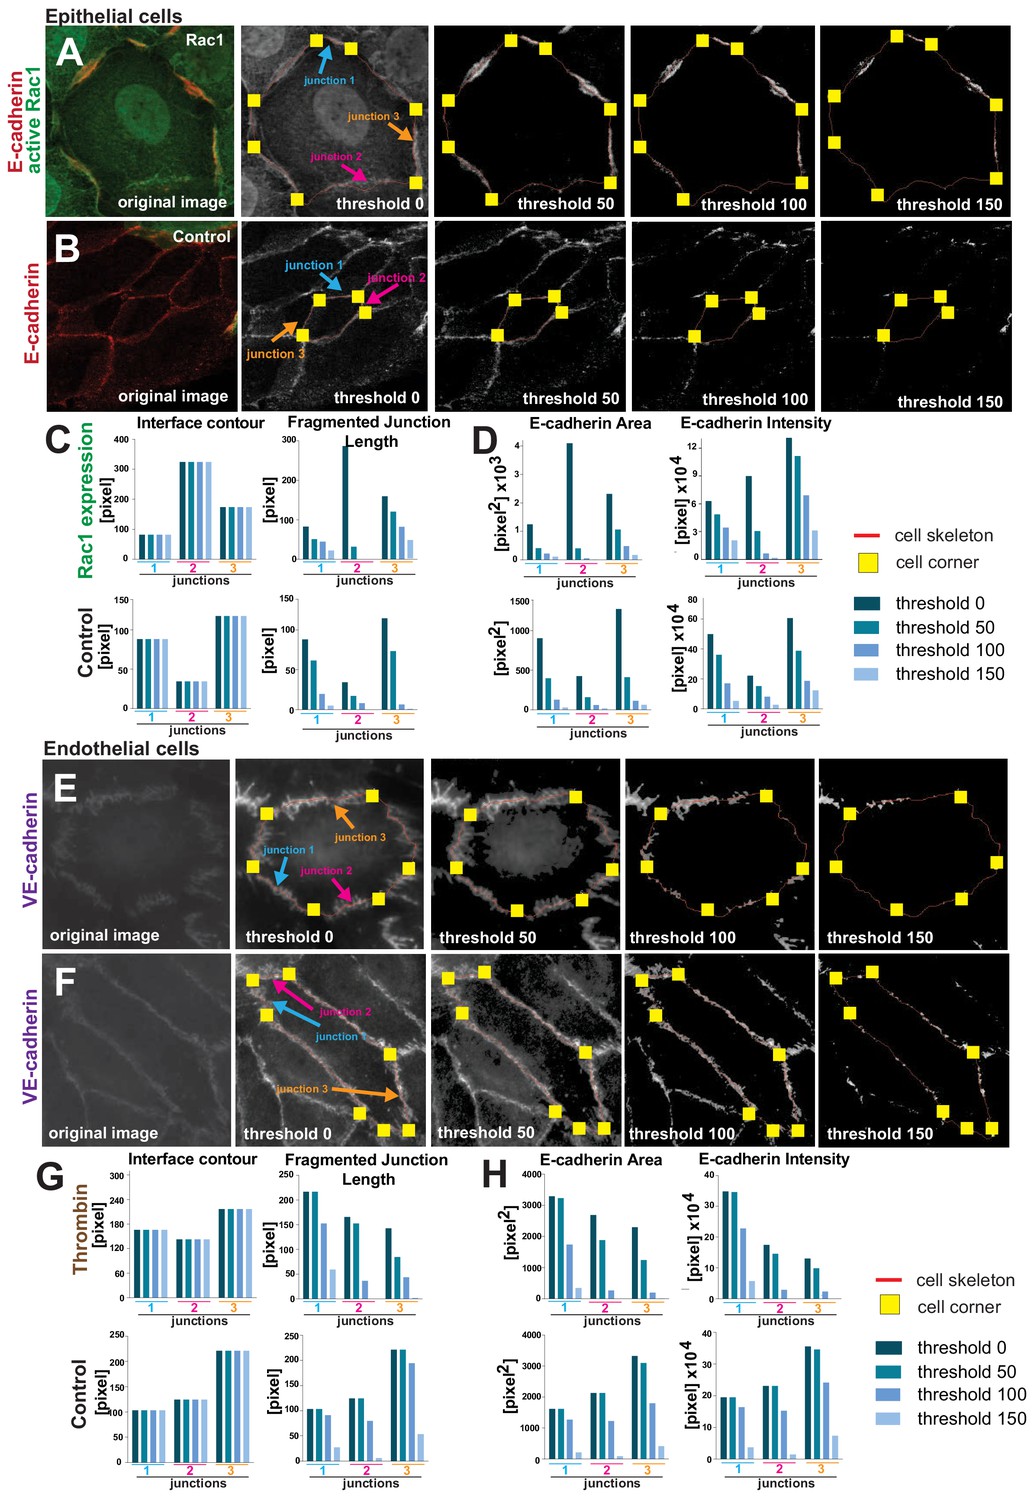
The impact of user-controlled thresholding settings on measurements.
(A-D) Epithelial cells expressing active Rac1 (A) or controls (B) were stained for E-cadherin receptors. Screenshots of Junction Mapper analyses shows different thresholding values (0–150). Skeletons are shown as a pixel-width red line and corners delimiting each contacting interface are seen as yellow squares. Selected junctions were quantified with the different settings and impact on primary parameters are shown for the length-based measurements (C, Interface Contour, Fragmented Junction Length) and area-based parameters (D, E-cadherin Area, E-cadherin intensity). Increasing thresholding levels did not interfere with interface contour length, as it is defined by the position of corners (C). The fragmented junction length was reduced by increasing thresholding (C), similar to what was observed with the E-cadherin area and intensity (D). (E-H) Similar analyses and results were obtained from VE-cadherin staining images of endothelial cells treated with thrombin (E) or controls (F) and corresponding graphs show the primary parameters quantifications (G,H). Values obtained are from selected junctions shown and under the different conditions applied.
-
Figure 3—figure supplement 2—source data 1
Data to validate the impact of user-controlled thresholding settings.
- https://cdn.elifesciences.org/articles/45413/elife-45413-fig3-figsupp2-data1-v2.xlsx
Scheme 1

Secondary parameters.
(A) Novel parameters were defined to normalise the quantifications with respect to the area or length of contacts. The secondary parameters assess the configuration of the contacting interface (Interface Linearity Index), how much the staining of a junction marker occupies the interface length (Coverage Index) or area (Interface Occupancy). The distribution of junction marker is measured in two ways: their intensity levels within the area occupied by the junction fragments (Cluster Density) or the contacting interface (E-cadherin intensity at interface area). Detailed information of the calculation of parameters is described in Appendix 2. (B-D) Reproducibility of quantification by Junction Mapper in independent biological replicates. (B) Keratinocytes expressing activated Rac1 (green) or controls (non-expressing cells) were stained for E-cadherin (blue). (C-D) Images obtained from two independent biological replicates (replicate 1 and replicate 2) were processed to obtain the secondary parameters Coverage Index (C) or Interface Occupancy (D). Numbers at the top inside graphs show the number of junctions quantified in each sample from two biological replicates (N = 2); ns, non-significant. Arrowheads point to residual E-cadherin staining; thick arrow shows lack of cadherin staining. Scale bar = 20 μM.
Figure 4 with 1 supplement

Primary parameters quantification of H-Ras-dependent junction perturbation.
(A) Human normal keratinocytes were transfected with pRK5-myc-H-RasG12V, fixed and stained with anti-E-cadherin and anti-myc antibodies. Images are shown of E-cadherin staining and myc staining as a marker of transfected cells. Coloured rectangles mark areas shown as a zoom on the left of the images and highlight control junctions (orange), junctions between expressing and non-expressing cells (en, purple) or between two transfected cells (ee, red). Arrowheads point to E-cadherin staining. (B-F) Quantification of the primary parameters using Junction Mapper. Graphs are plotted showing values of each parameter (Y axis) versus different junction types (X-axis). The parameter name is at the top of each graph and a diagram representing the quantification is shown on the left of its corresponding graph. Data is from one experiment (technical replicate) and the number of junctions analysed for each condition is found at the bottom of the graphs, below each scatter box plot. Statistical analysis was performed using One-way ANOVA, followed by Games-Howell post-hoc test. Non-significant (ns) and significant p-values (<0.05) are placed inside graphs. Scale bar = 20 μM or 10 μM (zoom images).
-
Figure 4—source data 1
Primary parameters data to prepare Figure 4B-F.
- https://cdn.elifesciences.org/articles/45413/elife-45413-fig4-data1-v2.xlsx
Figure 4—figure supplement 1
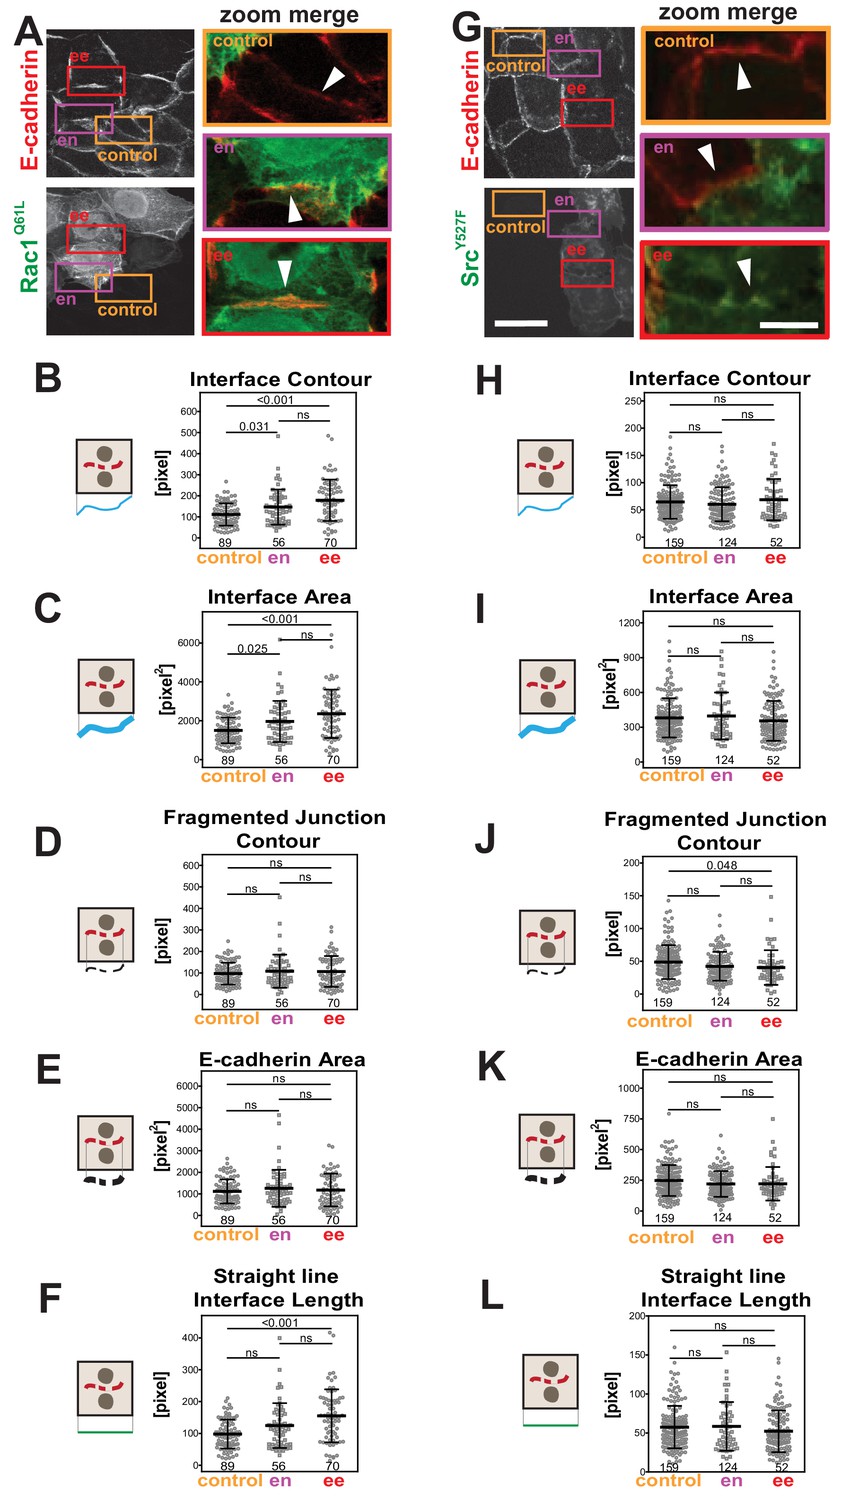
Primary parameters quantification of junction perturbation by activated Rac1 or activated Src.
(A, G) Human normal keratinocytes expressing myc-Rac1Q61L or GFP-SrcY527F were fixed and stained with anti-E-cadherin antibodies. Images are shown of E-cadherin staining and GFP or myc as a marker of expressing cells. Coloured rectangles mark areas shown as a zoom on the left of the images and highlight control junctions (orange), junctions between expressing and non-expressing cells (en, purple) or between two transfected cells (ee, red). Arrowheads point to E-cadherin staining. (B-F), (H-L) Quantification of the primary parameters using Junction Mapper. Graphs are plotted showing values of each parameter (Y axis) versus different junction types (X-axis). The parameter name is at the top of each graph and a diagram representing the quantification is shown on the left of its corresponding graph. Technical replicates (Rac1) or biological replicates (Src, N = 2) were quantified. Number of junctions analysed in each condition is found at the bottom of the graphs, below each scatter plot. Statistical analysis was performed using One-way ANOVA, followed by Games-Howell post-hoc test. Non-significant (ns) and significant p-values (<0.05) are placed inside graphs. Scale bar = 20 μM or 10 μM (zoom images).
-
Figure 4—figure supplement 1—source data 1
Primary parameter data for activated Rac1 and Src.
- https://cdn.elifesciences.org/articles/45413/elife-45413-fig4-figsupp1-data1-v2.xlsx
Figure 5
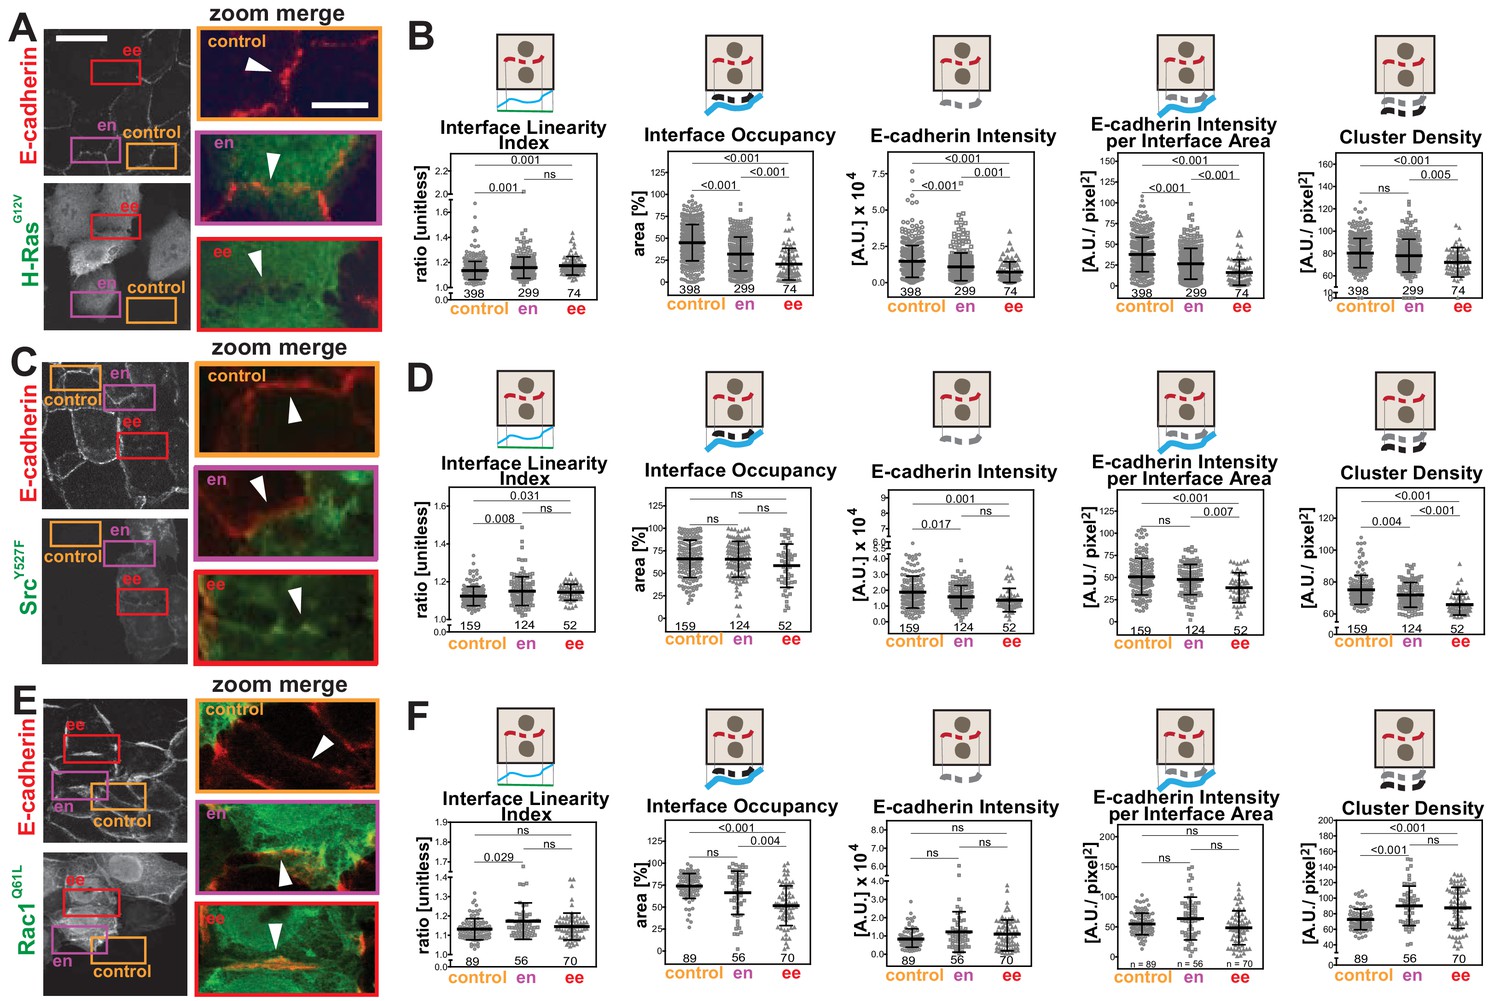
Distinct profiles of junction disruption by oncogenes.
Human normal keratinocytes were transfected with pRK5-myc-H-RasG12V (A), pEGFP-SrcY527F (C) or pRK5-myc-Rac1Q61L (E). Cells were fixed and stained with anti-E-cadherin and, for (A) and (E), anti-myc antibodies. Images are shown of E-cadherin and transfected cells (anti-myc or GFP). Coloured rectangles mark areas shown as a zoom on the left of the images and highlight control junctions (orange), junctions between expressing and non-expressing cells (en, purple) or between two transfected cells (ee, red). Arrowheads point to E-cadherin staining. (B, D, F) Quantification of different parameters obtained with Junction Mapper. Graphs are plotted to show values of each parameter (Y-axis) versus different junction types (X-axis) for H-RasG12V (B), SrcY527F (D) and Rac1Q61L (F). The parameter name and a diagram representing the quantification are shown on top of each graph. Technical (H-Ras, Rac1) or biological replicates (Src, N = 2) were analysed. Number of junctions quantified in each condition is shown at the bottom of the graphs, below each scatter box plot. Statistical analysis was performed using One-way ANOVA, followed by Games-Howell post-hoc test. Non-significant (ns) and significant p-values (<0.05) are placed inside graphs. Scale bar = 20 μM or 10 μM (zoom images).
-
Figure 5—source data 1
Secondary parameter data on oncogenic junction disruption used for Figure 5 graphs.
- https://cdn.elifesciences.org/articles/45413/elife-45413-fig5-data1-v2.xlsx
Scheme 2
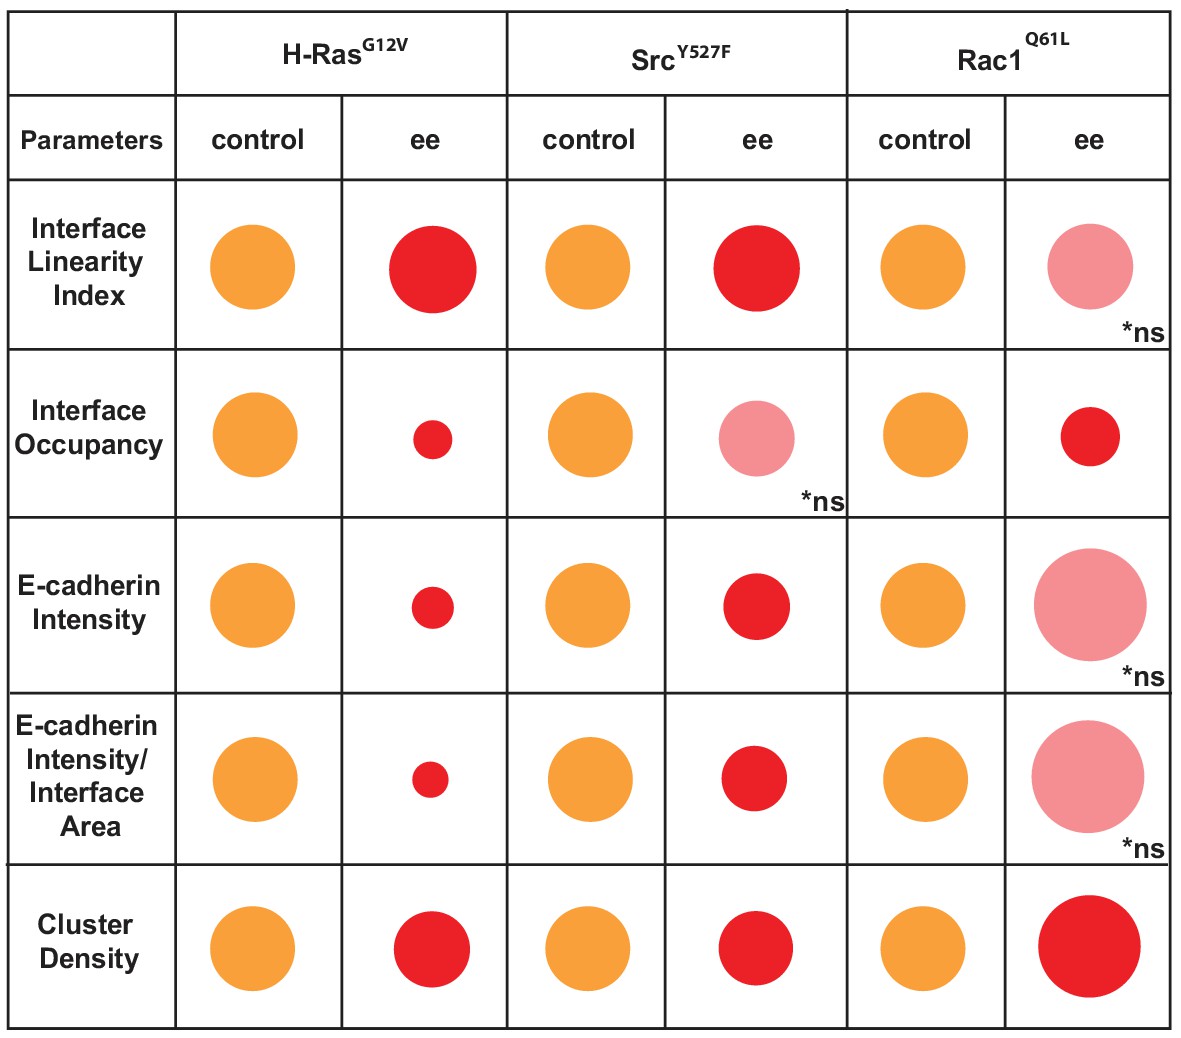
Overview of different profiles of junction disruption caused by expression of oncogenic Ras, Src or Rac1.
Different parameters are normalised to controls (junctions from non-expressing cells) arbitrarily set as 100 (orange colour). Values are represented as circles of proportional sizes for junctions between two expressing cells (red colour). Non-significant values are shown in pink colour (ns).
Figure 6
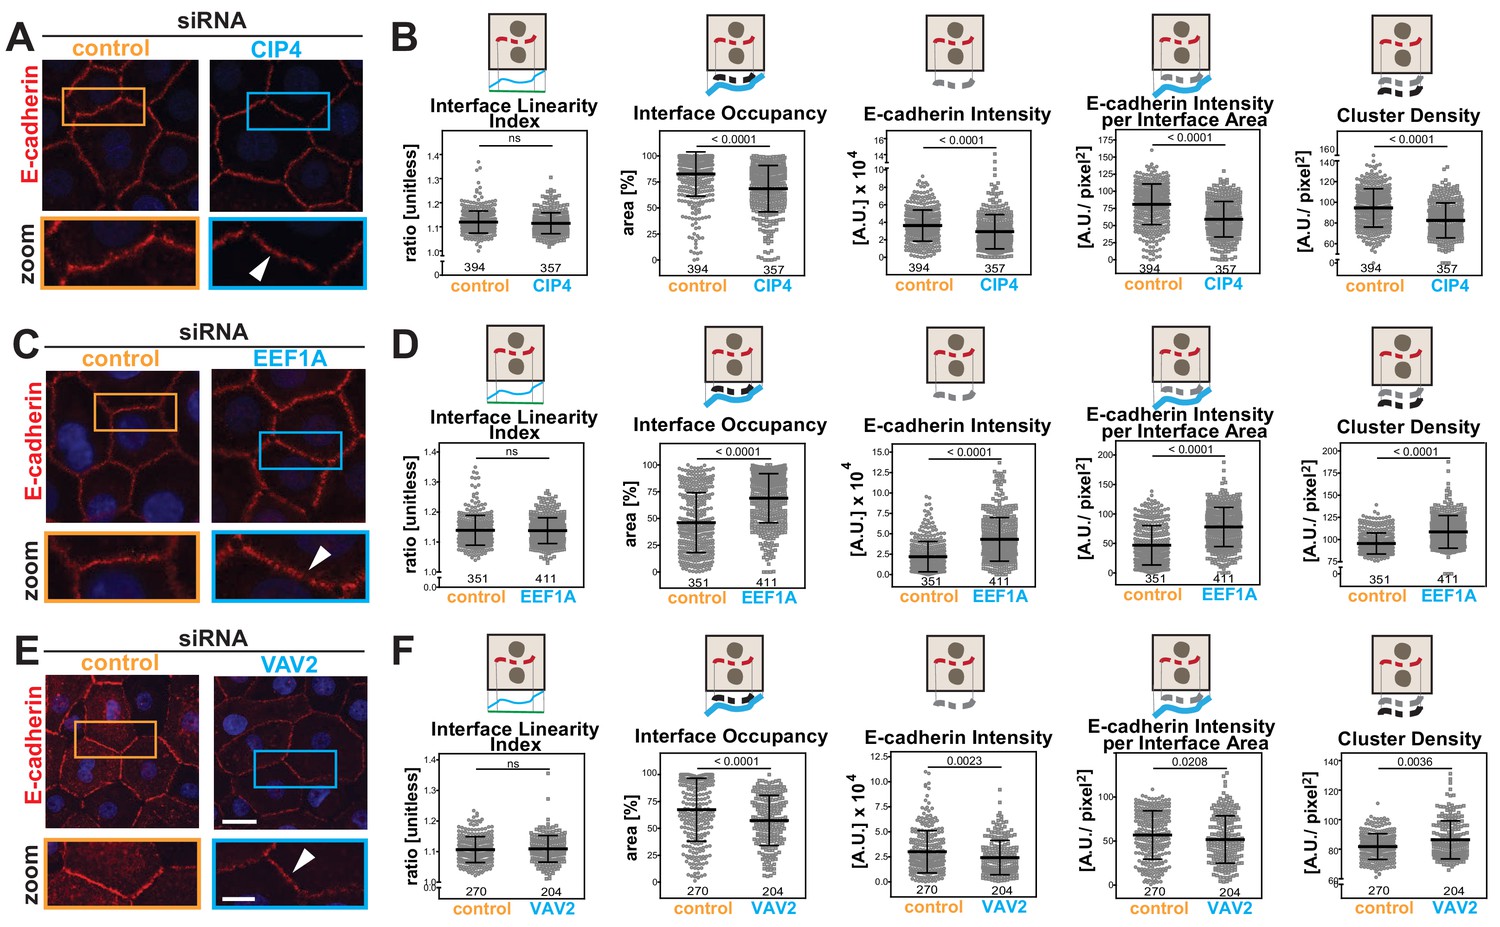
Junction Mapper reliably quantifies mild phenotypes.
(A) Human normal keratinocytes were depleted of different cytoskeleton-associated proteins using siRNA against CIP4 (A), EEF1A (C) or VAV2 (E). Cells were fixed and stained for E-cadherin, and images acquired for control (non-targeting oligos) and depleted cells. Areas marked by coloured rectangles are shown as a zoom underneath the images. Arrowheads point to E-cadherin staining. (B, D, F) Quantification of different parameters obtained with Junction Mapper. Graphs are plotted with values on the Y-axis and control and siRNA samples on the X-axis for CIP4 (B), EEF1A (D) and VAV2 (F). The parameter name and a diagram representing the quantification are shown on top of each graph. Junctions analysed in each condition were obtained from technical replicates and numbers assessed is shown at the bottom of the graphs, below each scatter box plots. Statistical analysis was performed using Mann-Whitney U-test. Non-significant (ns) and significant p-values (<0.05) are placed inside graphs. Scale bar = 20 μM or 10 μM (zoom images).
-
Figure 6—source data 1
Data from siRNA experiments used in graphs in Figure 6B, D and F.
- https://cdn.elifesciences.org/articles/45413/elife-45413-fig6-data1-v2.xlsx
Scheme 3
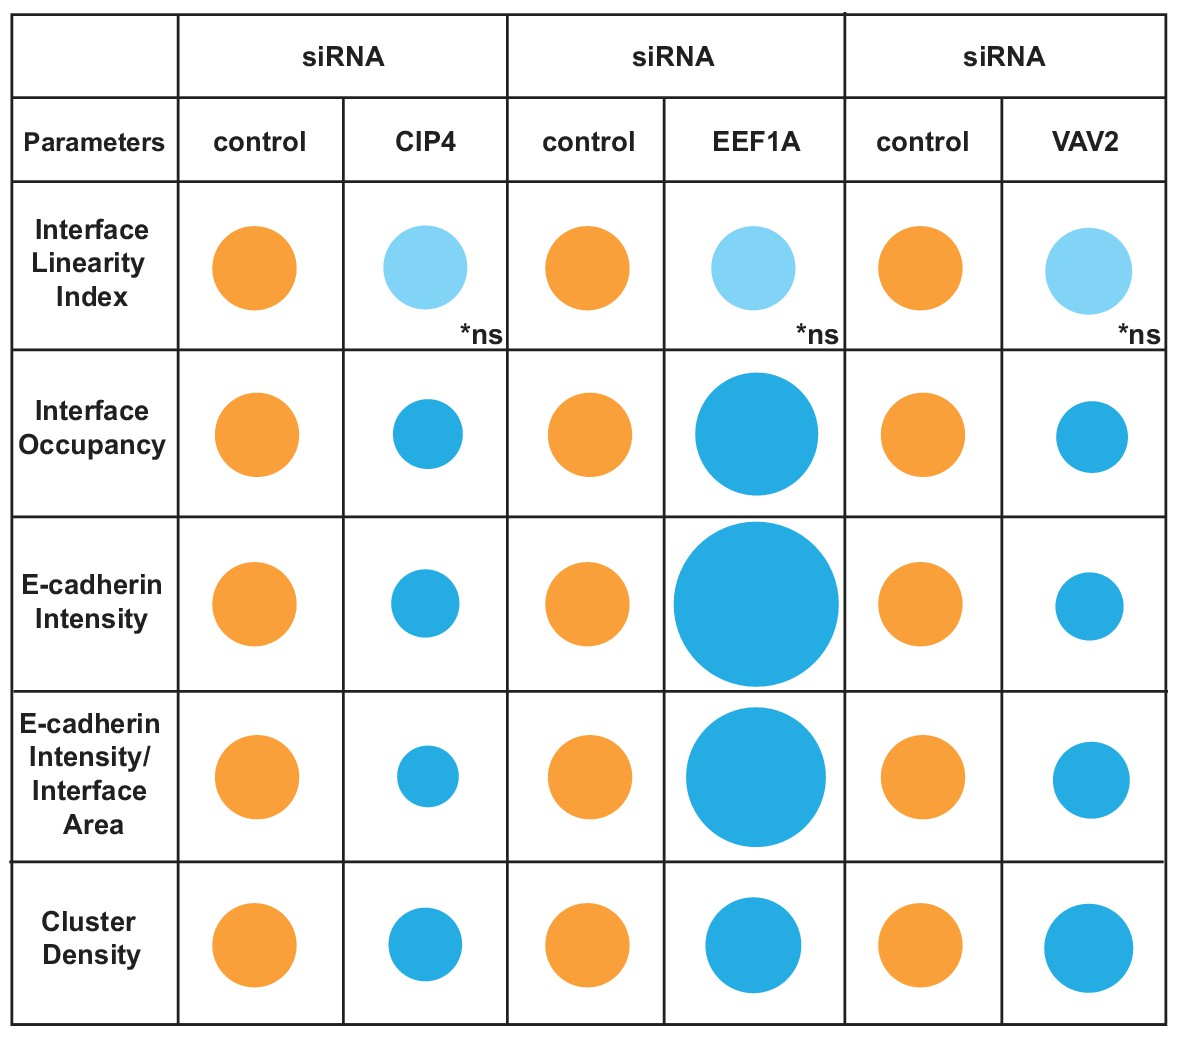
Overview of different profiles of junction disruption following depletion of CIP4, EEF1A or VAV2.
Different parameters are normalised to controls (junctions from cells treated with non-targeting oligos) arbitrarily set as 100 (orange colour). Values are represented as circles of proportional sizes for targeting siRNA-treated samples (blue colour) relative to controls. Non-significant values are shown in light blue colour (ns).
Figure 7 with 1 supplement
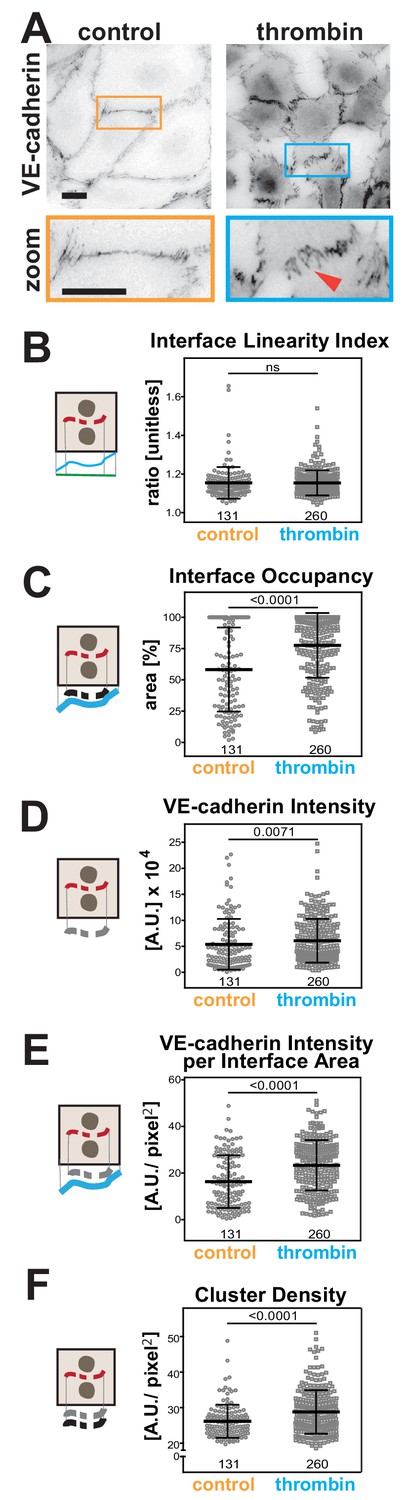
Quantification of endothelial junction alterations triggered by thrombin stimulation.
(A) HUVEC were treated with thrombin for 10 min, fixed and stained for VE-cadherin as a marker of endothelial contacts. Inverted images and a zoom are shown. Arrowheads show VE-cadherin staining. (B-F) Quantification of different parameters obtained with Junction Mapper. Graphs are plotted with values on the Y-axis and samples (control or thrombin-treated) on the X-axis. The parameter name is shown on top of each graph and a diagram representing the quantification on the left of each graph. Number of junctions analysed in each condition is shown at the bottom of the graphs, below each scatter box plots. Junctions were obtained from biological replicates (N = 2). Statistical analysis was performed using Mann-Whitney U-test. Non-significant (ns) and significant p-values (<0.05) are placed inside graphs. Scale bar = 20 μM or 10 μM (zoom images).
-
Figure 7—source data 1
Data from endothelial cell stimulation used in graphs in Figure 7B–F.
- https://cdn.elifesciences.org/articles/45413/elife-45413-fig7-data1-v2.xlsx
Figure 7—figure supplement 1
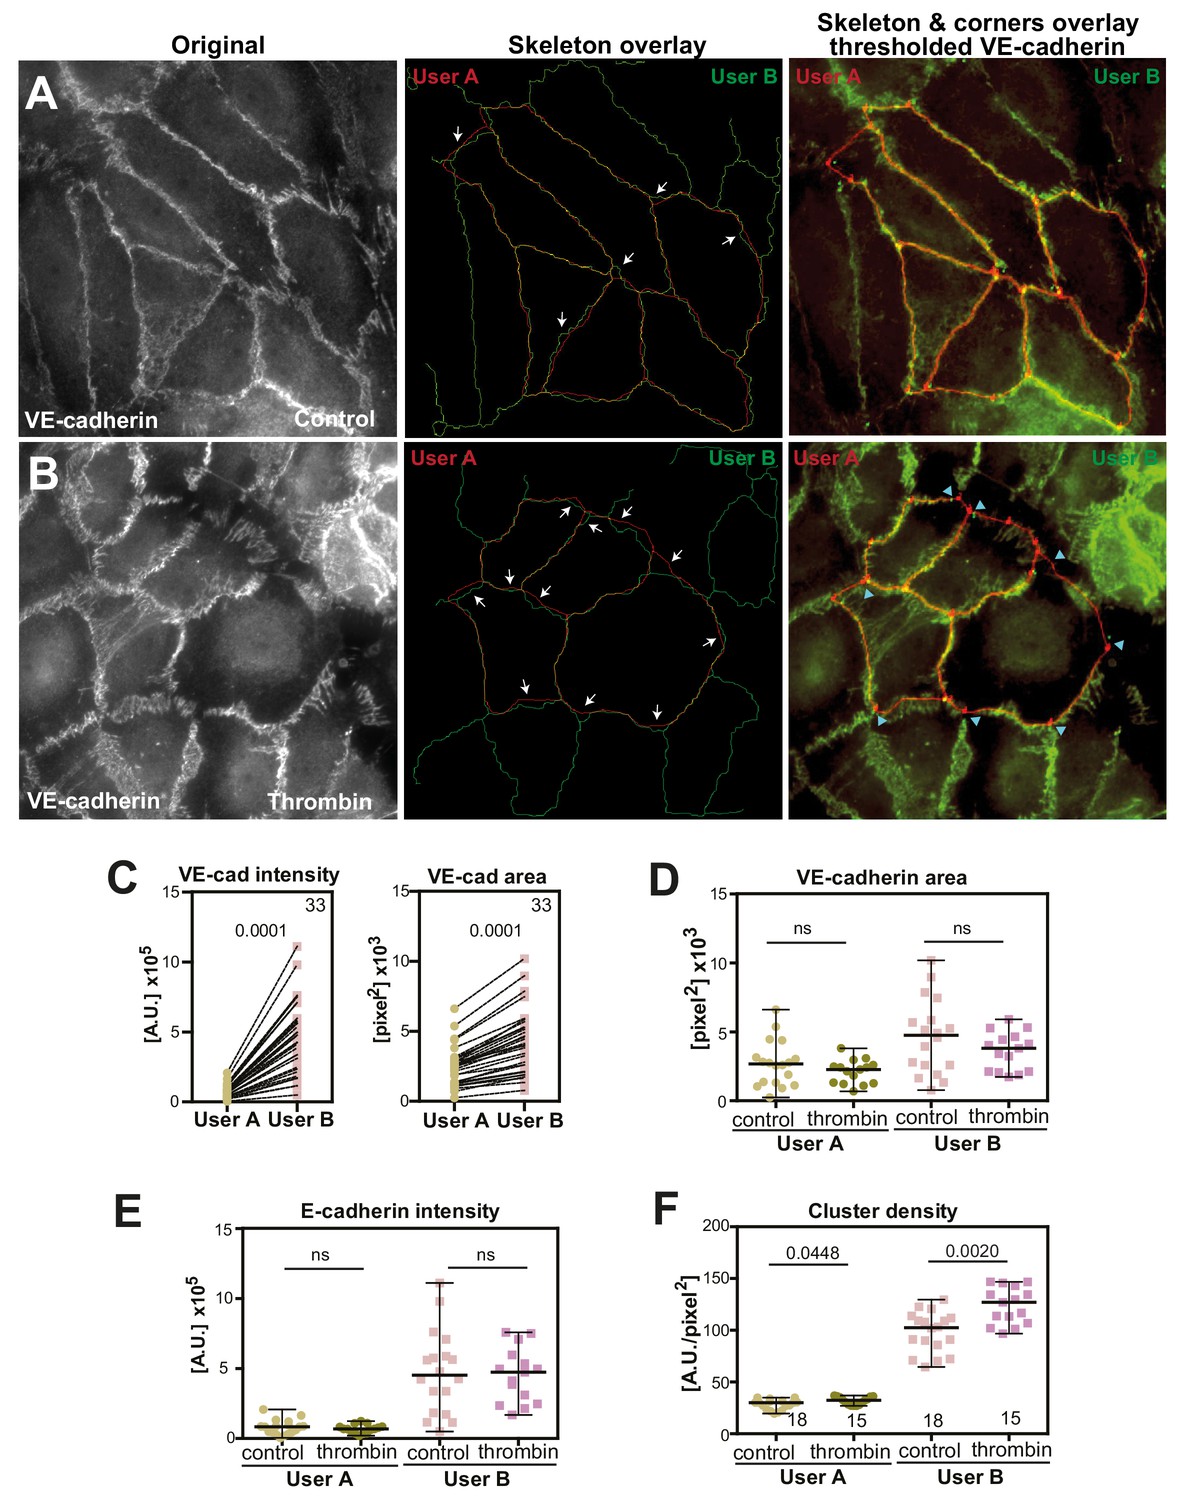
Impact of different users on Junction Mapper quantification of endothelial junctions.
(A-B) Representative images of a selected subset of endothelial cells stained for VE-cadherin (first column) were processed by two users independently (user A and user B), setting up the skeleton, corners, dilation, thresholding values. Middle column show the overlay of the skeletons obtained by user A and user B; arrows point to misaligned regions. Last column shows the overlay of added corners to the skeleton. Blue arrowheads show corners that are not co-localized. (A) Control non-stimulated endothelial cells. (B) Endothelial cells treated with thrombin. (C) Pairwise comparison of individual junction values of primary parameters obtained by user A (dilation 6, threshold 16) and user B (dilation 7, threshold 50). (D-F) Graphs of selected parameters obtained from the analyses by user A or user B. The overall result and profile comparing control and treated samples from each user is similar, although, because of the lower number of junctions in each sample, not all comparisons reached significance. Values obtained are from the number of junctions shown on the top right of graphs (panel C) and, for panels D-F, numbers are shown below the scatter plots for each condition and user inside the graph in panel F. Statistical analyses were performed by Wilcoxson matched-pairs signed rank test (C) or Mann-Whitney test (D-F).
-
Figure 7—figure supplement 1—source data 1
Impact of user-bias on Junction Mapper quantification of endothelial junctions.
- https://cdn.elifesciences.org/articles/45413/elife-45413-fig7-figsupp1-data1-v2.xlsx
Figure 8
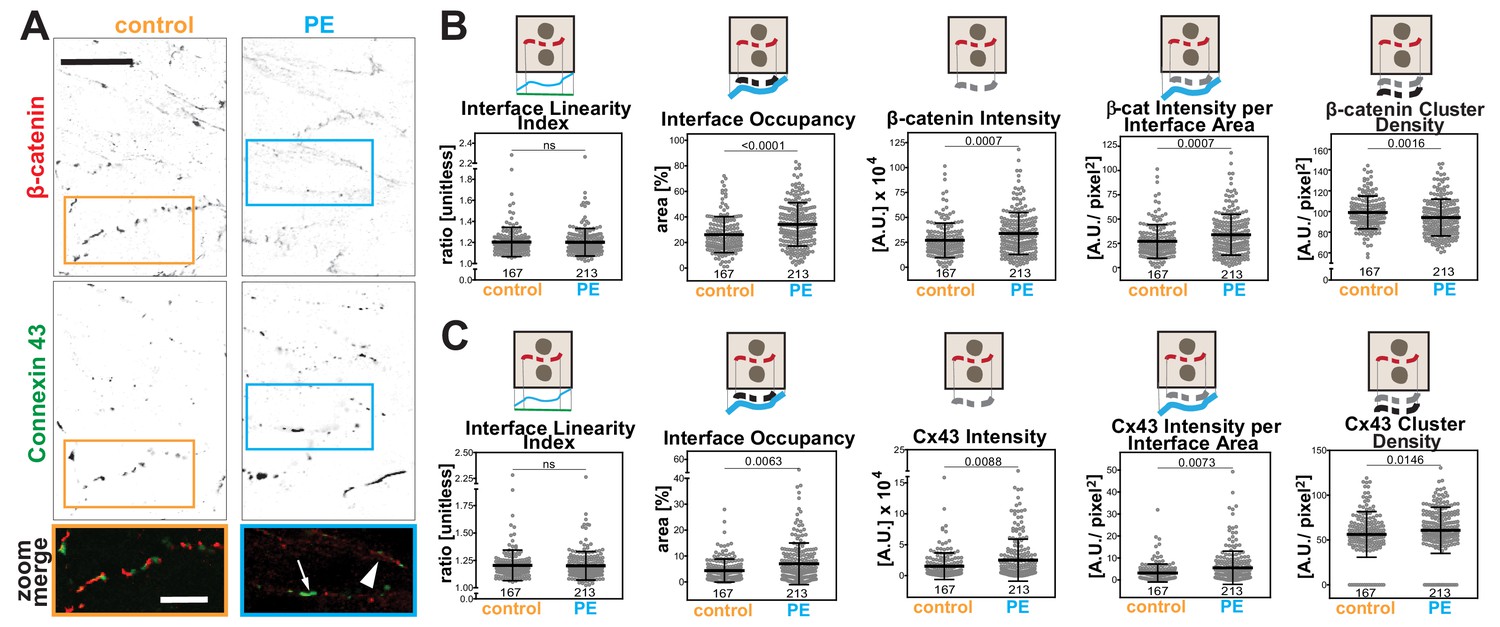
Hypertrophic stimulus of cardiomyocytes promotes distinct responses of Connexin 43 and β-catenin at intercalated discs.
(A) Rat neonatal cardiomyocytes were stimulated with phenylephrine for 48 hr and stained with anti-β-catenin or anti-connexin 43 antibodies. Inverted images for each marker and a zoom of merged staining are shown. The arrowhead points to β-catenin staining and the arrow shows connexin 43 clusters. (B-C) Images were processed with Junction Mapper and quantification of selected parameters is shown here for β-catenin (B) or connexin 43 (C). Diagrams on top of each graph summarize how each parameter was measured. Values were obtained from one technical replicate. Number of junctions analysed in each condition is shown below each scatter box plot. Statistical analysis was performed using Mann-Whitney U-test. Non-significant (ns) and significant p-values (<0.05) are placed inside graphs. Scale bar = 10 μM.
-
Figure 8—source data 1
Data obtained from cardiomyocyte experiments used in Figure 8 graphs.
- https://cdn.elifesciences.org/articles/45413/elife-45413-fig8-data1-v2.xlsx
Scheme 4
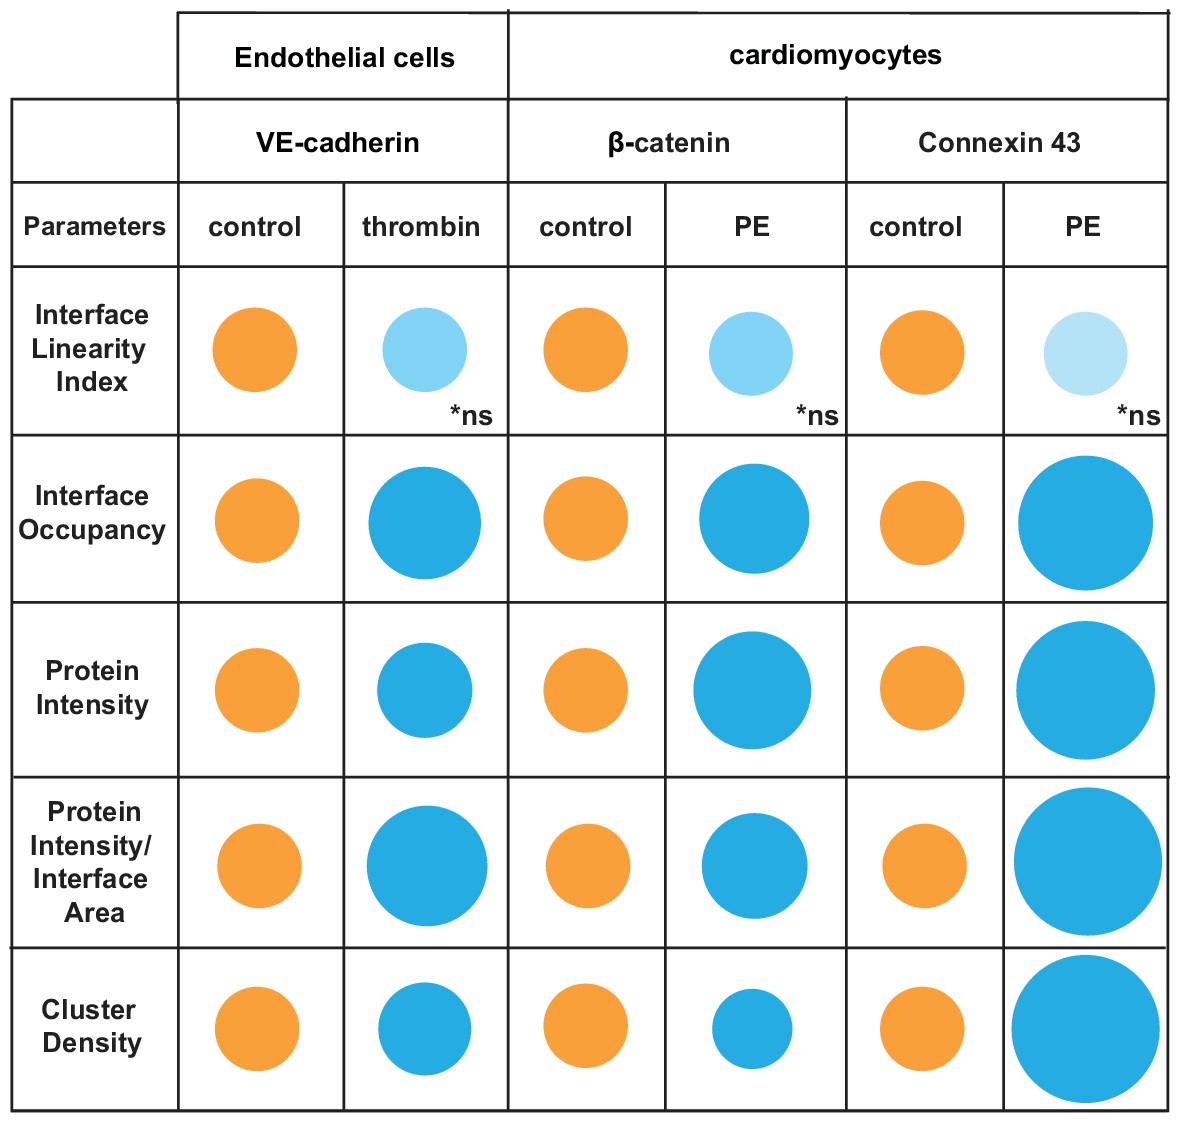
Overview of distinct changes of cell–cell adhesion in thrombin-stimulated endothelial cells or hypertrophic cardiomyocytes.
Endothelial cells (HUVEC) were treated with thrombin and cardiomyocytes stimulated with phenylephrine (PE) to induce permeability or hypertrophy, respectively. Parameters are normalised to controls (junctions from untreated cells) arbitrarily set as 100 (orange colour). Values are represented as circles of proportional sizes for junctions from stimulated cells (blue colour). Non-significant values are shown in light blue colour (ns).
Appendix 1—figure 1
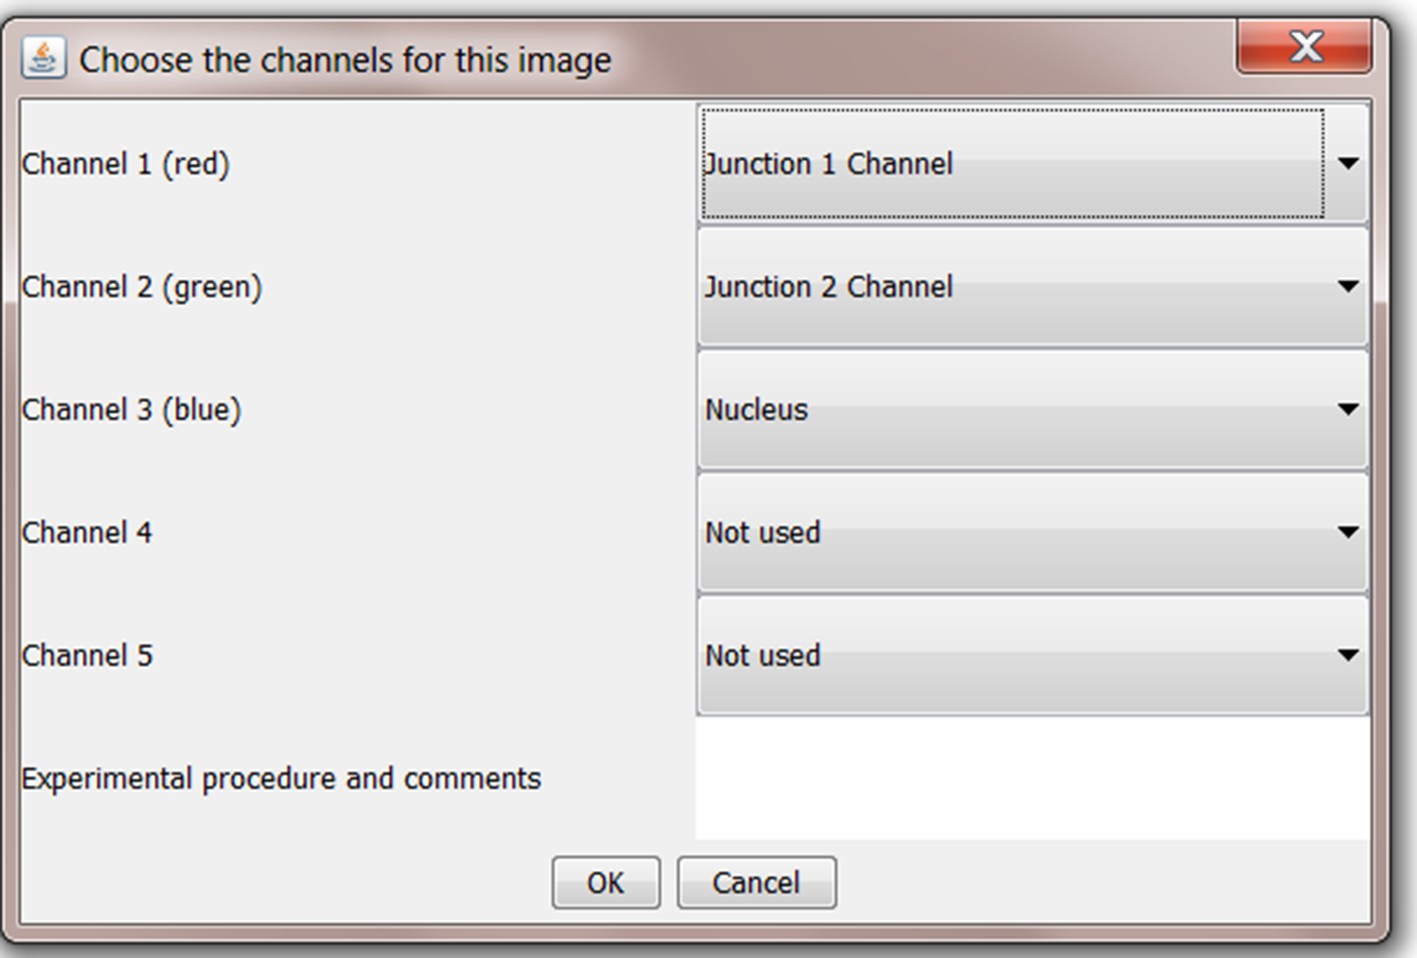
Screenshot of allocation of image channels to selected analyses components for processing.
Appendix 1—figure 2
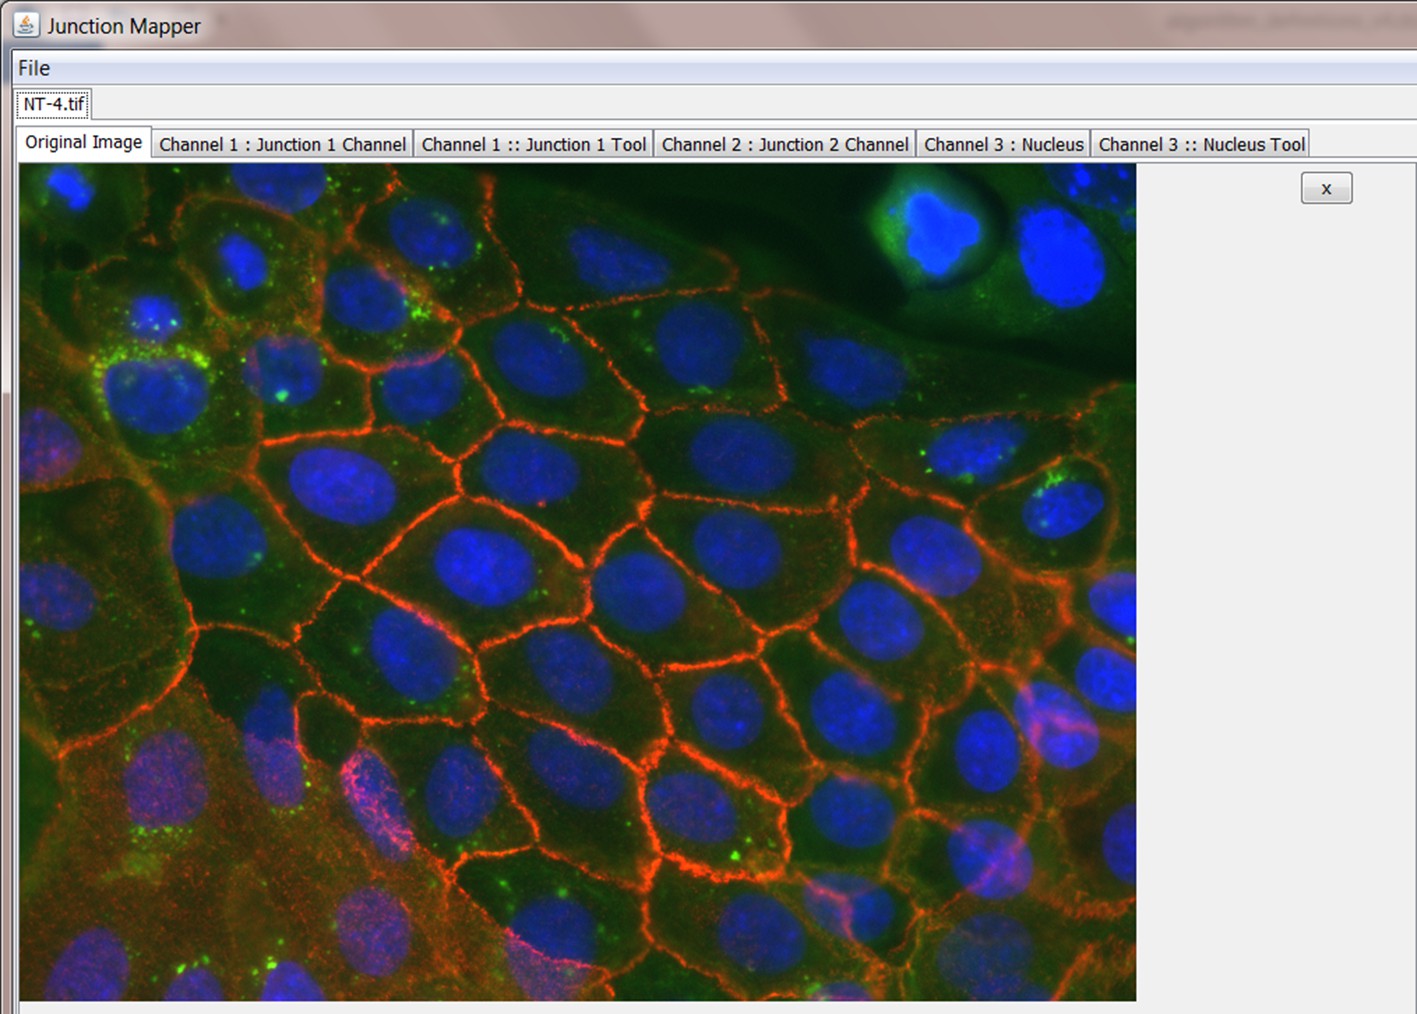
Screenshot showing loaded merged image and corresponding tabs for analyses.
Appendix 1—figure 3
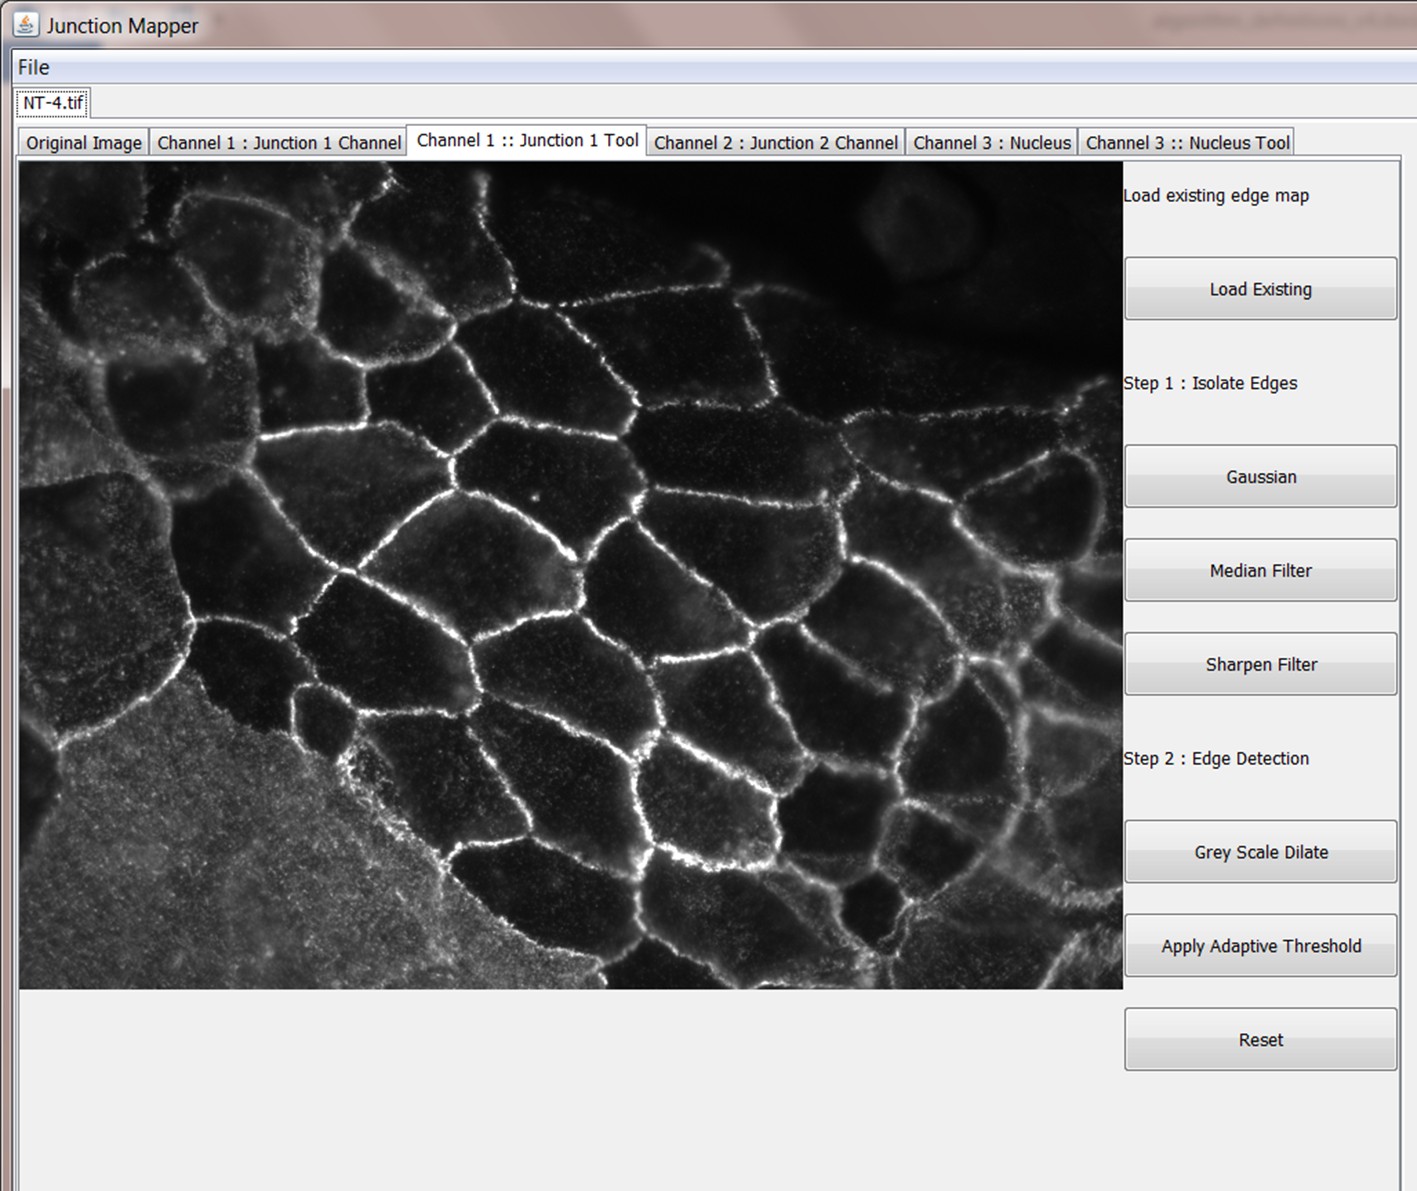
Screenshot of the edge detection function main menu.
Appendix 1—figure 4
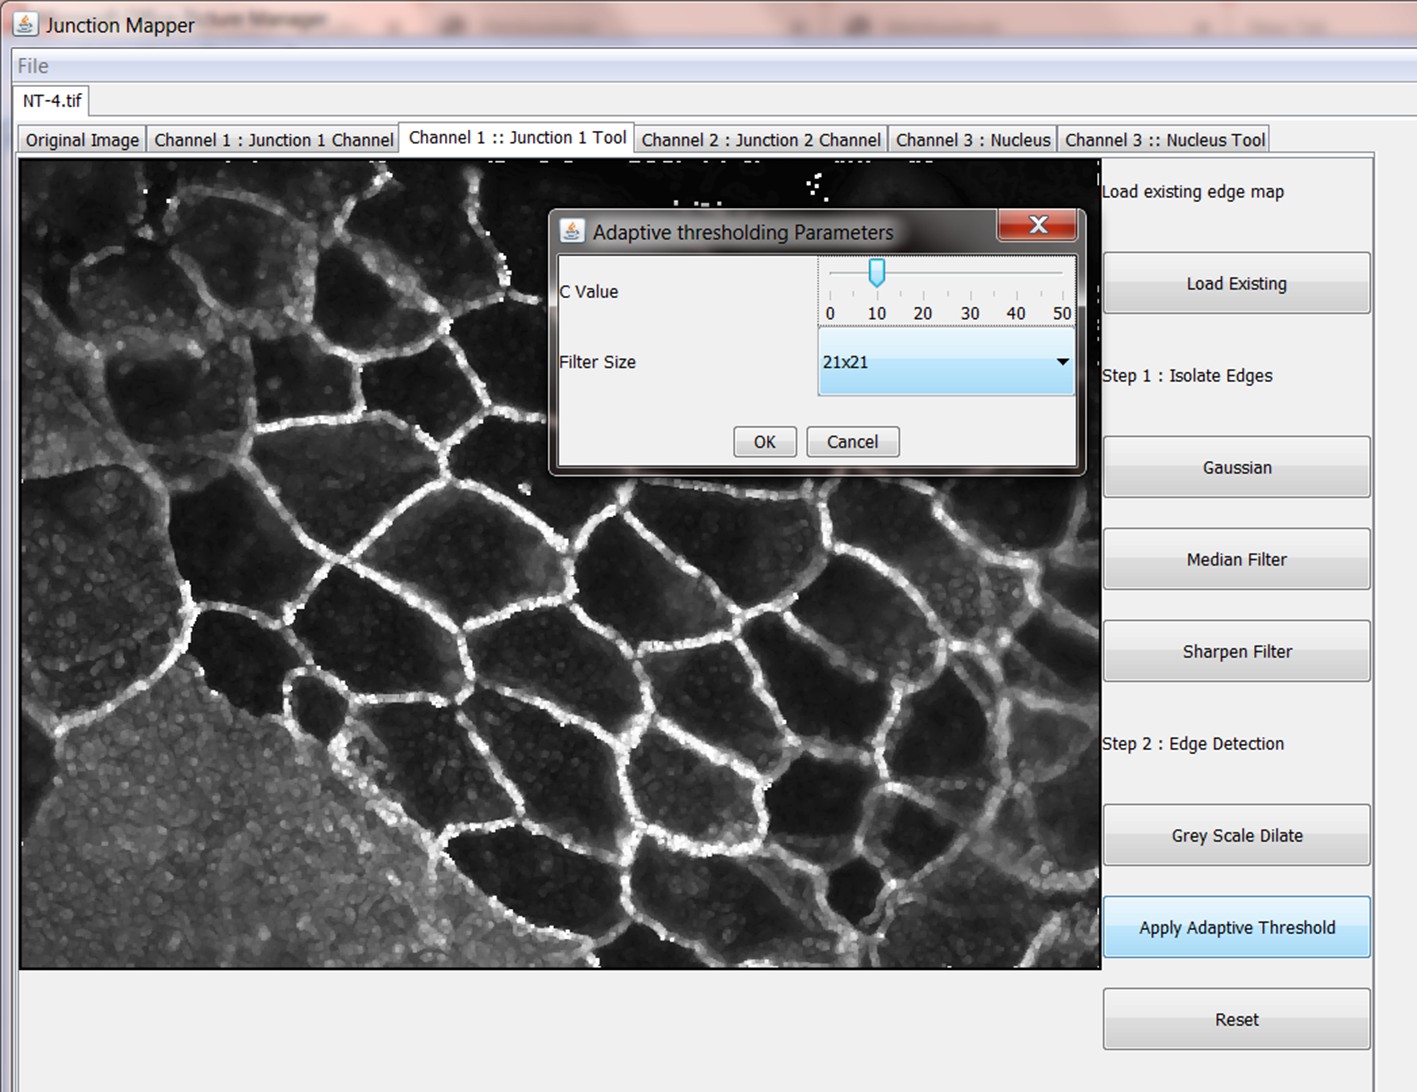
Screen shot of how to apply the Adaptive Threshold in images.
Appendix 1—figure 5

Screen shot of how to create the edge map or skeleton setting up cell boundaries.
Appendix 1—figure 6
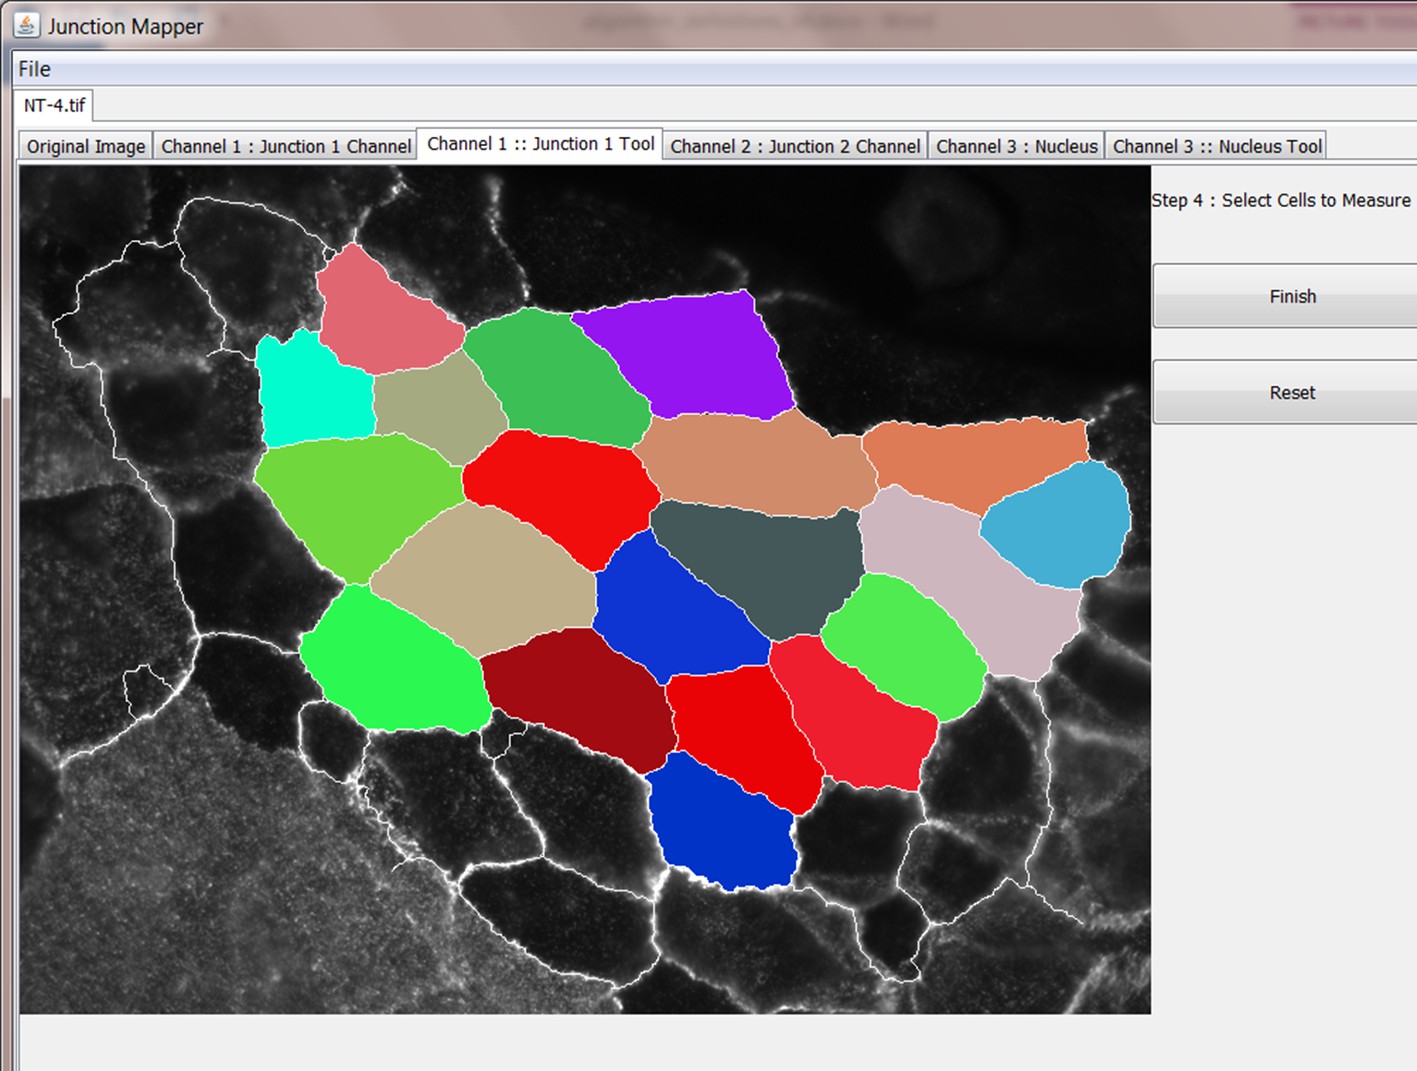
Screenshot demonstrating manual selection of all cells to be analysed by Junction Mapper.
Appendix 1—figure 7
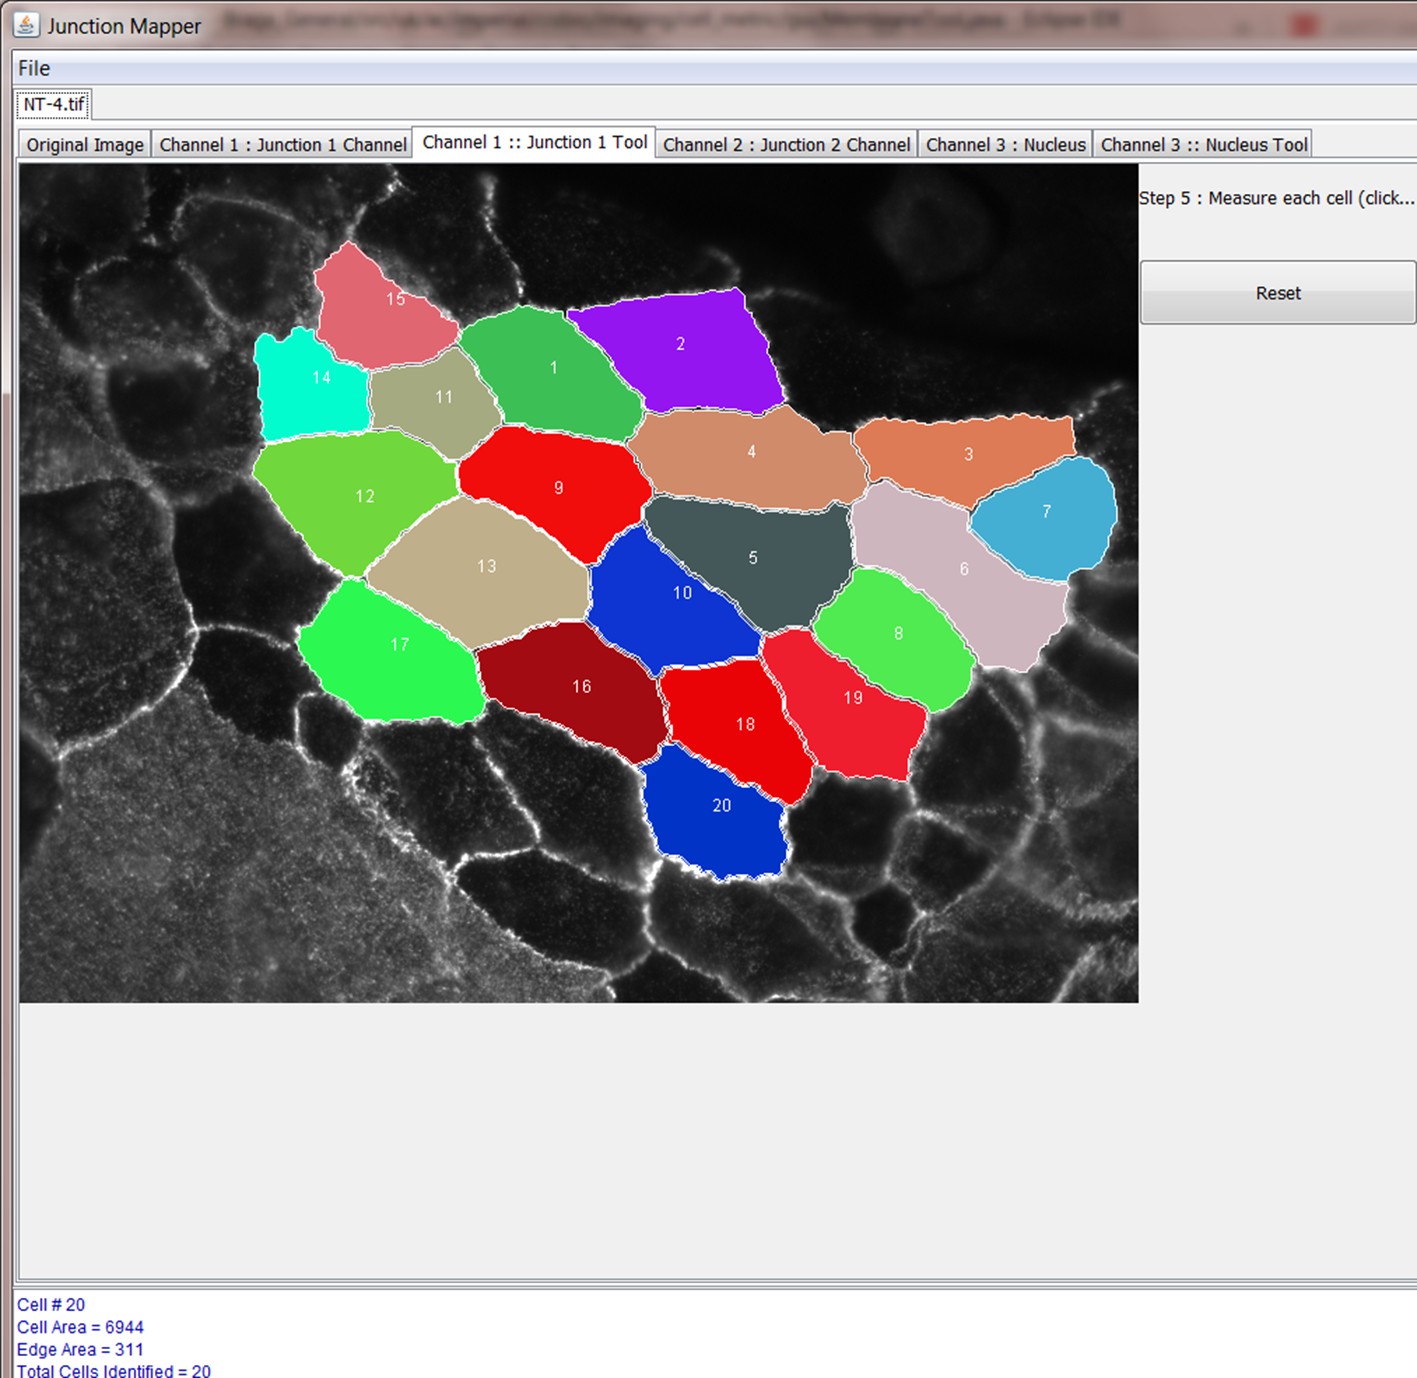
Screenshot of the automatic labelling of each cell to be analysed.
Appendix 1—figure 8
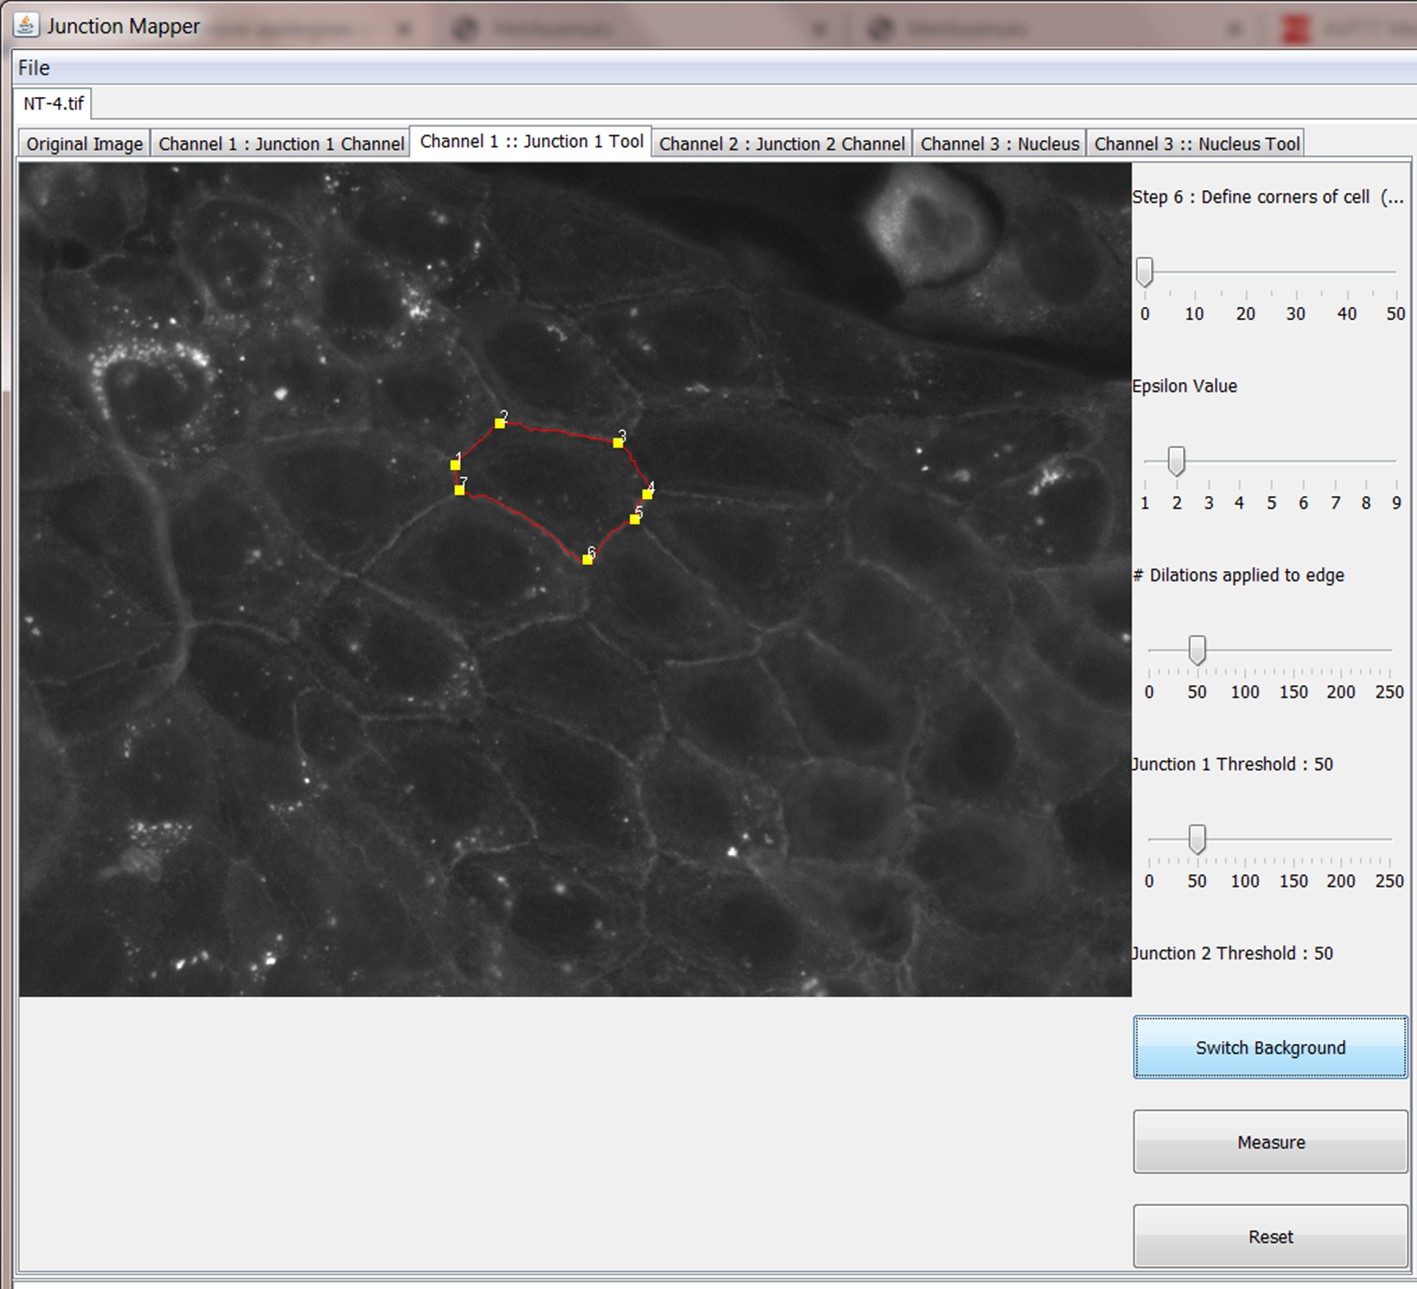
Screenshot of the menu to define cell corners automatically and manually.
Appendix 1—figure 9
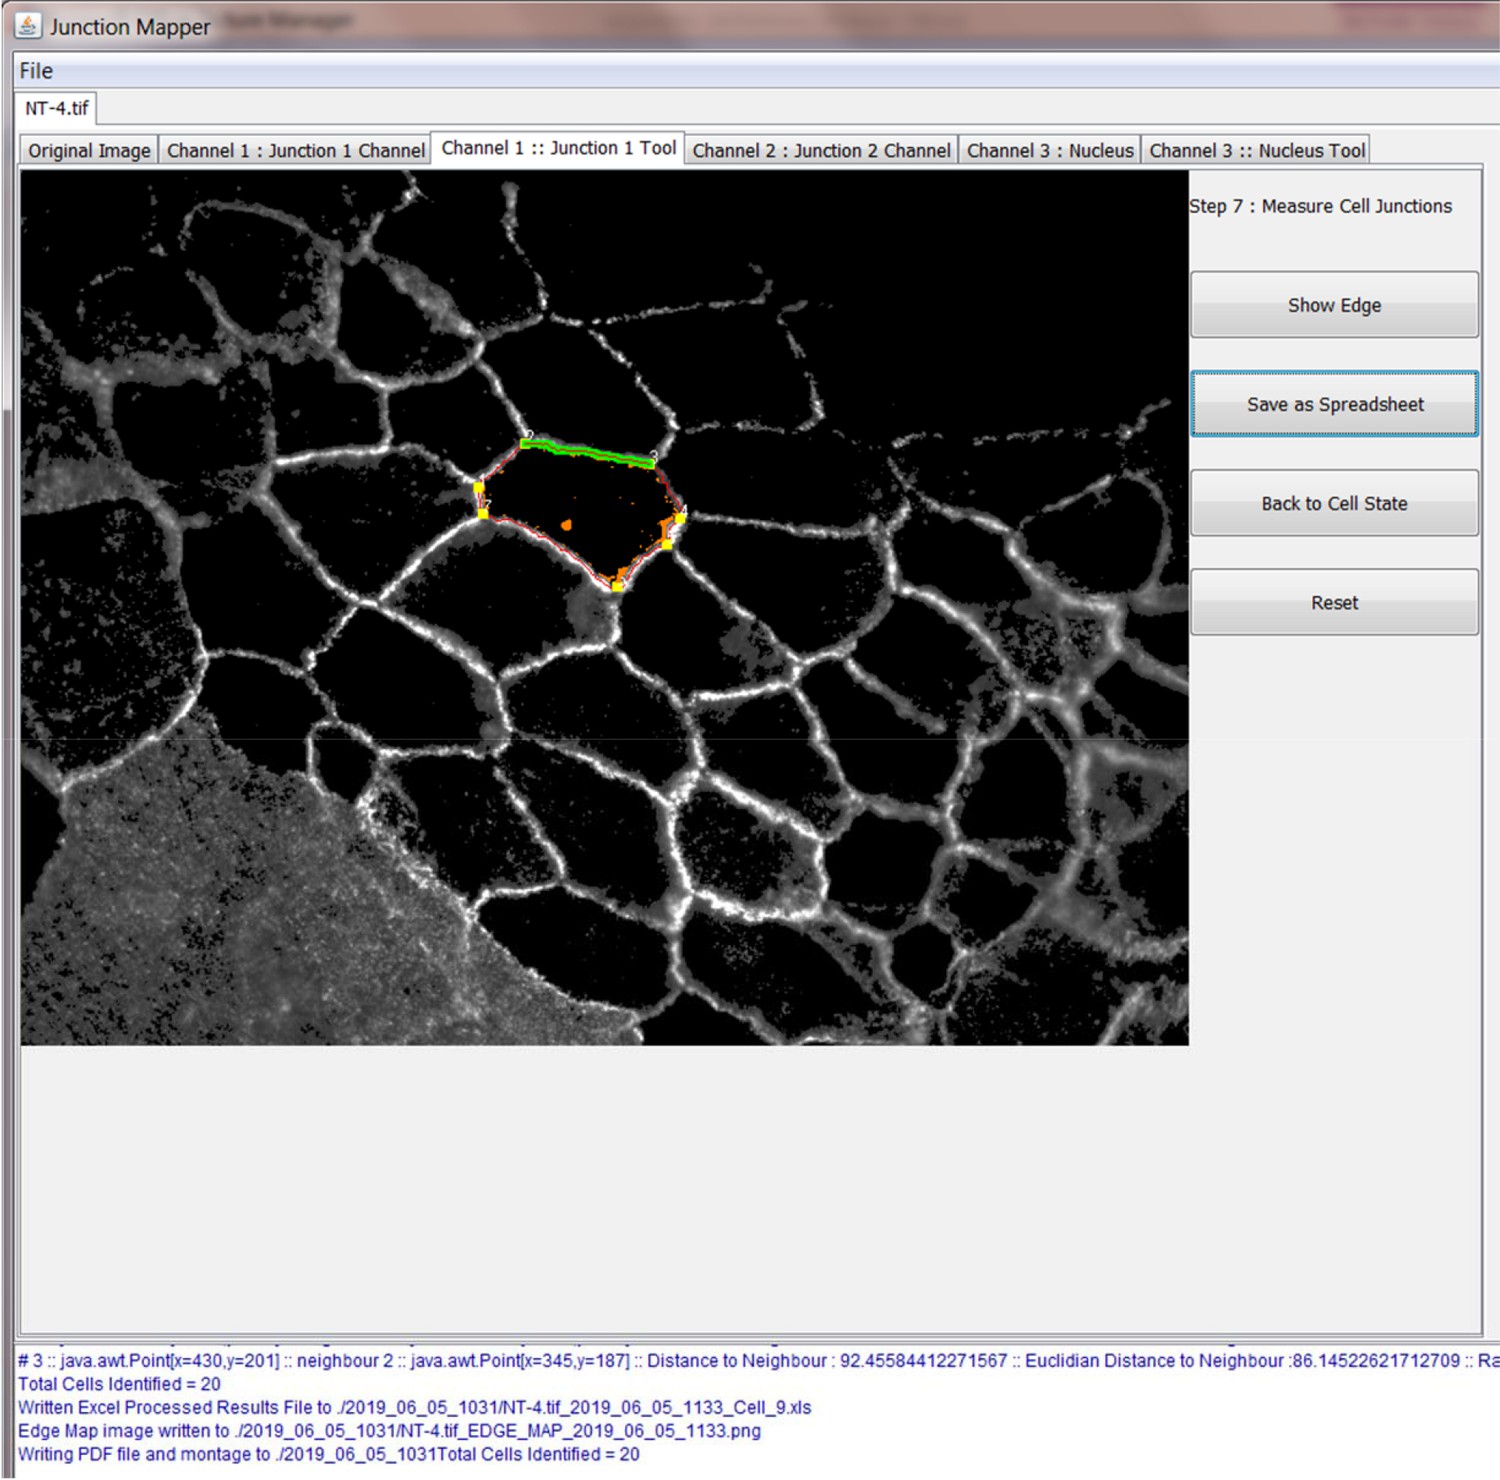
Screenshot of the menu to perform the measurements.
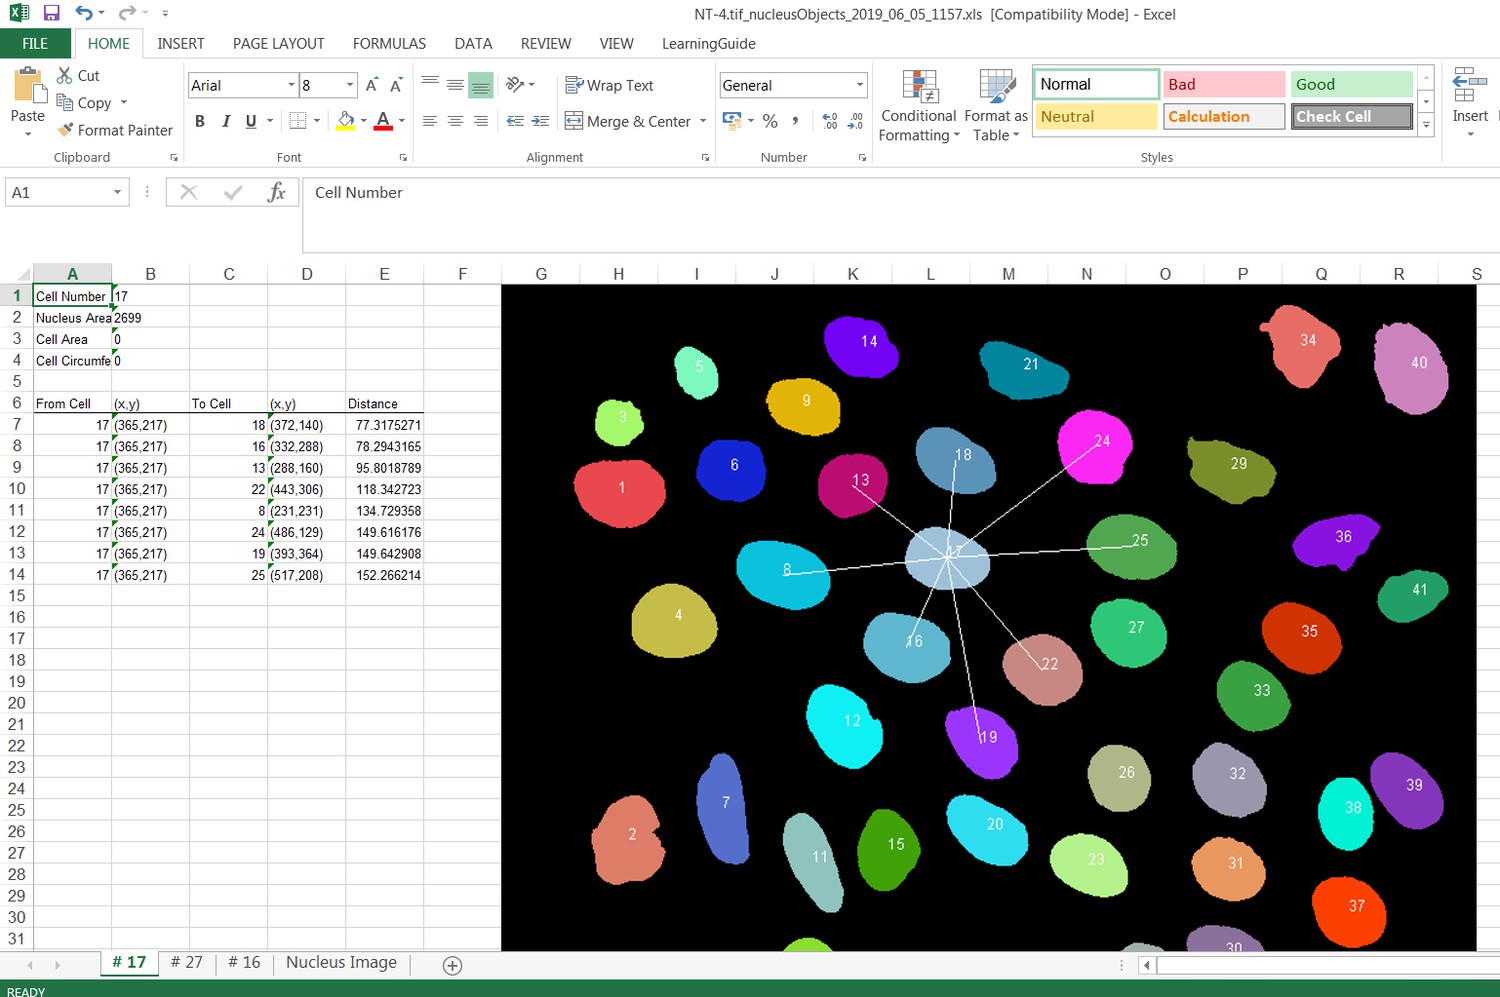
Appendix 1—figure 10
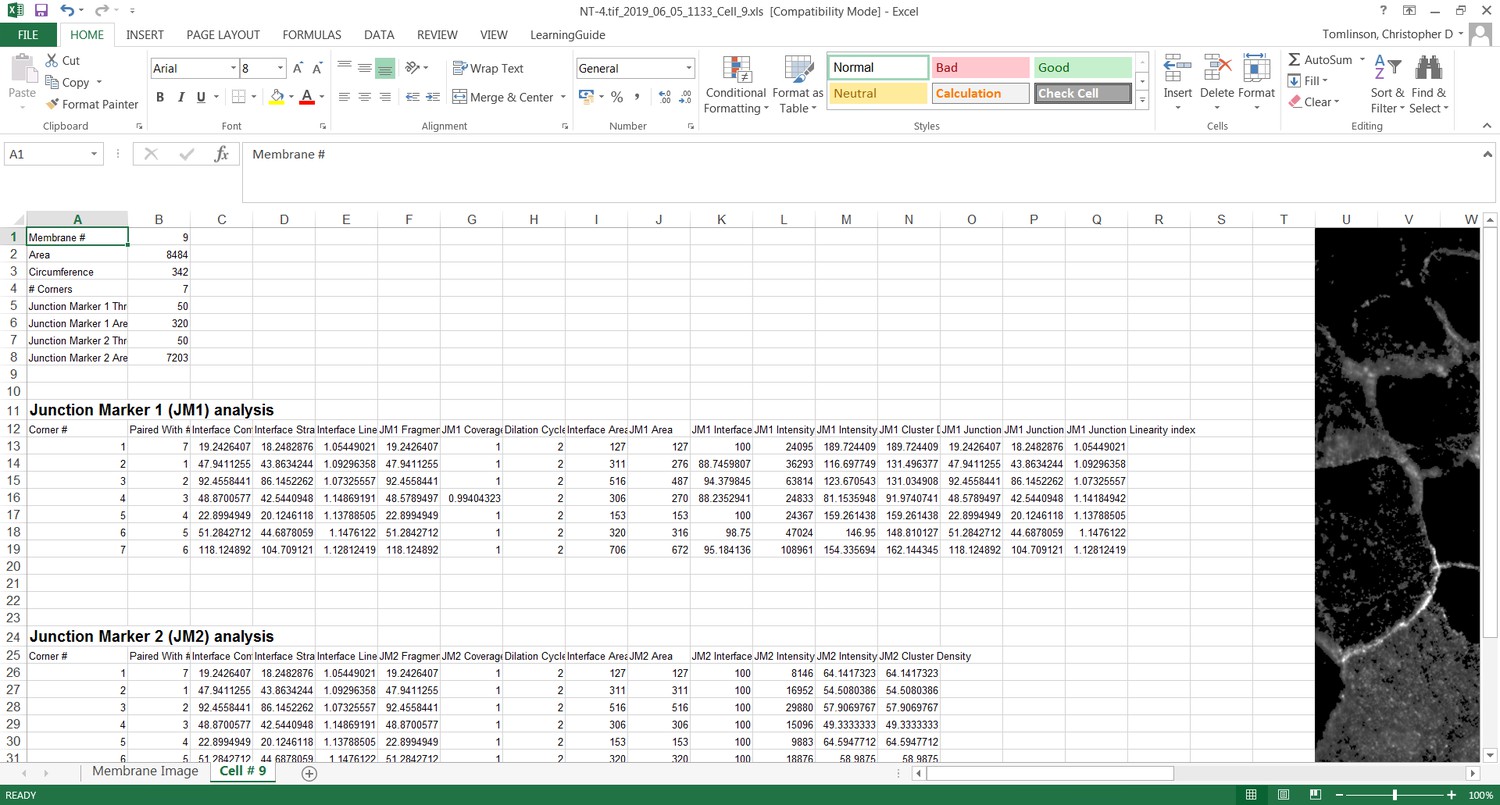
Representative image of the output of Junction Mapper as an excel file.
Appendix 1—figure 11
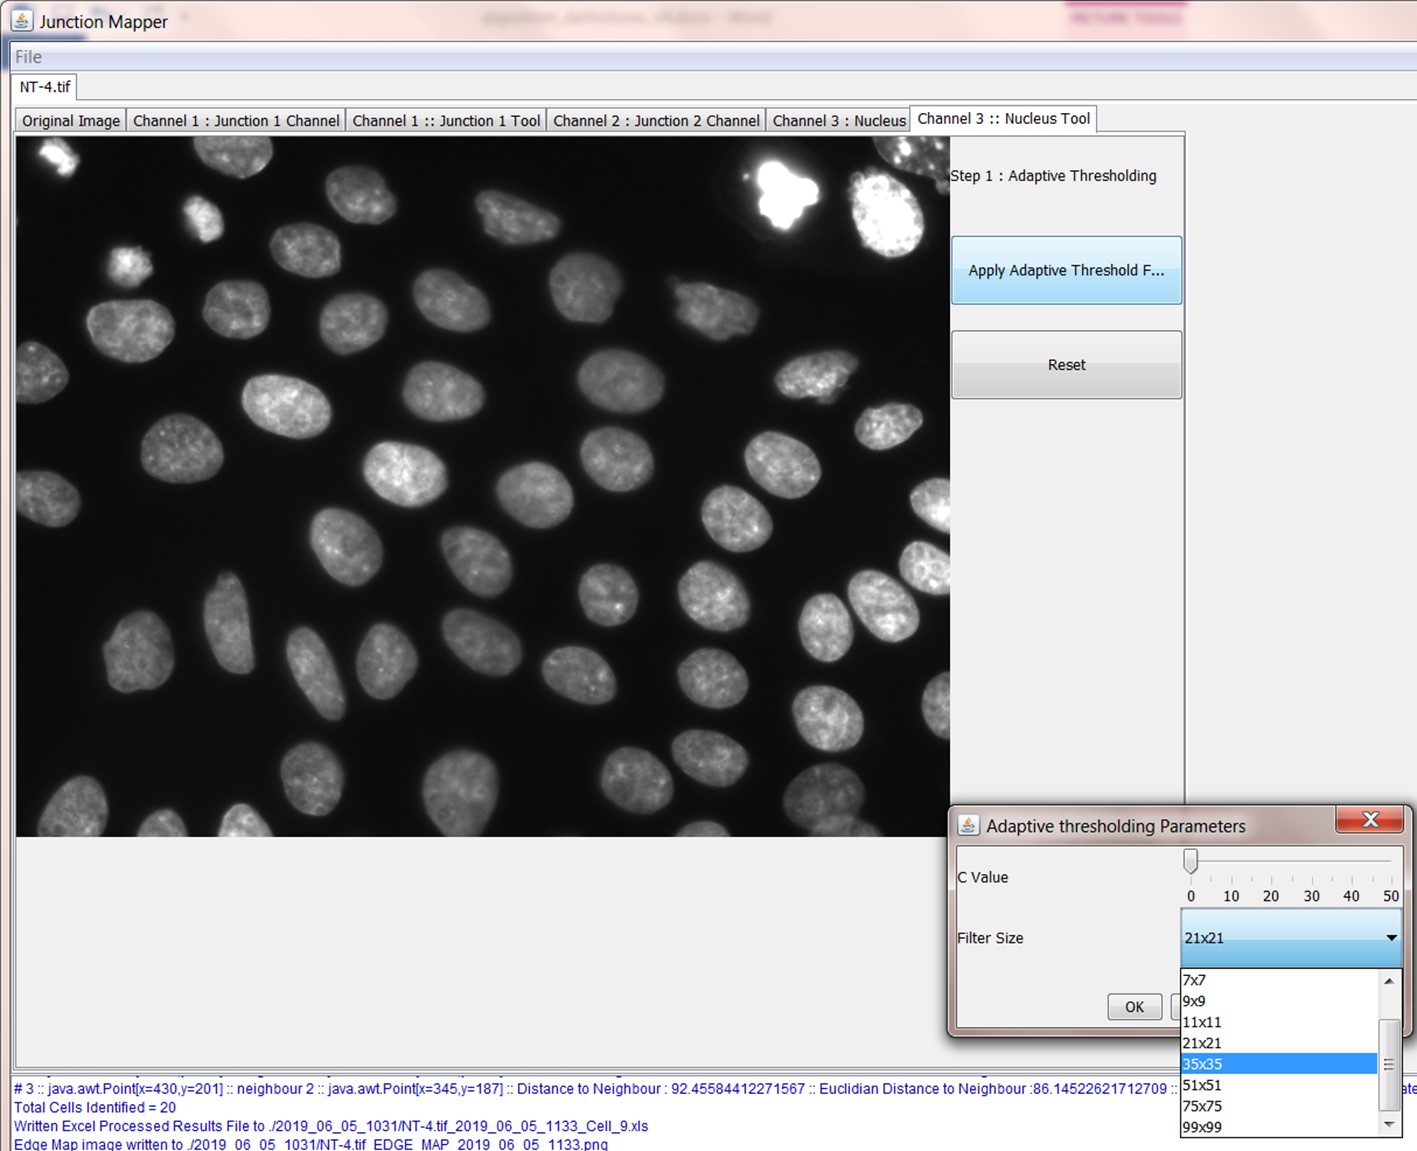
Table describing the parameters measured by Junction Mapper: diagram, units, definition and mathematical calculations.
Appendix 1—figure 12
Screenshot of Nucleus Tool and the adaptive thresholding parameter setting.
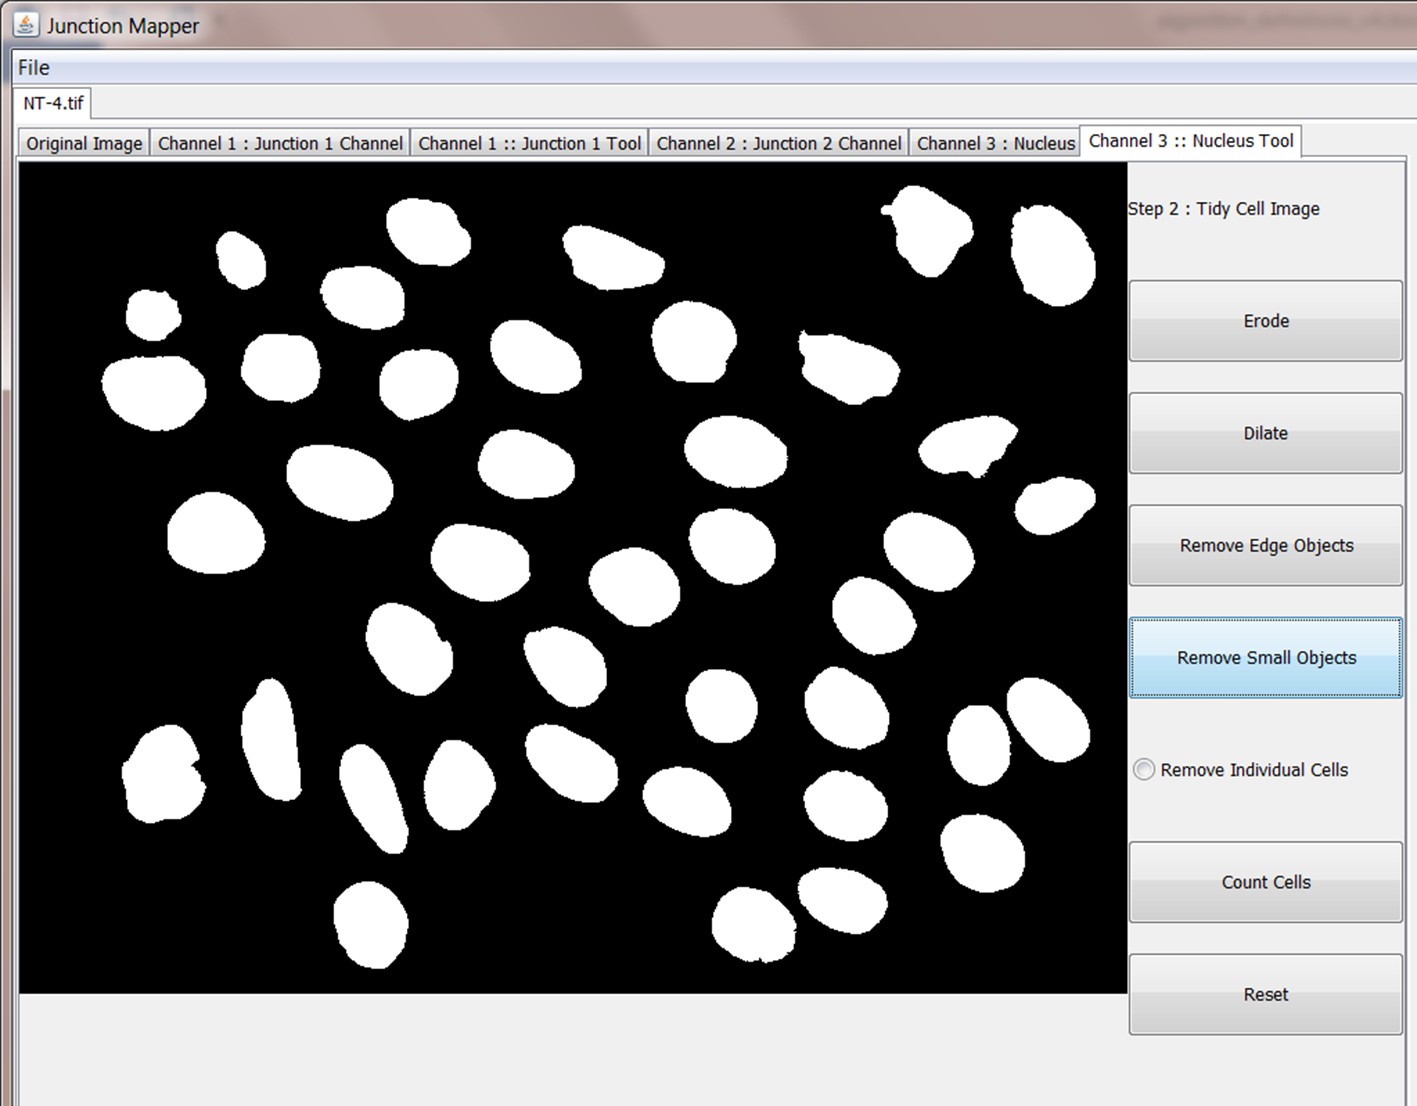
Appendix 1—figure 13
Screenshot showing the removal of small objects to identify nuclei in image.
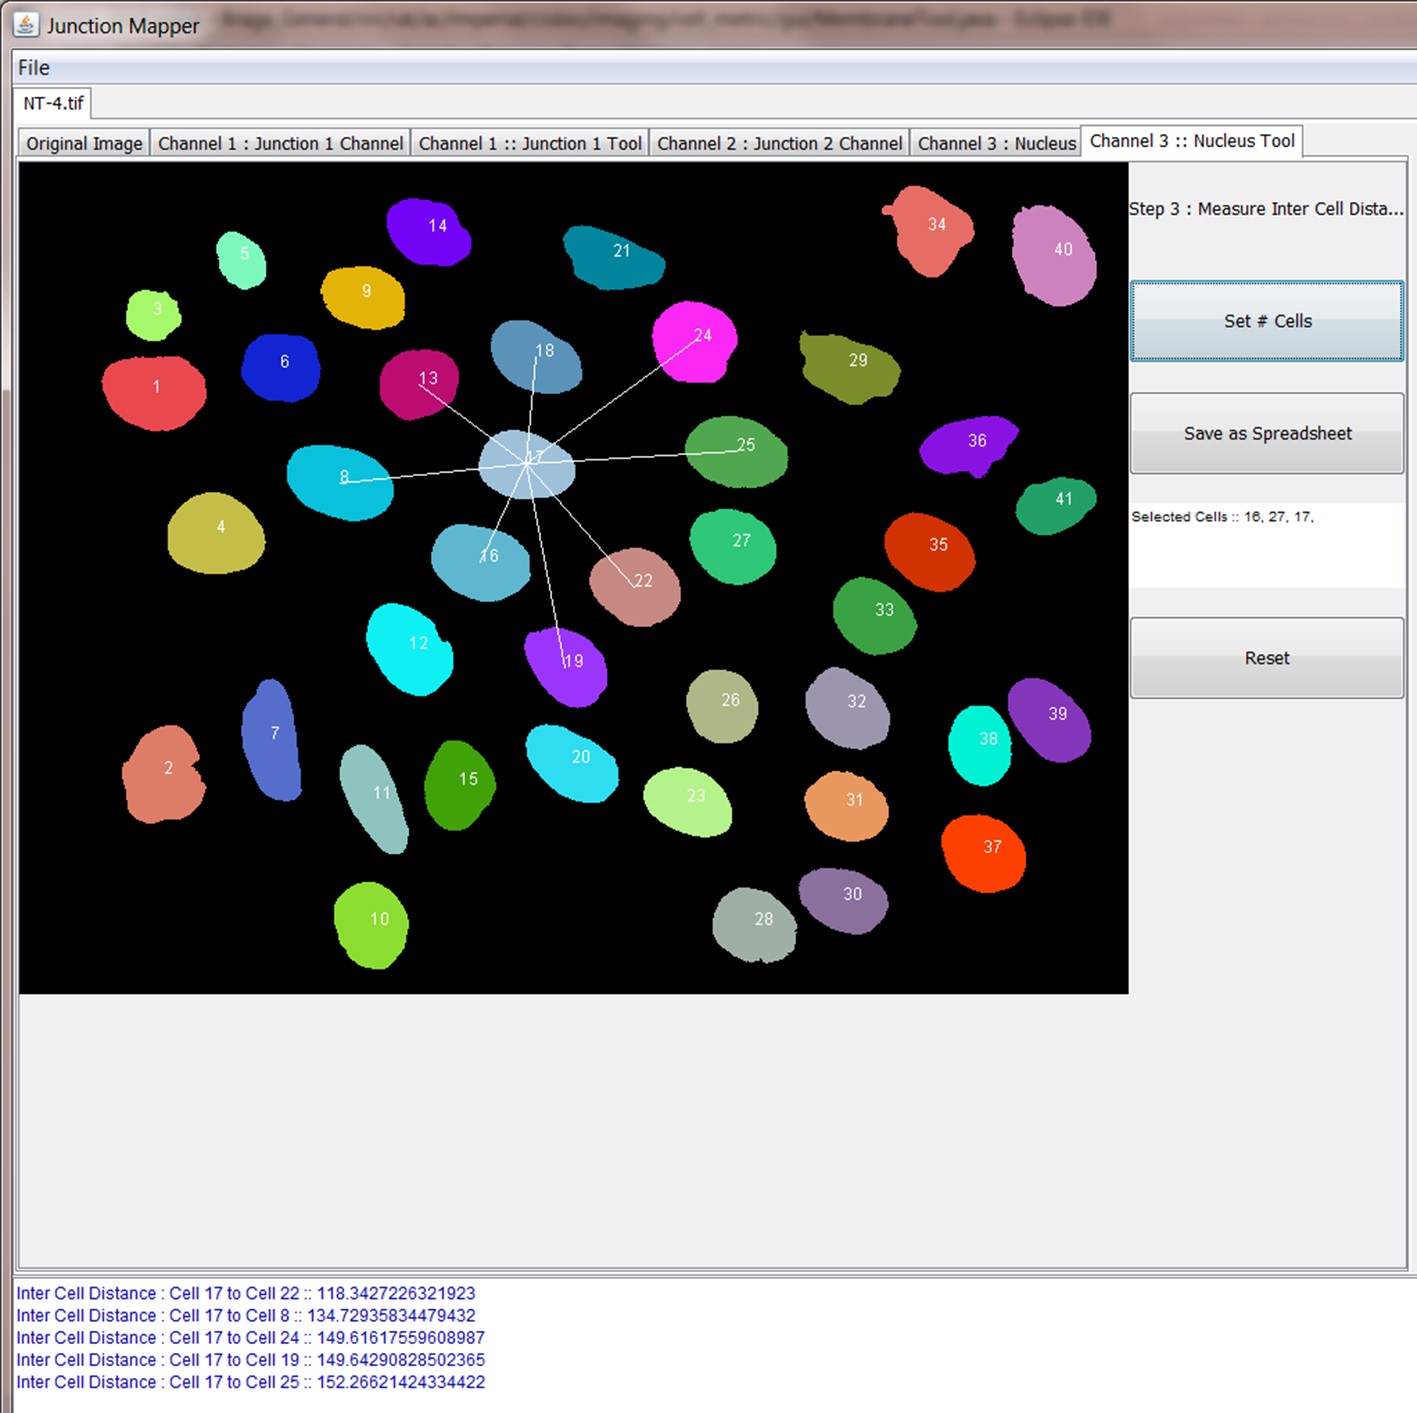
Appendix 1—figure 14
Screenshot showing how internuclear distances are measured by the Nucleus Tool.
Appendix 2—figure 1
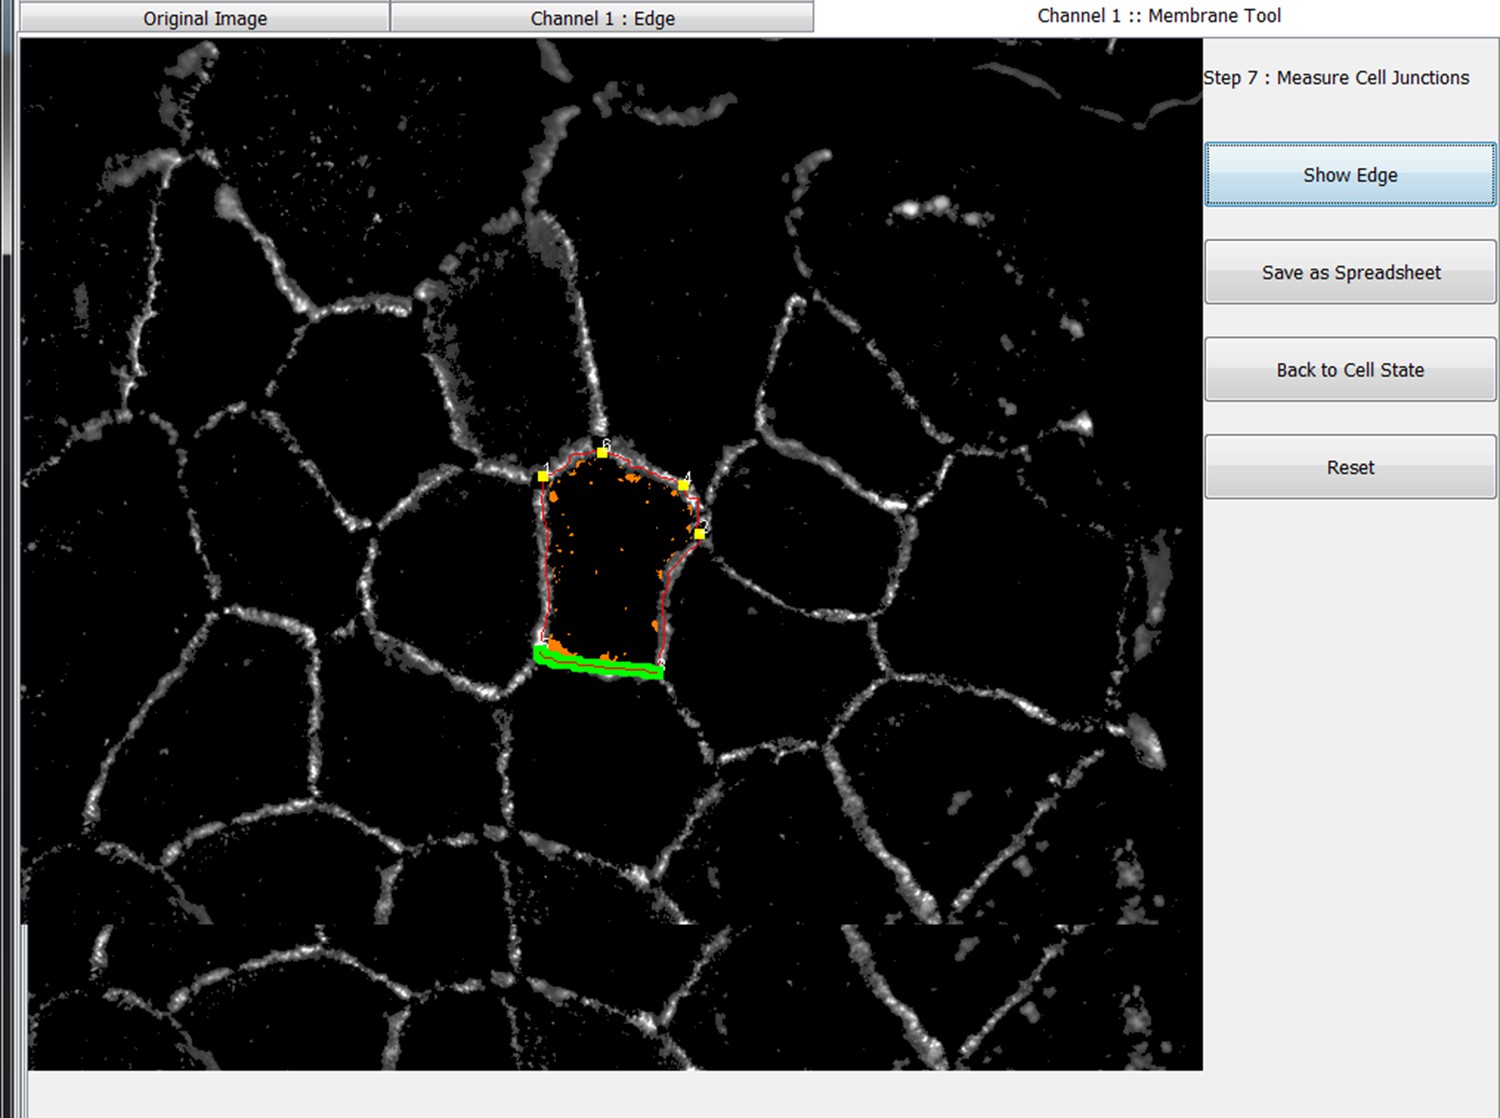
Screen shot of the Junction Mapper programme showing the edge channel, define cell edge (skeleton), corner assigned and the dilated area of one junction.
Tables
Key resources table
| Reagent Type | Designation | Reference | RRID | Catalogue number |
|---|---|---|---|---|
| Antibody | β-catenin (rabbit polyclonal) | Thermo-Fischer | RRID:AB_88035 | Cat# 71–2700 |
| Antibody | Connexin 43 | Millipore | RRID:AB_11210474 | Cat# MAB3067 |
| Antibody | anti-myc | Sigma | RRID:AB_439695 | Cat# B7554 |
| Antibody | E-cadherin (HECD1) | own hybridoma stock | ||
| Antibody | VE-cadherin (clone 75) | BioSciences | RRID:AB_2276073 | Cat# 610252 |
| Recombinant DNA reagent | pEGFP- Src Y527F | activated Src | gift Prof M Frame | |
| Recombinant DNA reagent | pRK5-myc H-Ras G12V | activated H-Ras | (Braga et al., 2000) | |
| Recombinant DNA reagent | pRK5myc- Rac1 Q61L | activated Rac1 | RRID:Addgene_12983 | (Lamarche et al., 1996) |
| Sequence based reagent | siRNA duplexes | CIP4, VAV2 and EEF1A | (Erasmus et al., 2016) | |
| Software | ImageJ | http://fiji.sc | RRID:SCR_002285 | |
| Software | GraphPad Prism | https://graphpad.com | RRID:SCR_002798 | |
| Software | Adobe Illustrator | http://www.adobe.com/products/illustrator.html | RRID:SCR_010279 | |
| Software | Adobe Photoshop | https://www.adobe.com/products/photoshop.html | RRID:SCR_014199 | |
| Software | Rstudio | http://www.rstudio.com/ | RRID:SCR_000432 |
Additional files
-
Source data 1
Data used to compare Coverage Index calculated by Junction Mapper and manually (Supplementary file 2).
- https://cdn.elifesciences.org/articles/45413/elife-45413-data1-v2.xlsx
-
Source data 2
Junction Mapper data showing the impact of user-bias on the quantification of an epithelial dataset (Supplementary file 3).
- https://cdn.elifesciences.org/articles/45413/elife-45413-data2-v2.xlsx
-
Source data 3
Data to demonstrate robustness of Junction Mapper quantification of biological replicates (Scheme 1).
- https://cdn.elifesciences.org/articles/45413/elife-45413-data3-v2.xlsx
-
Supplementary file 1
Description of the different experiments used to validate Junction Mapper.
Type of microscope, image characteristics, image resolution, user-controlled settings and replicate type are outlined.
- https://cdn.elifesciences.org/articles/45413/elife-45413-supp1-v2.xlsx
-
Supplementary file 2
Validation of the Coverage Index parameter.
A-B Diagram and definition of the measurements used for quantification of the parameter Coverage Index. A, Junction Mapper measures the Coverage Index using the more precise contour length of E-cadherin fragments. B, Our previous work (Lozano et al., 2008) defined Coverage Index as the ratio between the straight lines (Euclidian distances) measuring E-cadherin staining over the interface length. C, Quantification of the same images is shown via the two methods, Junction Mapper or Manual. When manually quantified (i.e. straight line) the average values are smaller than those obtained with Junction Mapper. When the two methods were compared, there are no statistical differences between control groups or between active Rac1 groups. Furthermore, the significant difference between control and Rac1 is maintained in each methodology (manual or Junction Mapper). Junctions were quantified from one technical replicate; number of analysed junctions is written inside graphs below each sample. Ns, non-significant; ***p = 0.001. Scale bar = 10 μm.
- https://cdn.elifesciences.org/articles/45413/elife-45413-supp2-v2.ai
-
Supplementary file 3
Impact of user on Junction Mapper quantification of epithelial junctions.
A-B A subset of representative images was processed by two users independently (first column; user A and user B), setting up the skeleton, corners, dilation, thresholding values. Middle column shows the overlay of the skeletons obtained by user A and user B; arrows point to misaligned regions. Last column shows the overlay of added corners to the skeleton. Blue arrowheads show corners that are not co-localized. A, Control samples (CIP4 siRNA experiment) were stained for E-cadherin (red) and F-actin (green). B, Epithelial cells expressing activated H-Ras (green, pRK5-myc-H-RasG12V) stained for E-cadherin (red). C, Pairwise comparison of individual junction values of primary parameters of CIP4 siRNA experiment obtained by user A (dilation 2, threshold 50) and user B (dilation 3, threshold 69). D, Pairwise comparison of individual junction values of primary parameters of active H-Ras expression images obtained by user A (dilation 2, threshold 54) and user B (dilation 2, threshold 55). E-F, Graphs of selected parameters obtained from the analyses by user A and user B. The overall result and profile comparing control and treated samples is similar between different users. E, RNAi experiment showing control non-targeting siRNA (NT) and CIP4 siRNA samples. F, Expression of activated H-Ras showing junctions from control non-expressing cells (c), between H-Ras expressing and non-expressing cells (en) and between two expressing cells (ee). Number of junctions analysed by each user is shown on the Y axis of first graphs (panels C,D) or below scatter plots inside the last graph on the right (panels E,F). All junctions are from one technical replicate. Statistical analyses were performed by Wilcoxson matched-pairs signed rank test (C-D) or One-Way Anova and Kruskal Wallis test (E-F). ns, non-significant
- https://cdn.elifesciences.org/articles/45413/elife-45413-supp3-v2.ai
-
Supplementary file 4
Heuristics approach to set up analysis with Junction Mapper and minimize user bias.
- https://cdn.elifesciences.org/articles/45413/elife-45413-supp4-v2.docx
-
Supplementary file 5
Description of statistical analyses and variances of the experimental data analysed by Junction Mapper.
- https://cdn.elifesciences.org/articles/45413/elife-45413-supp5-v2.xlsx
-
Transparent reporting form
- https://cdn.elifesciences.org/articles/45413/elife-45413-transrepform-v2.pdf
Download links
A two-part list of links to download the article, or parts of the article, in various formats.
Downloads (link to download the article as PDF)
Open citations (links to open the citations from this article in various online reference manager services)
Cite this article (links to download the citations from this article in formats compatible with various reference manager tools)
Junction Mapper is a novel computer vision tool to decipher cell–cell contact phenotypes
eLife 8:e45413.
https://doi.org/10.7554/eLife.45413


