The genetic factors of bilaterian evolution
- Institute for Genetics, Cologne Biocenter, University of Cologne, Germany
- Institute for Zoology: Developmental Biology, Cologne Biocenter, University of Cologne, Germany
- School of Life Sciences, University of Warwick, Gibbet Hill Campus, United Kingdom
Figures
Figure 1 with 3 supplements
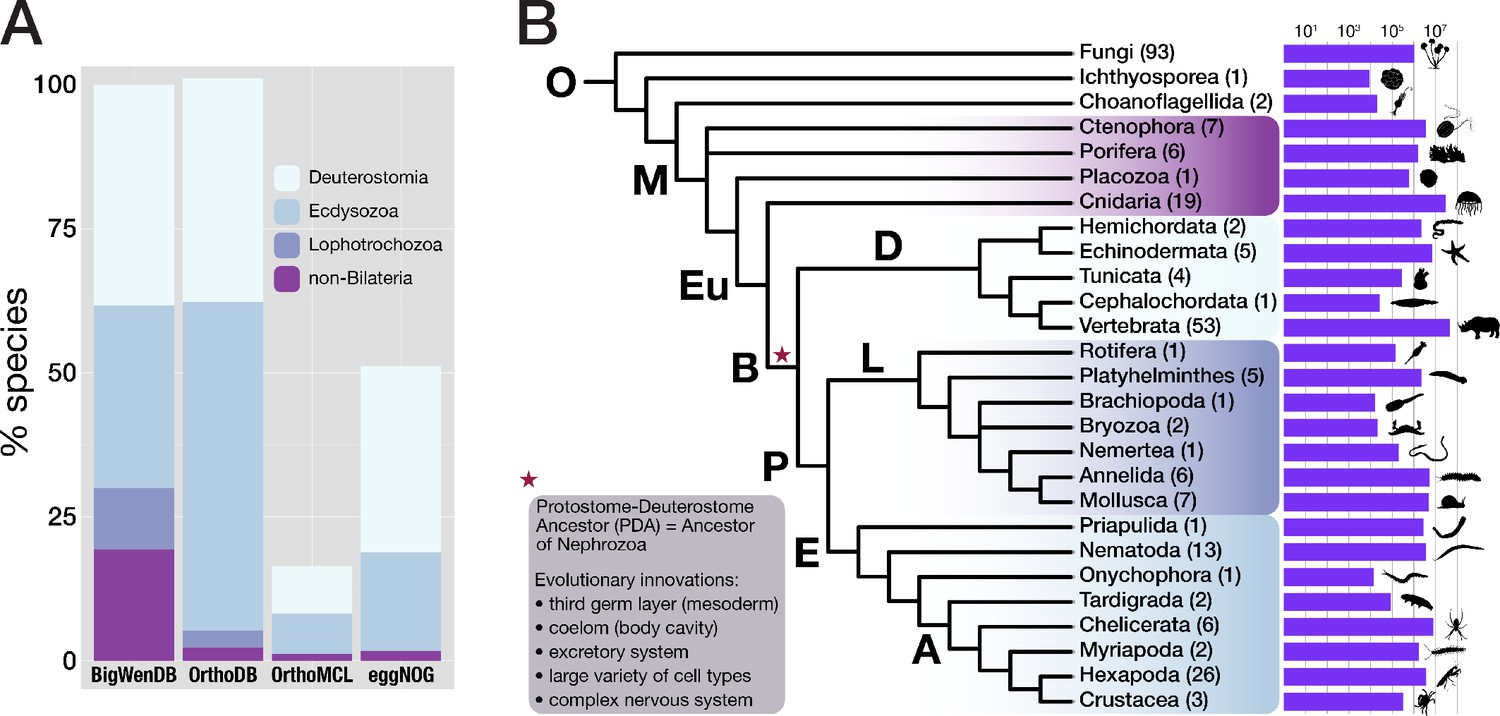
Properties of the BigWenDB data collection.
(A) Comparison of three major orthology databases with the BigWenDB. The relative contribution of four metazoan clades (Deuterostomia, Ecdysozoa, Lophotrochozoa, and the paraphyletic group "non-Bilateria") is shown as stacked bar graph. The count of metazoans in our database (175 species) is set to 100%. In comparison to other databases, the BigWenDB has a larger repertoire of critical lophotrochozoans and non-bilaterian Metazoa. (B) Consensus phylogeny describing the relationships of 21 metazoan phyla covered in our database, after Laumer et al., 2015; Telford et al., 2015; Torruella et al., 2015; Cannon et al., 2016. Bold labels to the left or above branches indicate its ancestor (A: Arthropoda, B: Bilateria, D: Deuterostomia, E: Ecdysozoa, Eu: Eumetazoa, L: Lophotrochozoa, M: Metazoa, O: Opisthokonta, P: Protostomia). Numbers in parentheses (after the phylum name) indicate the number of species present from this phylum. Horizontal bars visualise the number of database sequences that belong to a given phylum (logarithmic scale; transcriptomic, ORF, and NCBI sequences summed up). Species silhouettes were downloaded from www.phylopic.org. Morphological innovations of Bilateria according to Baguñà et al., 2008 are highlighted in a shaded box.
Figure 1—figure supplement 1
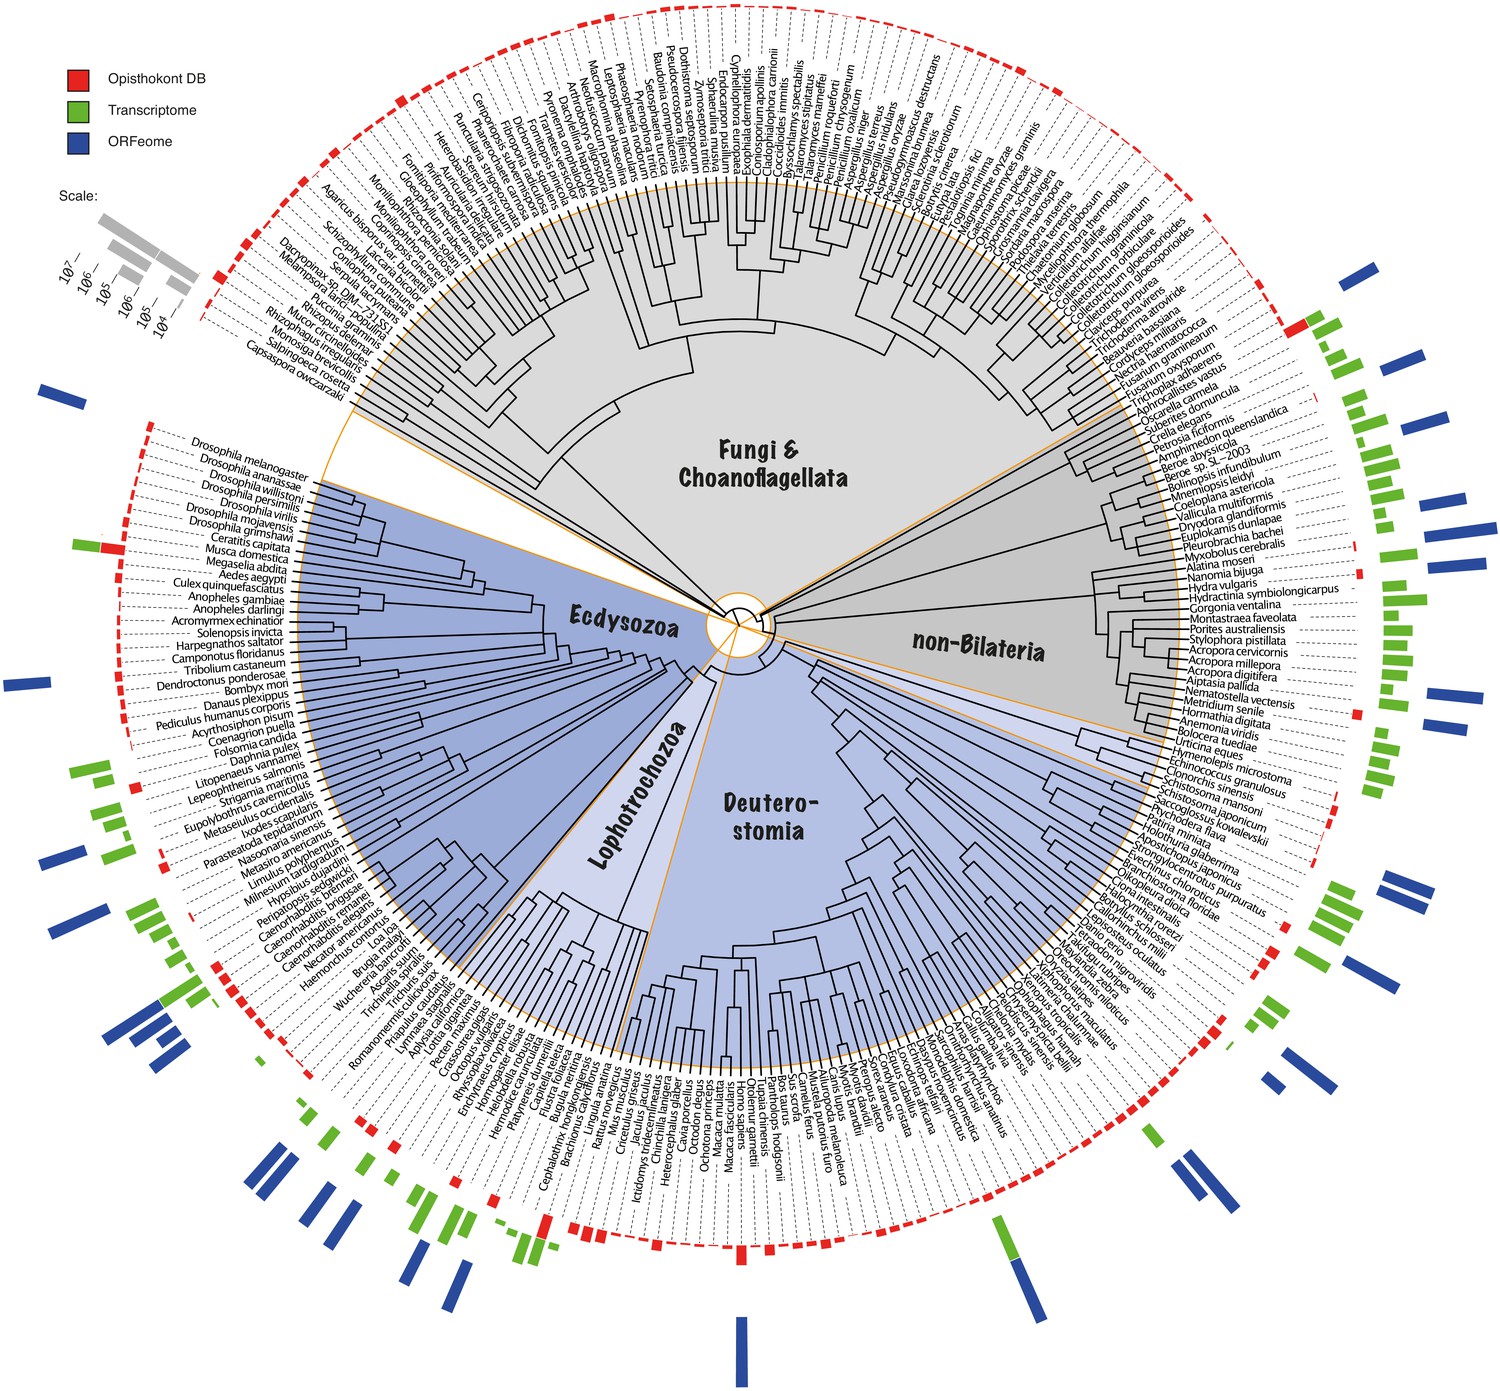
Phylogenetic distribution of the BigWenDB.
The amount of sequence data populating the BigWenDB is shown together with its phylogenetic distribution. The coloured bars at the perimeter (red, green, blue) document the contributions of three different sequence sources (bar height proportional to the number of sequences, see ruler at top left): (1) Sequences from 204 opisthokonts (animals, choanoflagellates, and fungi) with >8000 entries in the NCBI database (downloaded on May 25, 2015; coloured in red). (2) Sequences derived from the transcriptomes of 64 species under-represented at NCBI (non-bilaterian animals, lophotrochozoans, and representatives of additional phyla; green). (3) ORFs derived from the genome sequences of 25 representative metazoans (blue), including 8 non-bilaterian species. In total, 124,031,501 sequences from 273 species cover the eukaryotic tree of life in the most comprehensive way so far (see text for details). Phylogenetic relationships after NCBI taxonomy.
Figure 1—figure supplement 2
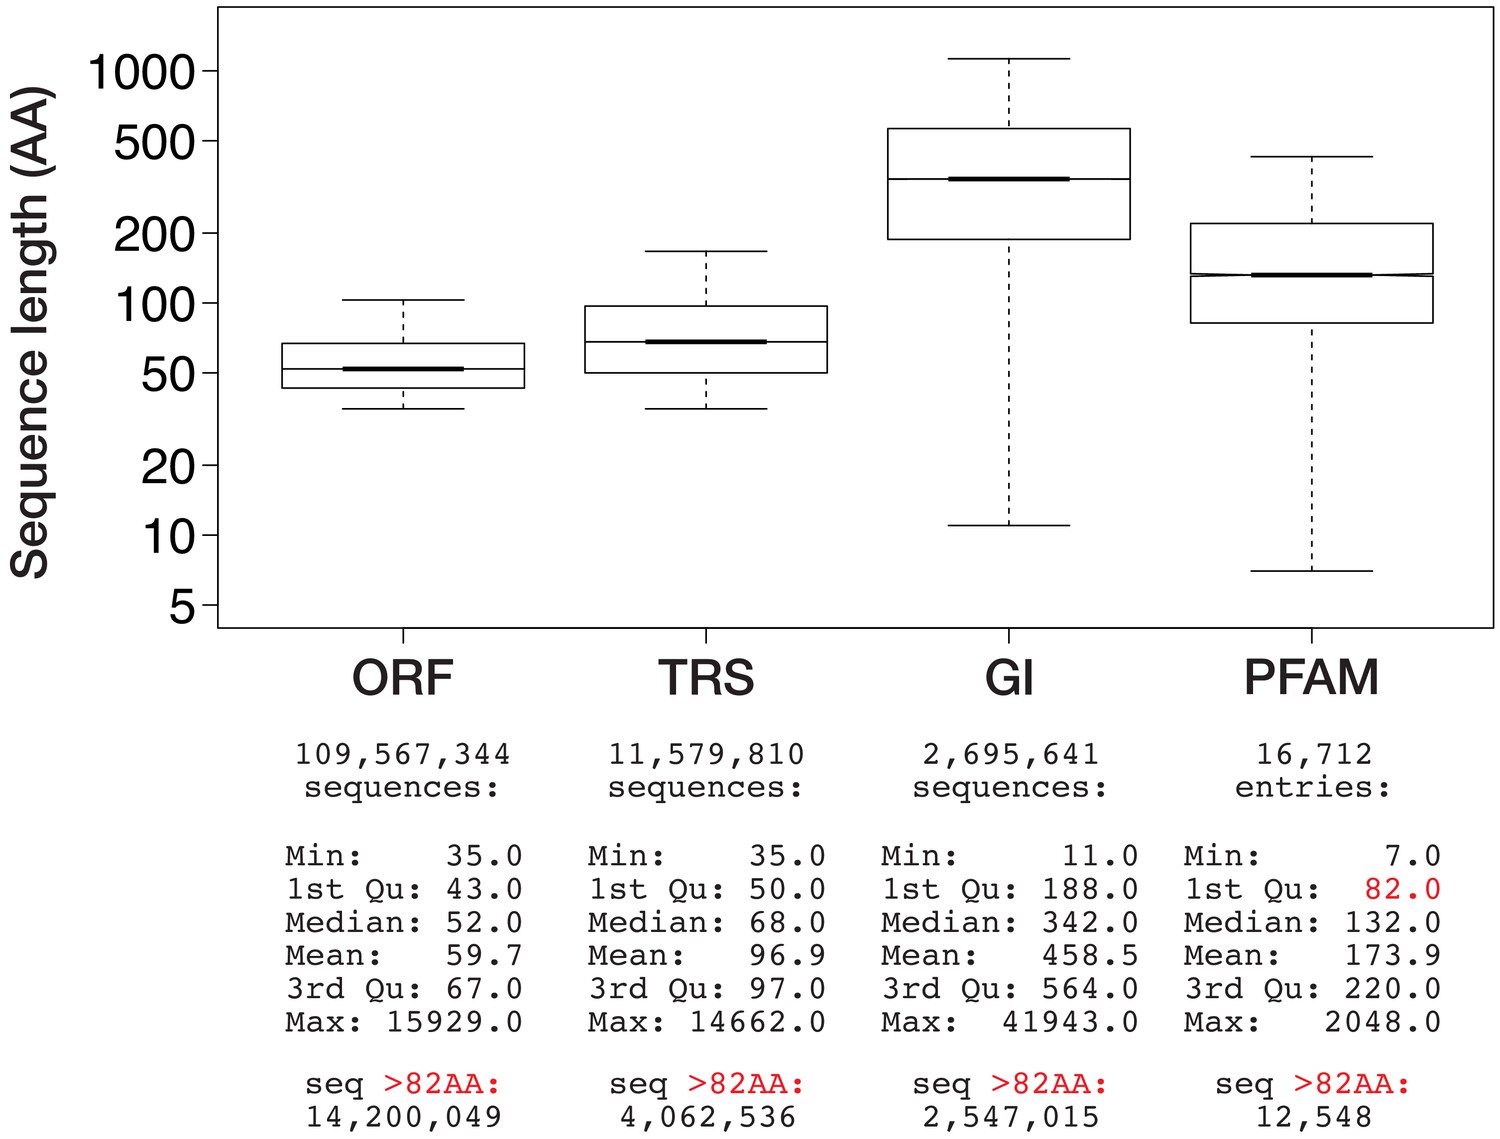
Size distribution of three sequence data types present in the BigWenDB.
Boxplots show the size distribution of genomic ORFs (ORF), transcriptomic ORFs (TRS), and NCBI sequences (GI) in comparison to the average size of protein domains collected in the PFAM database V31.0 (March 2017; 16,712 entries). Data points outside 1.5 × the interquartile range are omitted for clarity. y-axis is in logarithmic scale. Corresponding sequence number and summary statistics are shown below each boxplot. The lower border (1st quartile) of the PFAM box is marked in red, together with the number of sequences per data type that surpass this size threshold.
Figure 1—figure supplement 3
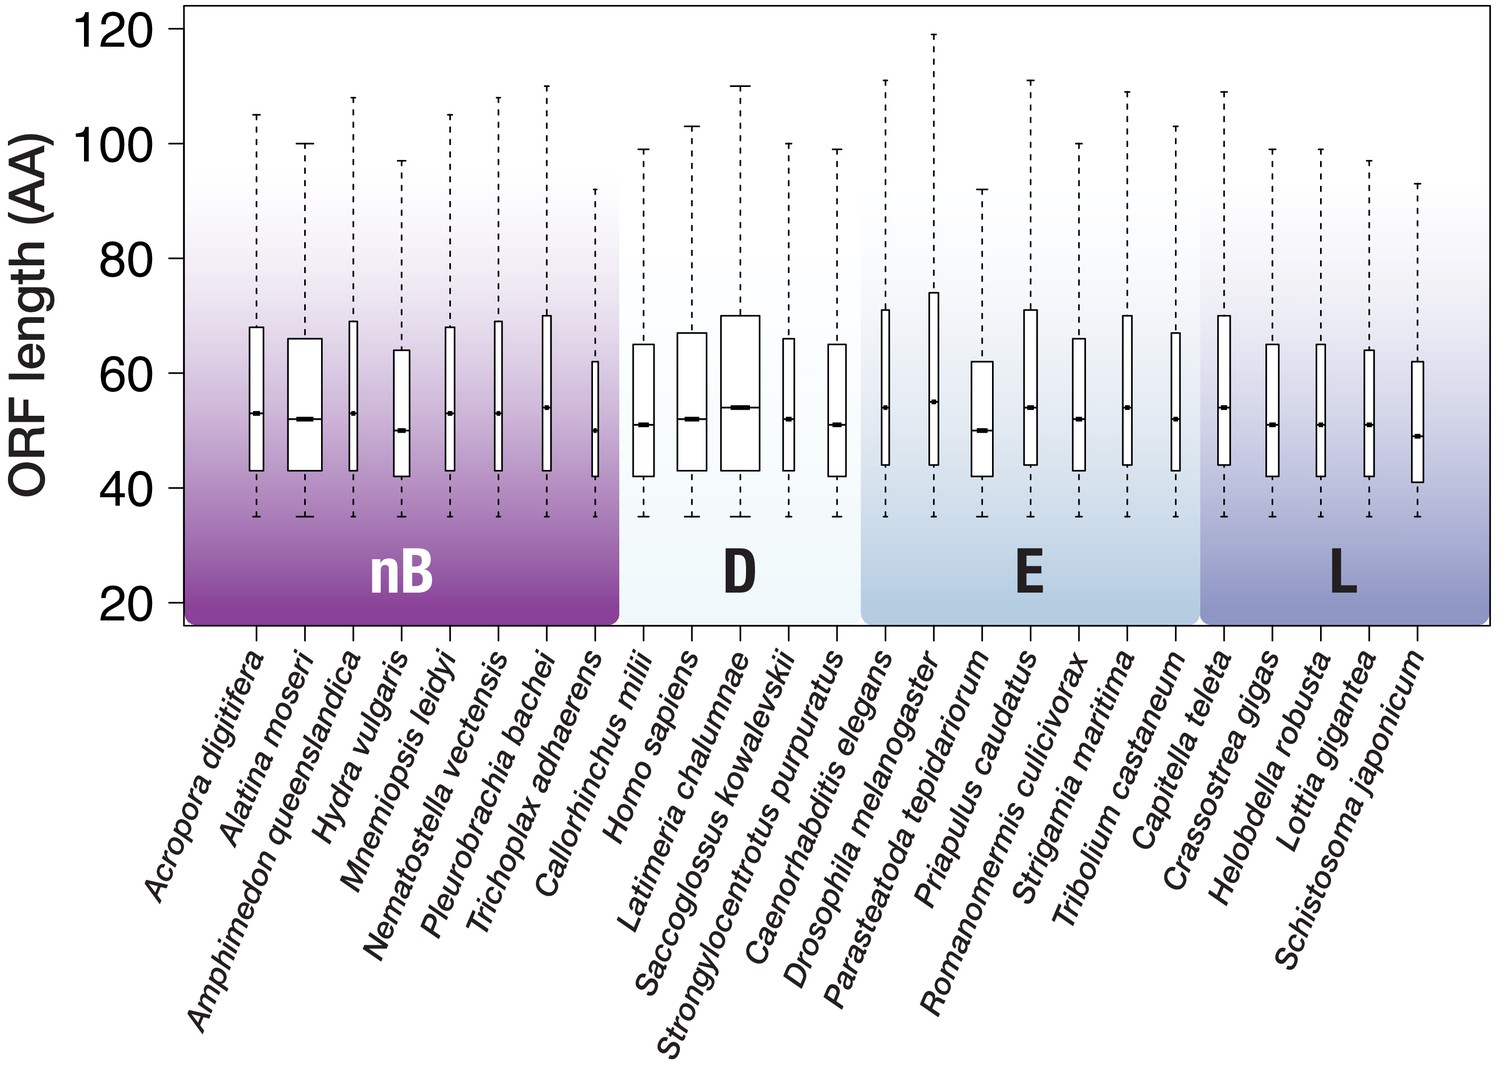
ORF size distribution for 25 species with genomic data.
Outliers (above whiskers) are omitted for clarity. Whiskers extend to 1.5 × the interquartile range (default in R). Box width is proportional to the square root of the sequence number. nB = non-bilaterian Metazoa, D = Deuterostomia, E = Ecdysozoa, L = Lophotrochozoa.
Figure 2 with 4 supplements
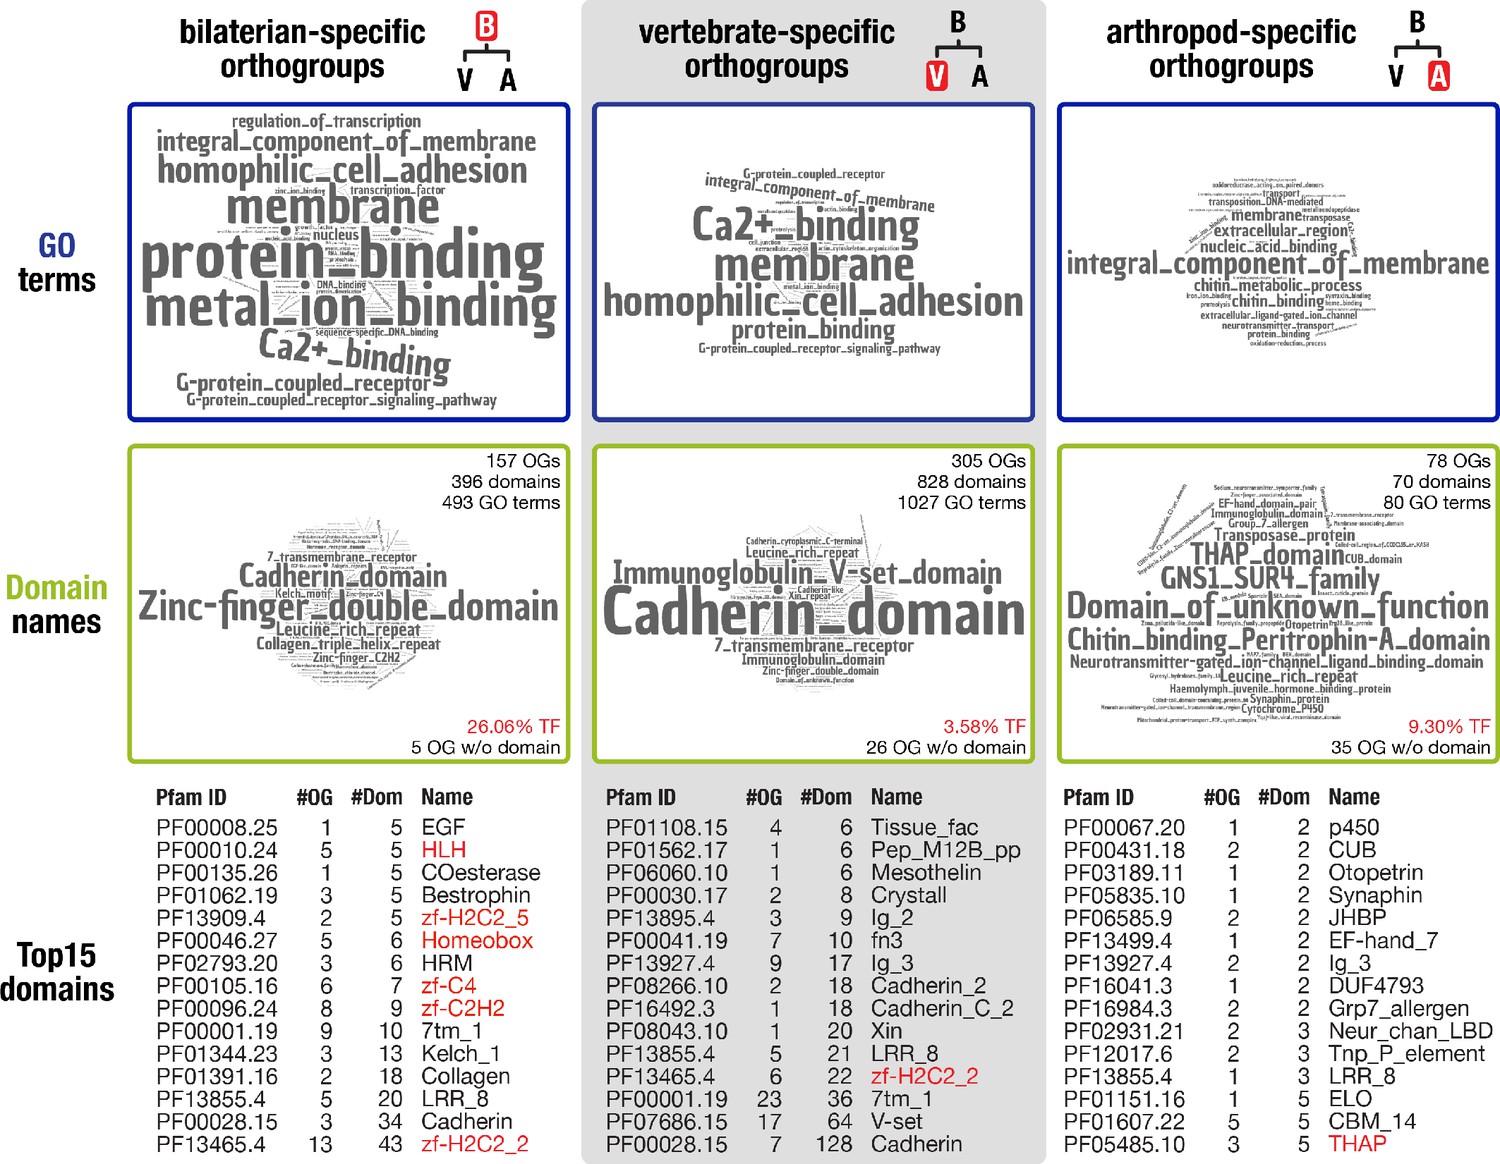
Inventory of protein domains and associated GO terms for three animal lineages.
Figure 2—figure supplement 1
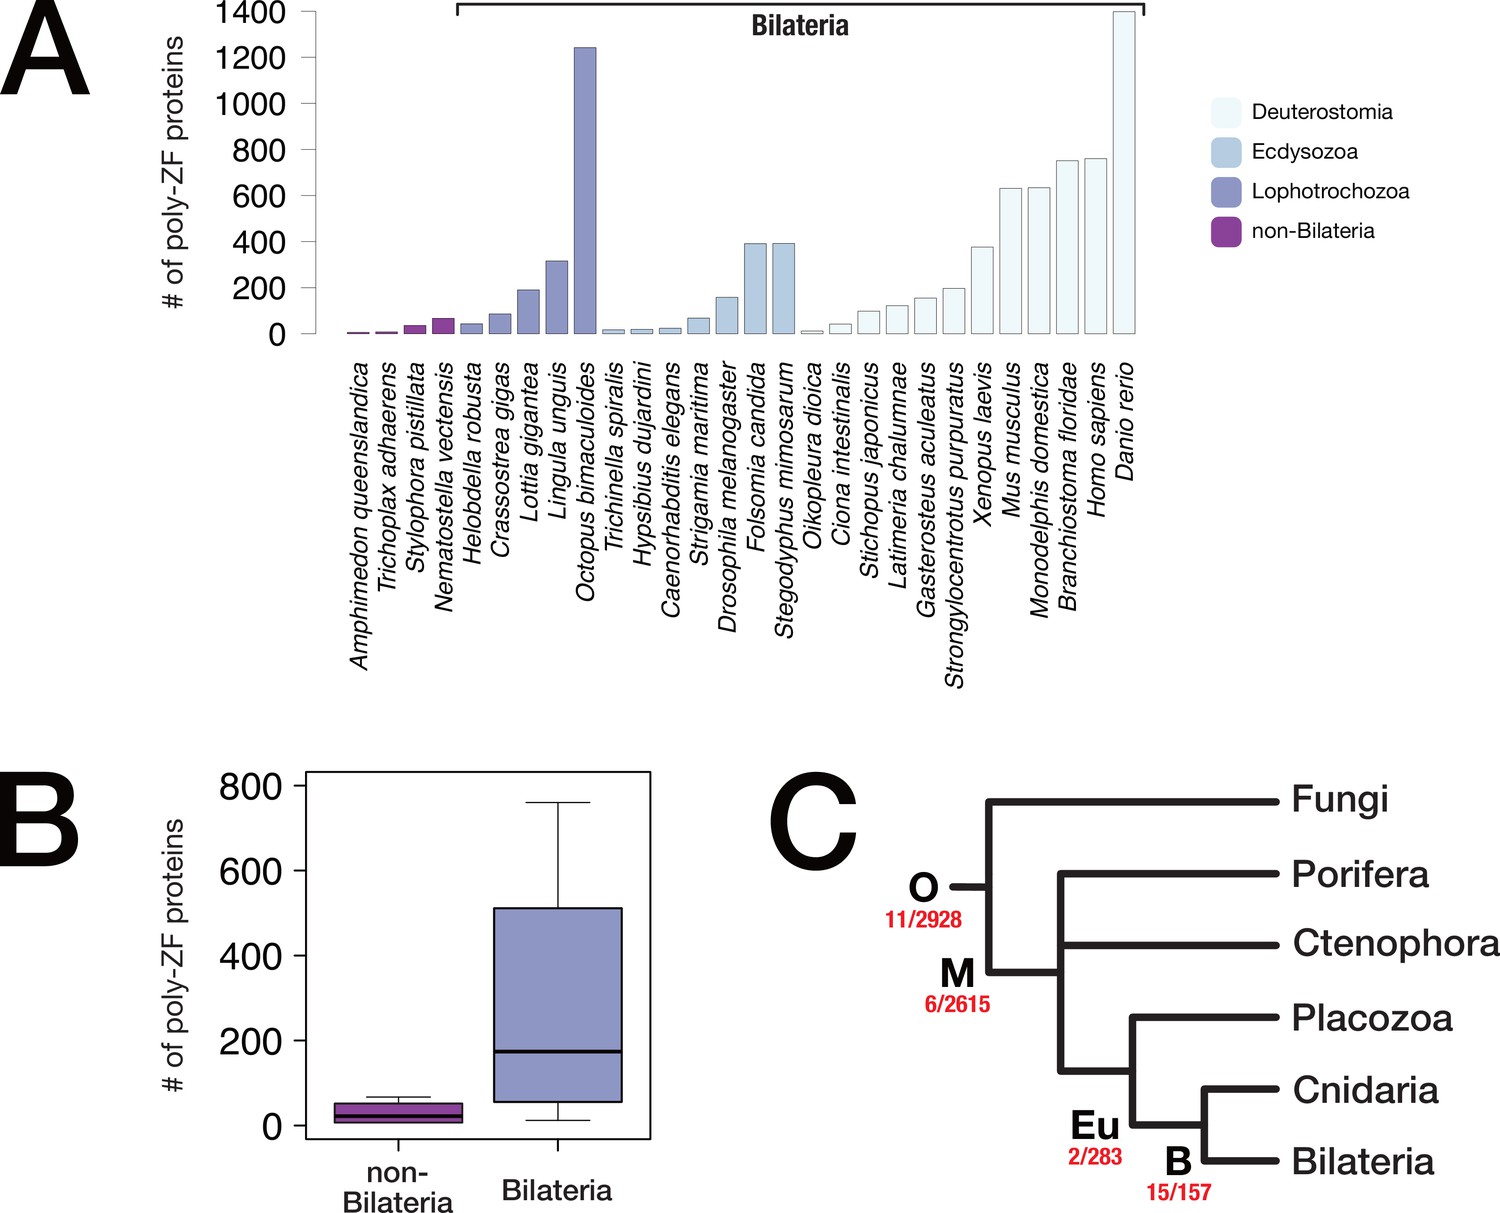
Metazoan poly-zinc finger transcription factor repertoire and evolution.
(A) Reference proteomes of 28 representative metazoans (downloaded from uniprot.org) were scanned for the presence of C2H2 zinc finger proteins. For each species, the number of proteins with ≥6 domains is plotted. (B) Boxplot representation of the number of poly-ZF proteins per genome in non-bilaterian Metazoa (four species) vs. Bilateria (24 species) using scanning results of panel A. (C) Evolutionary origin of poly-ZF proteins. On the basis of our orthology database (BigWenDB), we inferred lineage-specific orthogroups for four lineages, opisthokonts (O), metazoans (M), eumetazoans (Eu), and bilaterians (B), and analysed those orthogroups for the presence of C2H2 poly-ZF proteins with ≥6 domains. The number of such proteins vs. the total number of lineage-specific orthogroups is displayed in red under each node. "O" indicates origin in the ancestor of opisthokonts or earlier.
Figure 2—figure supplement 2
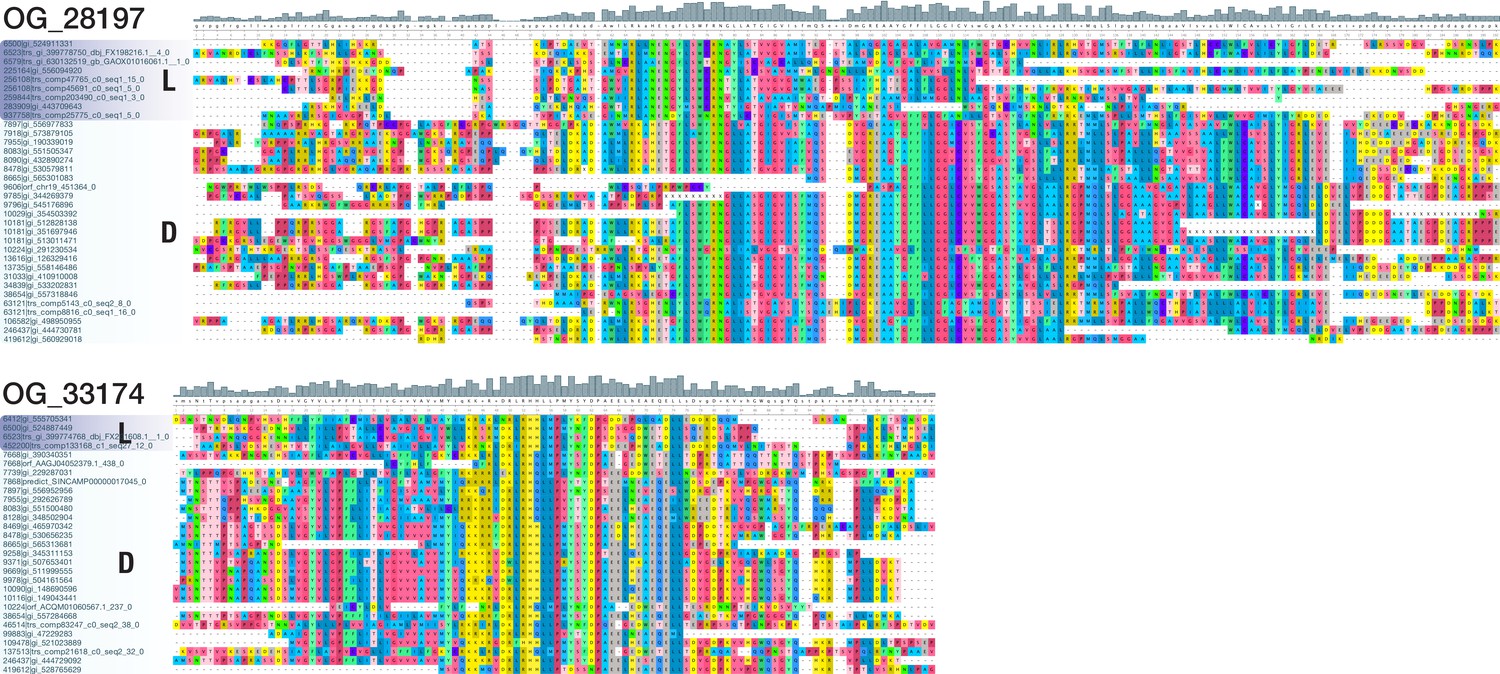
Multiple sequence alignments of two bilaterian-specific orthogroups without known domains.
The detailed view of positions 396–576 of OG_28197 (top; 648 AA alignment with 34 sequences from 22 deuterostomes and 8 lophotrochozoans) and of positions 174–354 of OG_33174 (bottom; 430 AA alignment with 29 sequences from 24 deuterostomes and 4 lophotrochozoans) illustrates the existence of domain-like conservation patterns despite the absence of known protein domains. Coloured blocks indicate sequences of lophotrochozoan (L) and deuterostome (D) origin. The two displayed alignments lack ecdysozoan sequences; they were chosen for their small size and convenient presentation. Short stretches of unaligned sequences were removed for clarity. Dashes indicate sequence gaps. Colouring of amino acids reflects chemical similarity (UGENE standard colour scheme; Okonechnikov et al., 2012). Bar chart on top displays sequence conservation of alignment columns beneath.
Figure 2—figure supplement 3
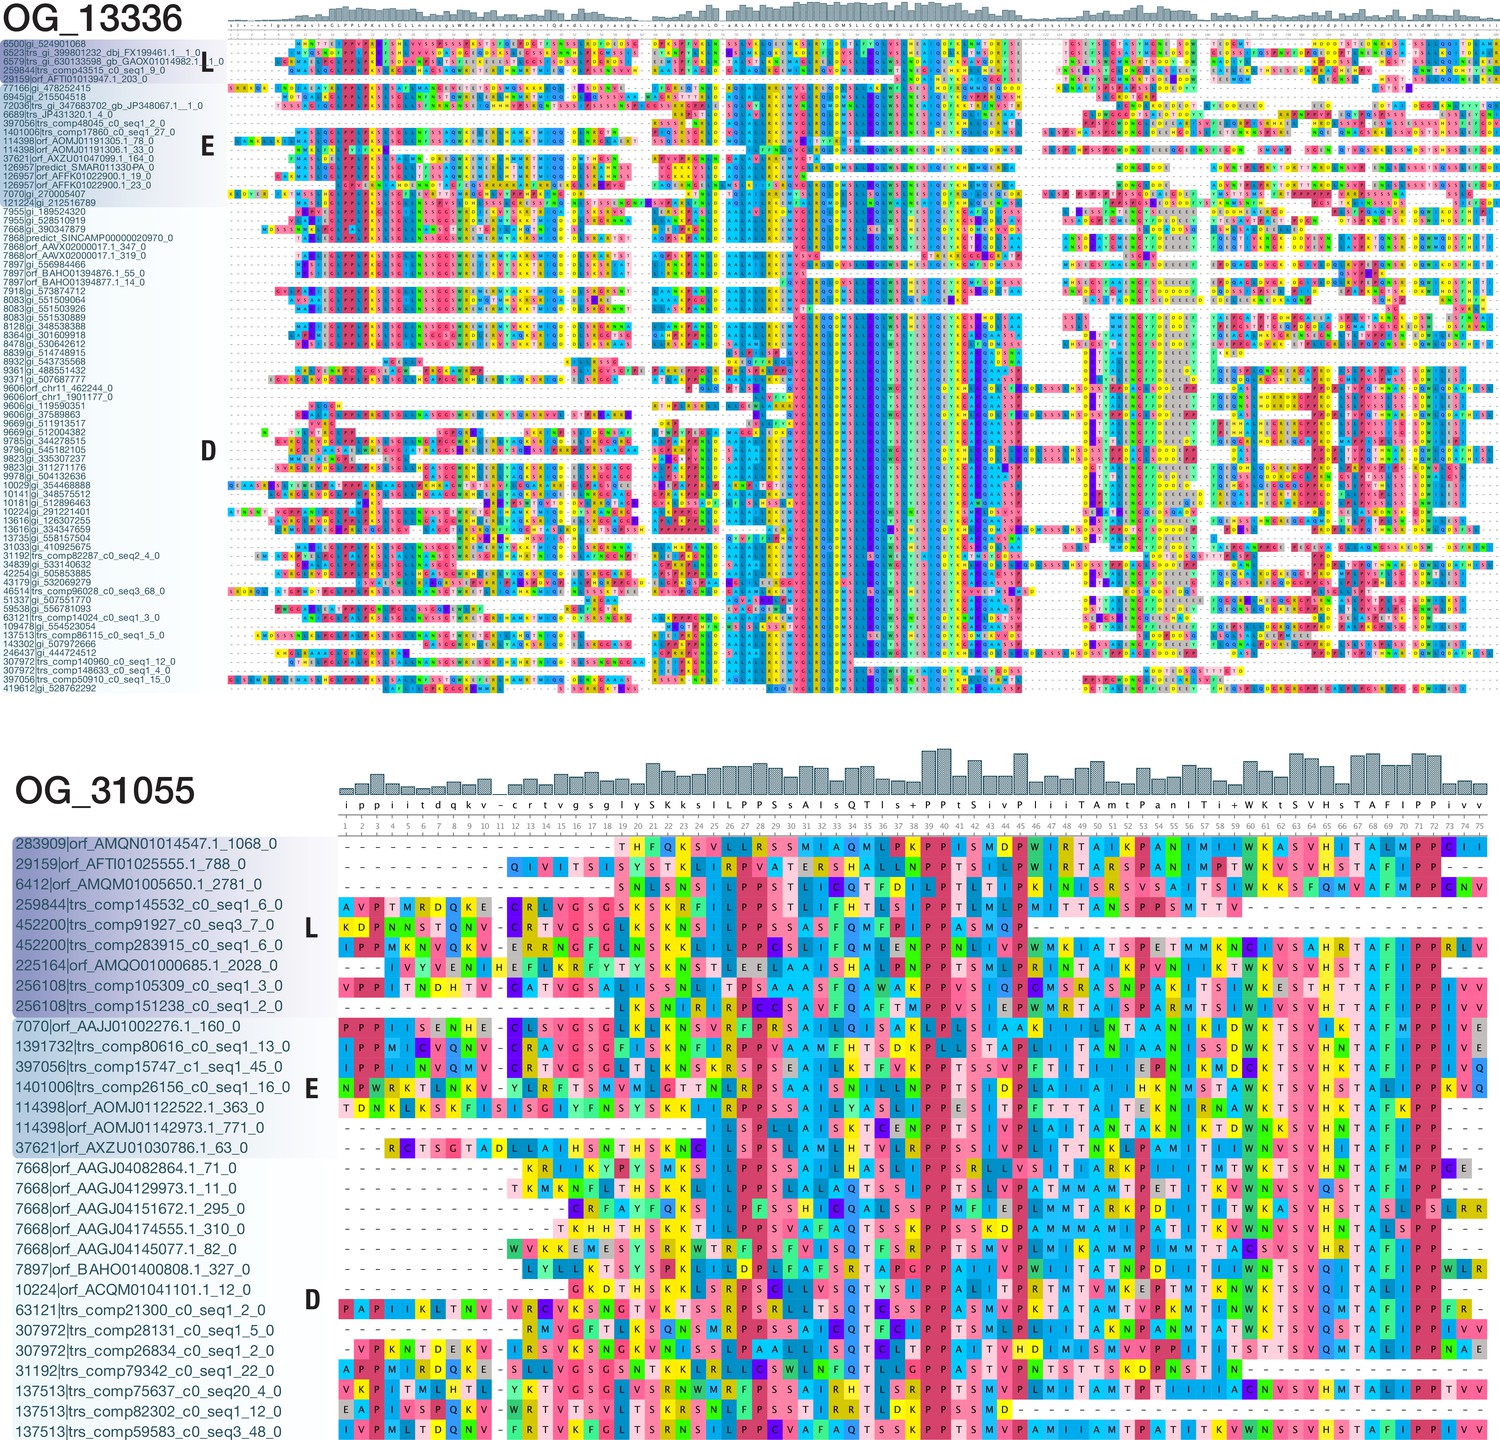
Multiple sequence alignments of OG_13336 and OG_31055, two bilaterian-specific orthogroups without known domains.
View of a 189 AA alignment of OG_13336 (top; 74 sequences from 40 deuterostomes, 11 ecdysozoans, and 5 lophotrochozoans) and of a 75 AA alignment of OG_31055 (bottom; 30 sequences from 8 deuterostomes, 6 ecdysozoans, and 7 lophotrochozoans), illustrating the existence of domain-like conservation patterns despite the absence of known protein domains. Short stretches of unaligned sequences were removed for clarity. Colouring of amino acids reflects chemical similarity (UGENE standard colour scheme; Okonechnikov et al., 2012). Bar chart on top displays sequence conservation of alignment columns beneath. Sequences are ordered according to their origin.
Figure 2—figure supplement 4
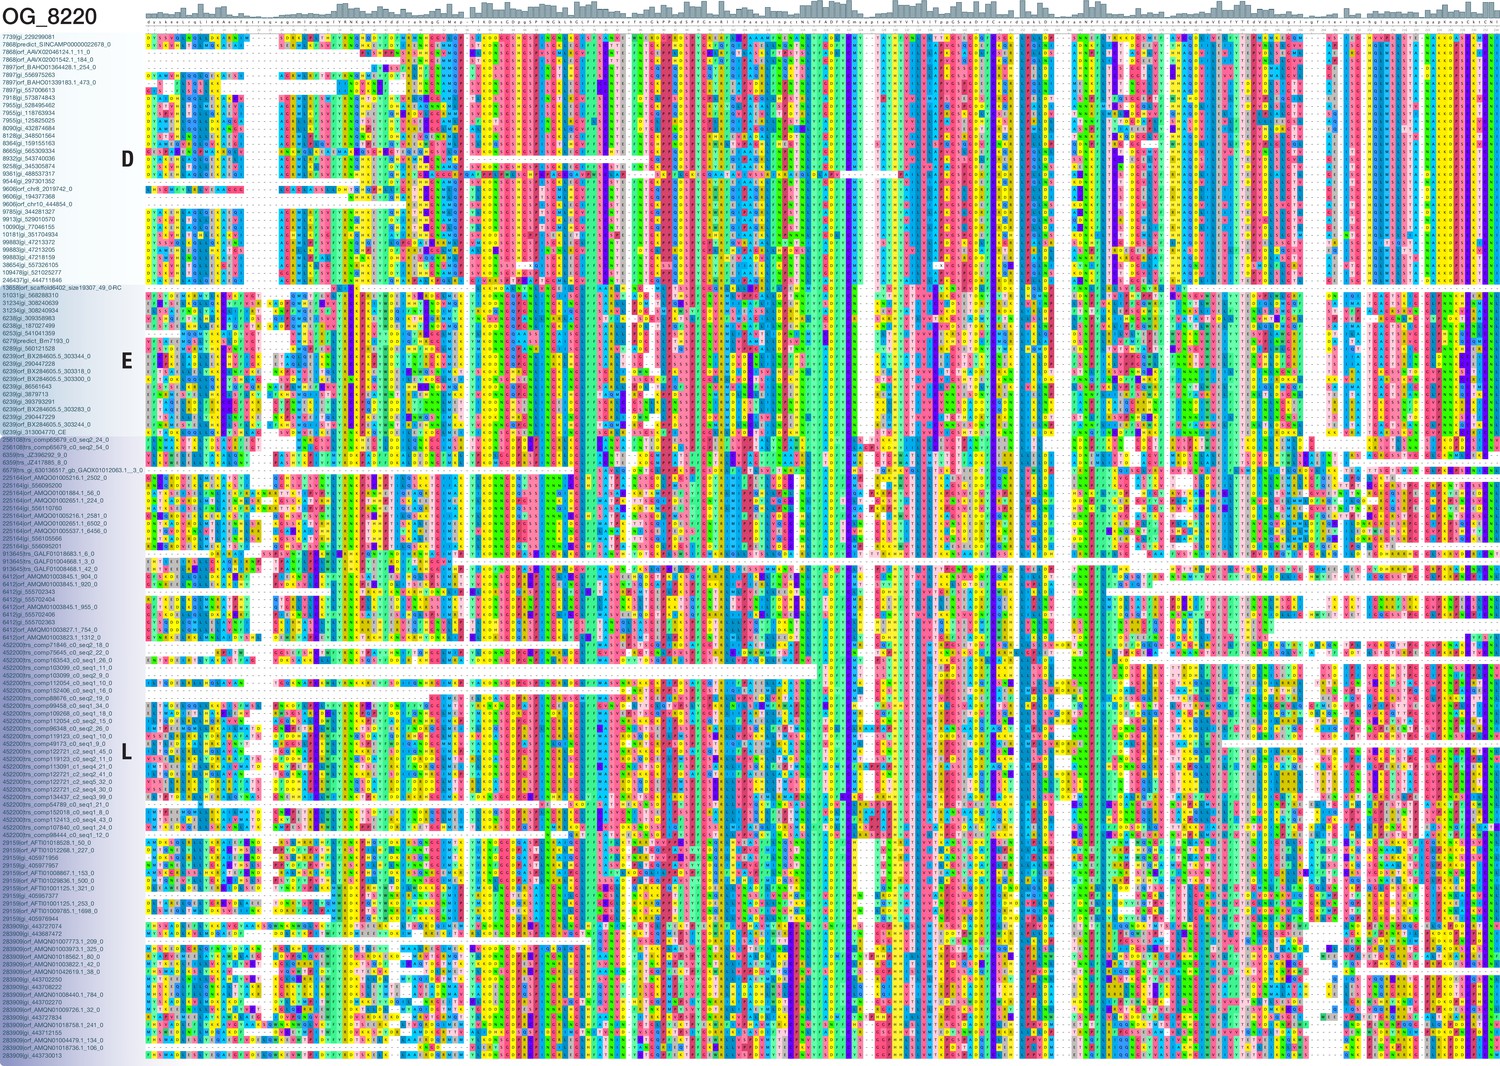
Multiple sequence alignment of OG_8220, another bilaterian-specific orthogroup without known domains.
View of a 234 AA alignment with 135 sequences from 22 deuterostomes, 8 ecdysozoans, and 9 lophotrochozoans, illustrating the existence of domain-like conservation patterns despite the absence of known protein domains. Short stretches of unaligned sequences were removed for clarity. Colouring of amino acids reflects chemical similarity (UGENE standard colour scheme; Okonechnikov et al., 2012). Bar chart on top displays sequence conservation of alignment columns beneath. Sequences are ordered according to their origin.
Figure 3
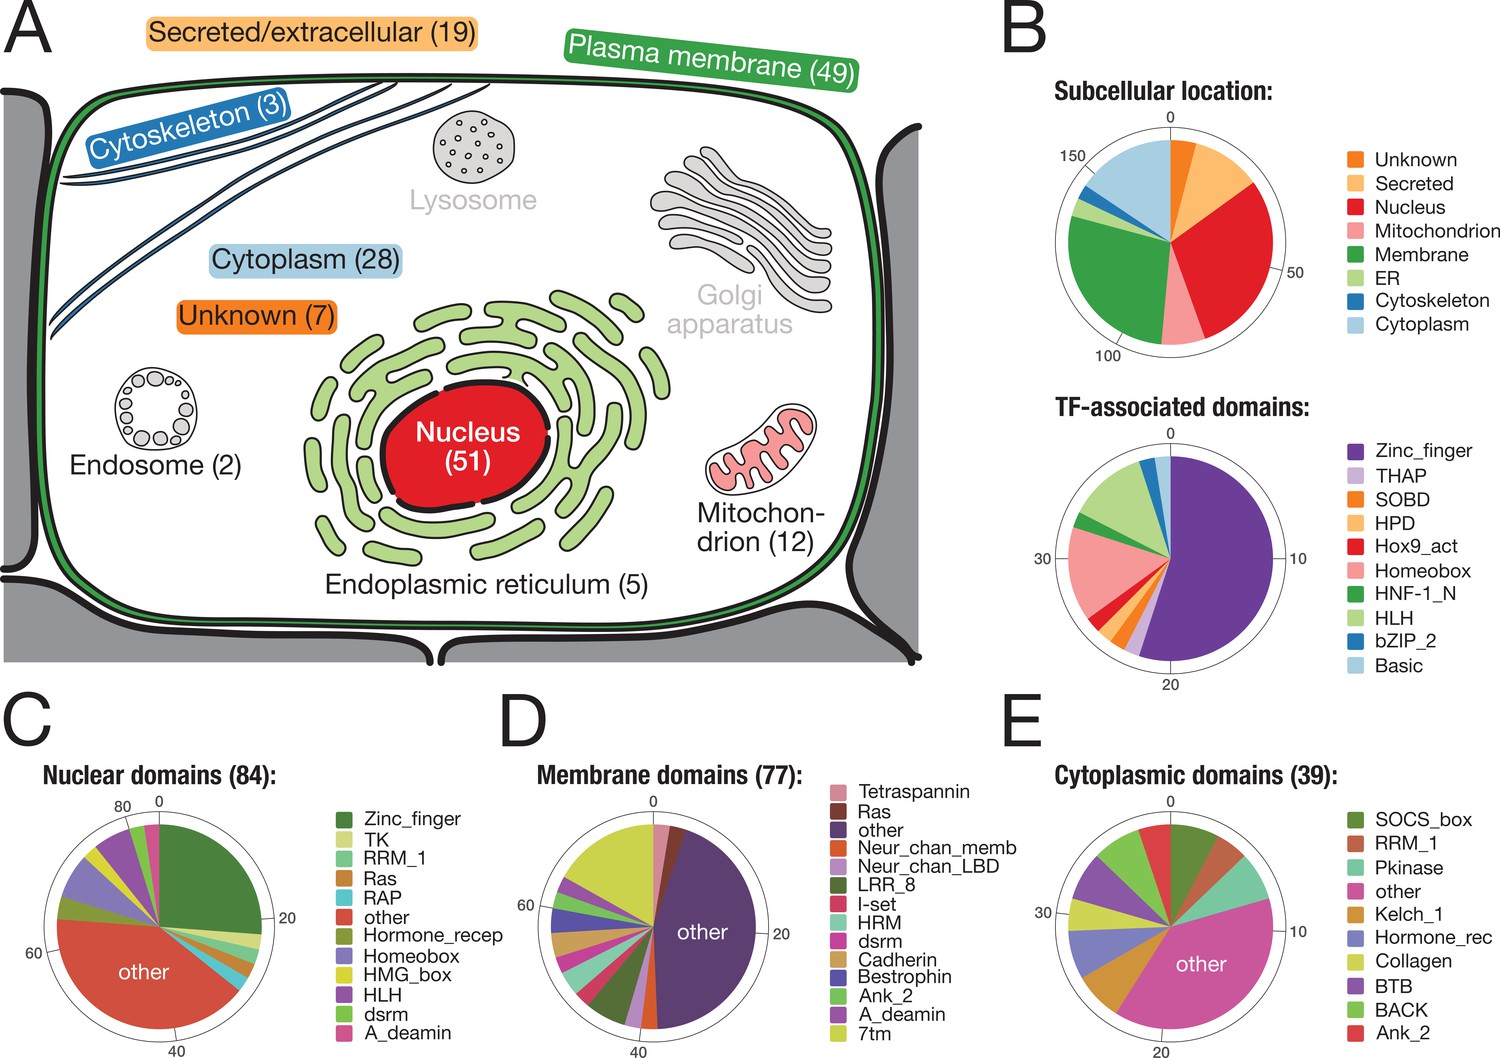
Subcellular location and molecular function of 157 bilaterian-specific genes.
(A) Graphic representation of a eukaryotic cell with its typical organelles. Numbers in parentheses denote the number of bilaterian-specific orthogroups associated predominantly with a given cellular structure. Graphic drawn after the subcellular location section at uniprot.org. (B) Upper chart: Subcellular location of 157 bilaterian-specific genes. Location data is based on the corresponding human orthologues and colour-matched with the graphics in A. Lower chart: Number and name of transcription factor-associated domains present in the set of 157 bilaterian-specific genes. The 40 orthogroups are a subset of 51 orthogroups associated with the nuclear compartment. In most cases, domains names follow Pfam standards (http://pfam.xfam.org/). (C) Distribution of 84 domains found in 51 orthogroups associated with the nucleus. (D) Distribution of 77 domains found in 49 orthogroups associated with the plasma membrane. (E) Distribution of 39 domains found in 28 orthogroups associated with the cytoplasm. "Other" represents domains found only once in the respective category.
Figure 4 with 1 supplement
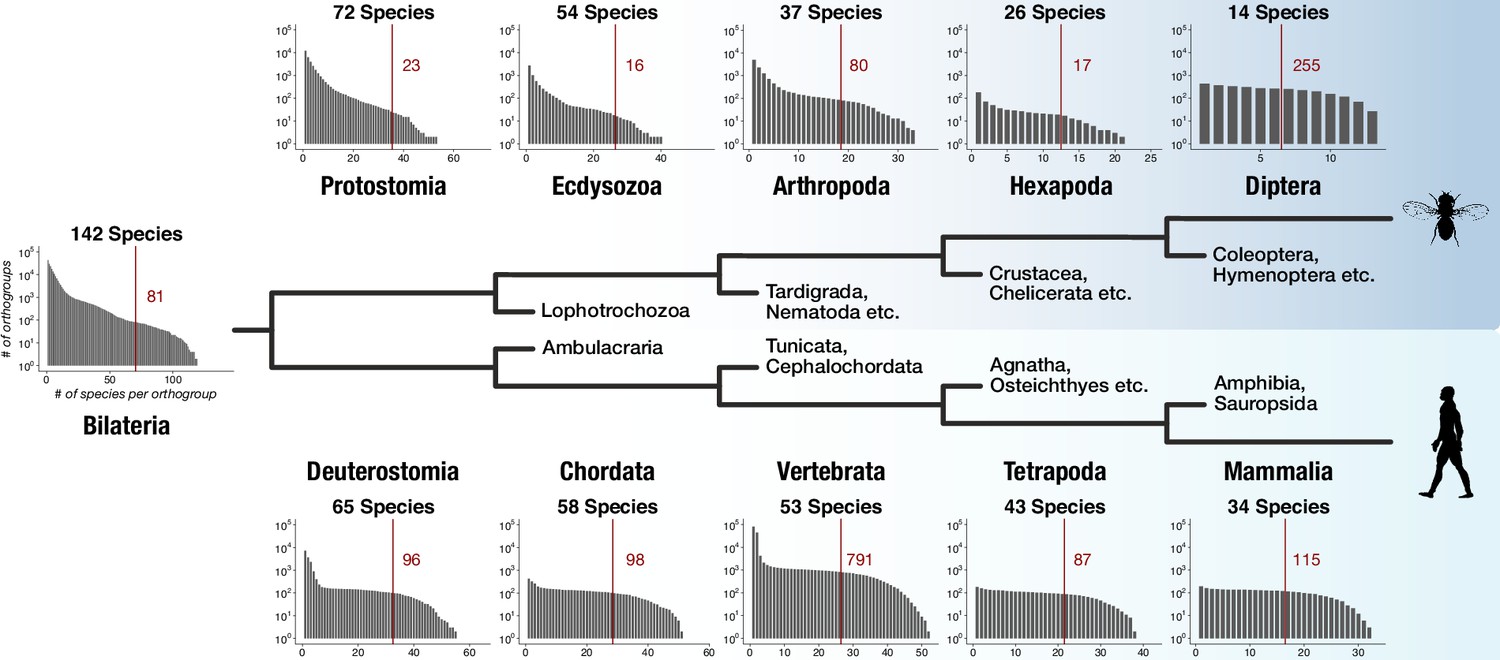
Distinct lineage-specific genes at subsequent nodes of insect and vertebrate evolution.
Starting from Bilateria (left), a protostome lineage leading to dipterans (upper) and a deuterostome lineage leading to mammals (lower) are shown as schematic phylogenetic tree. Sister clades to the selected taxa are denoted on short branches in the center. Each barplot displays the number of lineage-specific orthogroups (y axis) as a function of orthogroup size (x axis) for the selected taxonomic group (Protostomia, Ecdysozoa, Arthropoda etc.). The total species count (within BigWenDB) for each of the eleven taxonomic groups is indicated on top of the corresponding barplots (# Species). The count of lineage-specific genes decreases with growing orthogroup size. A red line denotes the number of orthogroups in which at least 50% of the species of a selected lineage are present. The corresponding number of lineage-specific orthogroups is highlighted in red next to the line.
Figure 4—figure supplement 1
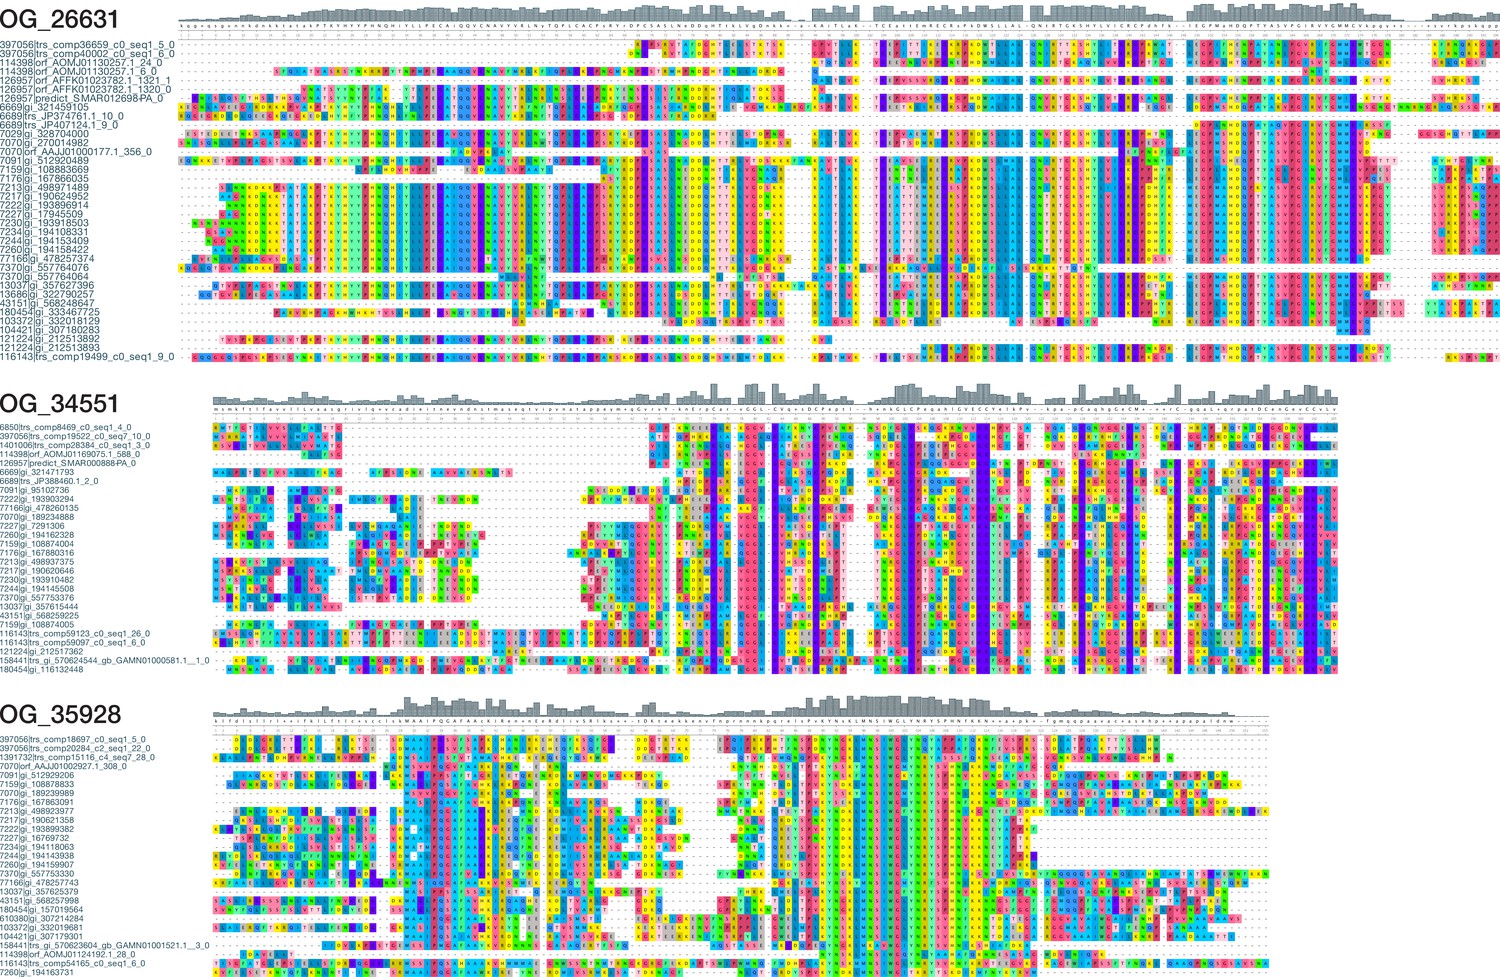
Exemplary multiple sequence alignments of three arthropod-specific orthogroups without known domains.
Top: View of a 194 AA alignment of OG_26631 with 36 sequences from 2 chelicerate, 1 myriapod, 2 crustacean, and 23 hexapod species. Center: View of a 165 AA alignment of OG_34551 with 28 sequences from 4 chelicerate, 1 myriapod, 2 crustacean, and 19 hexapod species. Bottom: View of a 155 AA alignment of OG_35928 with 27 sequences from 2 chelicerate, 1 myriapod, and 21 hexapod species. The alignments illustrate the existence of domain-like conservation patterns despite the absence of known protein domains. Short stretches of unaligned sequences were removed for clarity. Colouring of amino acids reflects chemical similarity (UGENE standard colour scheme; Okonechnikov et al., 2012). Bar chart on top displays sequence conservation of alignment columns beneath. Additional HMM-HMM searches suggest that the conserved regions constitute protein domains restricted to arthropods (Supplementary file 1–Supplementary Table 13).
Figure 5 with 4 supplements
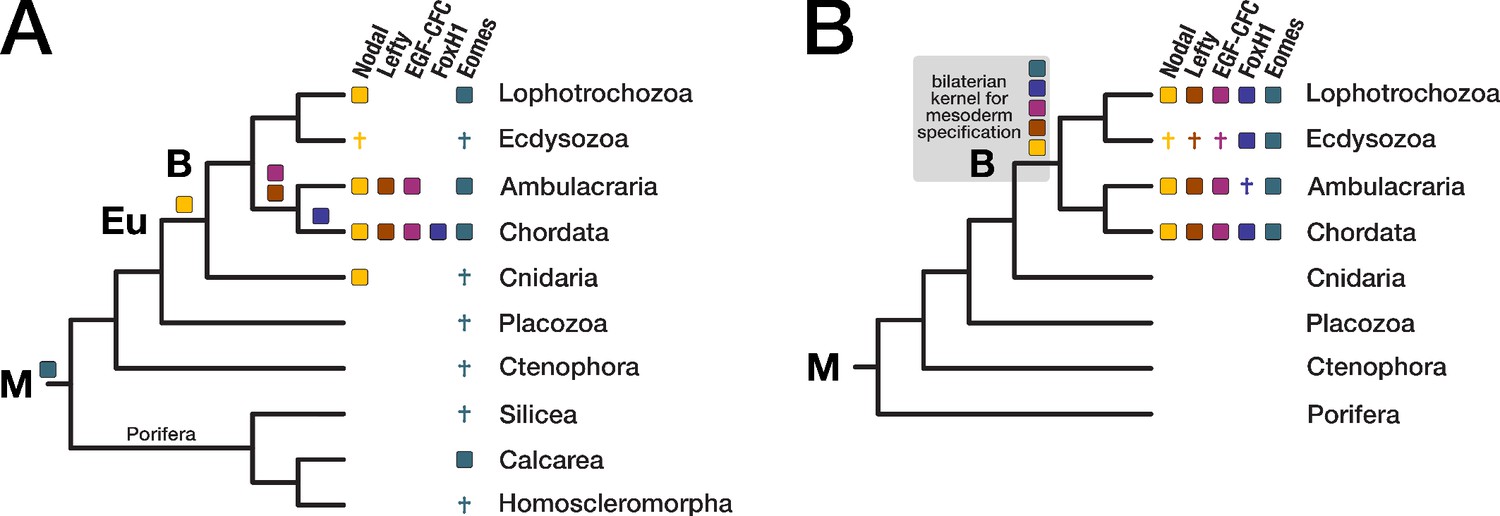
Evolution of the Nodal signaling pathway.
Two consensus phylogenetic trees showing the relationship of major metazoan lineages. The five factors of the Nodal signalling pathway (Nodal, Lefty, EGF-CFC, FoxH1, and Eomes) are displayed as coloured boxes. Their phylogenetic distribution and inferred evolutionary origin are mapped onto the tree. Gene births are indicated as coloured boxes above the respective branch. Inferred losses are represented by crosses. Bold labels to the left of a branch indicate branch ancestors: B = Bilateria, Eu = Eumetazoa, M = Metazoa. (A) Previous results regarding the evolution of Nodal pathway genes, as known from the literature. (B) Revised evolutionary history of the Nodal pathway genes according to our results. Note that none of the five factors has been found in arthropods and nematodes. The ecdysozoan boxes for Eomes and FoxH1 are derived from the presence of the genes in a single priapulid species. Grey shading: Hypothetical emergence of a putative kernel for mesoderm specification and neural patterning.
Figure 5—figure supplement 1
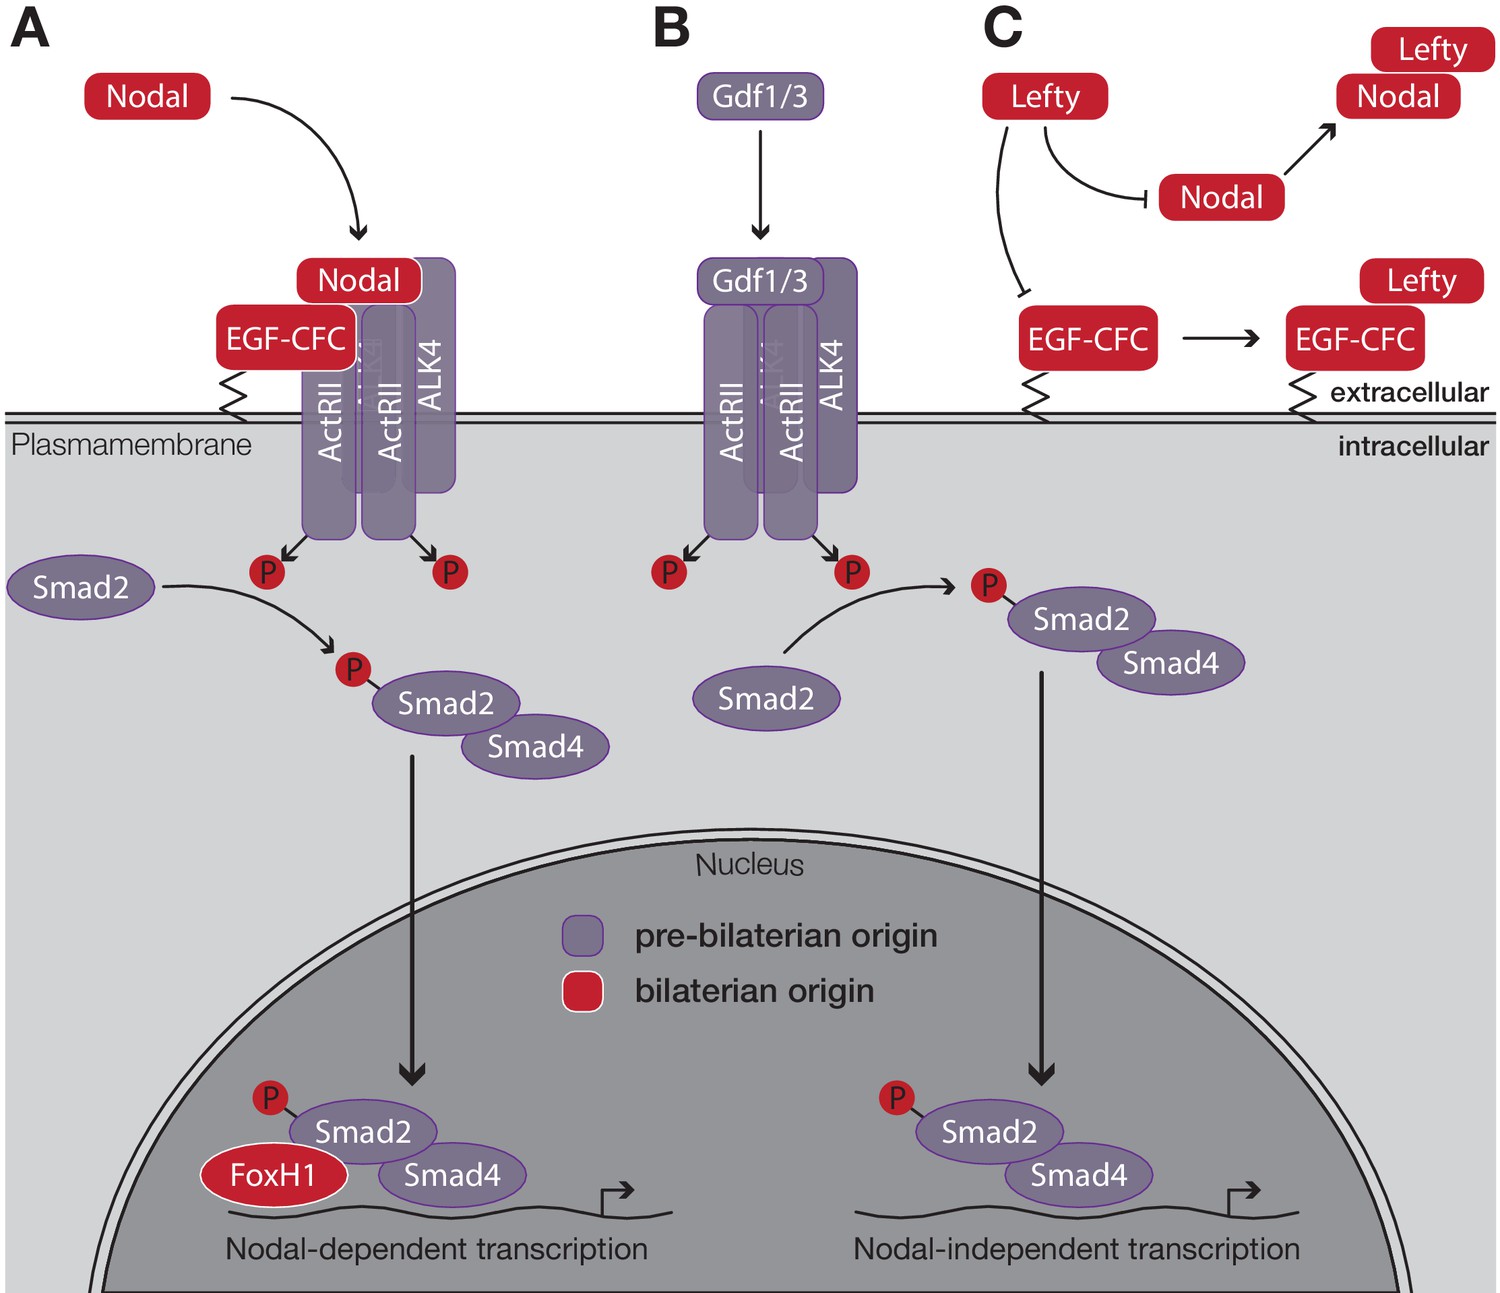
Schematic outline of the Nodal signaling pathway in vertebrates.
(A) Nodal binds to its cell surface receptor in the presence of the co-receptor EGF-CFC, activating the resulting complex. After phosphorylation, the Smad2/Smad4 complex translocates to the nucleus. Upon binding of the transcription factor FoxH1, transcription of Nodal target genes is initiated. (B) Nodal-independent transcription via the same pathway does not require the co-receptor EGF-CFC or the transcription factor FoxH1. (C) Lefty antagonises Nodal function by blocking either its co-receptor, EGF-CFC, or by directly binding to Nodal. Factors that evolved in the ancestor of bilaterians are displayed in red, all other factors evolved in the ancestor of eumetazoans or earlier. Figure modified after Shen, 2007.
Figure 5—figure supplement 2
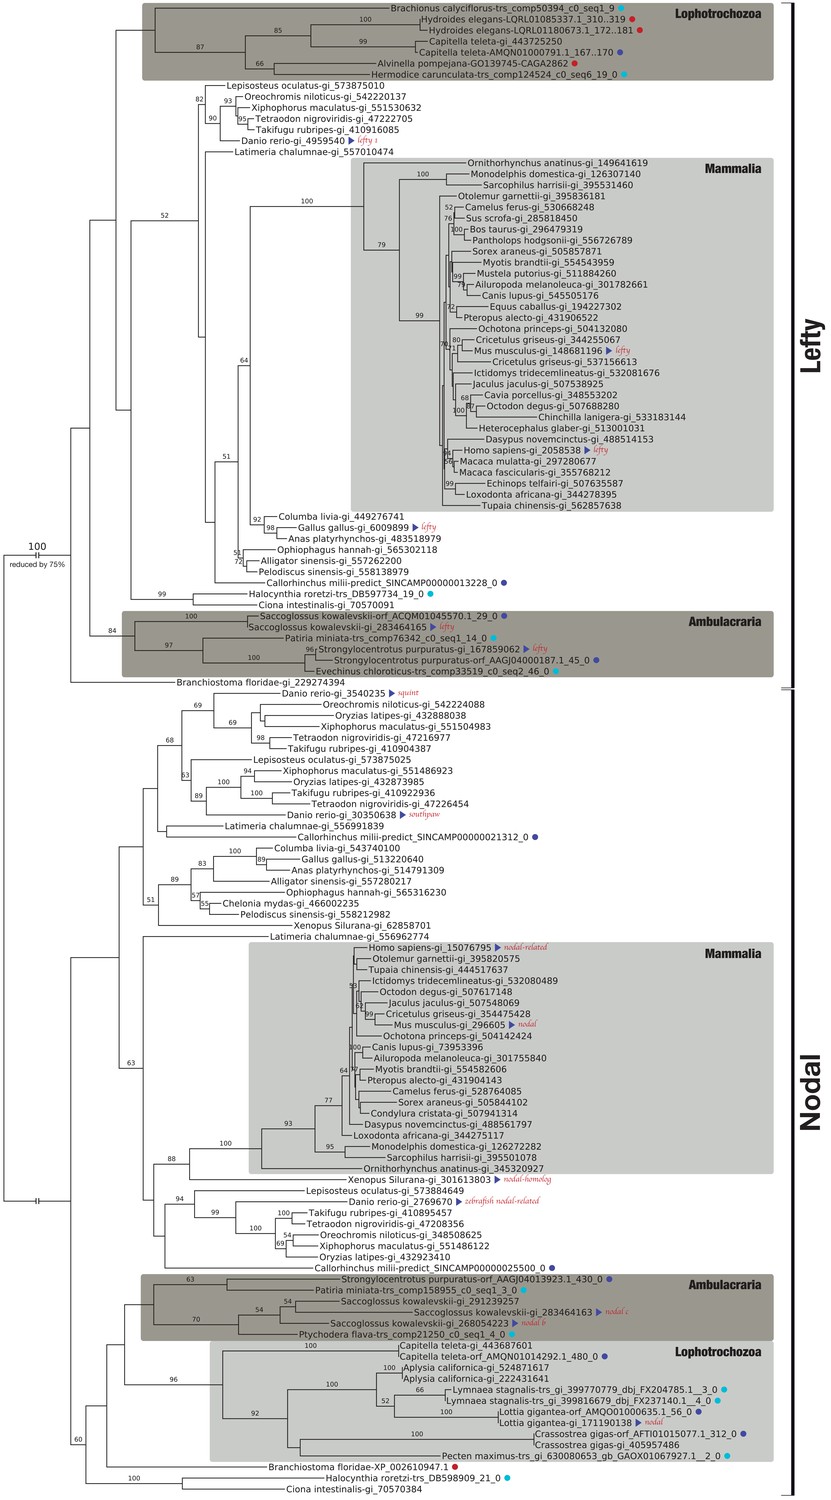
Bilaterian-specific distribution of the Nodal pathway components Nodal and Lefty.
Maximum likelihood phylogeny of selected bilaterian Lefty and Nodal proteins. The corresponding multiple sequence alignment consists of 24 sequences with 446 columns and 29.01% gaps and undetermined characters. The sequences correspond to OG_11821 (Lefty) and OG_12210 (Nodal) of the original clustering plus several additional candidate sequences from public repositories (red dots). Blue dots highlight whether a sequence is derived from transcriptomic (light blue) or genomic ORF data (dark blue). All other sequences can be accessed at NCBI with the gene identifiers given as branch labels. Blue triangles identify previously described Lefty and Nodal reference sequences. Bootstrap values below 50% are removed for clarity. There are three Nodal-related genes in teleosts, cyclops, squint, and southpaw, as a result of lineage-specific duplications (Fan and Dougan, 2007).
Figure 5—figure supplement 3
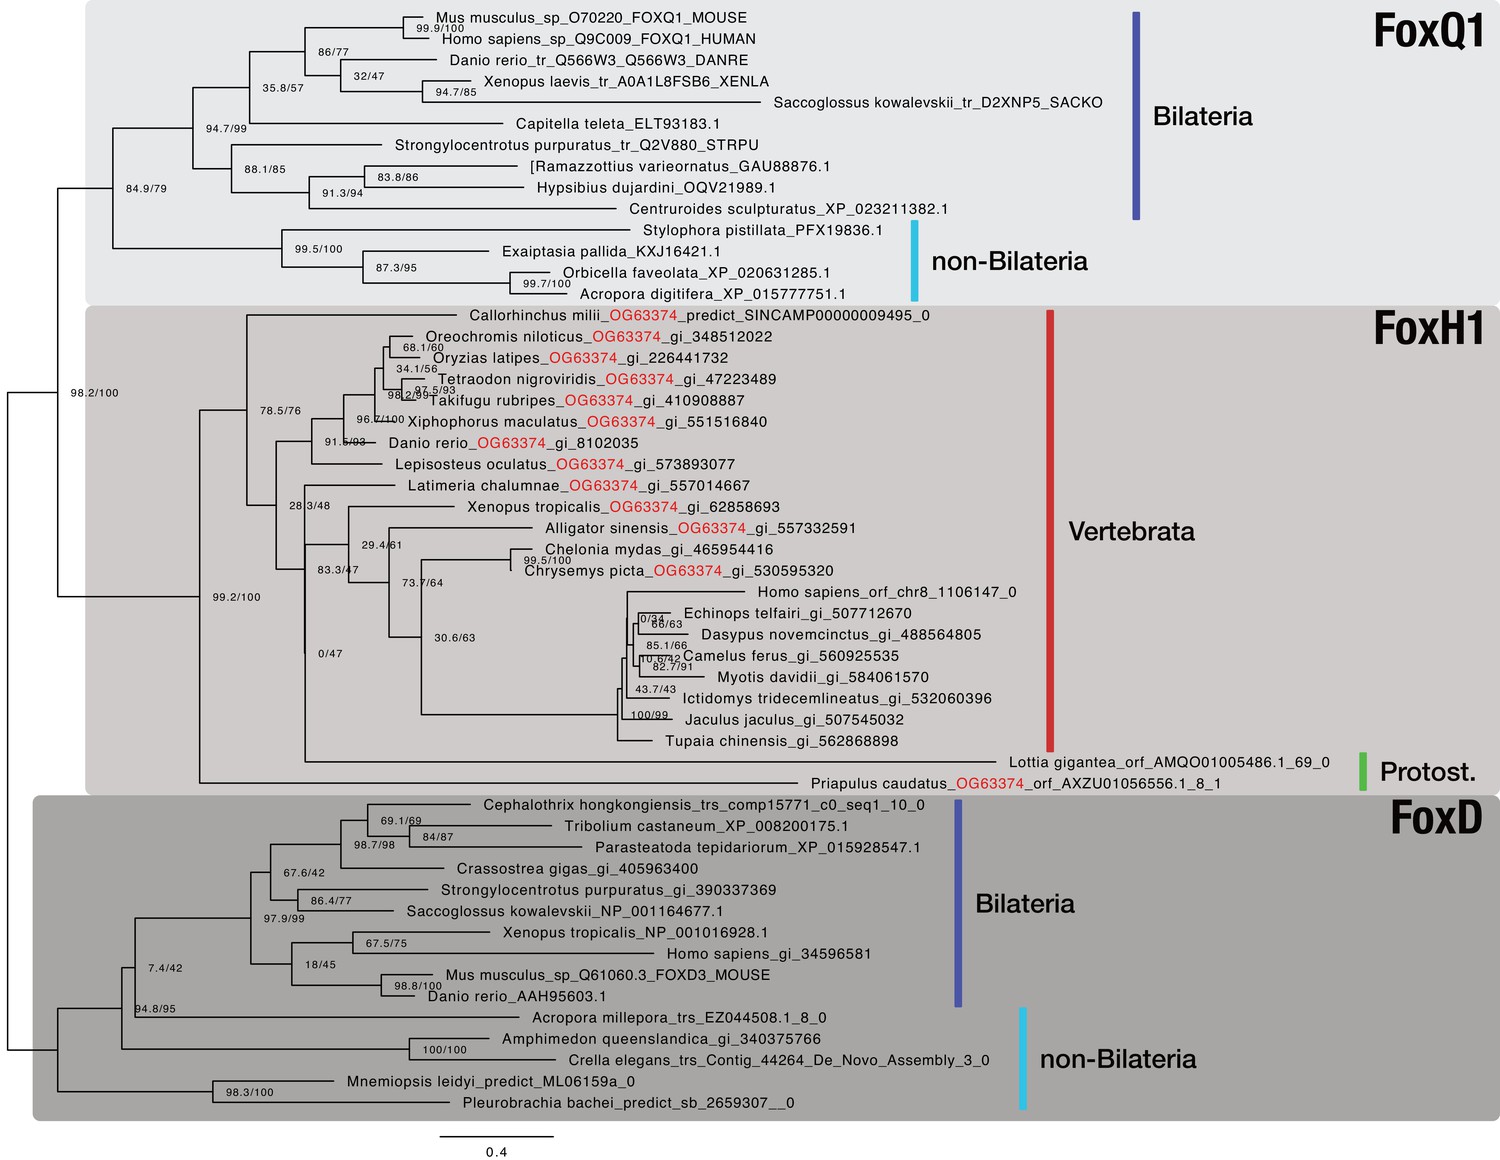
Bilaterian-specific distribution of the Nodal pathway component FoxH1.
Maximum likelihood phylogeny of selected metazoan Fox genes. The multiple sequence alignment consists of 52 sequences aligned over 315 positions (proportion of gaps and undetermined characters: 25.07%). It is generated from OG_36001 (FoxH1), OG_63374 (RBH with OG_36001; orthogroup ID labeled in red), and representative sequences of OG_3972 (FoxD4 as outgroup; third-best hit of OG_36001 in HMM-HMM searches, see Supplementary file 1–Supplementary Table 14) of the original clustering. Selected FoxQ1 proteins were used as outgroup as FoxQ1 resembled the closest relative of FoxH1 proteins in other studies (Yu et al., 2008; Fritzenwanker et al., 2014). Vertebrate and protostomian FoxH1 sequences are decorated with a red and green bar, respectively. Sequences derived from genomic and transcriptomic ORFs are labelled with "|orf_", "|trs_", or "|predict_". All other sequences can be accessed at NCBI with the given identifiers. Branch labels correspond to the results of SH-aLRT (Shimodaira–Hasegawa-like approximate likelihood ratio test, left) and UFBoot (ultrafast bootstrap approximation, right) as implemented in IQ-TREE (Nguyen et al., 2015).
Figure 5—figure supplement 4
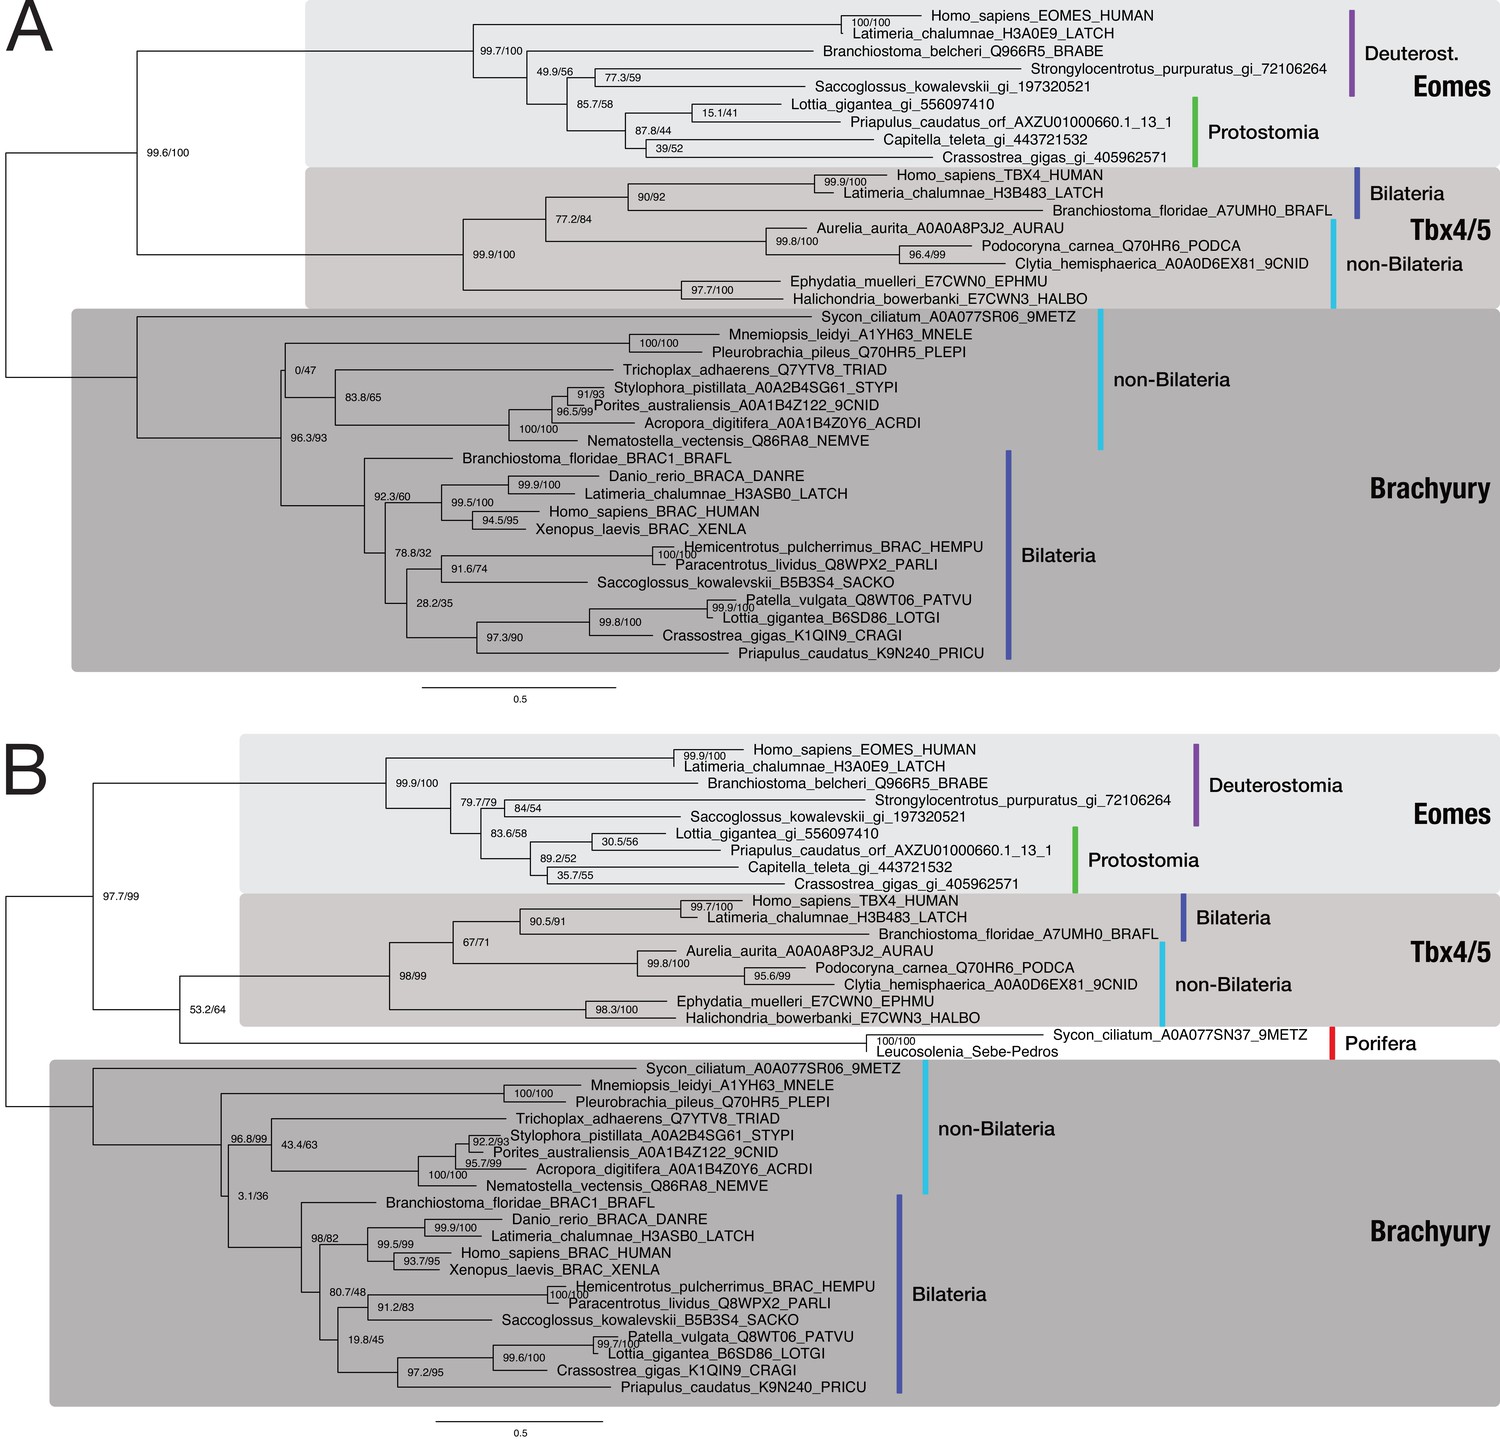
Bilaterian-specific distribution of the Nodal pathway component Eomesodermin.
(A) Maximum likelihood phylogeny of selected poriferan and bilaterian Eomesodermin sequences. The multiple sequence alignment consists of 37 sequences aligned over 434 positions (proportion of gaps and undetermined characters: 22.80%). Sequences were downloaded from uniprot.org or taken from NCBI (gi_*). TBX4 and Brachyury sequences serve as outgroups because they are most closely related to the Eomes family according to Sebé-Pedrós et al., 2013 and HMM-HMM searches (Supplementary file 1–Supplementary Table 14). A phylogenetic analysis with an identical dataset, including the two poriferan Eomes candidates (highlighted in red; from Sebé-Pedrós et al., 2013), is presented in panel B (39 sequences aligned over 435 positions; proportion of gaps and undetermined characters: 23.64%). Branch labels correspond to the results of SH-aLRT (Shimodaira–Hasegawa-like approximate likelihood ratio test, left) and UFBoot (ultrafast bootstrap approximation, right) as implemented in IQ-TREE (Nguyen et al., 2015). Tree topology and corresponding bootstrap values do not clearly assign the poriferan sequences to the Eomes family of T box proteins.
Figure 6 with 3 supplements
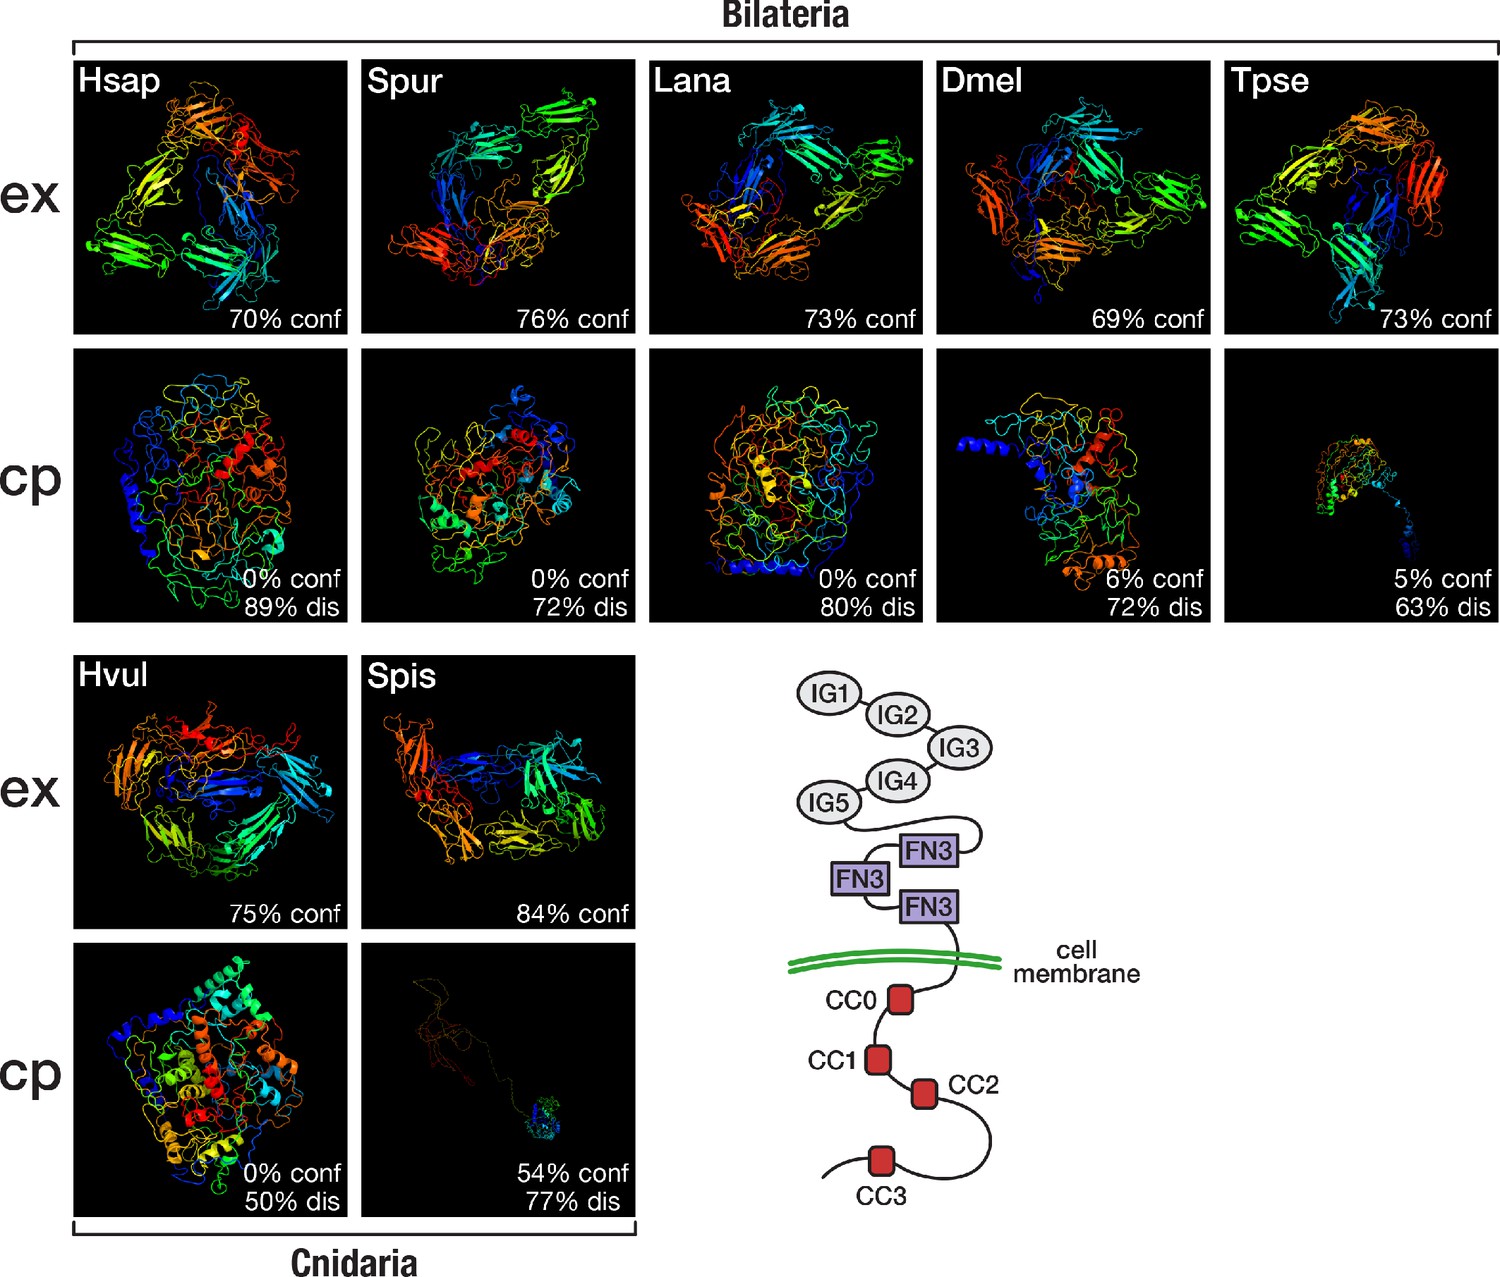
Structural predictions of cnidarian and bilaterian Robo proteins.
Top (ex): Predicted structure of the extracellular domain plus transmembrane region of seven selected Robo proteins. Bottom (cp): Predicted structure of the transmembrane region plus cytoplasmic part of seven selected Robo proteins. Robo1 orthologues of two deuterostomes (Hsap = Homo sapiens; Spur = Strongylocentrotus purpuratus), one lophotrochozoan (Lana = Lingula anatina), two ecdysozoans (Dmel = Drosophila melanogaster; Tpse = Trichinella pseudospiralis), and two cnidarians (Hvul = Hydra vulgaris; Spis = Stylophora pistillata) were analysed. "% conf" indicates the percentage of residues modelled at >90% confidence. "% dis" indicates the predicted percentage of disordered regions. Bottom right: Schematic outline of the Robo domain structure with five immunoglobulin domains (IG1–IG5) and three fibronectin type III domains (FN3) in the extracellular part and four conserved cytoplasmic motifs (CC0–CC3) in the intracellular part. Like their bilaterian counterparts, cnidarian Robo candidates display a disorganised protein structure in the cytoplasmic part despite differences in structural features (Figure 6—figure supplement 1, Figure 6—figure supplement 2). The extracellular part (top row), on the other hand, is similarly organised across metazoans.
Figure 6—figure supplement 1
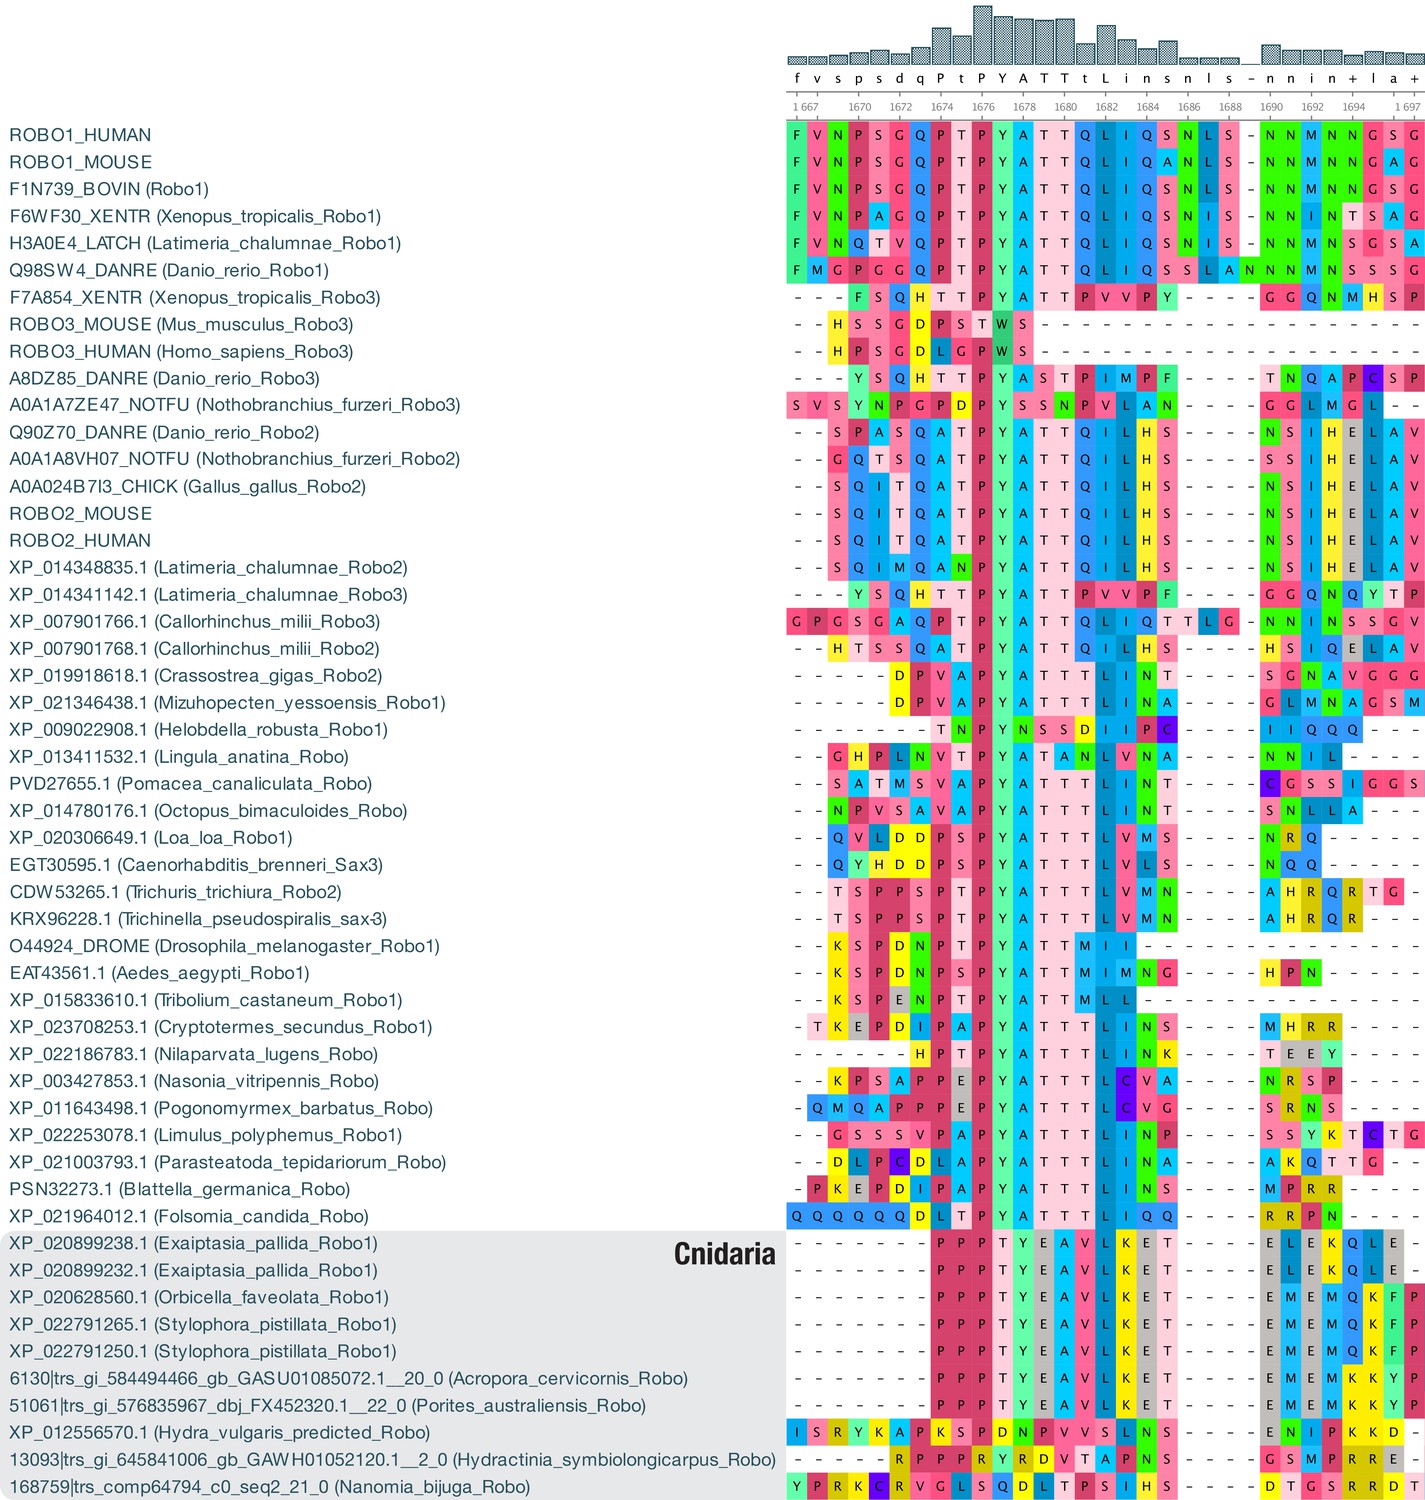
Change of the conserved cytoplasmic motif CC1 in cnidarian Robo-like proteins.
Multiple sequence alignment of 41 bilaterian and 10 cnidarian (bottom) Robo proteins. A fragment of the full alignment is shown (AA 1667–1697), centering on the conserved cytoplasmic motif CC1 (corresponding to sequence "TPYATTQLI" of human Robo1). Colouring of amino acids reflects chemical similarity (UGENE standard colour scheme; Okonechnikov et al., 2012). Bar chart on top displays sequence conservation of alignment columns beneath. Despite the presence of a potential tyrosine phosphorylation site (Y), the CC1 motif is not conserved in cnidarian Robo-like proteins.
Figure 6—figure supplement 2
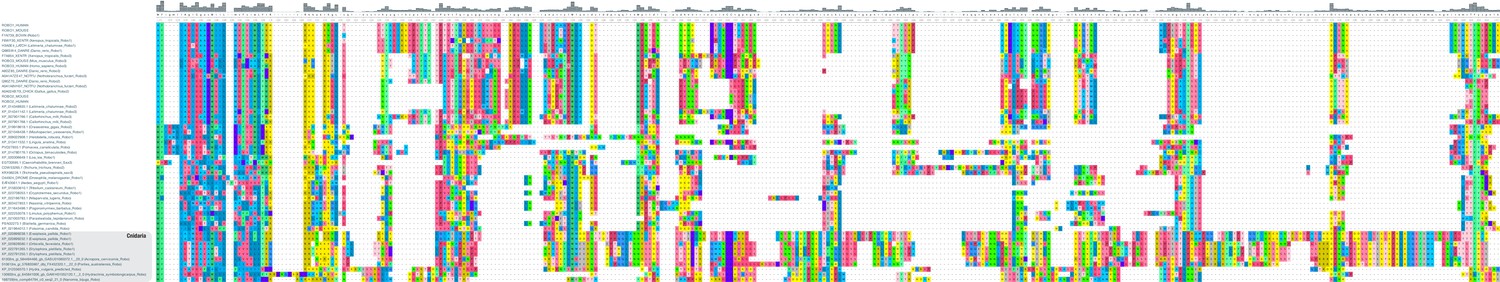
Cnidarian Robo-like proteins display structural alterations.
Multiple sequence alignment of 41 bilaterian and 10 cnidarian (bottom) Robo proteins. A fragment of the full alignment is shown (AA 1271–1617), starting with the transmembrane region (blue part on the left). Colouring of amino acids reflects chemical similarity (UGENE standard colour scheme; Okonechnikov et al., 2012). Bar chart on top displays sequence conservation of alignment columns beneath. Cnidarian Robo-like proteins possess insertions and deletions relative to bilaterian Robos, especially at the beginning of the cytoplasmic part.
Figure 6—figure supplement 3
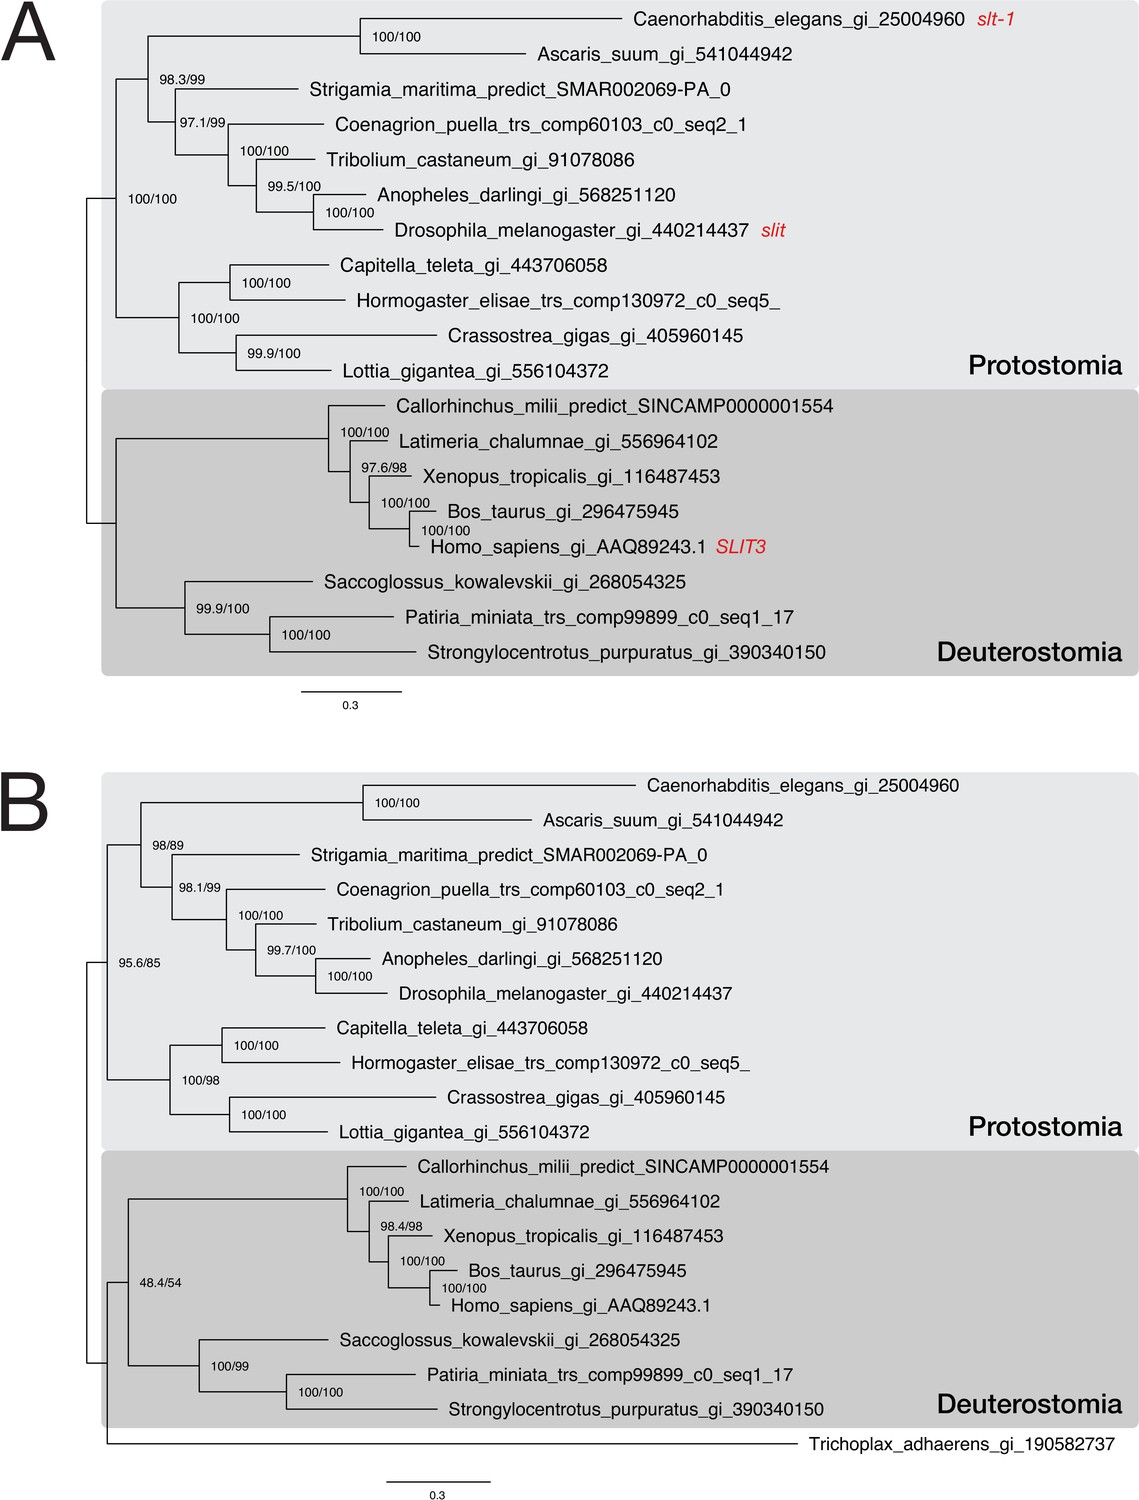
Phylogenetic analysis of a putative Trichoplax adhaerens Slit protein.
Two maximum likelihood phylogenies of representative bilaterian Slit sequences. Sequences were downloaded from NCBI or extracted from the corresponding Slit orthogroup OG_5717. In subfigure (A), the multiple sequence alignment consists of 19 sequences aligned over 1,800 positions (proportion of gaps and undetermined characters: 24.15%). In (B), a single protein from the placozoon Trichoplax adhaerens was added to the dataset, generating an alignment of 20 sequences over 1,865 positions (proportion of gaps and undetermined characters: 26.73%). Branch labels correspond to the results of SH-aLRT (Shimodaira–Hasegawa-like approximate likelihood ratio test, left) and UFBoot (ultrafast bootstrap approximation, right) as implemented in IQ-TREE (Nguyen et al., 2015). Tree topology and corresponding bootstrap values are compatible with assigning the placozoan sequence to the Slit protein family.
Figure 7 with 1 supplement

The bilaterian-wide distribution of neurotrophic factors.
The NTRK receptor and 14 major neurotrophic factors are displayed as coloured boxes. Their phylogenetic distribution and inferred evolutionary origin are mapped onto the tree (see Supplementary file 1–Supplementary Table 22 and Supplementary file 1–Supplementary Table 23). Gene births are indicated as coloured boxes above the respective branch of the tree (left). Inferred losses are shown as coloured crosses in the matrix. Bold labels to the left of a branch indicate branch ancestors: Ac = Actinopterygii, B = Bilateria, Ch = Chordata, Eu = Eumetazoa, Gn = Gnathostomata, M = Metazoa, Sa = Sarcopterygii. The neurotrophic factors of Cladistia, the sister group of Actinopteri, are inferred and distinguished by a question mark as the dataset lacks species from this lineage.
Figure 7—figure supplement 1
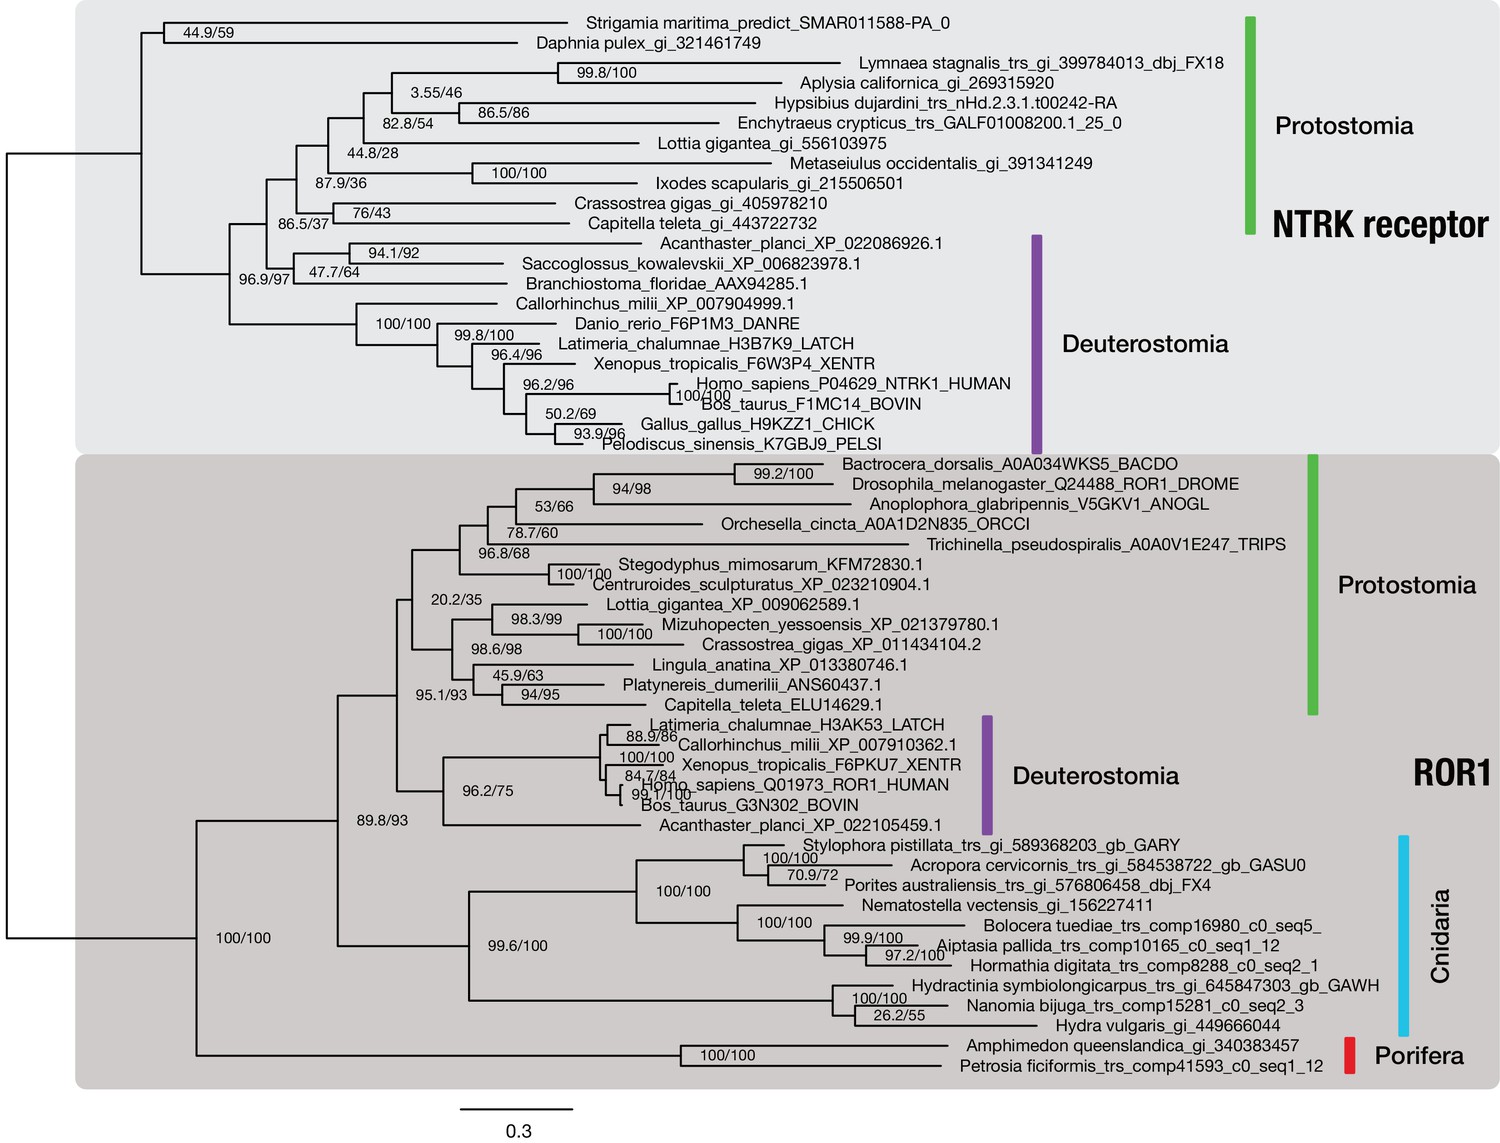
The NTRK neurotrophin receptor is restricted to bilaterians.
Maximum likelihood phylogenetic analysis of 53 metazoan NTRK and ROR1 sequences (outgroup), aligned over 602 AA. Proportion of gaps and completely undetermined characters in the corresponding alignment: 16.84%. Sequences were collected from different sources: NTRK receptor sequences from protostomes are derived from OG_8965–1.4 of the 1.4 clustering, an orthogroup containing RTKs only (Supplementary file 1–Supplementary Table 24). Deuterostomian NTRK sequences were collected at www.uniprot.org. Non-bilaterian ROR1 sequences were obtained from OG_6493–1.4, the ROR1-specific orthogroup of the 1.4 clustering (Supplementary file 1–Supplementary Table 24), while most bilaterian ROR1 sequences were downloaded from www.uniprot.org. Branch labels correspond to the results of SH-aLRT (Shimodaira–Hasegawa-like approximate likelihood ratio test, left) and UFBoot (ultrafast bootstrap approximation, right) as implemented in IQ-TREE (Nguyen et al., 2015).
Figure 8
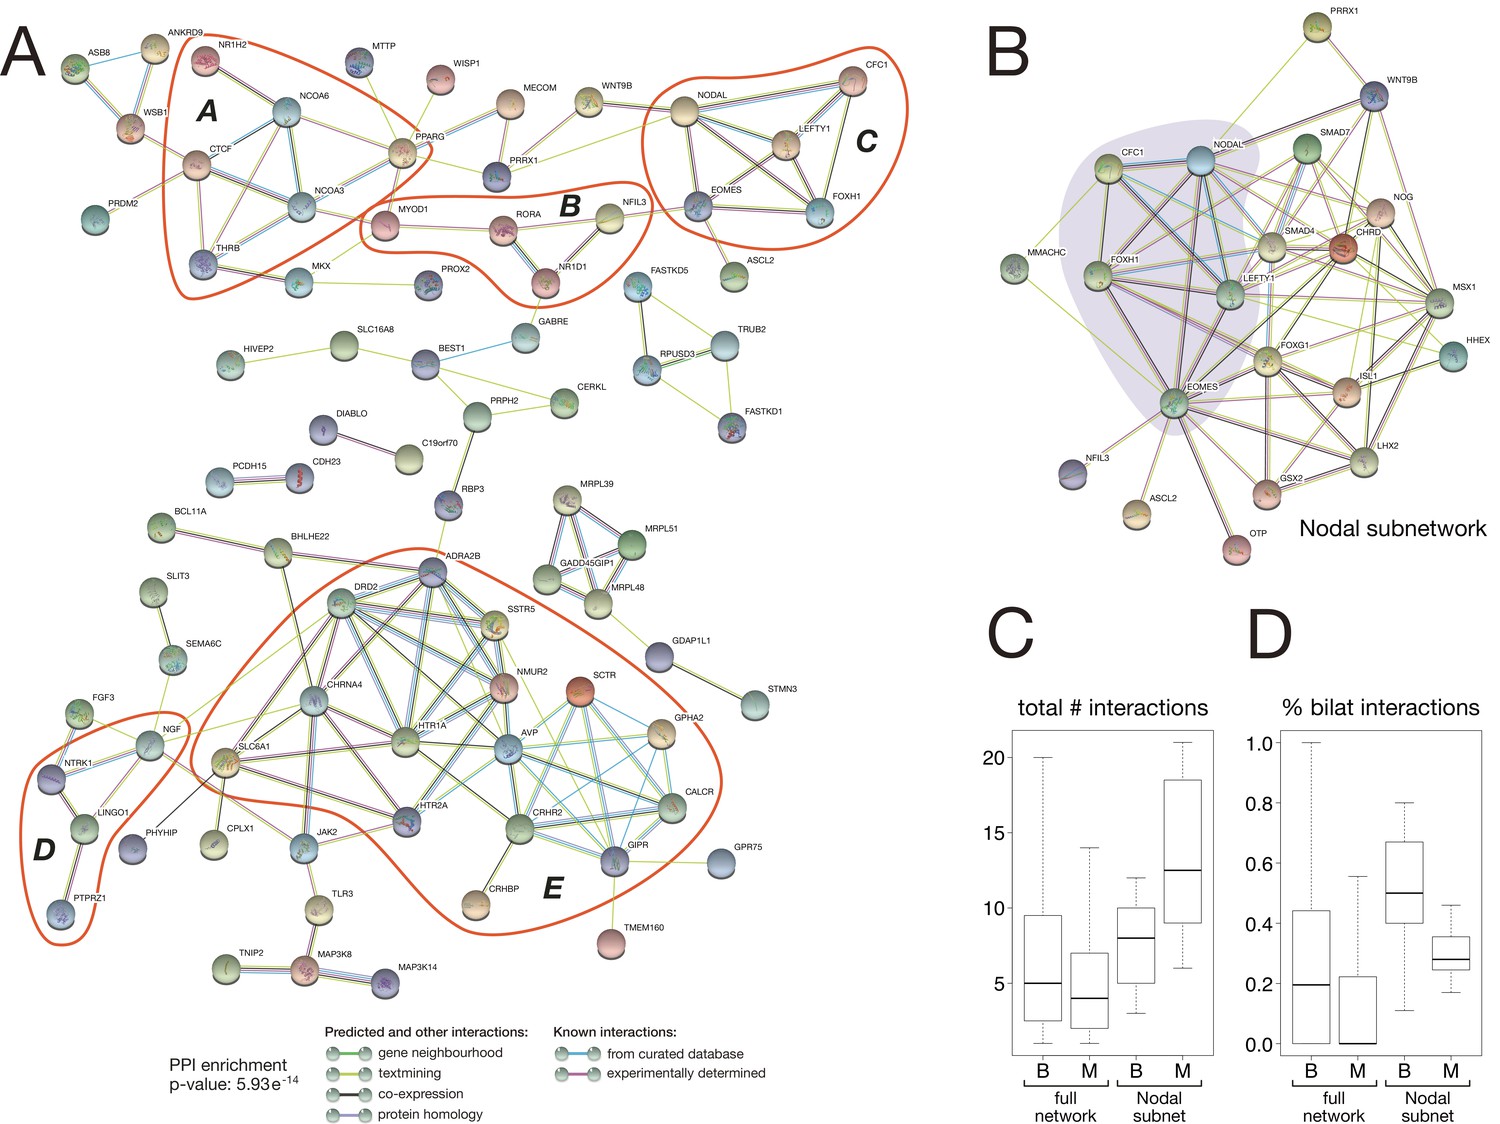
Protein-protein interaction network of bilaterian-specific proteins.
(A) Uniprot identifiers corresponding to the human orthologues of 150 bilaterian-specific genes (seven OGs had no human orthologues) were uploaded to the STRING database, and their mutual interactions were visualised as a network. Parameters for the displayed PPI network were: minimum required interaction score = 0.4; maximum number of interactors to display in 1st and 2nd shell = 0. Thus, only known and predicted interactions between 83 distinct bilaterian-specific proteins are shown (non-interacting proteins are hidden). Evidence for displayed interactions is colour-coded (see legend). Edge length and node placement are arbitrary. Five subnetworks between bilaterian-specific genes are highlighted in red (A-E, see Results). (B) Bilaterian-specific Nodal subnetwork in the context of metazoan genes. The five members of the Nodal pathway are highlighted by shading. (C, D) Boxplots comparing bilaterian- (B) and metazoan-specific (M) proteins in the full network and Nodal subnetwork for the total number of interactions per protein (C), and for the relative fraction of bilaterian interactions per protein (D).
Appendix 1—figure 1
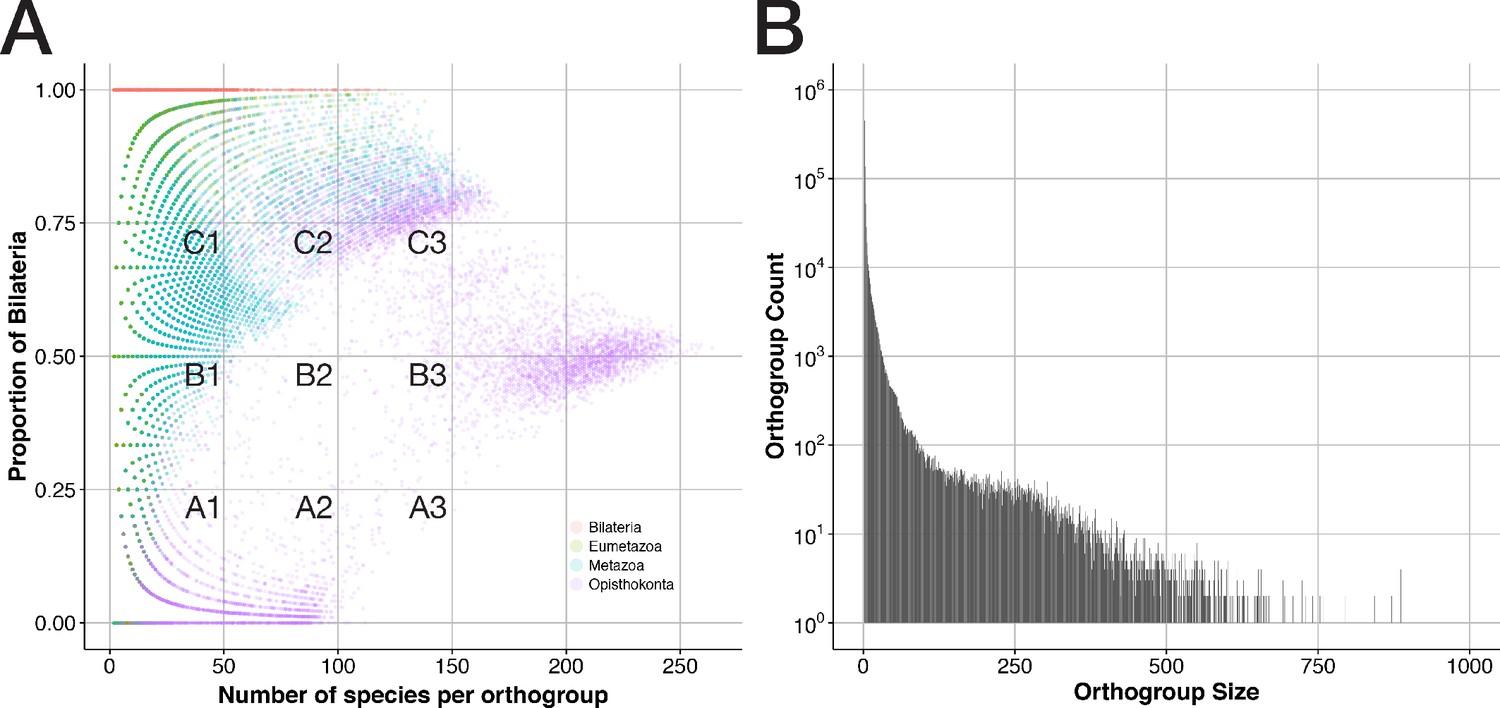
General properties of sequence clusters from a bilaterian viewpoint.
(A) The proportion of bilaterians per orthogroup is shown as a function of orthogroup size (in terms of species number) for 207,285 orthogroups that trace back to the four ancestors Bilateria, Eumetazoa, Metazoa, and Opisthokonta. Dot colours indicate the orthogroup ancestor and are printed with 85% transparency to reveal overlaps. (B) Orthogroup count (how often orthogroups of a given size are observed) is displayed as function of orthogroup size (number of sequences present in an orthogroup). 34 orthogroups with more than 1,000 sequences were omitted. Almost all of these sizes occurred only once.
Tables
Table 1
Comparison of three major orthology databases with the BigWenDB.
The number of species of a given taxon (left column) in four different orthology databases is shown. In contrast to other databases, the BigWenDB has substantially more sequence information from non-bilaterian metazoans and therefore a better resolution at the divergence of bilaterians and non-bilaterians. D = Deuterostomia, E = Ecdysozoa. Note the bias of other databases towards insects and vertebrates, which continues in the latest database versions (e.g., OrthoDB v10.2; Kriventseva et al., 2019).
| Taxon | OrthoDB V8 | eggNOG V4.5 | OrthoMCL V5 | BigWenDB |
|---|---|---|---|---|
| Cellular organisms | 3,027 | 2,031 | 150 | 273 |
| Metazoa | 173 | 88 | 29 | 175 |
| Bilateria | 169 | 85 | 27 | 142 |
| non-Bilateria | 4 | 3 | 2 | 33 |
| Ecdysozoa (E) | 97 | 29 | 12 | 54 |
| E w/o insects | 17 | 9 | 4 | 29 |
| Lophotrochozoa | 5 | 0 | 0 | 18 |
| Deuterostomia (D) | 66 | 55 | 14 | 65 |
| D w/o vertebrates | 5 | 4 | 1 | 12 |
Table 2
Composition of the BigWenDB.
The number of sequences (overall: 124,031,501) collected from three different sources (NCBI, Transcriptome, ORFs) is indicated for major taxonomic groups of the BigWenDB. "Others" comprises the ichthyosporean Capsaspora owczarzaki and the choanoflagellates Monosiga brevicollis and Salpingoeca rosetta.
| Group | (Super)Phylum | # Species | NCBI | Transcriptome | ORFs |
|---|---|---|---|---|---|
| Bilateria | Deuterostomia | 65 | 895,084 | 2,292,541 | 51,922,654 |
| Ecdysozoa | 54 | 511,663 | 2,150,424 | 17,338,026 | |
| Lophotrochozoa | 23 | 170,379 | 2,618,518 | 9,805,405 | |
| Non-Bilat. | Ctenophora | 7 | 0 | 1,468,372 | 2,458,546 |
| Placozoa | 1 | 11,215 | 0 | 590,820 | |
| Porifera | 6 | 8,836 | 539,299 | 1,008,535 | |
| Cnidaria | 19 | 36,873 | 2,361,032 | 26,443,358 | |
| Fungi | 93 | 1,032,299 | 0 | 0 | |
| others | 3 | 29,292 | 0 | 0 | |
| total | 273 | 2,695,641 | 11,768,516 | 109,567,344 |
Additional files
-
Supplementary file 1
Supplementary Tables 1–26 and Supplementary Figures 1 and 2.
- https://cdn.elifesciences.org/articles/45530/elife-45530-supp1-v2.pdf
-
Supplementary file 2
Download location for transcriptome data used in this study.
- https://cdn.elifesciences.org/articles/45530/elife-45530-supp2-v2.xls
-
Supplementary file 3
Comparison between Orthobench and BigWenDB clustering results.
- https://cdn.elifesciences.org/articles/45530/elife-45530-supp3-v2.tsv
-
Supplementary file 4
List of high-confidence bilaterian-specific orthogroups.
- https://cdn.elifesciences.org/articles/45530/elife-45530-supp4-v2.ods
-
Transparent reporting form
- https://cdn.elifesciences.org/articles/45530/elife-45530-transrepform-v2.docx
Download links
A two-part list of links to download the article, or parts of the article, in various formats.
Downloads (link to download the article as PDF)
Open citations (links to open the citations from this article in various online reference manager services)
Cite this article (links to download the citations from this article in formats compatible with various reference manager tools)
The genetic factors of bilaterian evolution
eLife 9:e45530.
https://doi.org/10.7554/eLife.45530


