Robo2 regulates synaptic oxytocin content by affecting actin dynamics
- Weizmann Institute of Science, Israel
Figures
Figure 1 with 1 supplement
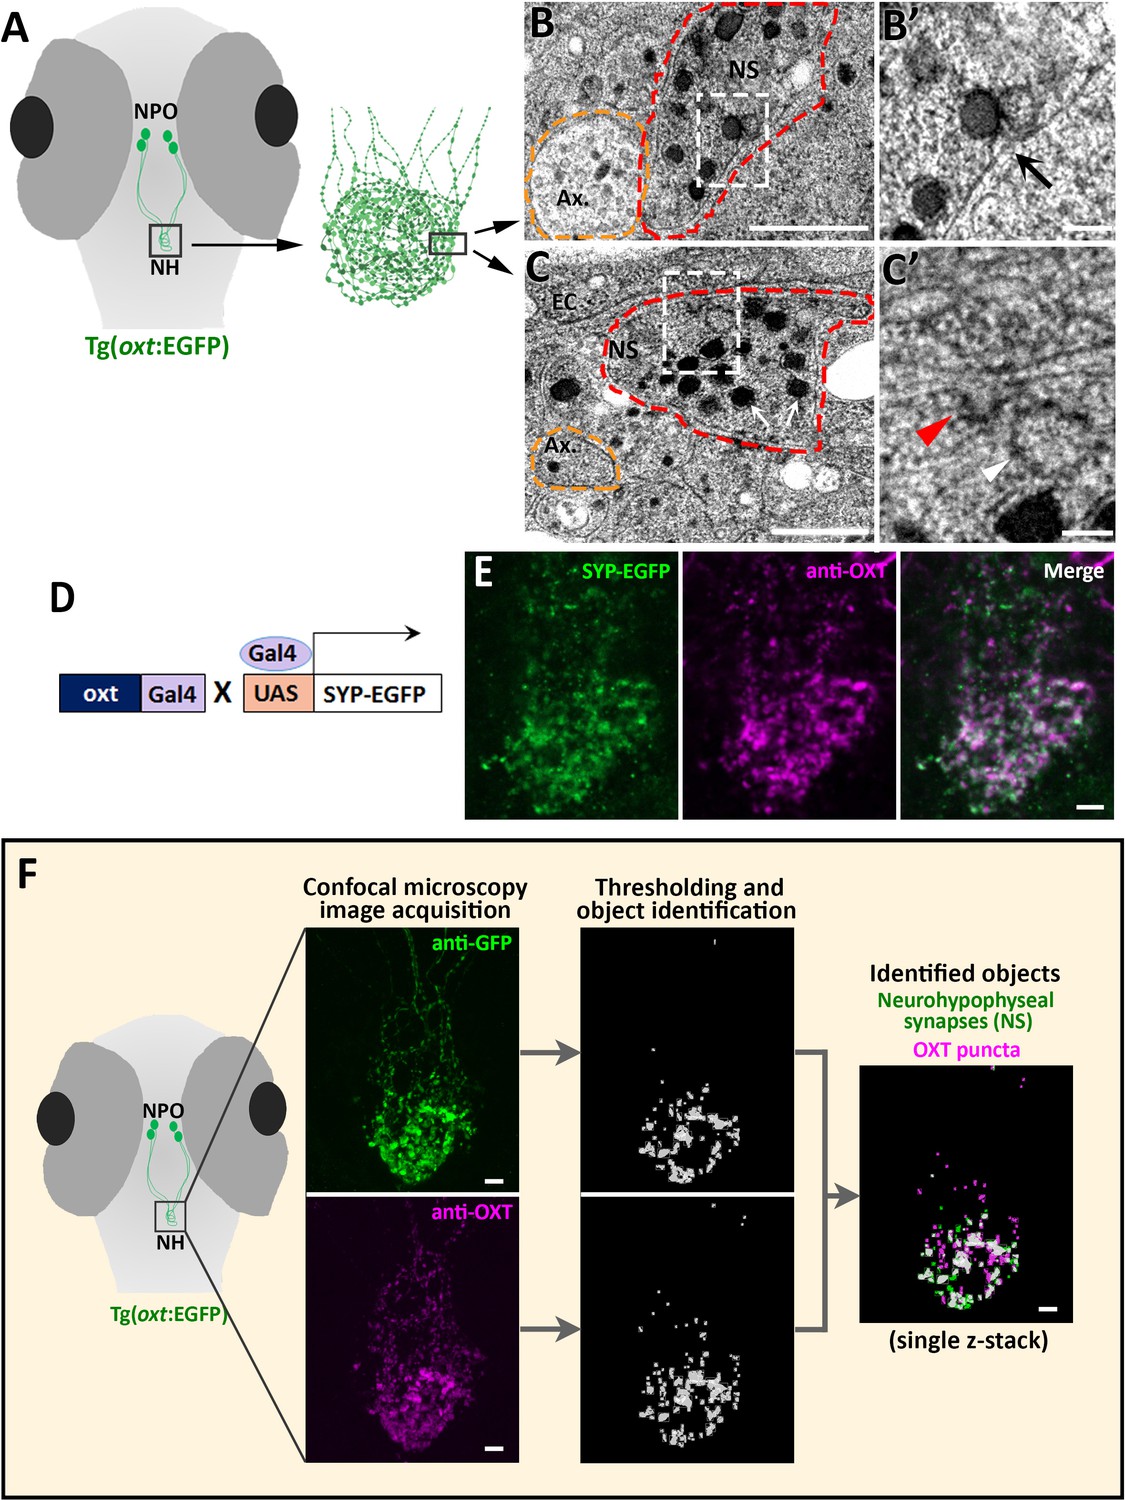
Identification and quantification of synaptic OXT content in neurohypophyseal axonal termini.
(A–C) Scheme describing the neurohypophyseal vasculature and synapses in 5 days post-fertilization (dpf) transgenic reporter Tg(oxt:EGFP). The dense neurohypophyseal synapses (NS) were used as an anatomical landmark to localize the larval neurohypophysis prior to tissue preparation for Transmission Electron Microscopy (TEM) imaging (A). TEM image showing cross-section of axons (yellow dashed line) and neurohypophyseal synapses (red dashed line) (B,C). Large dense core vesicles with electron-dense neuropeptides are visible in NS (white arrows). Membranal fusion resembling exocytotic pit (black arrow), membranal invagination resembling endocytic pit (red arrow head) and empty vesicle resembling recycled vesicle (white arrow head) are visible in NS (B’,C’). Ax: axon, BM: basement membrane, EC: endothelial cell and NS: neurohypophyseal synapse. Scale: 500 nM (B,C) and 100 nm (B’, C’). (D,E) Oxytocin neuron-specific labeling of synapses using EGFP-fused synaptic vesicle marker synaptophysin-B (D). Whole-mount confocal microscope imaging of hypophysis of 5 days post-fertilization (dpf) transgenic Tg(oxt:Gal4;UAS:SYP-EGFP) zebrafish following immunostaining with anti-EGFP and a specific antibody against endogenous OXT protein (E). Mean weighted colocalization coefficients for OXT fluorescence with respect to GFP fluorescence = 0.87; n = 5 larvae (See Materials and methods for detailed description). Scale: 5 μM. (F) Scheme describing the pipeline for detection of neurohypophyseal synapses. Whole-mount confocal microscope imaging of hypophysis of 5 days post-fertilization (dpf) transgenic reporter Tg(oxt:EGFP) zebrafish following immunostaining with anti-EGFP and a specific antibody against endogenous OXT protein. Analysis of GFP-positive neurohypophyseal synapses (NS) and OXT puncta were performed by using the ‘object identifier’ function in Volocity software on individual channels. Scale: 5 μM.
-
Figure 1—source data 1
Experimental data for Figure 1: colocalization analysis of synaptic OXT and EGFP fluorescence.
The excel sheet includes values for weighted colocalization coefficients calculated from confocal images of immunostained transgenic (oxt:gal4; UAS:Syp-EGFP) larval neurohypophysis.
- https://cdn.elifesciences.org/articles/45650/elife-45650-fig1-data1-v3.xlsx
Figure 1—video 1
Confocal Z-stack images and three-dimensional render of 5 days post-fertilization (dpf) transgenic reporter zebrafish Tg(oxt:EGFP) following immunostaining with anti-EGFP and a specific antibody against endogenous OXT protein.
Figure 2
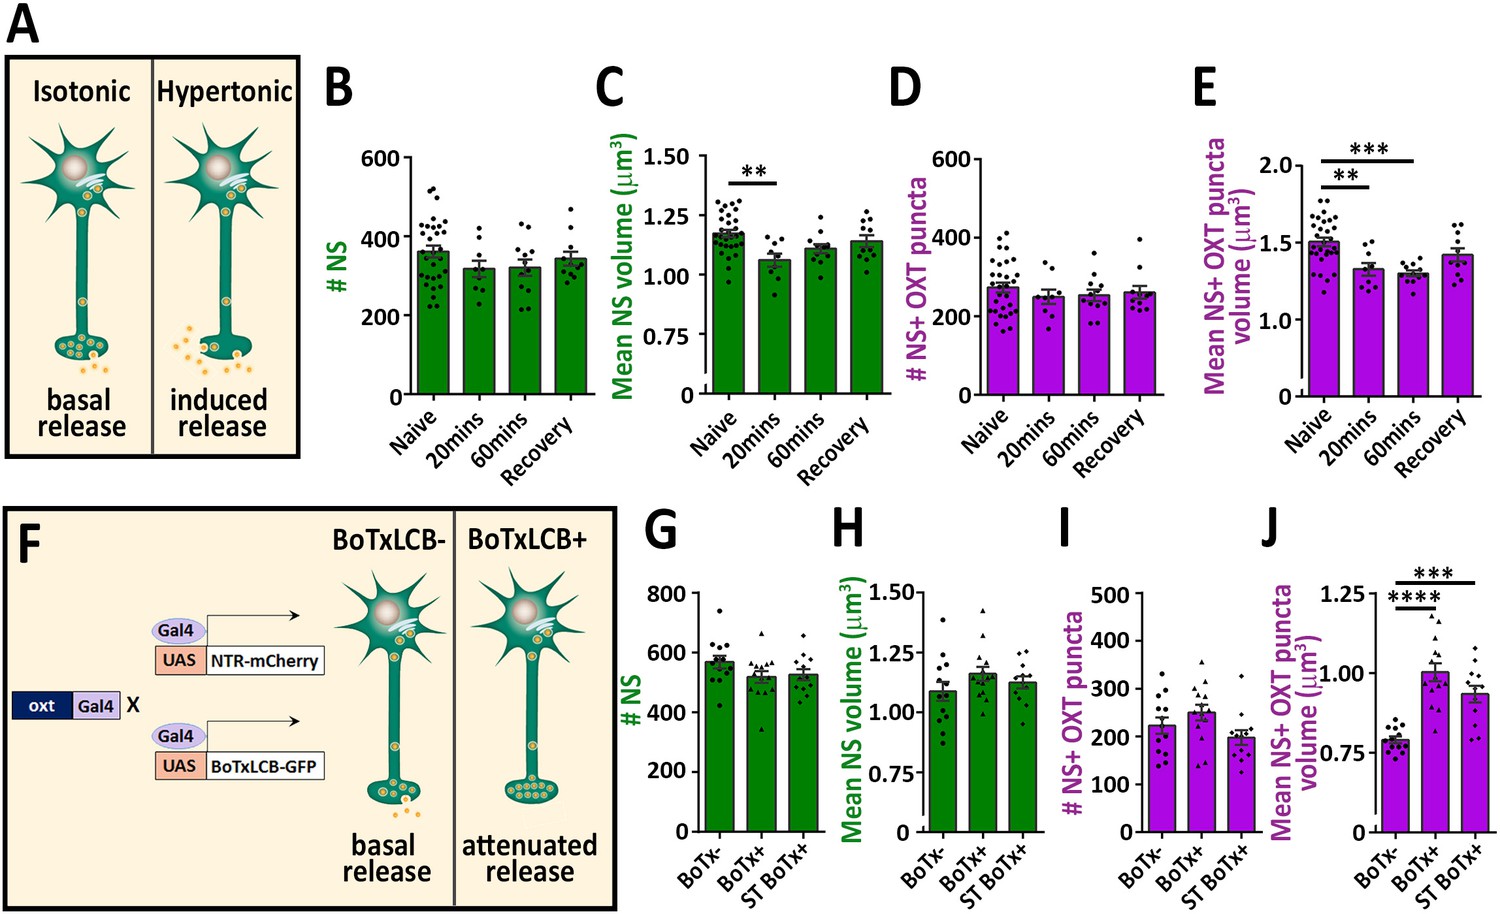
Osmotic challenge decreases synaptic OXT neuropeptide content.
(A) Transgenic Tg(oxt:EGFP) larvae at eight dpf were treated with hypertonic solution (25% artificial sea salt in Danieau buffer) for 20 or 60 min. The larvae that underwent 60 min treatment were allowed to recover in isotonic Danieau buffer for another 60 min. The mean number and volume of NS (B,C) and OXT puncta overlapping with GFP +NS (D,E) were quantified (**p<0.01 and ***p<0.001; one-way ANOVA). (F–J) Cell-specific blockage of synaptic release using botulinum toxin light chain B increases hypophyseal OXT levels (F). The mean number and volume of mCherry +NS (G,H) and oxytocin puncta overlapping with mcherry +NS (I,J) were quantified in 8-dpf old larvae of Tg(oxt:Gal4; UAS:NTR-mCherry) labeled as BoTx- (n = 13 larvae) versus Tg(oxt:Gal4; UAS:BoTxLCB-GFP; UAS:NTR-mCherry) at isotonic Danieau buffer (BoTx+ (n = 14 larvae)) or upon 60 min treatment with hypertonic solution (ST BoTx+; n = 12 larvae). (***p<0.001, ****p<0.0001; one-way ANOVA). Error bars indicate SEM in (B-E and G-J).
-
Figure 2—source data 1
Experimental data for Figure 2: Neurohypophyseal synaptic parameters upon hyperosmotic challenge.
The excel sheet includes values for number and volume of neurohypophyseal synapses and OXT puncta upon hyperosmotic challenge.
- https://cdn.elifesciences.org/articles/45650/elife-45650-fig2-data1-v3.xlsx
Figure 3 with 1 supplement
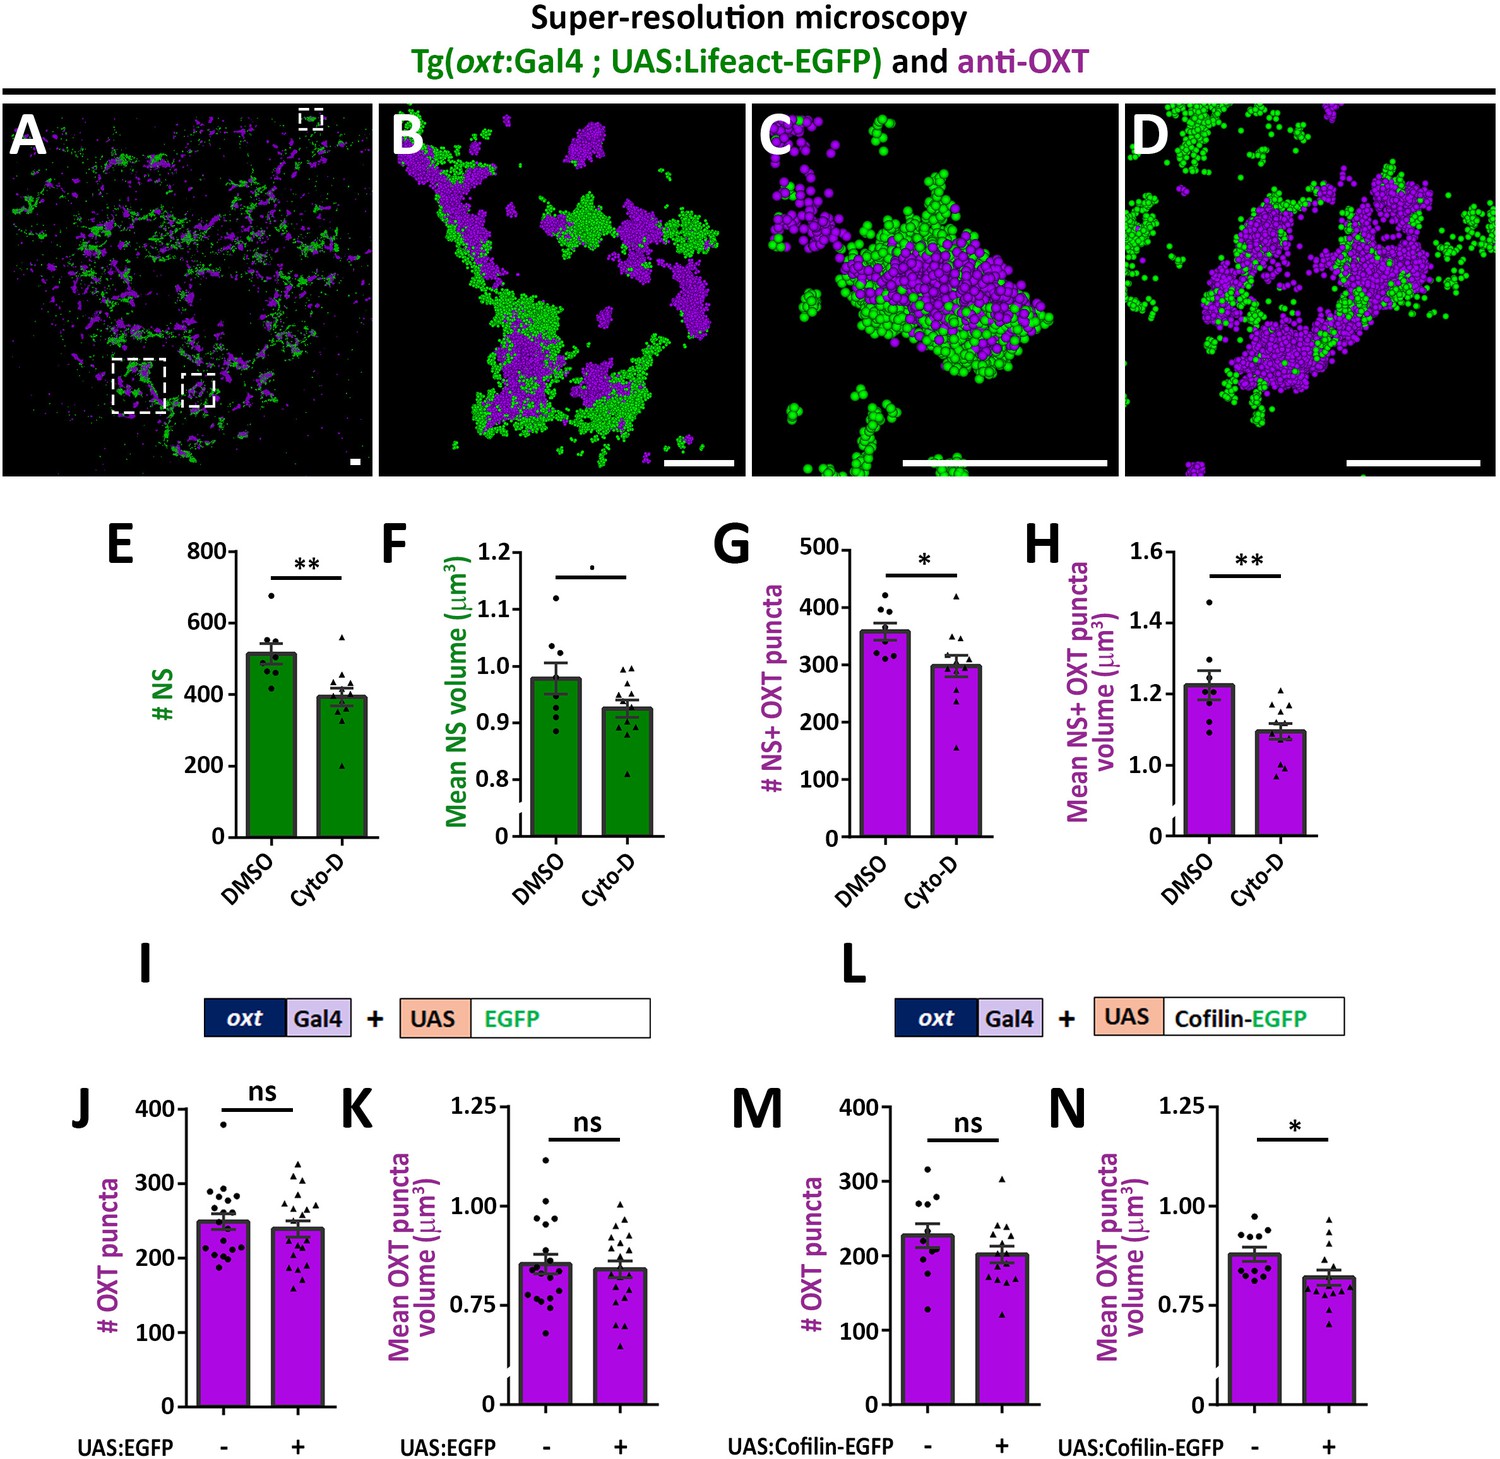
Actin polymerization regulates synaptic OXT content.
(A–D) Spatial relationship between actin and neuropeptide in hypophysis revealed by super-resolution microscopy. Stochastic optical reconstruction microscopy (STORM) images of the neurohypophyseal area of 6 days post-fertilization (dpf) Tg(oxt:gal4; UAS:lifeact-EGFP) larvae stained using anti-OXT and anti-GFP antibodies (A). (B–D:) Magnifications of squared areas. Scale bars: 1 µm. (E–H) Assessment of the effect of cytochalasin D treatment on synaptic properties in Tg(oxt:EGFP) larvae. Larvae were treated with DMSO or cytochalasin D at 400 nM between 4 and 5 dpf, stained using anti-GFP and anti-OXT antibodies and quantified following imaging as in Figure 1. The number and mean volume of neurohypophyseal synapses (NS) (E,F) and the number and mean volume of NS-associated OXT puncta (G,H) was quantified. p<0.01, Student’s t-test, Cohen’s d = 1.54 (E); p<0.1, Student's t-test, Cohen's d = 0.85 (F); p<0.05, Student's t-test, Cohen's d = 1.17 (G); p<0.01, Student's t-test, Cohen's d = 1.43 (H), n = 8, 12 for DMSO and cytochalasin D treatment, respectively. (I–N) Assessment of the effect of oxytocin-neuron specific perturbation of actin. Transgenic embryos expressing the oxytocin Gal4 driver (oxt:Gal4) were injected with transposon-based transgenic vectors containing either control UAS:EGFP (I) or UAS:Cofilin-EGFP (L) expression cassettes. All the injected larvae were sorted for fluorescent heart selection marker and were subjected to immunostaining with anti-EGFP and anti-OXT antibody. 5-dpf larvae with and without expression of EGFP-labeled neurohypophyseal synapses were imaged using confocal microscopy as in Figure 1F. The number (J,M) and volume of OXT puncta (K,N) were quantified. (J-M: ns, non-significant; N: p<0.05; Student’s t-test with Cohen’s d = 0.92). Error bars indicate SEM in (E-H, J,K,M and N).
-
Figure 3—source data 1
Experimental data for Figure 3: Neurohypophyseal synaptic parameters upon actin perturbation.
The excel sheet includes values for number and volume of neurohypophyseal synapses and OXT puncta from confocal imaging of larvae that were subjected to DMSO vs cytochalasin treatment or embryos that underwent transgenesis experiment for OXT-neuron specific EGFP vs cofilin expression.
- https://cdn.elifesciences.org/articles/45650/elife-45650-fig3-data1-v3.xlsx
Figure 3—video 1
Three-dimensional render showing STORM images of endogenous OXT and Lifeact-EGFP in neurohypophyseal synapses.
Figure 4
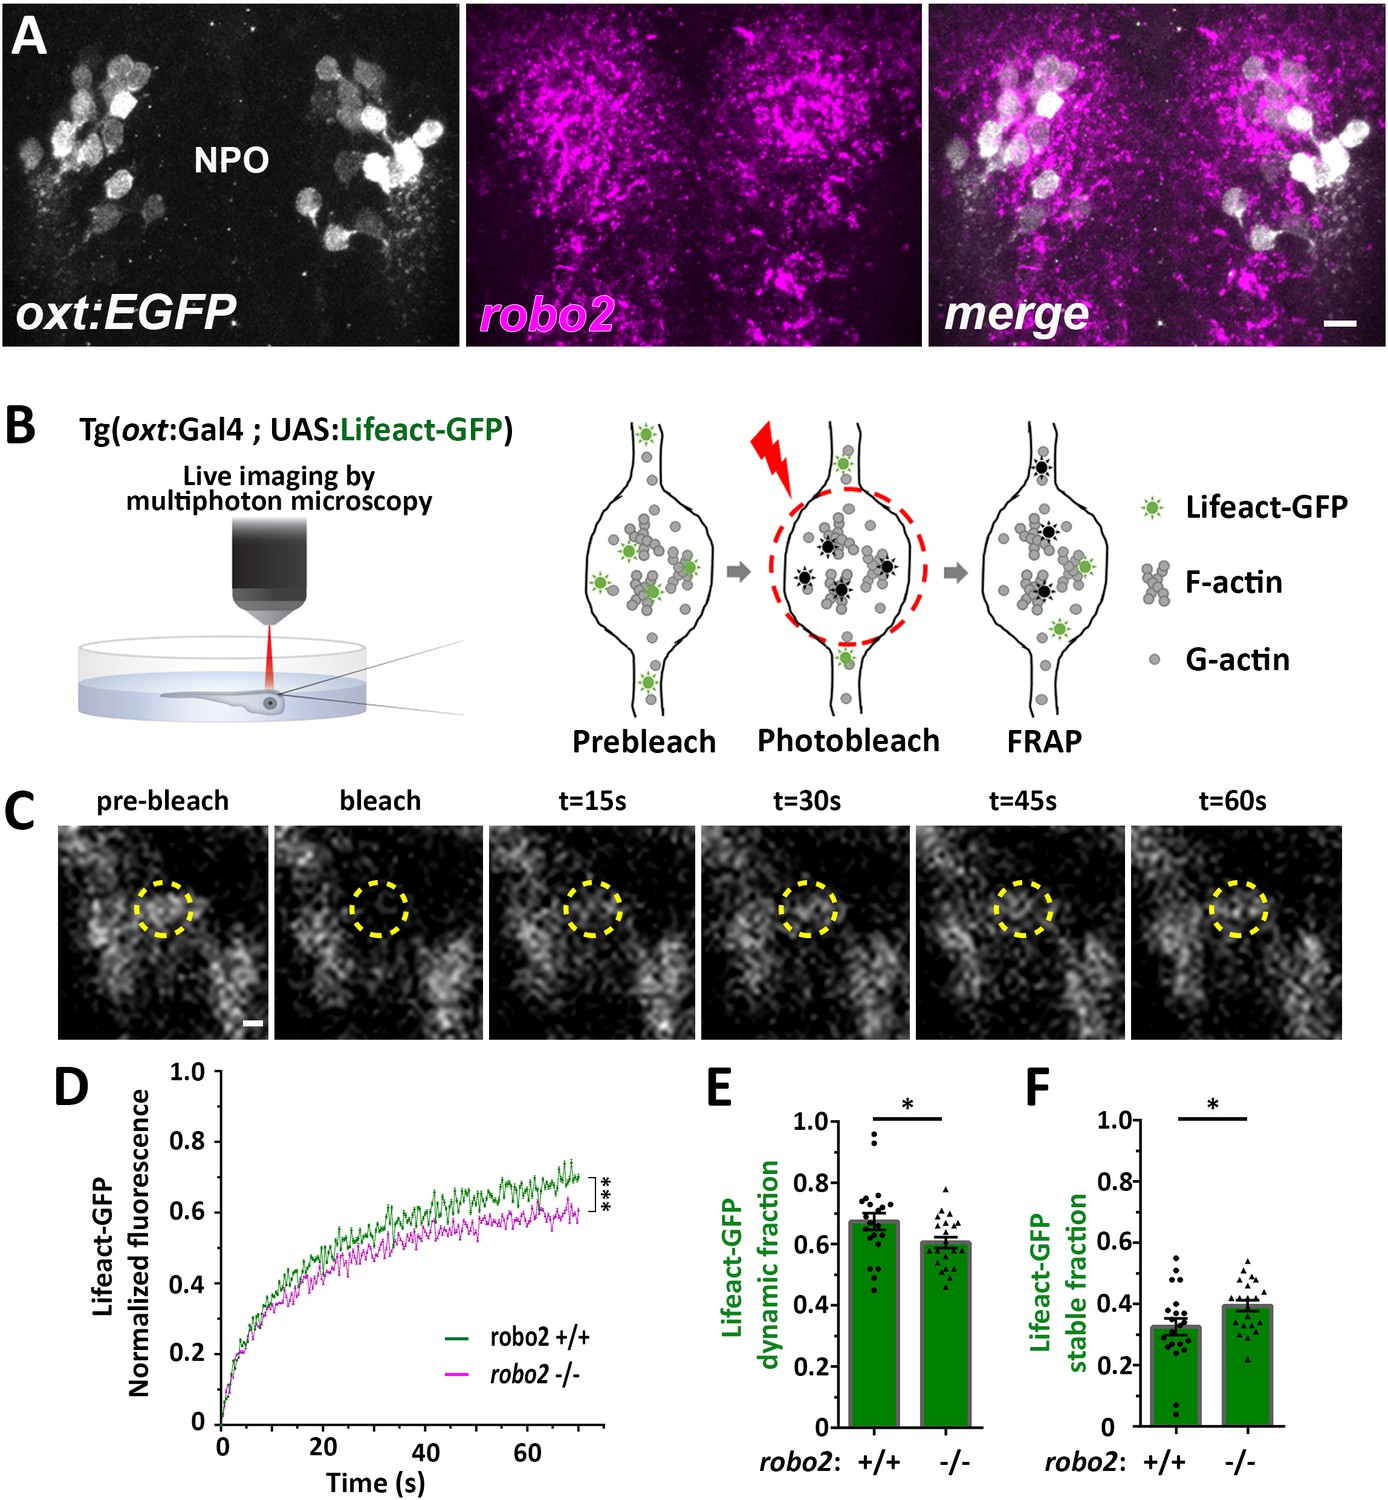
Robo2 regulates synaptic actin dynamics.
(A) robo2 is expressed in larval zebrafish neurosecretory preoptic area (NPO) and colocalizes with Oxytocin neurons. Confocal Z-stack images showing fluorescent in situ hybridization (FISH) of transgenic larvae Tg(oxt:EGFP) (3 days post-fertilization (dpf)) using probes directed against robo2 mRNAs (magenta), followed by anti-EGFP staining. The neurosecretory preoptic (NPO) area in which OXT neurons were labeled is shown. Scale bar: 20 µm. (B,C) Real-time monitoring of synaptic actin dynamics in live transgenic reporter Tg(oxt:Gal4; UAS:Lifeact-EGFP) larvae mounted in 0.1% low-melt agarose and imaged using multi-photon microscopy upon Fluorescence Recovery after Photobleaching (FRAP) (B). Time-series images of FRAP experiment in a neurohypophyseal synapse with Lifeact-EGFP expression (C). Scale bar: 200 nm. (D–F) Assessment of synaptic actin dynamics in robo2 mutant using the transgenic actin dynamics reporter Tg(oxt:Gal4; UAS:Lifeact-EGFP) larvae. Graph showing the normalized FRAP profile of Lifeact-EGFP fluorescence intensity in 6-dpf robo2+/+ (n = 19 synapses from seven larvae) and robo2-/- (n = 21 synapses from seven larvae) (D) (***p<2e-16) for genotypeXtime interaction effect in a linear mixed effects model to account for inter-synapse and inter-genotype variability (see Materials and methods). Bar graphs showing the dynamic (E) and stable (F) Lifeact-EGFP fractions in robo2+/+ vs robo2-/- neurohypophyseal synapses (*p<0.05 Student’s t-test; with Cohen’s d = 0.67). Error bars indicate SEM in (D–F).
-
Figure 4—source data 1
Experimental data for Figure 4: Actin dynamics in neurohypophyseal synapses.
The excel sheet includes values for FRAP data of neurohypophyseal synaptic Lifeact-EGFP in robo2 +/+ vs robo2 -/- larvae. The full-scale normalized values, dynamic and stable fraction generated from Easy-Frap software are shown.
- https://cdn.elifesciences.org/articles/45650/elife-45650-fig4-data1-v3.xlsx
Figure 5
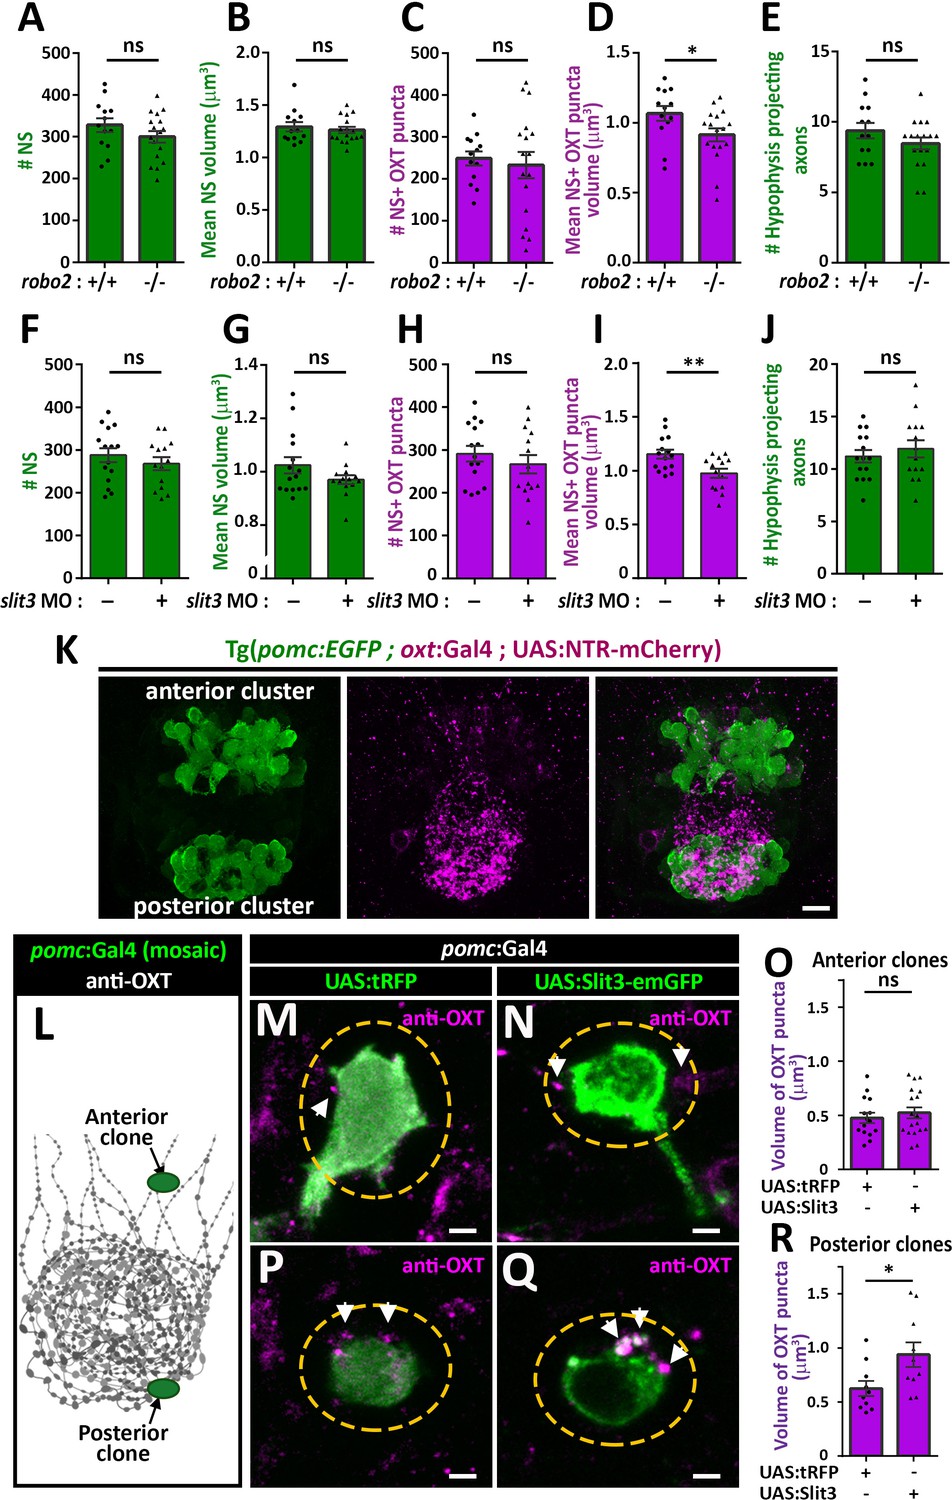
Slit3-Robo2 signaling regulates synaptic OXT levels.
(A–E) Assessment of synaptic oxytocin content in robo2 mutant was performed as described in Figure 1F. Graph showing the number and size of neurohypophyseal synapses (NS) (A,B) and colocalizing OXT puncta (C,D) and the number of neurohypophyseal projecting axons (E) in 8 days post-fertilization (dpf) robo2+/+ (n = 13) vs robo2-/- (n = 17) larvae (*p<0.05 Student’s t-test with Cohen's d = 0.82; ns denotes not significant). (F–J) Assessment of synaptic oxytocin content upon slit3 knock-down. Transgenic (oxt:EGFP) embryos were injected with injection buffer or injection buffer with 0.85 ng of morpholino targeted to the translational start site of slit3. Graph showing the number and size of NS (F,G) and colocalizing OXT puncta (H,I) and the number of neurohypophyseal projecting axons (J) in 8 days post-fertilization (dpf) control (n = 15) vs slit3 morpholino injected (n = 14) larvae (**p<0.05 with Cohen’s d = 1.23; ns denotes not significant, Student’s t-test). (K) Hypophyseal POMC cells are localized near OXT synapses. Confocal Z-stacks maximum intensity projection of hypophysis region of 5 day old triple transgenic (pomc:EGFP; oxt:Gal4; UAS:NTR-mCherry). The hypophysis area showing OXT NS adjacent to anterior and posterior clusters of POMC cells are shown. Scale: 10 μM. (L–R) Local overexpression in mosaic hypophyseal POMC clones located. Transgenic embryos expressing the pomc:Gal4 driver were injected with transposon-based transgenic vectors containing either control UAS:tRFP (M,P) or UAS: Slit3-EmGFP (N,Q). The injected 5-dpf larvae were subjected to immunostaining with anti-OXT protein and anti-GFP. OXT-puncta (arrows) within a distance of 2 μM (yellow dashed ellipse) from the clone surface were quantified. Scale bar: 2 µm. Bar graphs showing the mean volume of OXT puncta upon expression of tRFP vs Slit3 in hypophyseal POMC anterior (n = 15 and 18, respectively) or posterior clone (n = 10 and 10, respectively) position (*p<0.05 Student’s t-test with Cohen’s d = 1.14). Error bars indicate SEM in (A-J, O and R).
-
Figure 5—source data 1
Experimental data for Figure 5: Neurohypophyseal synaptic parameters upon gain- or loss-of function of slit3 or robo2.
The excel sheet includes values for number and volume of neurohypophyseal synapses and OXT puncta from confocal imaging of larval neurohypophysis of multiple experiments namely: 1) robo2 +/+ vs robo2 -/- 2) Mock vs morpholino-injected embryos 3) Mosaic transgenesis experiments by hypophyseal expression of tRFP vs slit3.
- https://cdn.elifesciences.org/articles/45650/elife-45650-fig5-data1-v3.xlsx
Figure 6 with 2 supplements
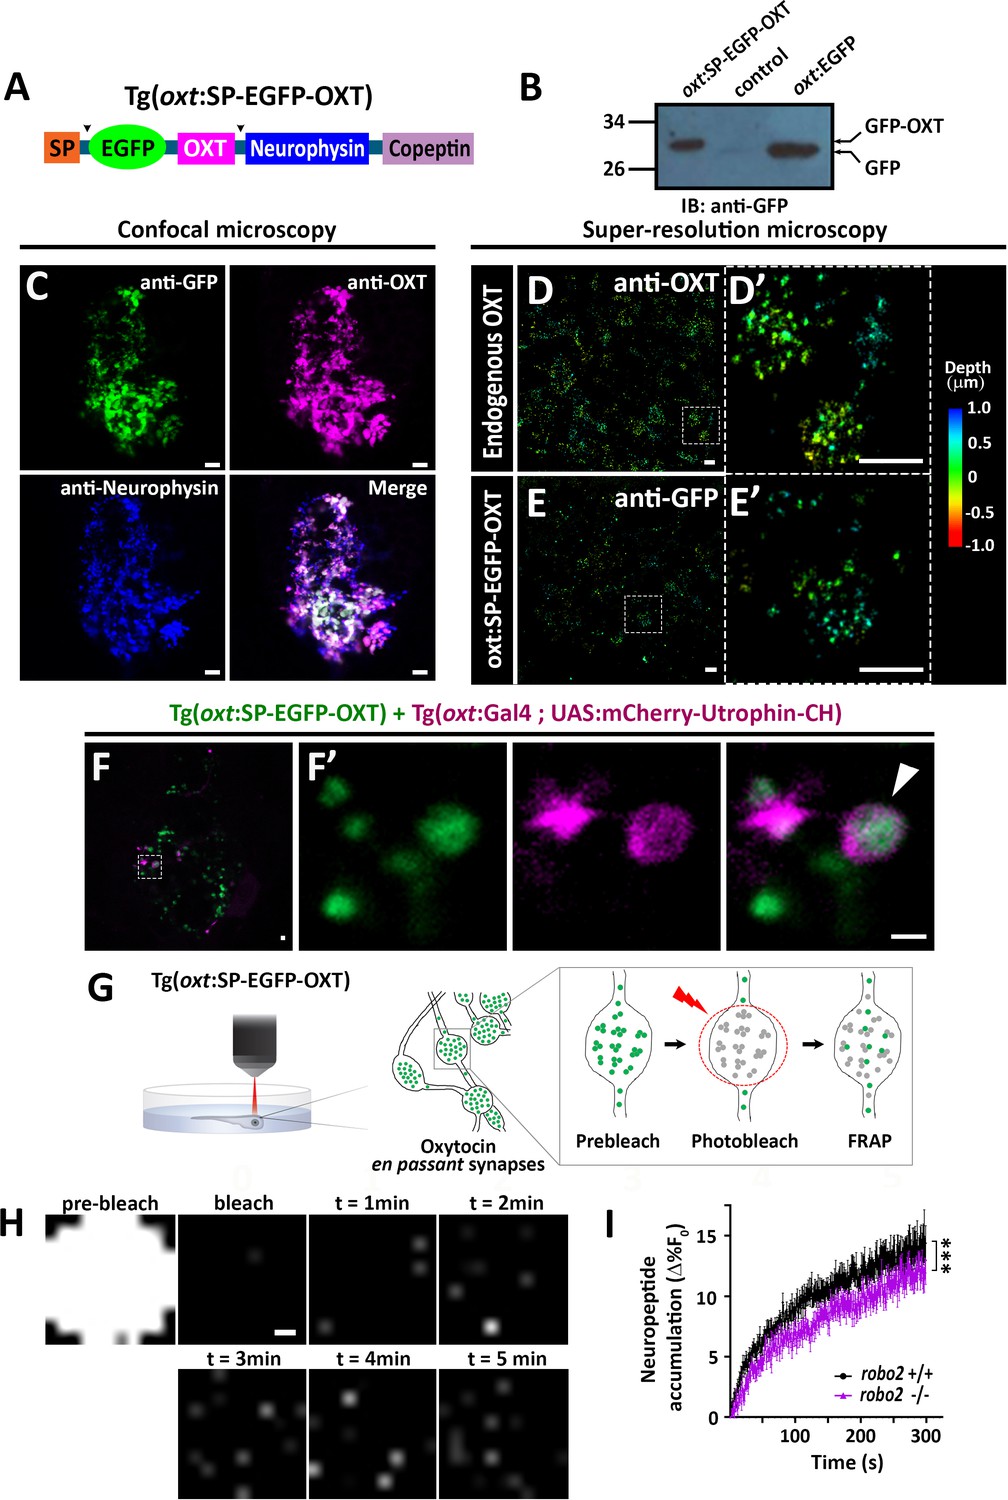
Robo2 regulates synaptic OXT dynamics.
(A) Schematic of novel transgenic OXT tool Tg(oxt:OXT-SP-EGFP-OXT), in which oxt promoter drives expression of Oxytocin precursor protein with an internally-tagged EGFP at the C-terminus of the signal peptide. (B) Validation of OXT-fusion EGFP protein expression by Western blot analysis. Pituitary protein extracts from adult Tg(oxt:OXT-SP-EGFP-OXT), TL (control) and Tg(oxt:EGFP) zebrafish were immunoblotted using anti-GFP. (C) Validation of OXT-fusion EGFP protein expression by immunohistochemistry. Confocal Z-stack images of the neurohypophyseal area of 5-dpf transgenic Tg(oxt:OXT-SP-EGFP-OXT) larvae. Larvae were stained using anti-GFP, anti-OXT and anti-neurophysin antibodies. Scale bar: 5 µm. (D–E) Assessment of endogenous vs OXT-fusion EGFP protein localization and packaging by super-resolution microscopy. STORM Z-stack images of the endogenous synaptic OXT (D) in comparison to OXT-EGFP fusion in transgenic Tg(oxt:OXT-SP-EGFP-OXT) larvae (E). five dpf larvae were stained with either anti-OXT (D) or anti-GFP (E) antibodies and visualized by STORM as described in the Method section. The right panels D’ and E’ show magnifications of the represented areas outlined in D) and E) Scale bars: 1 µm. Color code indicates Z-axis depth. (F) Spatial relationship between F-actin and OXT-fusion EGFP neuropeptide in hypophysis. Tg(oxt:OXT-SP-EGFP-OXT) embryos expressing the OXT-fusion were injected with transposon-based transgenic vectors Tg(oxt:Gal4) and Tg(UAS:mCherry-Utrophin-CH) expression cassettes. Confocal Z-stack images of the neurohypophyseal area of 5-dpf transgenic larvae (F). Maginification showing the EGFP-positive synapses and Utrophin-labeled mCherry-positive F-actin in the synapse (F’). Scale bars: 1 µm. (G,H) Real-time monitoring of synaptic oxytocin vesicle dynamics in live transgenic reporter Tg(oxt:OXT-SP-EGFP-OXT) larvae. Schemata of the experimental design (G): six dpf larvae were mounted dorsally in low-melt agarose gel, submerged in E3 embryo buffer and imaged using multi-photon microscopy. Neurohypophyseal synapses containing OXT-EGFP vesicles were photobleached and the fluorescence recovery after photo bleaching (FRAP) over time was monitored. The fluorescent recovery occurs due to the dynamic exchange of mobile and unbleached OXT-EGFP vesicles from neighboring en passant synapses over time (t = 1–5 min). The brightness and contrast of the images were increased to visualize the individual pixels (H). Scale bar: 200 nm. (I) Graph showing neuropeptide accumulation (normalized FRAP curves) of OXT-EGFP in neurohypophyseal synapses in 6-dpf robo2+/+ (n = 9 larvae) vs robo2-/- (n = 6 larvae) (***p<2.76e-05) for genotypeXtime interaction effect in a linear mixed effects model to account for inter-synapse and inter-genotype variability (see Materials and methods). Neuropeptide accumulation represents full scale normalized data to account for differences in synaptic OXT-EGFP fluorescence, that is fluorescent values upon photobleaching were normalized to zero. Error bars indicate SEM.
-
Figure 6—source data 1
Experimental data for Figure 6: OXT-EGFP dynamics in neurohypophyseal synapses.
The excel sheet includes values for FRAP data of neurohypophyseal synaptic OXT-EGFP in robo2 +/+ vs robo2 -/- larvae. The full-scale normalized values generated from Easy-Frap software are shown.
- https://cdn.elifesciences.org/articles/45650/elife-45650-fig6-data1-v3.xlsx
Figure 6—figure supplement 1
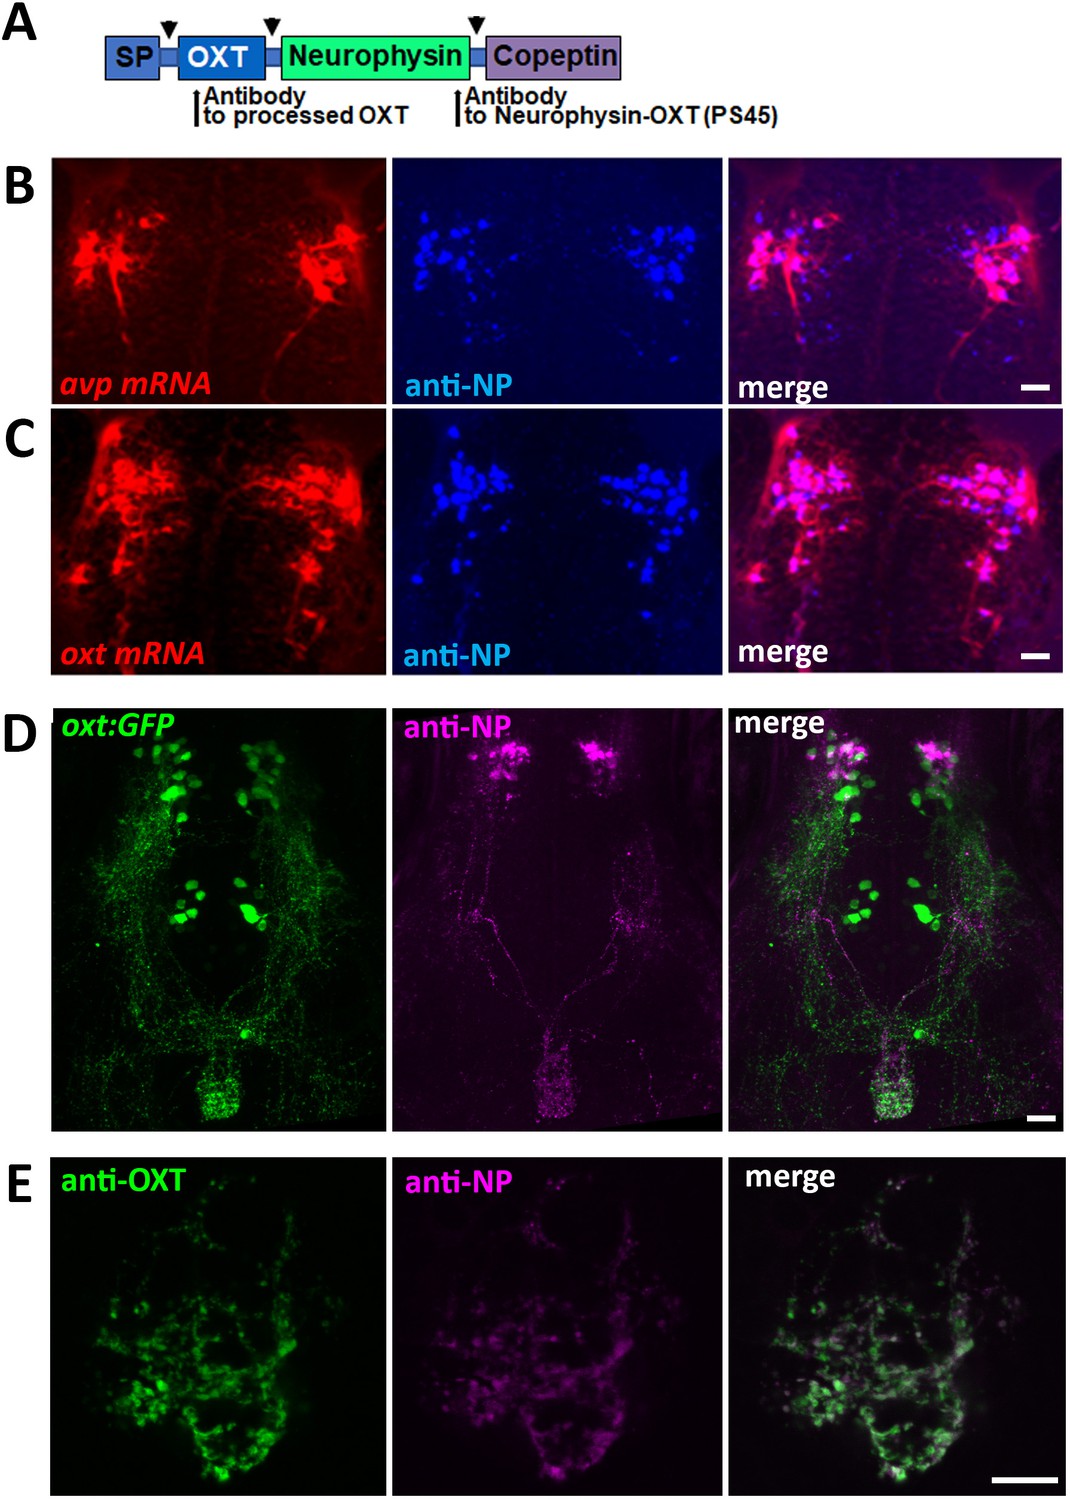
Specificity of antibodies to oxytocin and neurophysin.
(A) Schema of protein coded by oxt gene. Antibodies anti-OXT and PS45 were targeted to processed OXT and neurophysin respectively. SP denotes signal peptide, arrow indicates cleavage site. Validation of the EGFP-OXT fusion protein is shown in Figure 3H. (B–F) Confocal Z-stack images showing Fluorescent in situ hybdridization (FISH) of 3 days post-fertilization (dpf) larvae using probes for avp (B) or oxt (C) mRNA (red), followed by PS45 staining. The neurosecretory preoptic (NPO) area in which oxytocin neurons were labeled is shown. Confocal maximum intensity projection (MIP) images showing immunostaining of 5-dpf old transgenic Tg(oxt:EGFP) larvae using antibodies directed against GFP and neurophysin (NP). The whole neurohypophyseal tract (D) and the hypophyseal projections (E) are shown. Scale: 10 μM.
Figure 6—video 1
Three-dimensional render showing STORM images of endogenous OXT in neurohypophyseal synapses of 5 days post-fertilization (dpf) old zebrafish larvae.
Figure 7 with 1 supplement
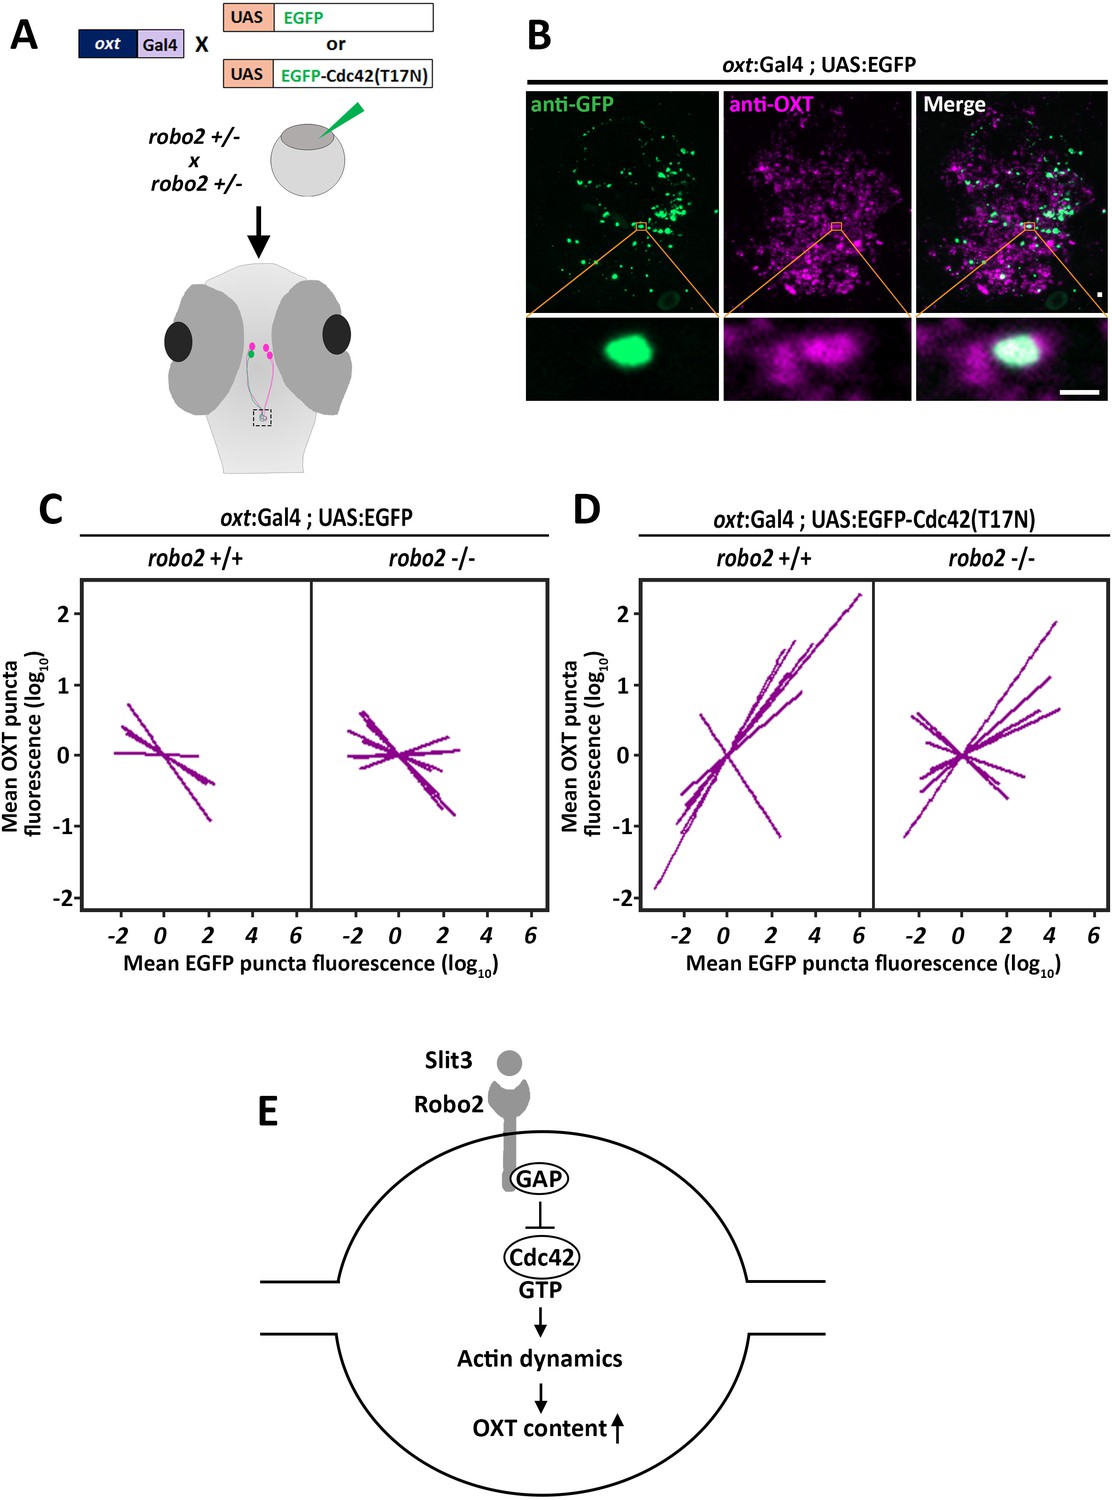
Robo2 regulates synaptic OXT levels via Cdc42.
(A,B) Assessment of the effect of Oxytocin neuron-specific overexpression of actin-regulating protein Cdc42 in Tg(oxt:Gal4) larvae. Transgenic embryos expressing the oxt:Gal4 driver were injected with transposon-based transgenic vectors containing either control UAS:EGFP or UAS:Cdc42(T17N)-EGFP. Larvae were fixed at 8 days post-fertilization (dpf) and immunostained with anti-GFP and anti-OXT antibodies and neurohypophyseal synapse (NS) were identified as described earlier. Maximum intensity projection (MIP) reveals mosaic labeling of hypophyseal projecting axons (B). Bottom panel show magnifications of squared areas showing single stack with colocalization of axonal swelling with OXT puncta. Scale bar 1 µm. (C,D) Linear regression analysis comparing between synaptic EGFP levels (mean EGFP puncta) as a function of OXT fluorescence (mean OXT puncta). The data were normalized using mean-centering approach using the scale function in the ‘R’ software. Each line represents a regression line of single animal. The correlation between the mean (log10) fluorescence value of OXT puncta and GFP expression in neurohypophyseal synapse was tested with a linear regression model (ANCOVA), accounting for the effect of GFP fluorescence, and individual fish. Mean EGFP fluorescence is inversely correlated with OXT fluorescence in robo2+/+ (n = 5; p<0.01, adj. R2 = 0.93) and in robo2-/- (n = 8; and p<0.01, adj. R2 = 0.85) (C). Mean EGFP-Cdc42(T17N) fluorescence positively correlates with OXT fluorescence in robo2+/+ (n = 7; p<0.01, adj. R2 = 0.74) larvae but not in in robo2-/- (n = 7; p=0.35, Adj. R2 = 0.52) (D). (E) Model of the role of Robo2 in neurohypophyseal synapses: Synaptic Slit3-Robo signaling inactivates Cdc42 via GAP by affecting the transition of the Rho-GTPase protein Cdc42 from GTP- to GDP- bound state. Cdc42 inactivation reduces actin polymerization and increases synaptic OXT content.
-
Figure 7—source data 1
Experimental data for Figure 7: Synaptic fluorescence values upon OXT-neuron specific Cdc42 over-expression.
The excel sheet includes values for EGFP- and OXT- fluorescence values of neurohypophyseal synapses in larvae that were subjected to OXT-neuron specific EGFP or Cdc42(T17N) or Cdc42(G12V) expression in robo2 +/+ vs robo2 -/-.
- https://cdn.elifesciences.org/articles/45650/elife-45650-fig7-data1-v3.xlsx
Figure 7—figure supplement 1
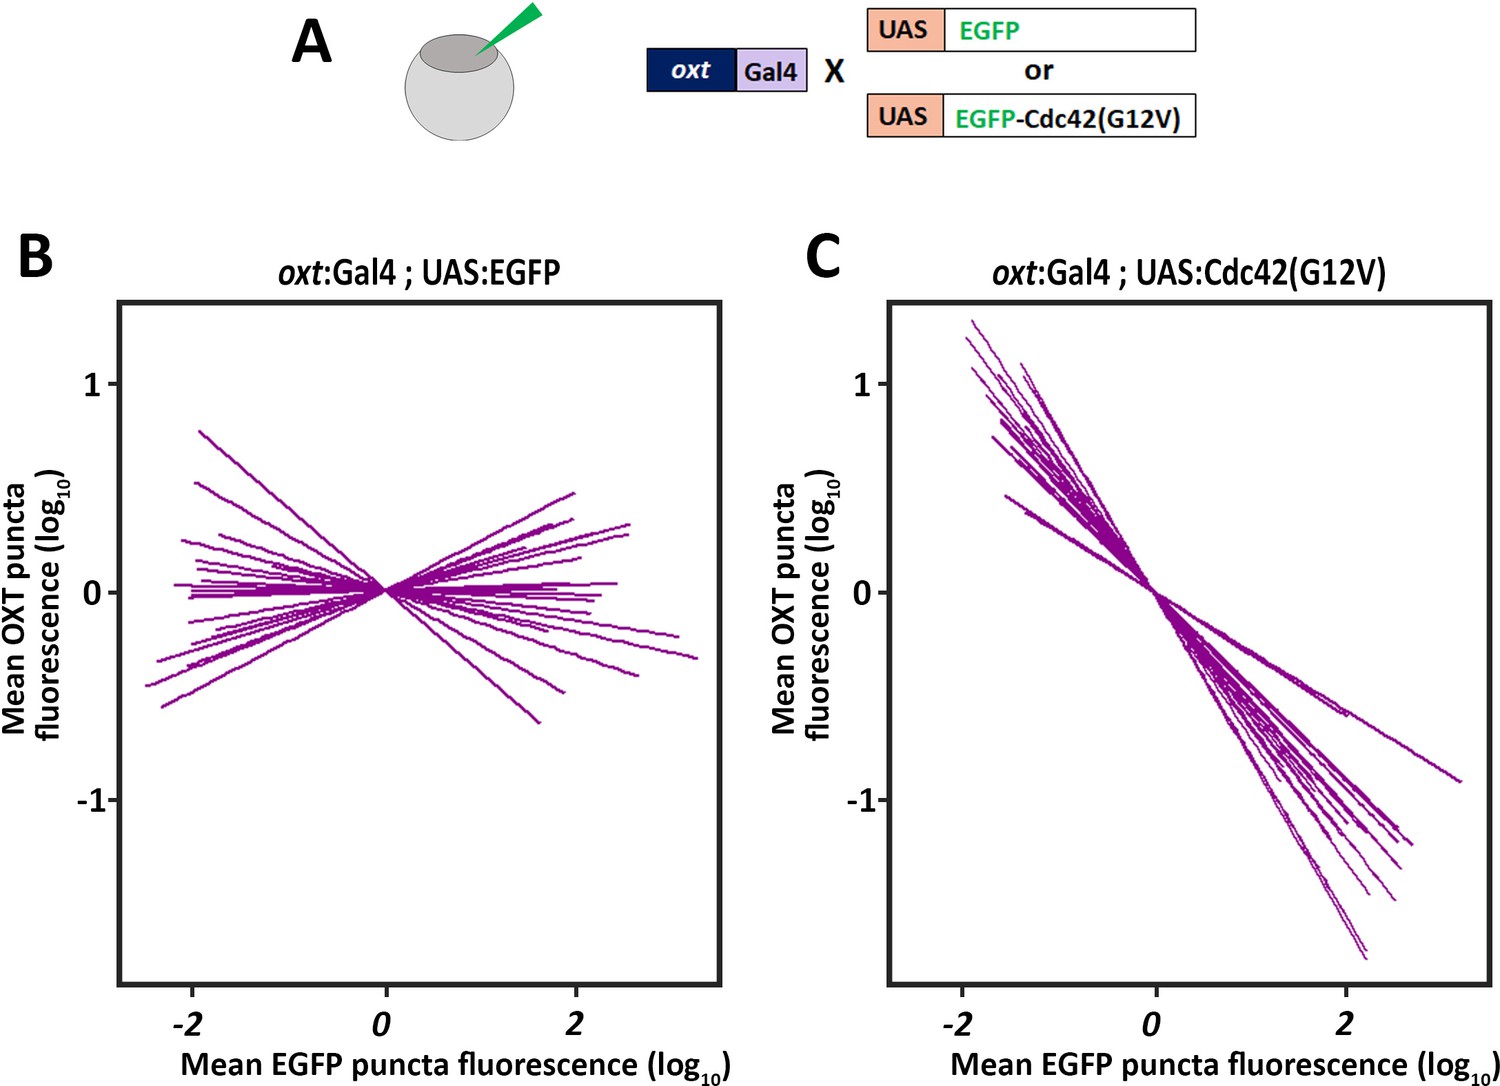
Cdc42 regulates synaptic OXT levels.
(A) Assessment of the effect of Oxytocin neuron-specific overexpression of actin-regulating protein Cdc42 in Tg(oxt:Gal4) larvae. Transgenic embryos expressing the oxt:Gal4 driver were injected with transposon-based transgenic vectors containing either control UAS:EGFP or UAS:Cdc42(G12V)-EGFP coding a constitutive active mutant Cdc42. Larvae were fixed at 8 days post-fertilization (dpf) and immunostained with anti-GFP and anti-OXT antibodies and neurohypophyseal synapse (NS) were identified as described above. (B,C) Linear regression analysis comparing between synaptic EGFP levels (mean EGFP puncta) as a function of OXT fluorescence (mean OXT puncta). The data were normalized using mean-centering approach using the scale function in the ‘R’ software. Each line represents a regression line of single animal. The correlation between the mean (log10) fluorescence value of OXT puncta and GFP expression in neurohypophyseal synapse was tested with a linear regression model (ANCOVA), accounting for the effect of GFP fluorescence, and individual fish. In UAS:EGFP injection, mean EGFP fluorescence in EGFP-positive NS is not correlated with OXT fluorescence (n = 20; and p>0.25, adj. R2 = 0.23) (B). In UAS:Cdc42(G12V) injection, mean EGFP-Cdc42(G12V) fluorescence in EGFP-positive NS negatively correlates with OXT fluorescence (n = 23; p<2.2e-16, adj. R2 = 0.47) larvae (C). Legends for Source data and Source code files.
Tables
Key resources table
| Reagent type (species) or resource | Designation | Source or reference | Identifiers | Additional information |
|---|---|---|---|---|
| Genetic reagent, TL (D. rerio) | Tg(oxt:EGFP)wz01 | (Blechman et al., 2011) | ZDB-ALT-111103–1 | |
| Genetic reagent, TL (D. rerio) | Tg(oxt:gal4)wz06 | (Anbalagan et al., 2018) | ZDB-ALT-171113–2 | |
| Genetic reagent, TL (D. rerio) | Tg(oxt:OXTSP-EGFP-OXT)wz14 | This manuscript | ZDB-ALT-181219–3 | |
| Genetic reagent, TL (D. rerio) | Tg(UAS:sypb-EGFP)biu5 | (Zada et al., 2014) | ZDB-ALT-150115–1 | Lior Appelbaum (Bar-Ilan Univ.) |
| Genetic reagent, TL (D. rerio) | Tg(UAS:Lifeact-GFP)mu271 | (Helker et al., 2013) | ZDB-ALT-130624–2 | Wiebke Herzog (Univ. of Muenster) |
| Genetic reagent, TL (D. rerio) | Tg(UAS:BotxLCB-GFP)icm21 | (Sternberg et al., 2016) | ZDB-ALT-160119–9 | Claire Wyart (ICM, Paris) |
| Genetic reagent, TL (D. rerio) | Tg(UAS:NTR-mCherry)c264 | (Davison et al., 2007) | ZDB-ALT-070316–1 | |
| Genetic reagent, TL (D. rerio) | Tg(−1.0pomca:Gal4-VP16)wz05 | (Anbalagan et al., 2018) | ZDB-ALT-171113–1 | |
| Genetic reagent, TL (D. rerio) | robo2ti272z | (Fricke et al., 2001) | ZDB-ALT-980203–1097 | Joshua Bonkowsky (Univ. of Utah) |
| Recombinant DNA reagent | Tol2 pDEST myl7:mCherry | (Golan et al., 2016) | Berta Levavi-Sivan, HUJI, Rehovot | |
| Recombinant DNA reagent | Tol2 10xUAS:EGFP; myl7:mCherry | This manuscript | Materials and methods - Transgenesis experiments | |
| Recombinant DNA reagent | Tol2 oxt:OXTSP-EGFP-OXT; myl7:EGFP | This manuscript | Materials andmethods -Transgenesis experiments | |
| Recombinant DNA reagent | Tol2 UAS:Cdc42-G12V-EGFP | (Ando et al., 2013) | Naoki Mochizuki (NCVC, Osaka) | |
| Recombinant DNA reagent | Tol2 UAS:Cdc42-T17N-EGFP | (Ando et al., 2013) | Naoki Mochizuki (NCVC, Osaka) | |
| Recombinant DNA reagent | Tol2 pME mCherry-Utrophin-CH | (Andersen et al., 2011) | Mary Hallaron (Univ. of Wisconsin) | |
| Recombinant DNA reagent | Tol2 10xUAS:mCherry-Utrophin-CH; myl7:mCherry | This manuscript | Materials and methods - Visualization of synaptic F-actin | |
| Recombinant DNA reagent | Tol2 pME Slit3(SignalPeptide)-EmeraldGFP-Slit3 | This manuscript | Joshua Bonkowsky (Univ. of Utah) | |
| Recombinant DNA reagent | Tol2 10xUAS: Slit3(SignalPeptide)-EmeraldGFP-Slit3; myl7:mCherry | This manuscript | Materials and methods -Transgenesis experiments | |
| Antibody | Guinea pig polyclonal, anti-OXT | Peninsula labs | T-5021; RRID:AB_518526 | (1:200) |
| Antibody | Rabbit polyclonal, anti-GFP | ThermoFisher | A11122; RRID:AB_221569 | (1:200) |
| Antibody | Mouse monoclonal, anti-Neurophysin | (Ben-Barak et al., 1984) | PS45; RRID:AB_2062089 | Harold Gainer (NINDS, Bethesda) |
| Antibody | Alexa 488- or 647- Secondary antibodies | Jackson ImmunoResearch Laboratories | (1:200) Materials and methods - Immuno-fluorescent staining | |
| Antibody | Alexa 568- or 647- Secondary antibodies | Invitrogen | (1:2000) Materials andmethods - Visualization of synaptic F-actin | |
| Chemical compound | Cytochalasin D | Sigma | C8273 | 400 nM |
| Chemical compound | Glucose oxidase | Sigma | G2133 | 8440 AU |
| Chemical compound | Catalase | Sigma | C40 | 70200 AU |
| Software | R | (R Development Core Team, 2013) | Materials and methods – Statistical analysis | |
| Software | Turboreg plugin | (Thévenaz et al., 1998) | Materials andmethods – Statistical analysis | |
| Software | EasyFRAP | (Rapsomaniki et al., 2012) | Materials andmethods – FRAP analysis | |
| Sequence-based reagent | TATATCCTCTGAGGCTGATAGCAGC | Gene Tools, (Barresi et al., 2005) | ZDB-MRPHLNO-050927–3 | Materials andmethods -Transgenesis experiments. slit3 knockdown |
| Sequence-based reagent | gaatgactcctcgtcgctct and gctgaggcatcttgtctgta | Sigma | Materials andmethods -Animals. robo2 genotyping | |
| Sequence-based reagent | gcatttacaacagctccatc | Sigma | Materials andmethods -Animals.robo2 sequencing primer | |
| Sequence-based reagent | tgtacaggcagatgtcaggc and TAATACGACTCACTATAGGG-tcctcctccagtagagccag | Sigma | Materials andmethods - In situ hybridization. PCR primers for robo2 probe |
Additional files
-
Source code 1
R script for data extraction: R script to extract animal-wise neurohypophyseal synaptic parameters from the Volocity software-derived batch output files.
- https://cdn.elifesciences.org/articles/45650/elife-45650-code1-v3.r
-
Source code 2
R script for data transformation: R script to log-transform the neurohypophyseal synaptic volume data.
- https://cdn.elifesciences.org/articles/45650/elife-45650-code2-v3.r
-
Source code 3
R script for data analysis: R script to analyze log-transformed neurohypophyseal synaptic data.
- https://cdn.elifesciences.org/articles/45650/elife-45650-code3-v3.r
-
Source code 4
R script for Lifeact-EGFP FRAP data analysis: R script to analyze neurohypophyseal synapse.
Lifeact-EGFP FRAP data by linear-mixed model (Figure 4D).
- https://cdn.elifesciences.org/articles/45650/elife-45650-code4-v3.rmd
-
Source code 5
R script for OXT-EGFP FRAP data analysis: R script to analyze neurohypophyseal synapse.
OXT-EGFP FRAP data by linear-mixed model (Figure 6I).
- https://cdn.elifesciences.org/articles/45650/elife-45650-code5-v3.rmd
-
Source code 6
R script for correlation analysis: R script to analyze and plot neurohypophyseal synaptic.
EGFP vs OXT fluorescence by linear regression (Figure 7).
- https://cdn.elifesciences.org/articles/45650/elife-45650-code6-v3.r
-
Transparent reporting form
- https://cdn.elifesciences.org/articles/45650/elife-45650-transrepform-v3.pdf
Download links
A two-part list of links to download the article, or parts of the article, in various formats.
Downloads (link to download the article as PDF)
Open citations (links to open the citations from this article in various online reference manager services)
Cite this article (links to download the citations from this article in formats compatible with various reference manager tools)
Robo2 regulates synaptic oxytocin content by affecting actin dynamics
eLife 8:e45650.
https://doi.org/10.7554/eLife.45650


