Near-infrared dual bioluminescence imaging in mouse models of cancer using infraluciferin
- University College London, United Kingdom
- The Institute of Cancer Research, United Kingdom
- Connecticut College, United States
Figures
Figure 1 with 1 supplement
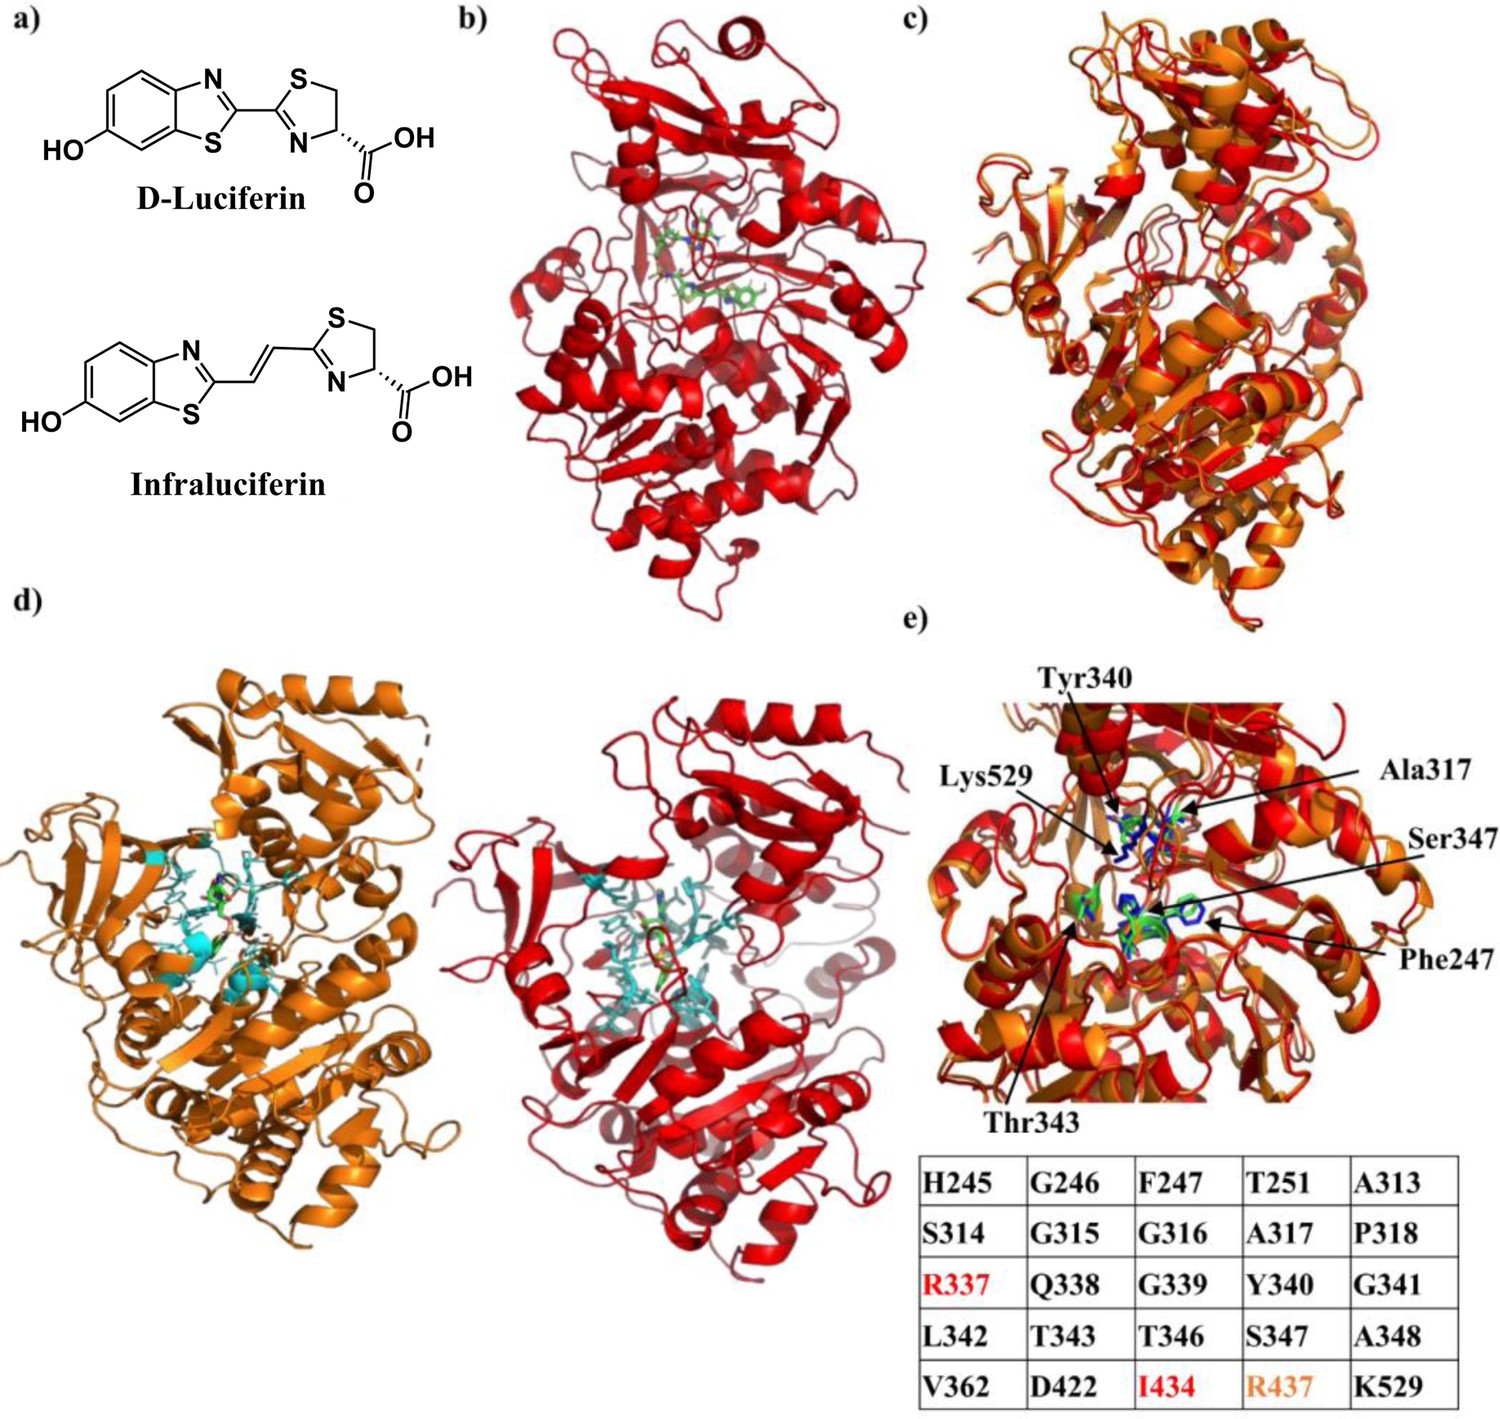
Crystal structure of Firefly luciferase in complex with a iLH2 analogue.
(a) Chemical structures of native D-Luciferin (LH2) and the LH2 analogue infraluciferin (iLH2). (b) The crystal structure of Firefly luciferase (FLuc) in complex with the infraluciferyl-adenylate analogue 5’-O-[(N-dehydroinfraluciferyl)-sulfamoyl] adenosine (iDLSA) resolved to a 3.2 Å resolution (PDB ID: 6HPS). (c) The structure of FLuc in complex with the iLH2 analogue iDLSA aligned to the reported structure of FLuc in complex with the LH2 analogue 5’-O-[(N-dehydroluciferyl)-sulfamoyl] adenosine (DLSA) (PDB ID: 4G36) (Sundlov et al., 2012) based on the FLuc N-terminal domain (residues 1–436). The structure of FLuc in complex with iLH2 is shown in red, and the structure of FLuc in complex with LH2 is shown in orange. (d) The structure of FLuc in complex with luciferin analogue DLSA (PDB ID: 4G36) (orange) and the infra-luciferin analogue iDLSA (red). Those residues within 4 Å of the substrate in each structure are highlighted in blue. (e) The table lists all residues within 4 Å of the both substrates, with those in orange or red only being found within 4 Å of DLSA and iDLSA respectively. (f) Highlights the same seven active site residues for both the aligned structures, with FLuc iLH2 residues in blue and FLuc LH2 residues in green. All analysis performed in PyMOL software (Schrodinger).
Figure 1—figure supplement 1
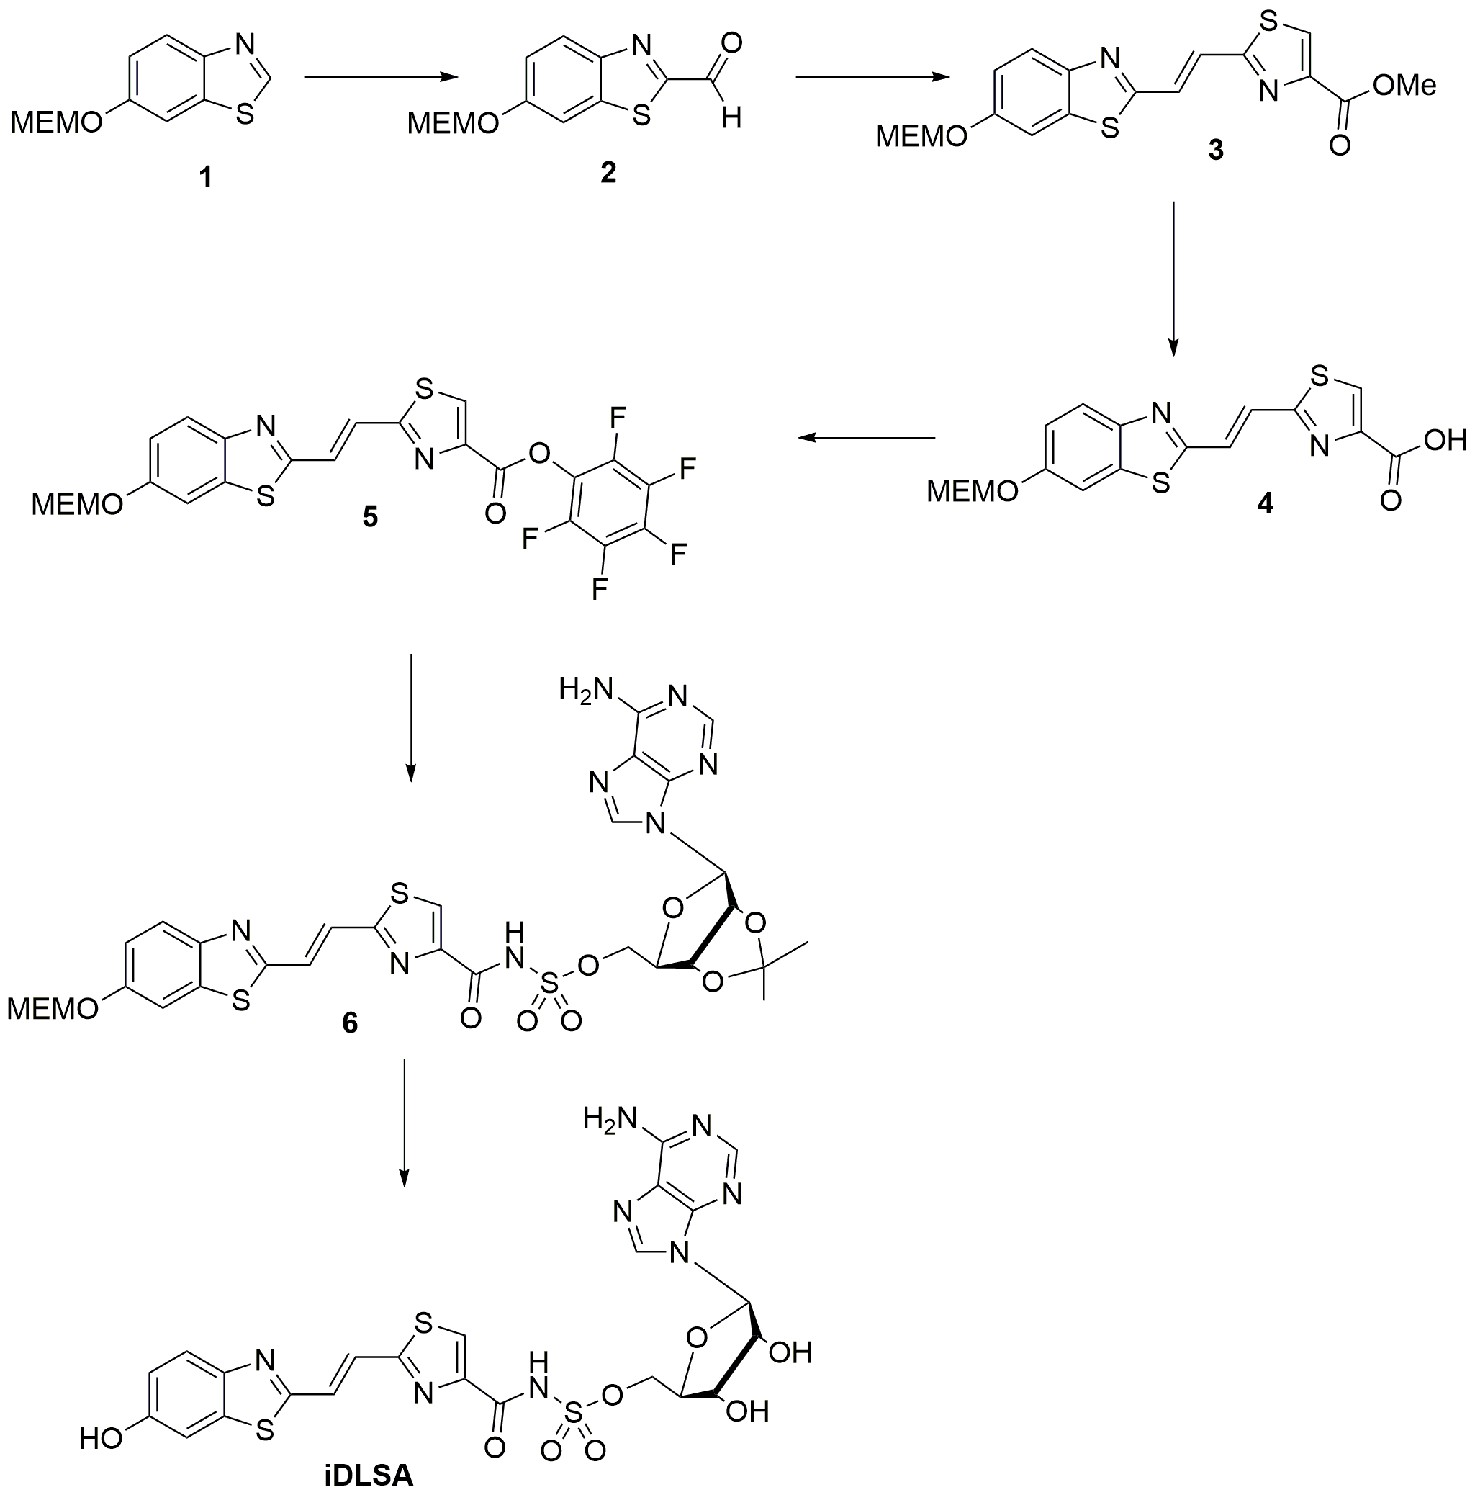
Synthetic Scheme for the synthesis of iDLSA.
https://doi.org/10.7554/eLife.45801.004
Figure 2 with 2 supplements
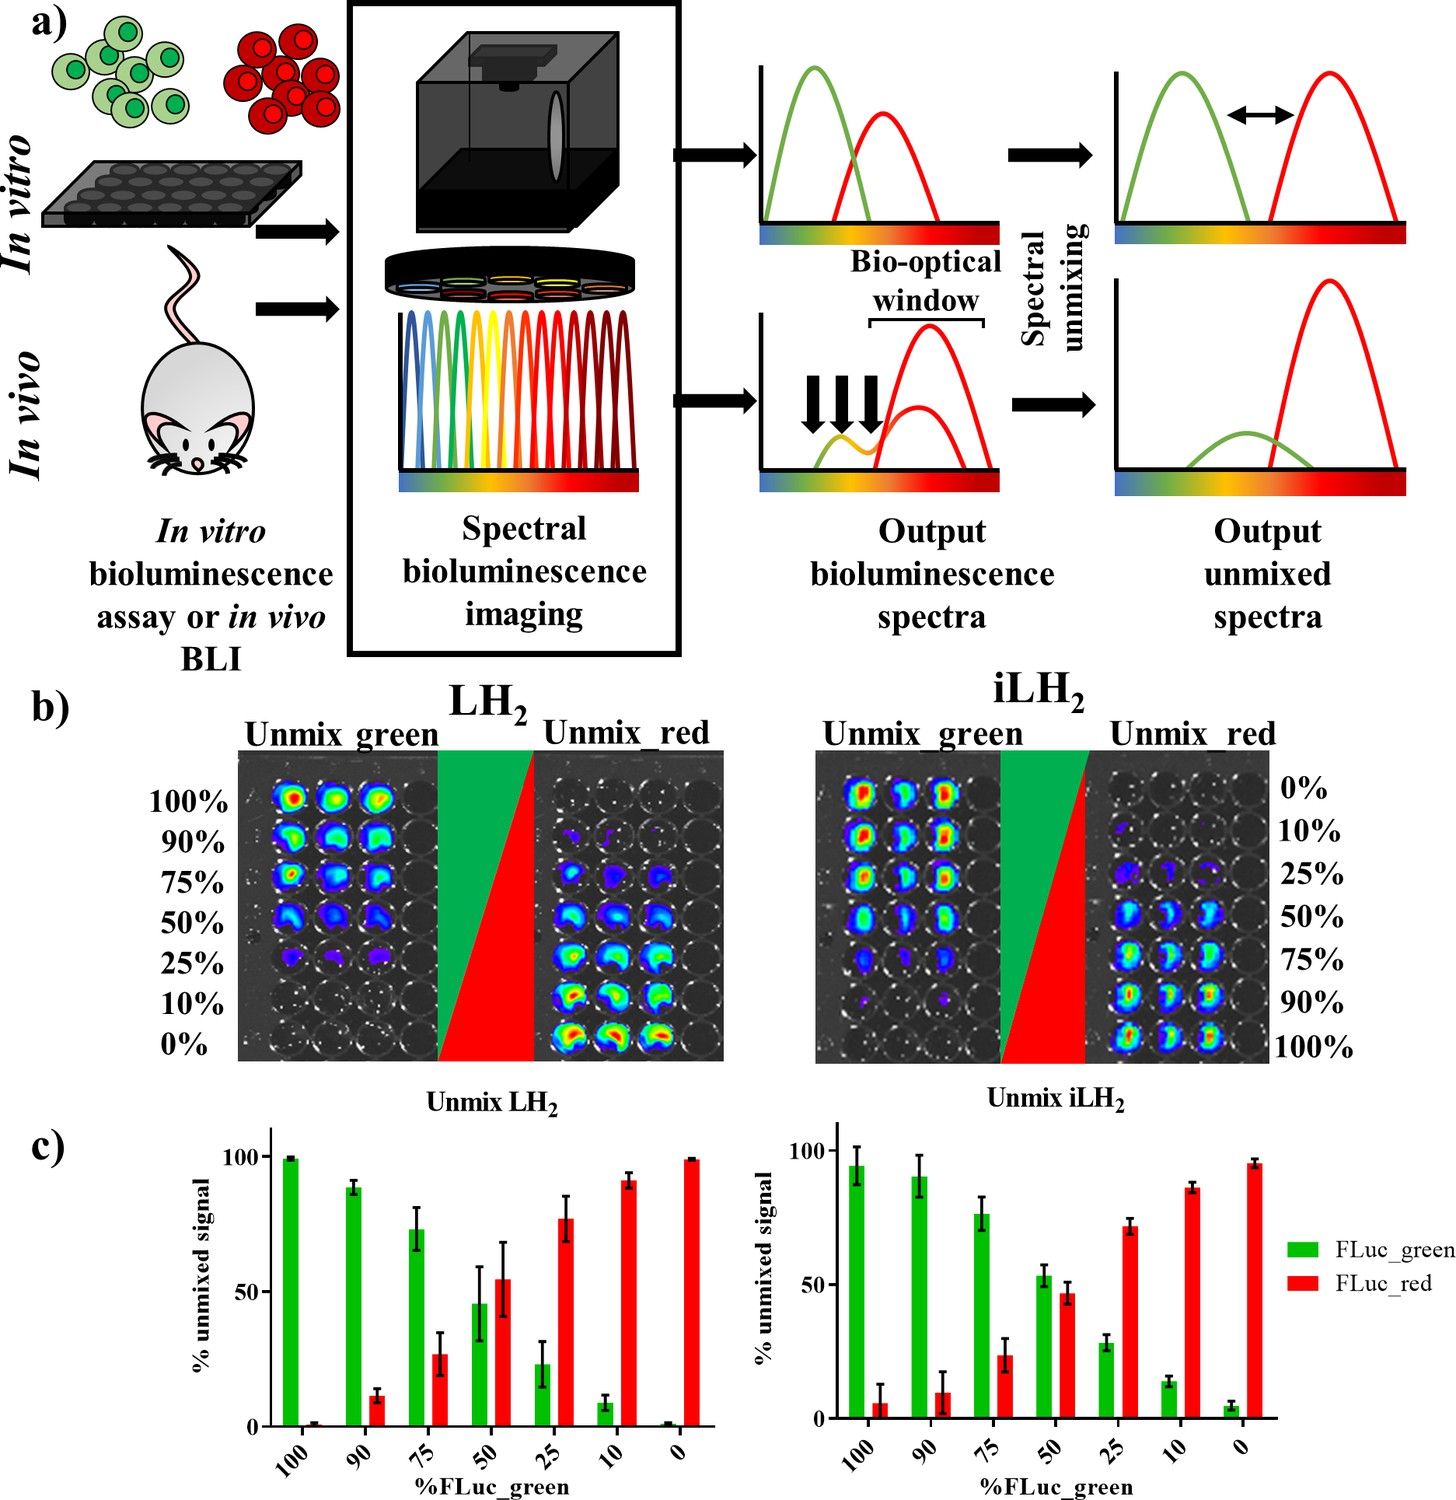
Spectral unmixing of Firefly luciferase mutants in vitro.
(a) Bioluminescence spectral unmixing of cells expressing colour-shifted Firefly luciferase (FLuc) mutants, for both in vitro assays and in vivo animal models, requires spectral bioluminescence imaging through a series of bandpass filters. Bioluminescence spectral imaging acquires spectral data, which can then be deconvoluted into its separate components. As depicted, spectral unmixing in vivo is significantly more challenging due to attenuation of bioluminescent signal that does not fall within the bio-optical window. (b) FLuc colour mutants FLuc_green and FLuc_red expressed in the B lymphoma Raji cell line were mixed in various proportions (0–100% of the total population). After addition of either D-luciferin (LH2) or infraluciferin (iLH2) plates were spectrally imaged using the IVIS Spectrum (Perkin Elmer).Unmixed green and unmixed red output images produced from library spectral unmixing using Living Image software (Perkin Elmer) for both substrates. (c) Percentage unmixed signal of FLuc_green and FLuc_red for each ratio of FLuc expressing cells tested when imaged with LH2 and iLH2. Signal adjusted to 100% populations. Mean and standard deviation plotted (n = 6 for both LH2 and iLH2).
Figure 2—figure supplement 1
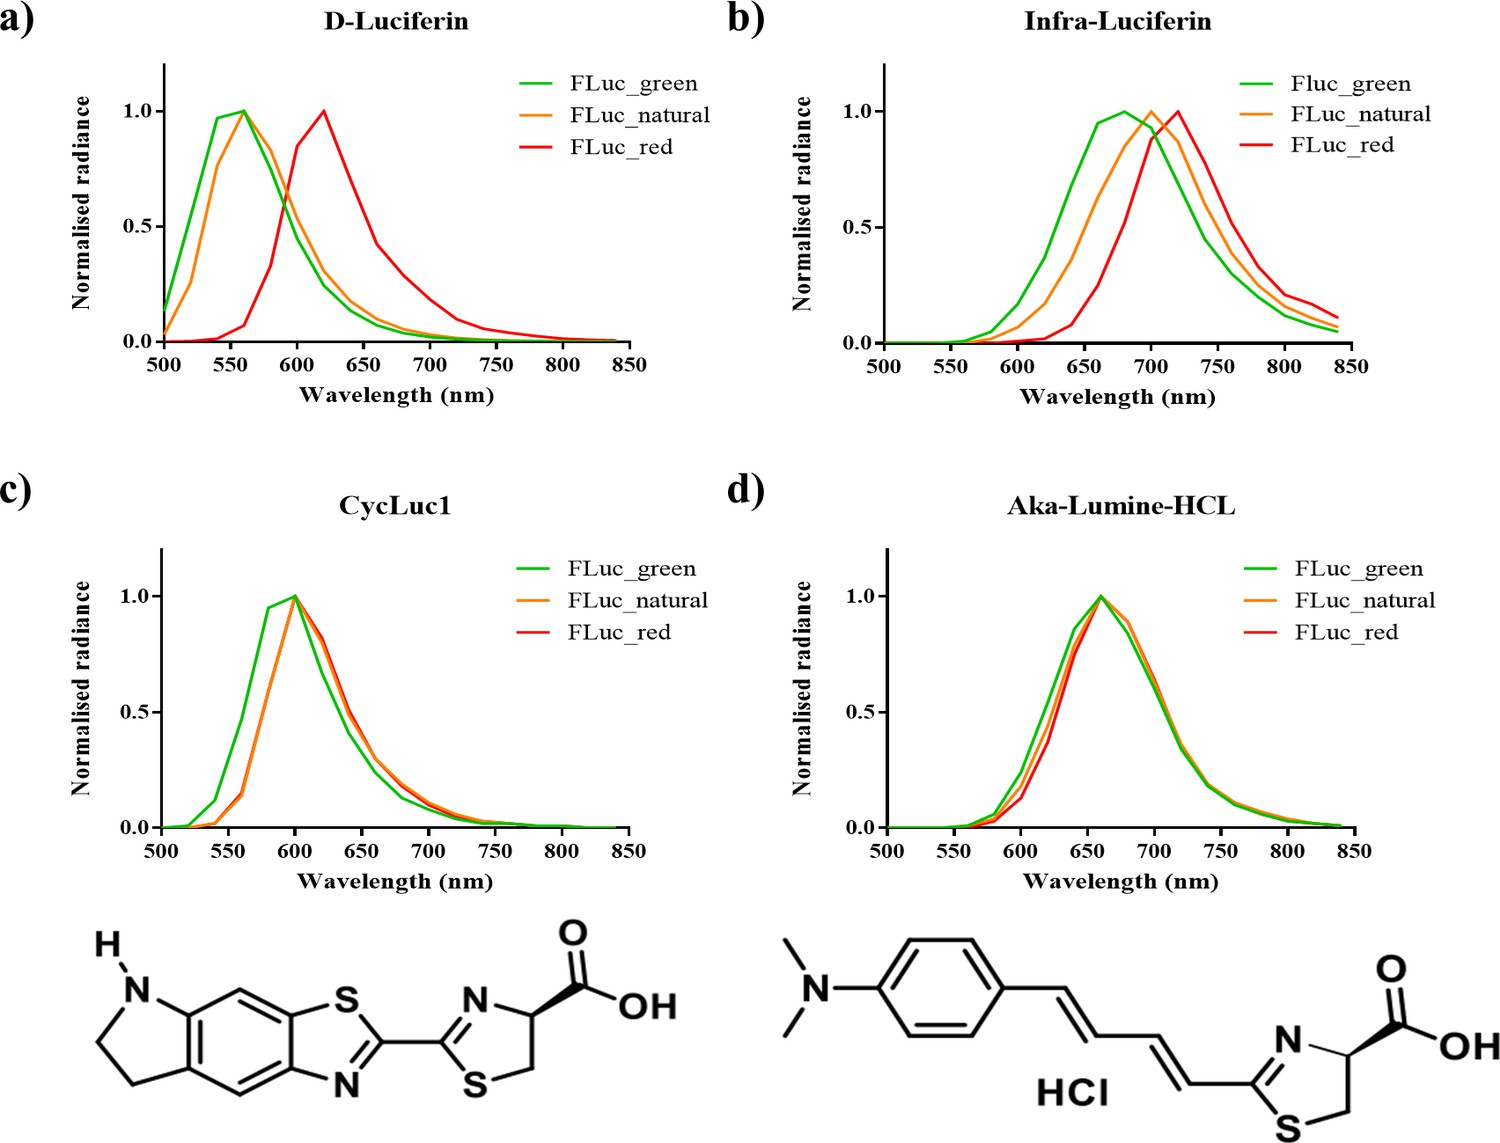
Bioluminescence spectra of x11 FLuc mutants FLuc_natural, FLuc_green and FLuc_red with LH2 analogues.
(a) LH2, (b) iLH2, (c) CycLuc1 and d) Aka-Lumine-HCL) in vitro, alongside the chemical structure of CycLuc1 and Aka-Lumine-HCL below the corresponding spectra). Spectra normalised to peak emission for each FLuc mutant with each substrate. Each point on the x-axis gives the midpoint of the 20 nm band pass filter used in spectral imaging.
Figure 2—figure supplement 2
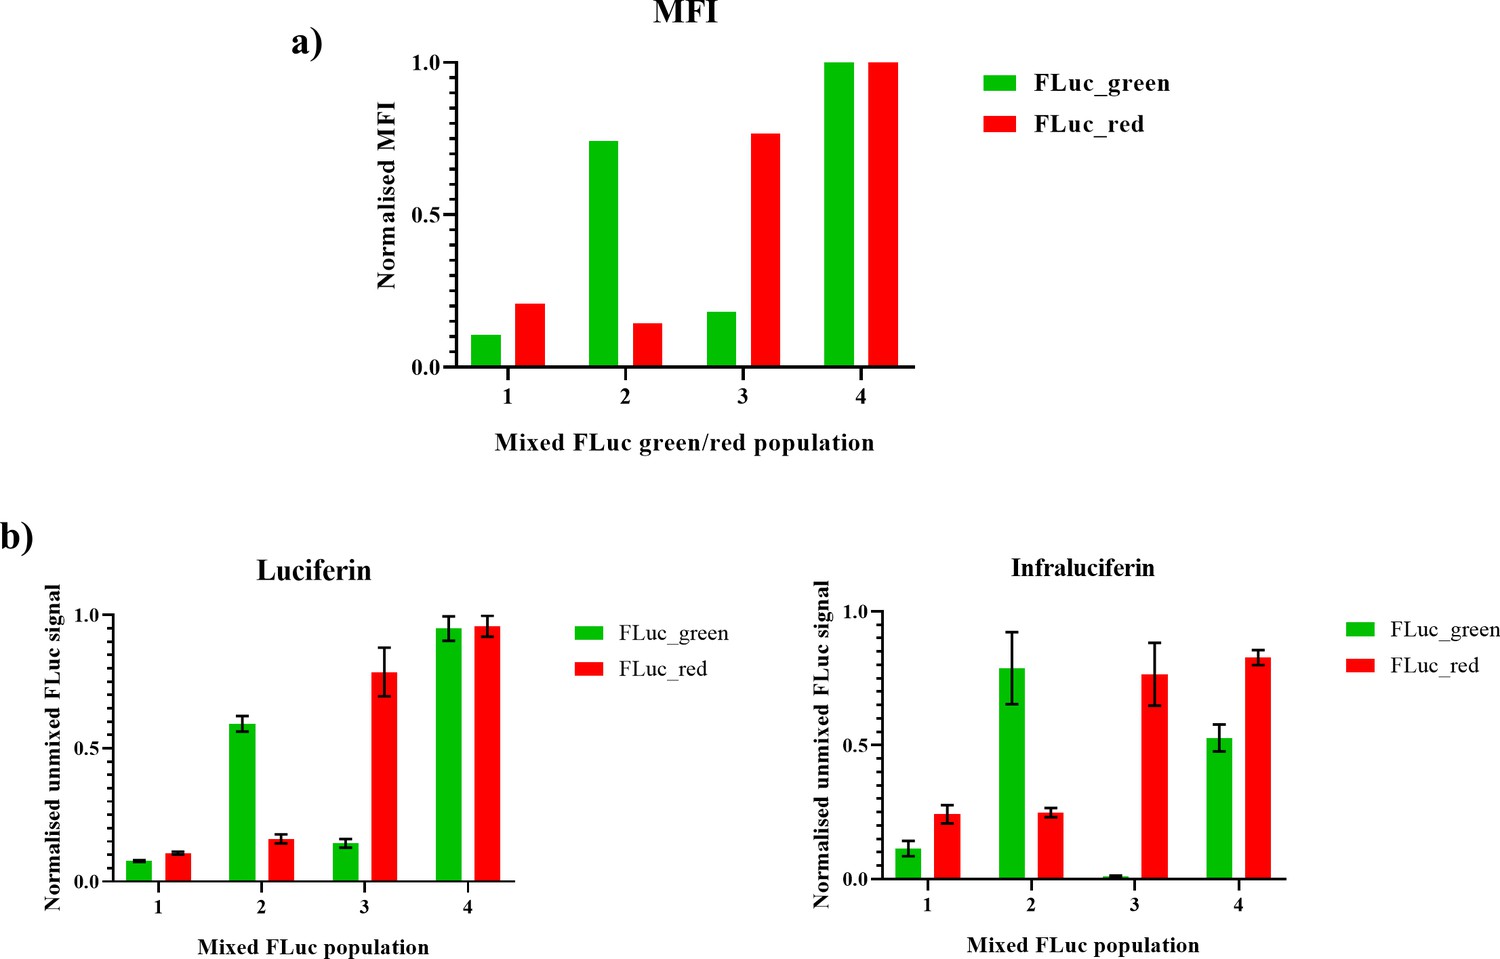
Spectral unmixing of different levels of expressed Fluc_green and Fluc_red in cells with LH2 and iLH2.
The mammalian B Lymphoma Raji cell line was transduced with FLuc_green and FLuc_red, which was then sorted by flow cytometry using co-expressed marker genes to get cell populations with differing expression levels of the two luciferases enzymes. (a) The normalised median fluorescence intensity (MFI) of FLuc_green and FLuc_red for each cellular population (b) Differing combinations of low and high expression levels of FLuc_green and FLuc_red could be detemined using spectral bioluminescence imaging and spectral unmixing with both LH2 and iLH2.
Figure 3 with 2 supplements
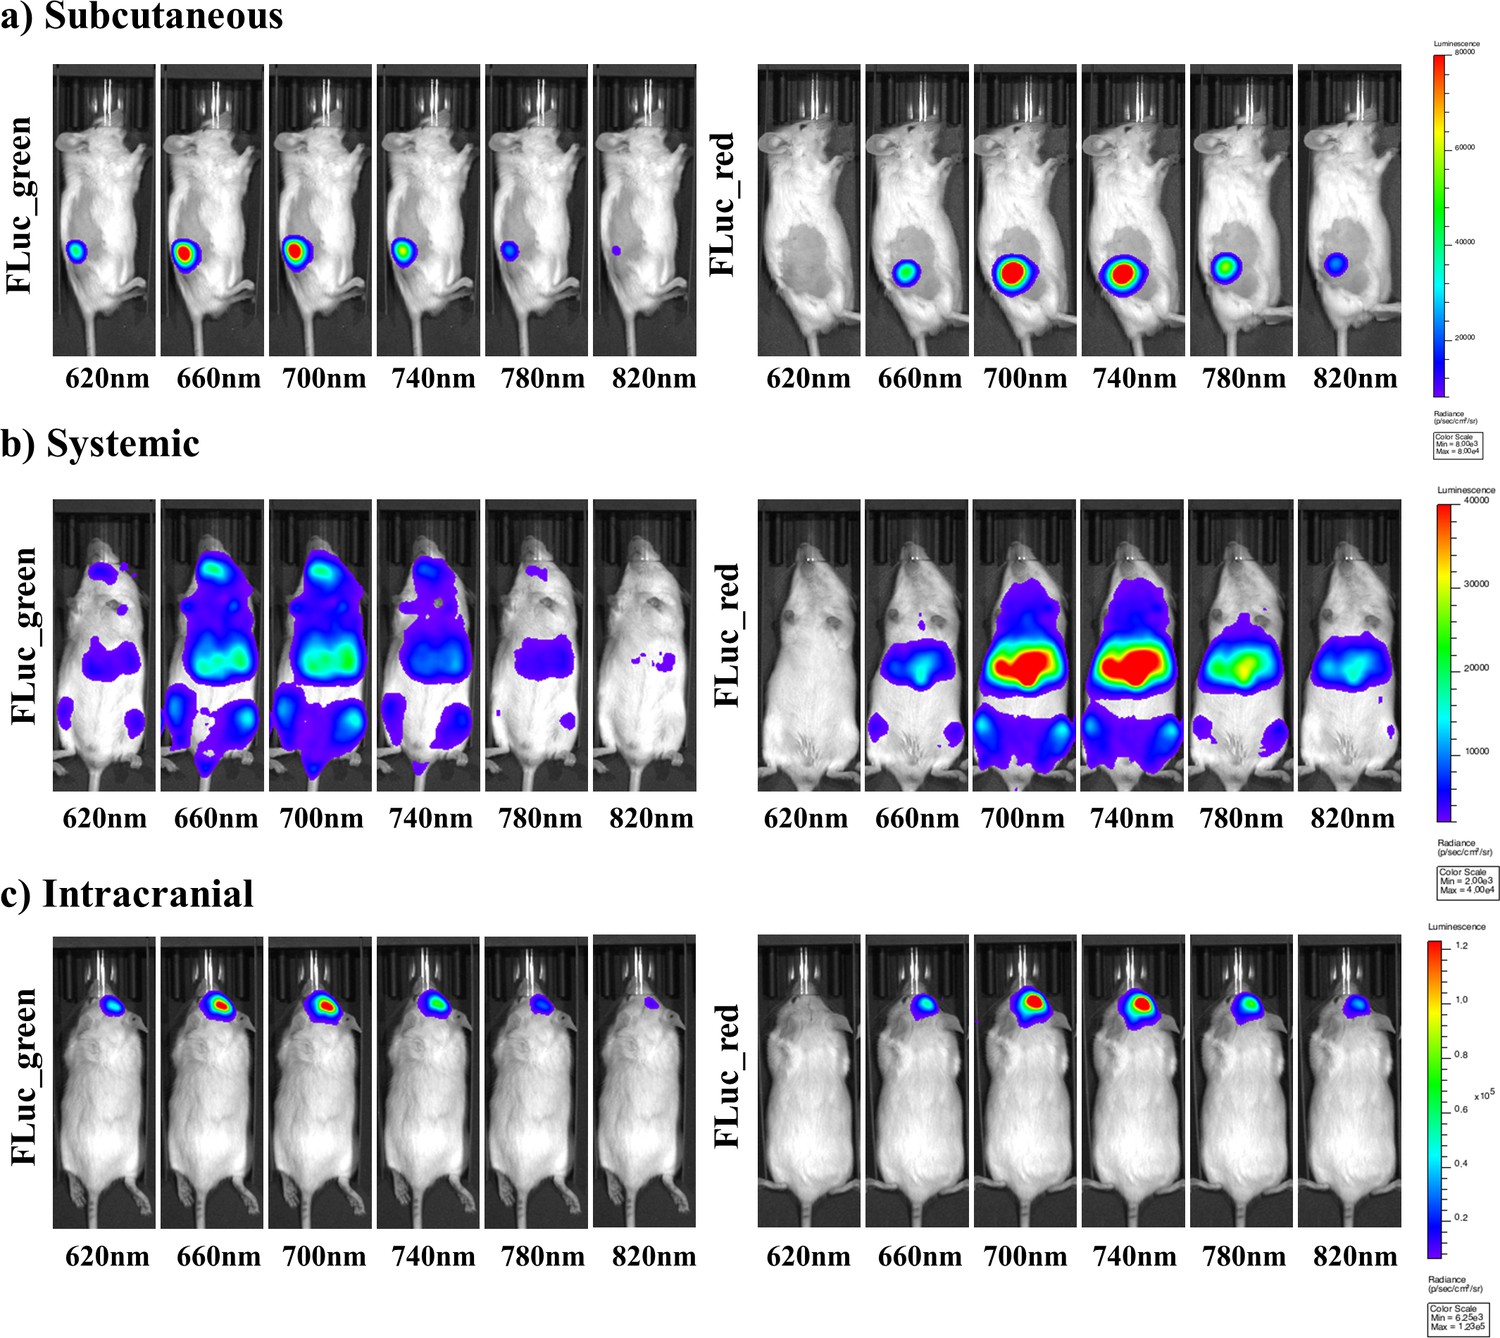
Representative selection of bioluminescent images of FLuc mutants with iLH2 in vivo.
A representative selection of filter images from mice engrafted with the Raji B lymphoma cell line expressing either Fluc_green or Fluc_red for each of the in vivo tumour models when imaged with iLH2 (a) subcutaneous (b) systemic and (c) intracranial (bandpass filters not shown are 600 nm, 640 nm, 680 nm, 720 nm, 760 nm, 800 nm).
Figure 3—figure supplement 1
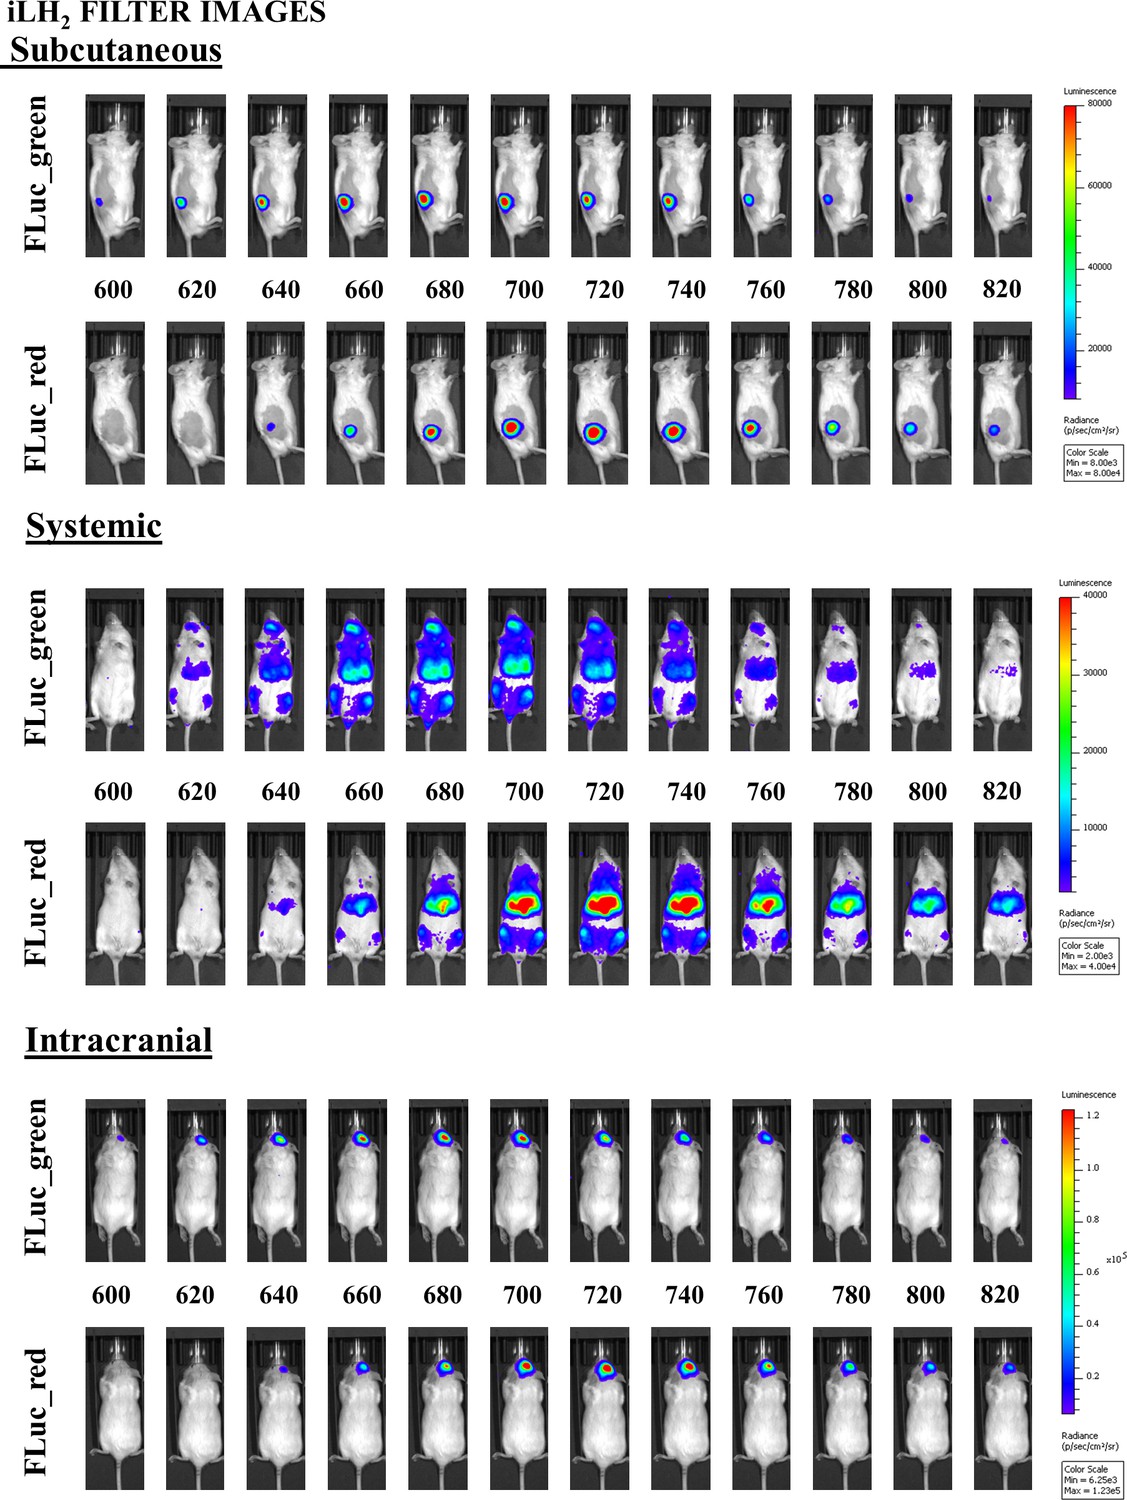
Example of all filter images for FLuc_green and FLuc_red acquired in each in vivo model with iLH2.
https://doi.org/10.7554/eLife.45801.009
Figure 3—figure supplement 2
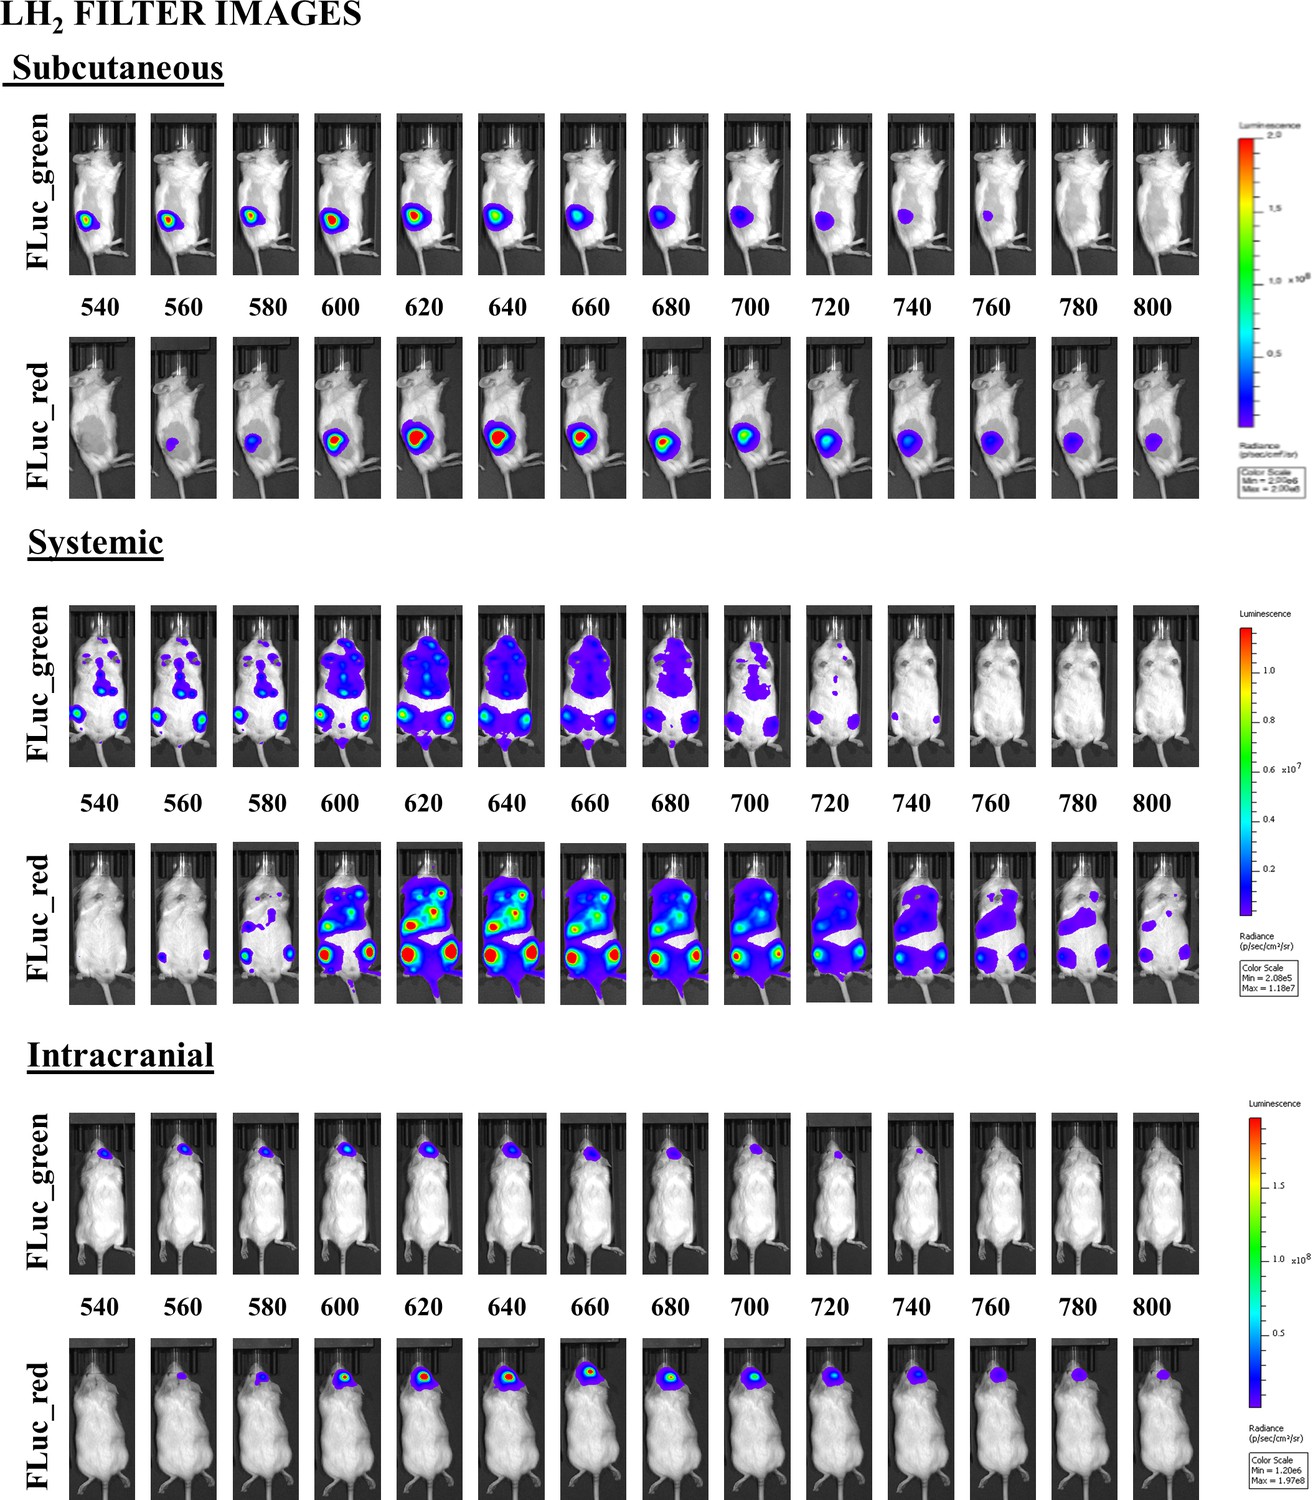
Corresponding example of all filter images for FLuc_green and FLuc_red acquired in each in vivo model with LH2.
https://doi.org/10.7554/eLife.45801.010
Figure 4
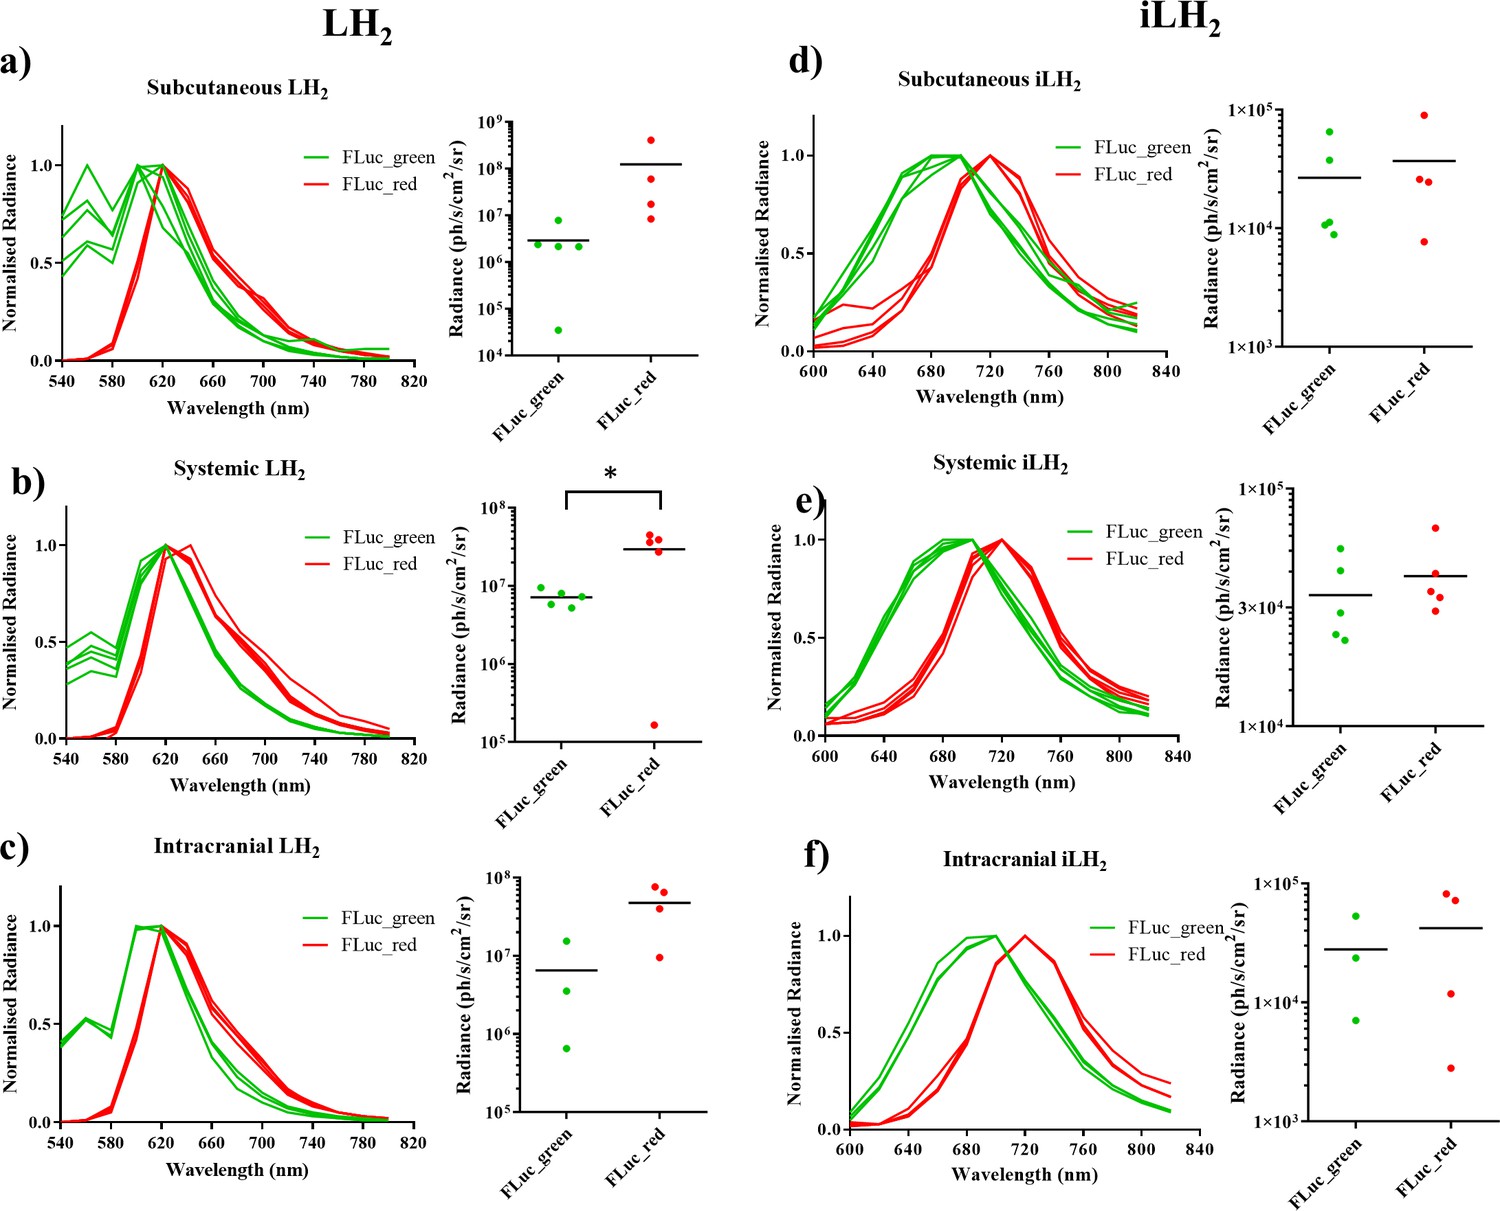
Spectral characterisation of FLuc mutants with LH2 and iLH2 in vivo.
The normalised spectra, and a plot of average radiance, for each FLuc mutant when expressed in the Raji B lymphoma cell line engrafted in each tumour model when imaged with LH2 is shown, (a) subcutaneous (b) systemic and (c) intracranial, and when the same animals were imaged with iLH2 is shown, (d) subcutaneous (e) systemic and (f) intracranial. Subcutaneous (n = 9), systemic (n = 10), intracranial (n = 7). T test used to establish statistical significance comparing average radiance values (systemic model when imaged with LH2p=0.0224).
Figure 5 with 1 supplement
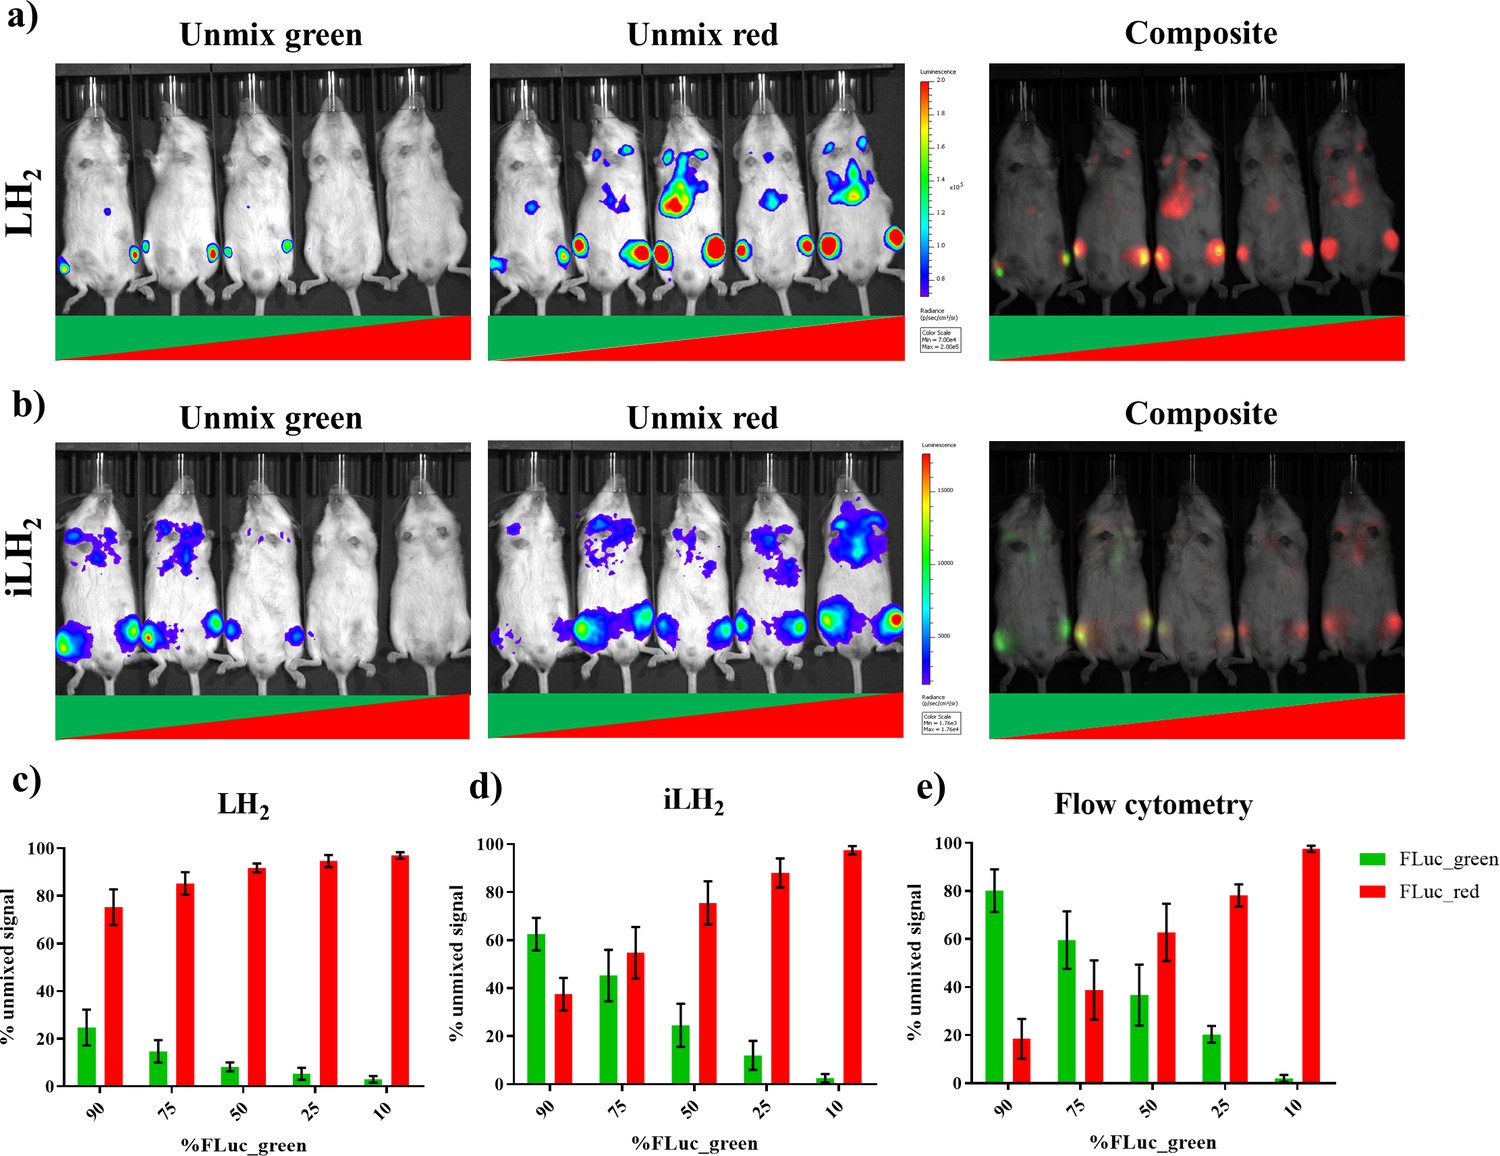
Spectral unmixing of Firefly luciferase mutants in vivo.
The Raji B lymphoma cell line expressing either FLuc_green or Fluc_red, were mixed in various proportions and engrafted in a systemic in vivo model. Cell mixtures ranged from 90:10 to 10:90 Fluc_green to Fluc_red, and each imaging session included one mouse engrafted with each mixture. Animals were spectrally imaged with D-Luciferin (LH2) and infraluciferin (iLH2) using the IVIS spectrum (Perkin Elmer) in separate imaging sessions. (a) An example of the unmixed Fluc_green, umixed Fluc_red and composite output images when imaged with LH2 and (b) iLH2. Percentage of unmixed Fluc_green and Fluc_red signal for each cell mixture when imaged with (c) LH2 (d) iLH2, and (e) extracted bone marrow samples when analysed by flow cytometry (n = 4 per dilution condition).
Figure 5—figure supplement 1
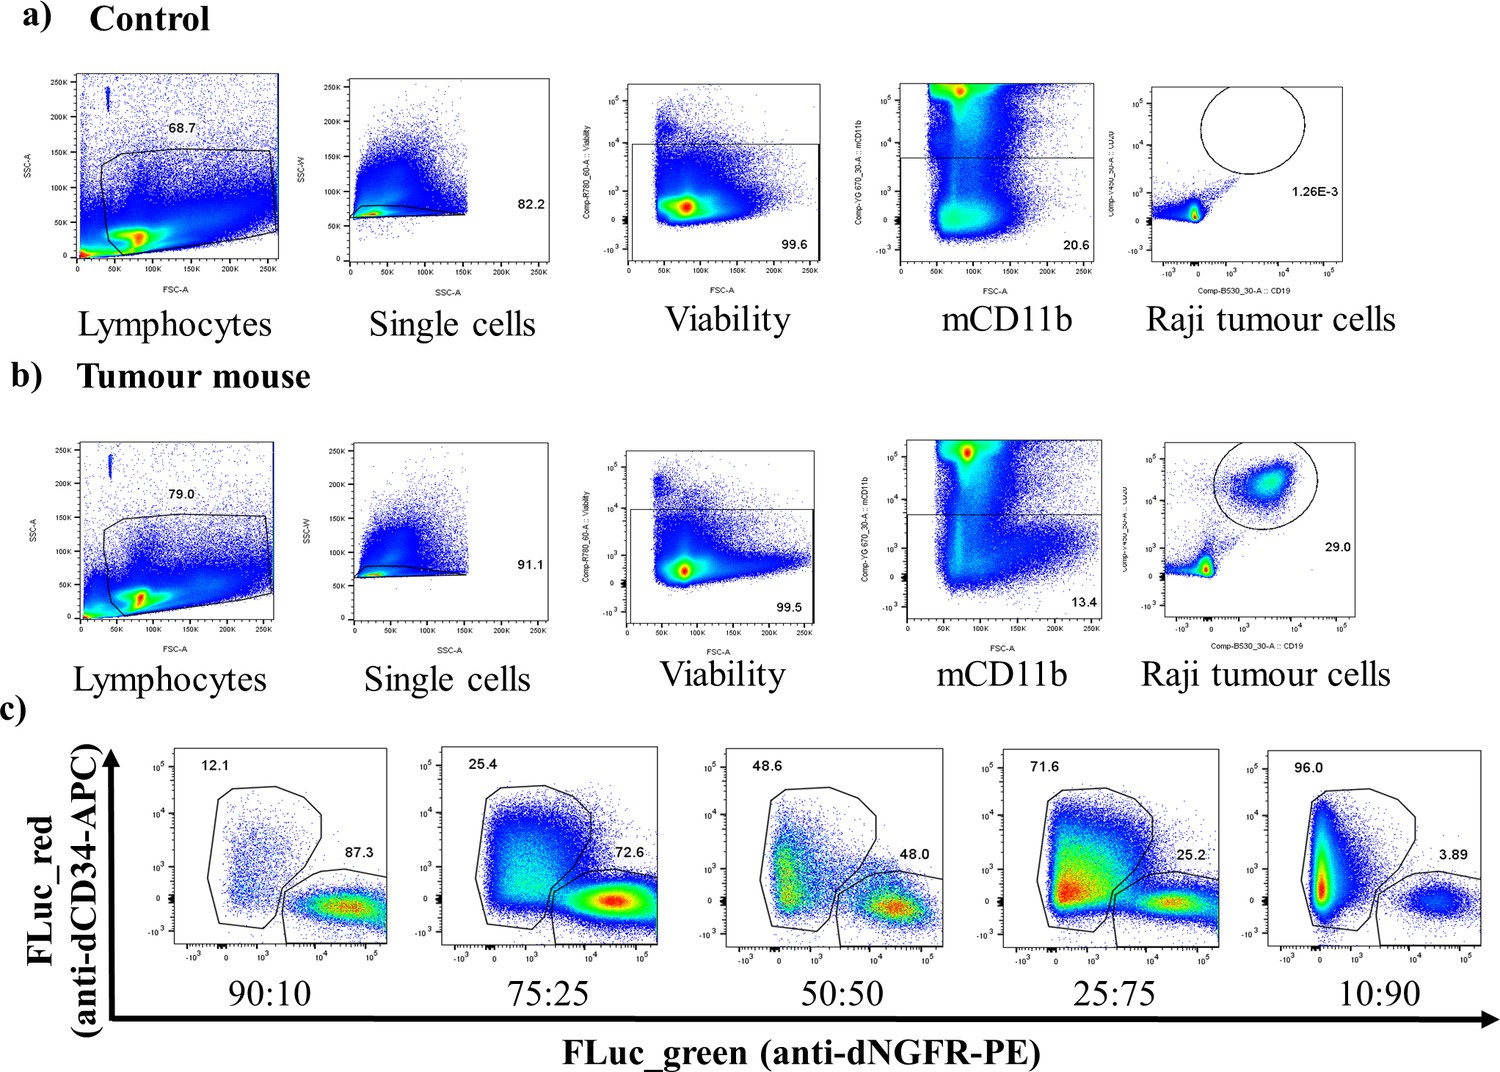
Representative flow cytometry plots of extracted bone marrow samples.
Representative flow cytometry plots showing gating of extracted bone marrow sample from (a) an FLuc mutant Raji tumour model and from (b) a control mouse. (c) also representative flow cytometry plots from a mouse engrafted with each different mixture of mutant FLuc Raji cells (ratio given is Fluc_green: Fluc_red).
Figure 6
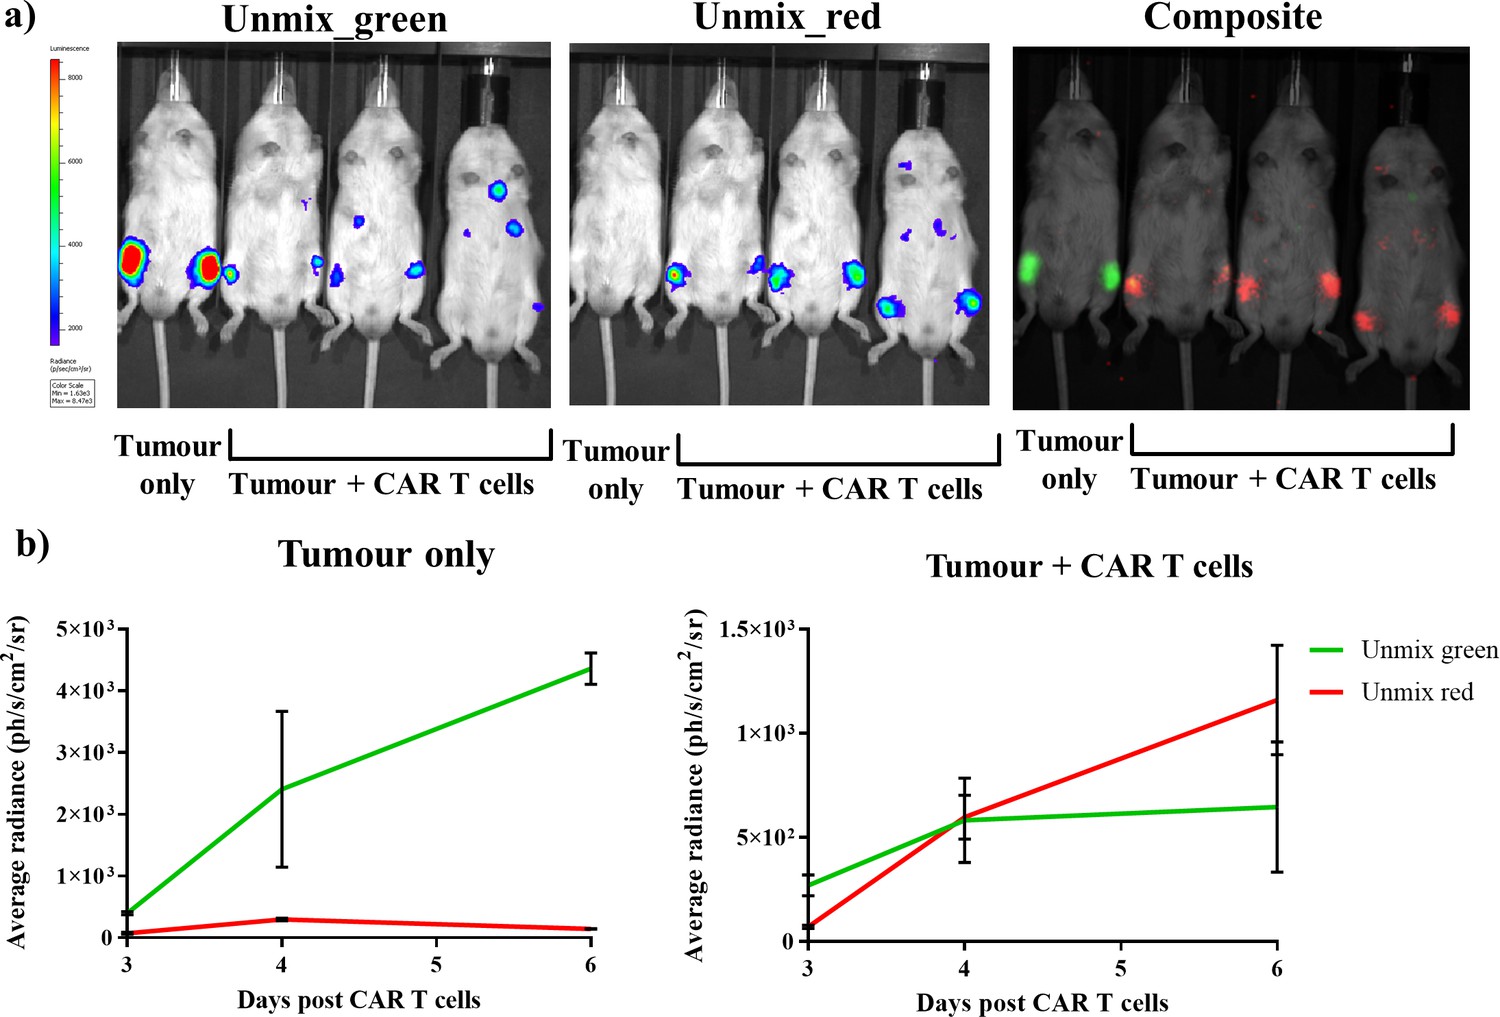
Dual bioluminescence imaging of CAR T cell therapy using infraluciferin.
Mice were engrafted with the Raji B lymphoma tumour cell line expressing Fluc_green, and were subsequently treated with healthy human donor T cells engineered to express CD19 CAR and FLuc_red (except the tumour only control). Animals were then spectrally imaged after administration of iLH2 using the IVIS spectrum (Perkin Elmer). (a) The unmixed Fluc_green images, representing tumour burden, and unmixed Fluc_red images, representing CAR T cell homing, and the composite image are shown for day six post CAR T cell treatment. (b) The average radiance of signal classified as Fluc_green and Fluc_red is plotted for days 3, 4 and 6 post CAR T cell administration for the tumour only control and treatment (tumour + CAR T cells) animals. Three mice were randomly selected to receive CAR T cell therapy after engraftment was confirmed. Mean and standard deviation plotted. Radiance values from each femur are treated separately (tumour only = 2, treatment = 6).
Tables
Key resources table
| Reagent type (species) or resource | Designation | Source or reference | Identifiers | Additional information |
|---|---|---|---|---|
| Gene (Photinus pyralis) | FLuc | this paper | N/A | Amino acid changes from ref 21 and 23, codon optimised for mammalian expression for use in this paper |
| Strain, strain background (mouse, male) | NSG | Jax mouse strain (Charles River) | NOD.Cg-Prkdcscid Il2rgtm1WjI/SzJ | N/A |
| Cell line (Human, male) | Raji B lymphoma | ATCC CCL-86 | N/A | Mycoplasma tested by GATC (Eurofins Genomics) |
| Antibody | Anti-human CD34-PE | Biolegend | Clone 581, RRID: AB_1731862 | (1:20) |
| Antibody | Anti-human CD271-APC | Biolegend | Clone ME20.4, RRID: AB_10645515 | (1:20) |
| Chemical compound, dye | Viability APC eFluoro780 | eBioscience | N/A | (1:1000) |
| Antibody | Anti-mouse/human CD11b PerCP/Cy5.5 | Biolegend | Clone M1/70, RRID: AB_893232 | (1:20) |
| Antibody | Anti-human CD19 FITC | eBioscience | Clone HIB19, RRID: AB_10669461 | (1:20) |
| Antibody | Anti-human CD20 eFLuor 450 | eBioscience | Clone 2H7, RRID: AB_1633384 | (1:20) |
| Chemical compound, drug | Luciferin | Regis technologies | N/A | N/A |
| Software, algorithm | Living Image | Perkin Elmer | N/A | N/A |
| Software, algorithm | Prism | Graphpad | N/A | N/A |
| Software, algorithm | Excel | Microsoft | N/A | N/A |
| Software, algorithm | Flow Jo | Tree Star Inc (Oregon, USA) | N/A | N/A |
| Software, algorithm | PyMOL software | Schrodinger | N/A | N/A |
| Software, algorithm | CrysalisPro | Agilent Technologies | N/A | N/A |
| Software, algorithm | BD FACSDIVA | BD biosciences | N/A | N/A |
| Other | ||||
| Chemical compound, drug | infraluciferin | Anderson, J.C.; Grounds, H.; Jathoul, A.P.; Murray, J.A.H.; Pacman, S.J.; Tisi, L. RSC Advances 2017, 7, 3975–82 | N/A | Prepared by JC Anderson laboratory |
| Chemical compound, drug | iDLSA | this paper | N/A | Prepared by JC Anderson laboratory, seebelow and data set at https://doi.org/10.5061/dryad.3j9kd51cs. |
| Chemical compound, drug | CycLuc1 | Merck Millipore | N/A | N/A |
| Chemical compound, drug | Aka-Lumine-HCL | Wako Pure Chemical Industries | N/A | N/A |
Additional files
-
Transparent reporting form
- https://doi.org/10.7554/eLife.45801.015
Download links
A two-part list of links to download the article, or parts of the article, in various formats.
Downloads (link to download the article as PDF)
Open citations (links to open the citations from this article in various online reference manager services)
Cite this article (links to download the citations from this article in formats compatible with various reference manager tools)
Near-infrared dual bioluminescence imaging in mouse models of cancer using infraluciferin
eLife 8:e45801.
https://doi.org/10.7554/eLife.45801


