An engineered monomer binding-protein for α-synuclein efficiently inhibits the proliferation of amyloid fibrils
- Heinrich Heine University Düsseldorf, Germany
- University of Cambridge, United Kingdom
- RWTH Aachen University, Germany
- German Centre for Neurodegenerative Diseases (DZNE), Germany
- University of Copenhagen, Denmark
- Forschungszentrum Jülich, Germany
- Dresden University Medical Center, Germany
- JARA BRAIN Institute II, Germany
- Technical University of Denmark, Denmark
Figures
Figure 1
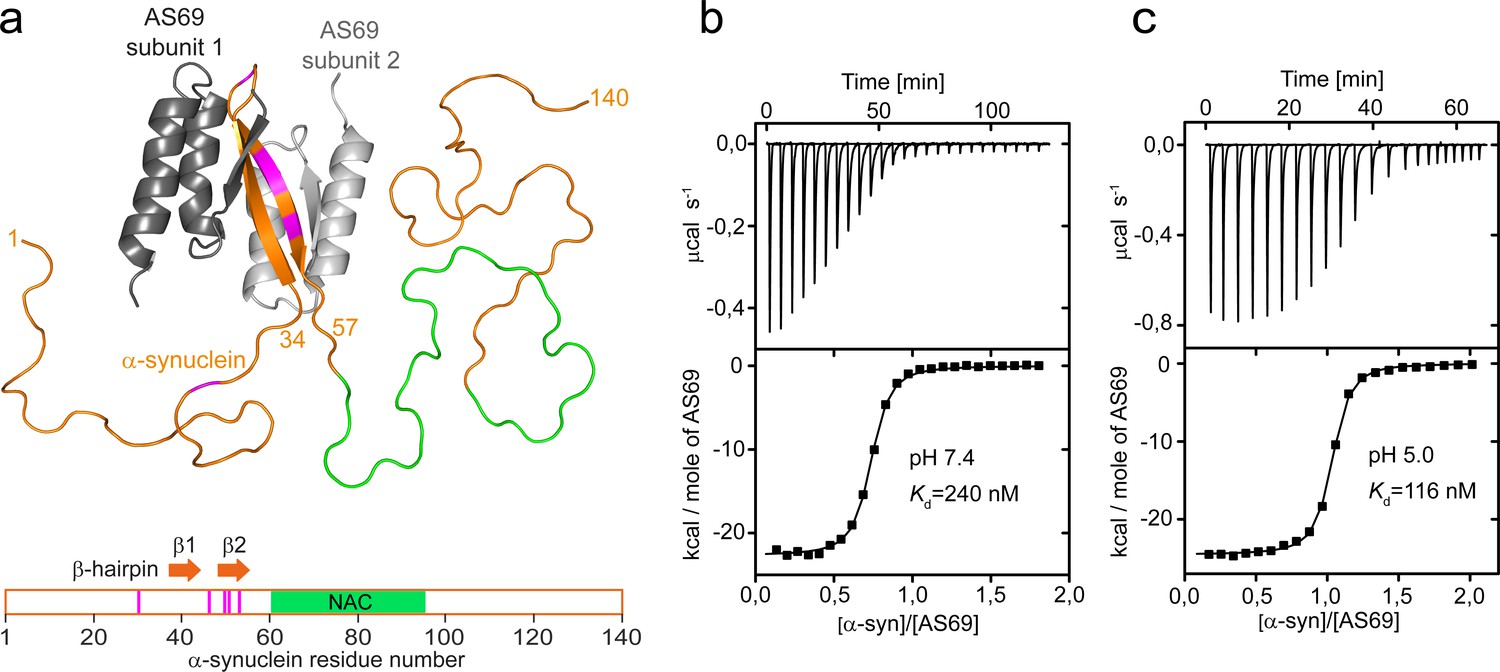
AS69 binds to monomeric -synuclein, inducing local folding of the region comprising residues 37–54 into a -hairpin conformation.
(a) Structural model of the AS69:-synuclein complex based on NMR (pdb entry 4BXL) (Mirecka et al., 2014), generated with PyMOL (The PyMOL Molecular Graphics System, 1.2; Schrödinger, LLC.). AS69 (grey) is a disulfide-linked homodimer. -Synuclein (orange) locally adopts -hairpin conformation, while the remainder of the molecule, including the hydrophobic NAC segment (green), remains intrinsically disordered (Mirecka et al., 2014). Positions at which disease-related mutations have been identified are given in magenta. (b,c) The affinity of AS69 to -synuclein at pH 7.4 (b) and pH 5.0 (c) analyzed by isothermal titration calorimetry (ITC) experiments. Titration of 420 μM -synuclein into 47 μM AS69 in 20 mM sodium phosphate, 50 mM NaCl, pH 7.4 (b), or 320 μM -synuclein into 32 μM AS69 in 20 mM sodium acetate, pH 5.0 (c), at 30 °C. The upper panels show the baseline-corrected instrumental response. The lower panels show the integrated data (filled squares) and the fit to a 1:1 binding model (continuous line).
Figure 2 with 1 supplement
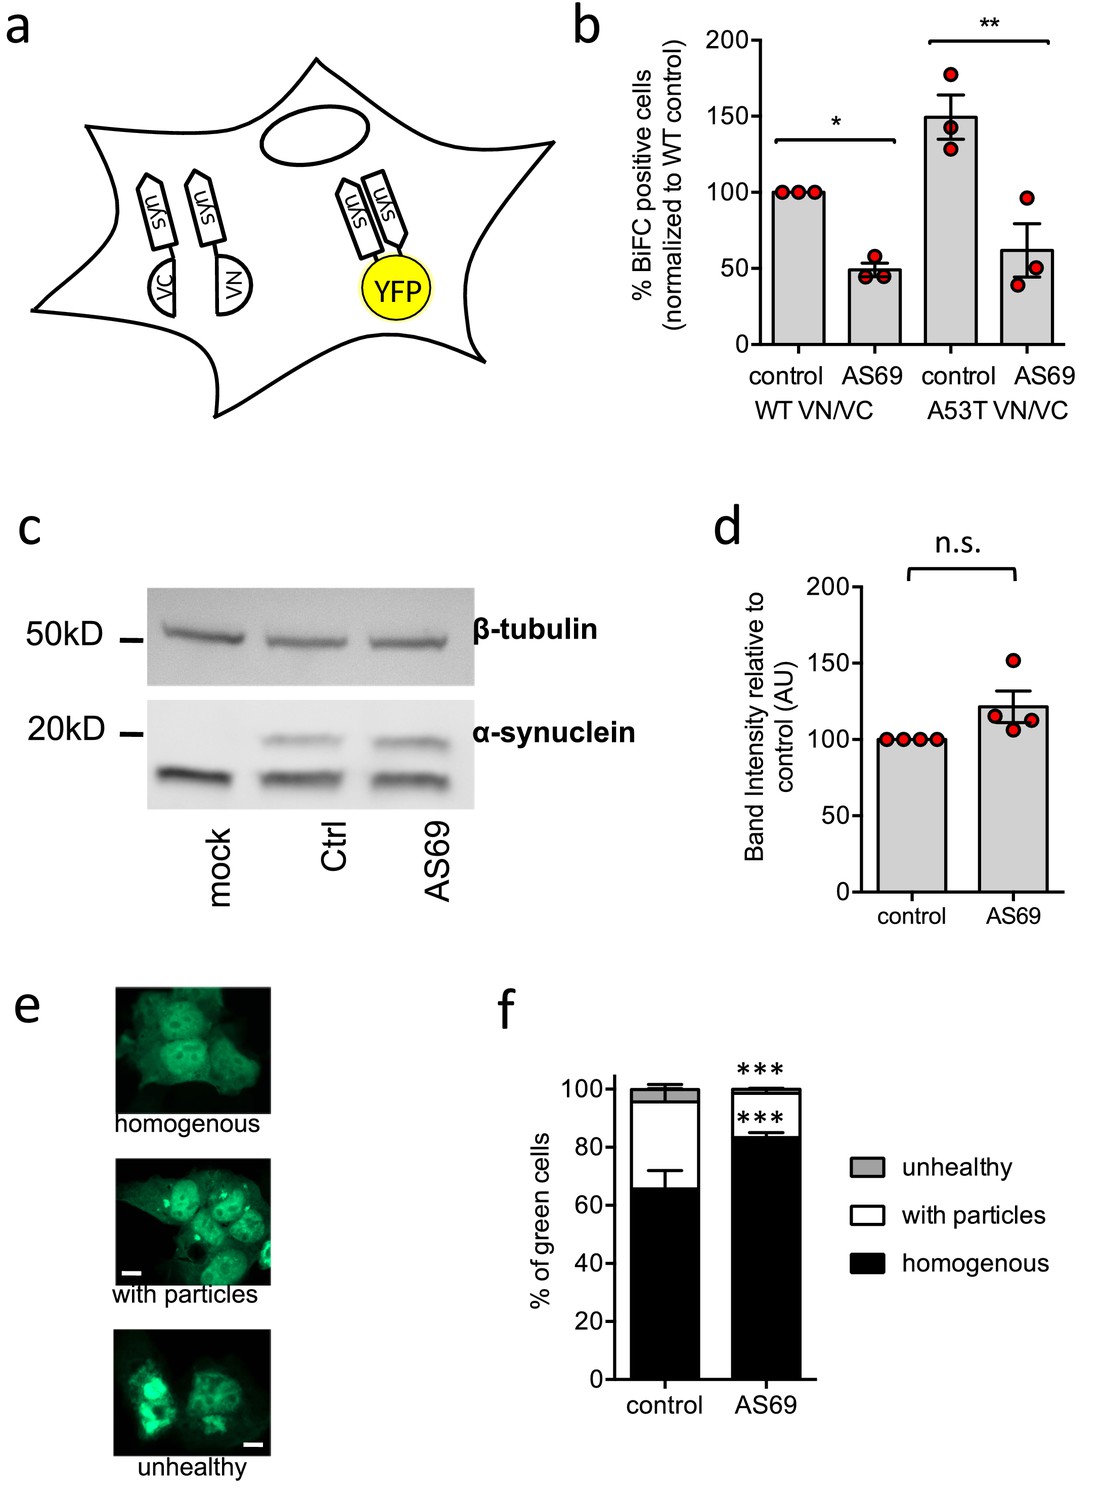
AS69 reduces aggregation of -synuclein in cellular models.
(a) Schematic representation of bimolecular fluorescence complementation where -synuclein is tagged by either the C-terminal (VC) or the N-terminal (VN) fragment of the Venus protein. In dimers or larger oligomers of -synuclein, the two Venus fragments can form a functional fluorescent protein. (b) The percentage of cells with BiFC fluorescence as determined by flow cytometry. HEK293T cells were transfected with -synuclein (WT or A53T), fused to the VN or VC fragment and either LacZ (control) or AS69. Displayed are the results of n = 3 independent experiments and mean ± SEM. In each experiment, 75,000 cells were analyzed per group. Results were compared by one-way ANOVA, results of Sidak’s posthoc test depicted. (c) Immunoblot of lysates of cells transfected with EGFP-tagged -synuclein and, in addition, AS69 or LacZ (control), developed with antibodies against -synuclein (band just below 20 kDa, note that only the upper band reports -synuclein, Dinter et al., 2016) and -tubulin (band just below 50 kDa), the latter as a loading control. (d) Quantification of n = 4 independent blots as described in (c). Results were compared by t-test. (e) HEK293T cells were transfected with EGFP-tagged -synuclein and the distribution of fluorescence was classified into the depicted groups. (f) Summarized results of n = 3 independent experiments with n = 300 cells classified per group in each experiment (mean ± SEM). Results were compared by two-way ANOVA and Sidak’s posthoc test.
-
Figure 2—source data 1
Raw cell counts of cells from the three independent experiments shown in Figure 2b.
The data can be found under the following link: https://osf.io/qs2yf/.
- https://cdn.elifesciences.org/articles/46112/elife-46112-fig2-data1-v4.xls
Figure 2—figure supplement 1
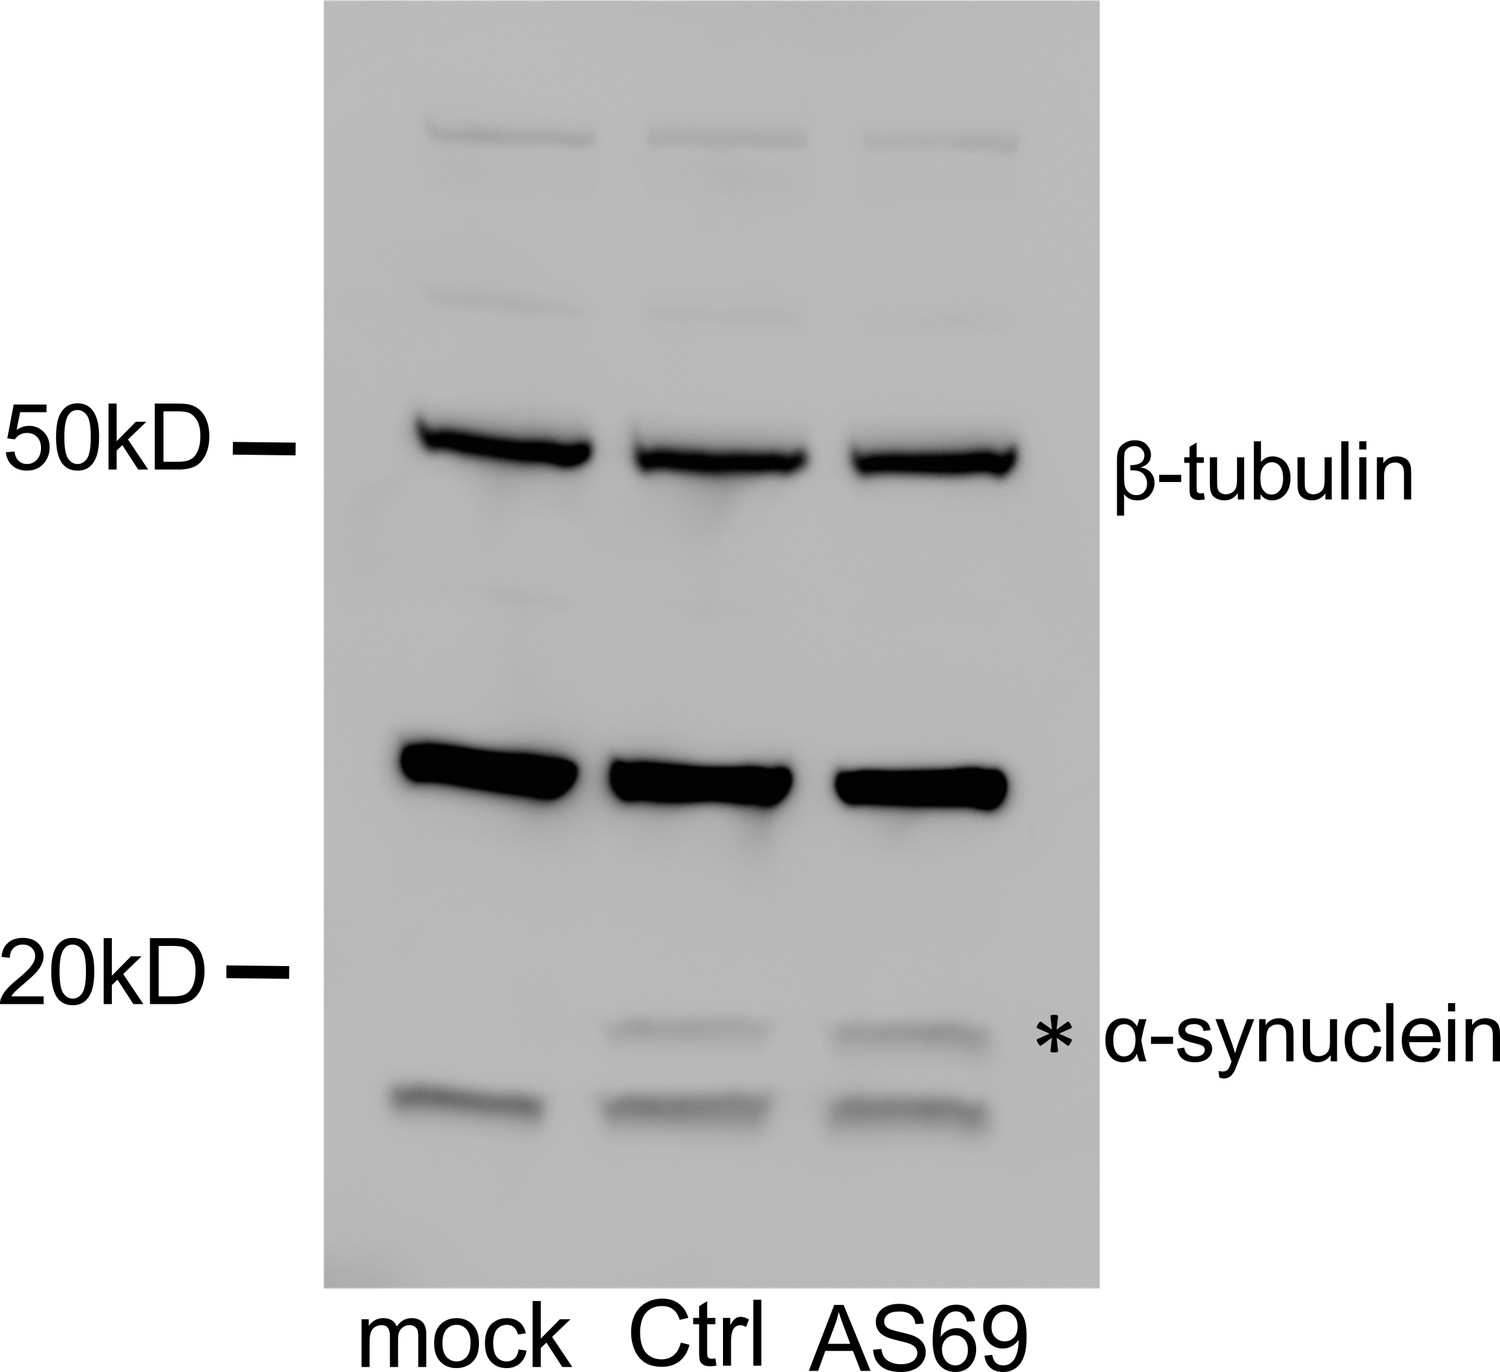
Complete Western blot (Figure 2c) from cell culture lysates showing the loading control with -tubulin at 50 kD, two nonspecific bands visible also in mock transfected cells, that is without -synuclein expression, and one specific band just below 20 kD (*).
Figure 3
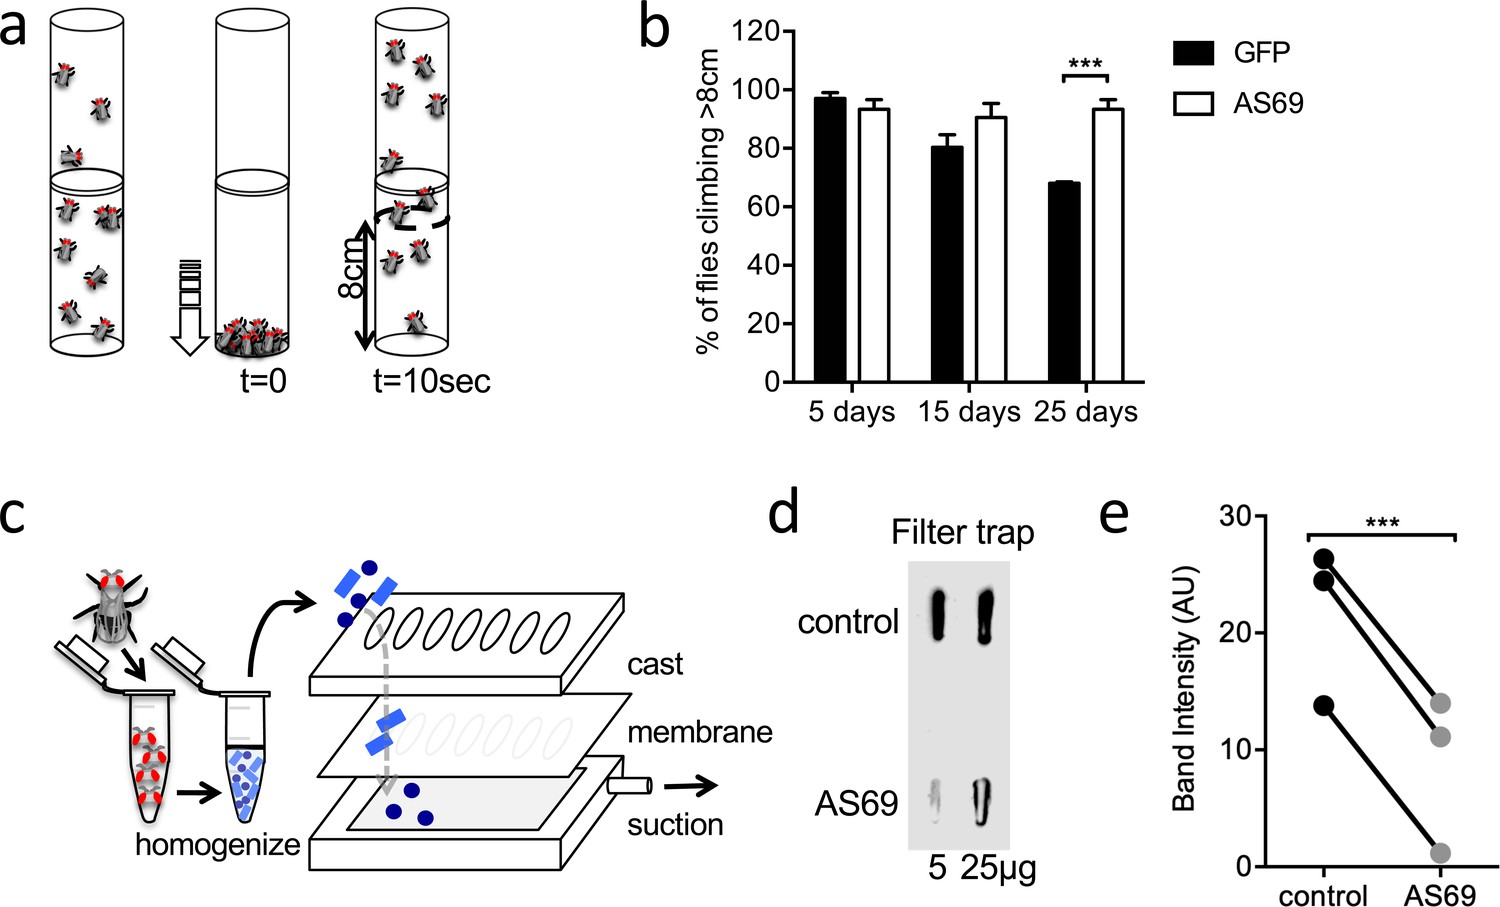
AS69 rescues the motor phenotype and reduces -synuclein aggregation in Drosophila melanogaster.
(a) Schematic representation of the climbing assay. The vials are tapped to move the flies to the base of the vial, and thereafter the flies climb towards the top of the vial; in this experiment the number of flies climbing 8 cm in 10 s was determined. (b) Performance in the climbing assay of Drosophila melanogaster expressing A53T--synuclein and either AS69 or GFP in neurons. At each time point, n = 30 flies were assayed per genotype; similar findings were observed for eight different lines expressing AS69. Results were compared by two-way ANOVA and Sidak’s posthoc test. (c) Schematic representation of the filter trap assay in which aggregates in the protein lysate are retained by a membrane, which is subsequently developed in the same manner as an immunoblot. (d) Results of the filter trap assay from lysates of control flies and flies expressing AS69 in addition to A53T--synuclein in all neurons. Two different quantities of the protein lysate were applied in each case, 5 and 25 μg. (e) Summary of the quantification of n = 3 dot blots as in (d). Only the 25 μg band was quantified. Results were compared by t-test.
Figure 4 with 2 supplements
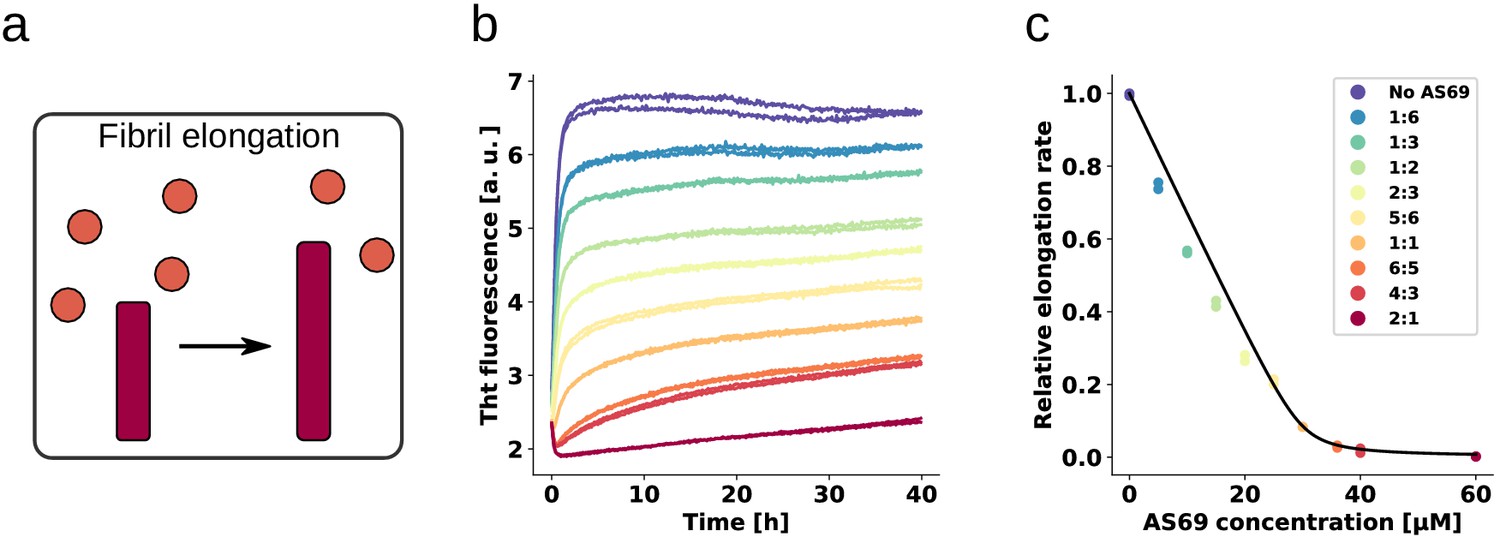
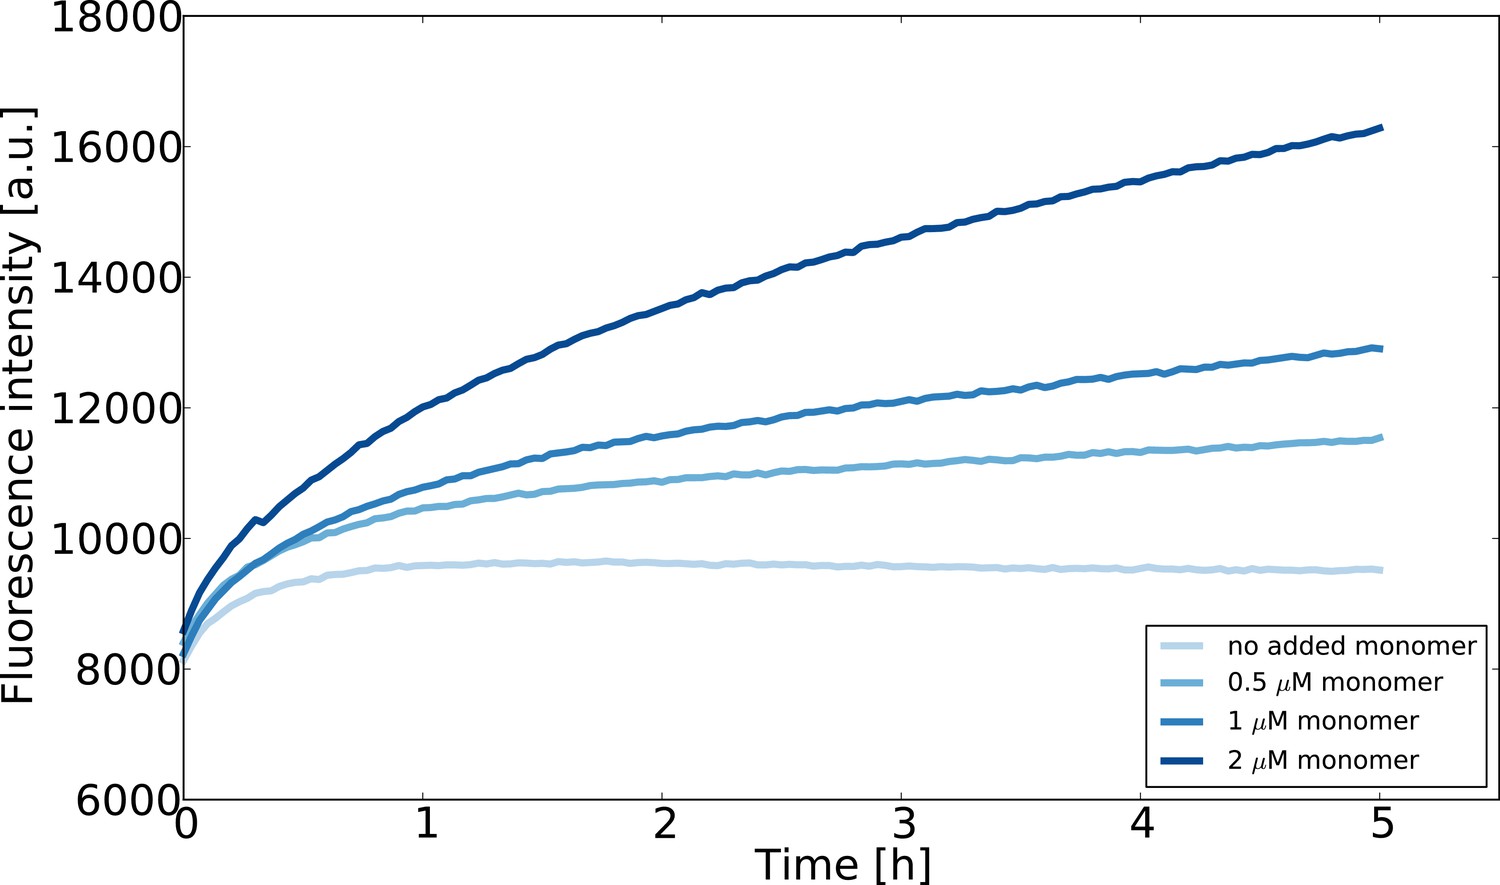
AS69 inhibits -synuclein fibril elongation.
(a) Schematic representations of fibril elongation. (b) Change in ThT fluorescence when a 30 μM solution of monomeric -synuclein was incubated in the presence of 5 μM pre-formed fibrils under quiescent conditions with increasing concentrations of AS69. (c) Relative rates of fibril elongation with increasing concentrations of AS69. The solid line corresponds to a prediction based on the affinity of AS69 for monomeric -synuclein (240 nM, Figure 1b [Mirecka et al., 2014], see Appendix 1 for details).
Figure 4—figure supplement 1
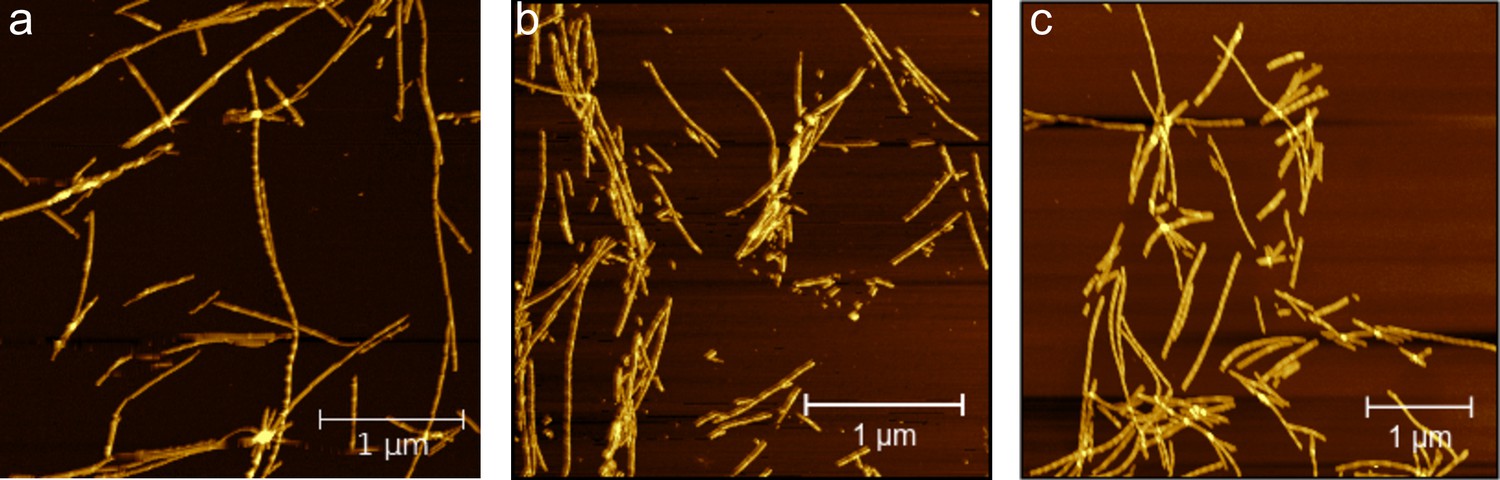
Characterisation of -synuclein fibrils formed in the presence and absence of AS69 by AFM.
AFM images of 30 μM monomeric -synuclein incubated with 5 μM pre-formed fibrils, (a) in the absence or (b) presence of 3 μM AS69, or (c) 30 μM AS69 in 20 mM phosphate buffer at pH 6.5 under quiescent conditions at 37°C for 24 h.
Figure 4—figure supplement 2
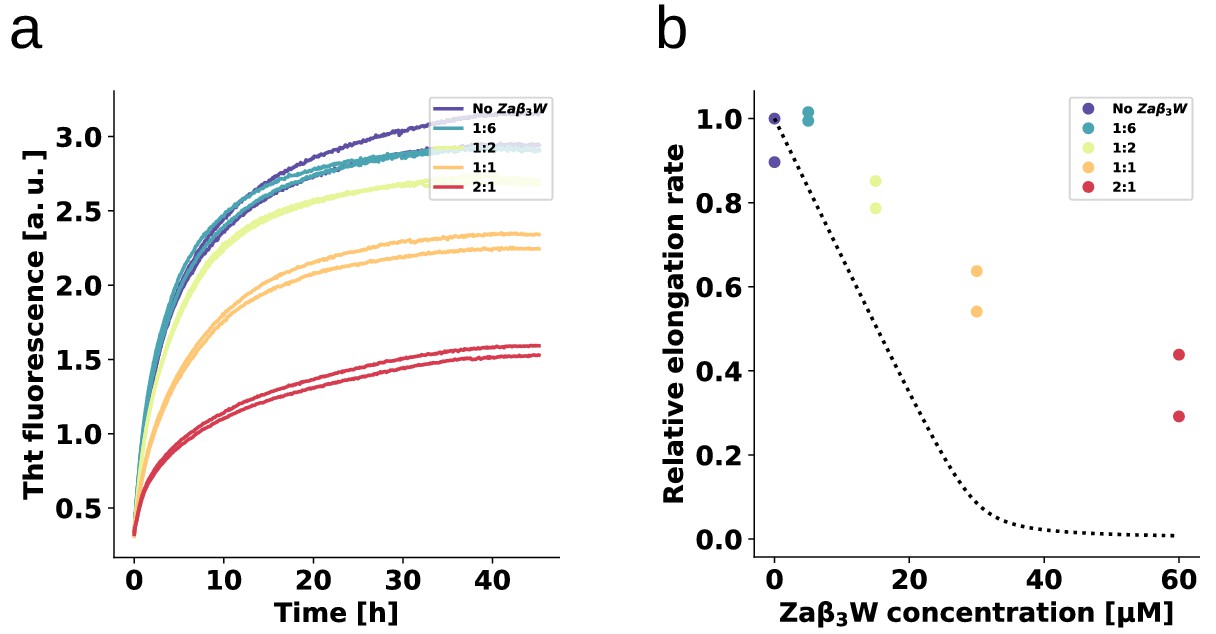
Binding specificity determines the inhibitory activity.
The fibril elongation assay was repeated for ZAW, a binding protein for amyloid- peptide (Grüning et al., 2013) that is a significantly weaker -synuclein binder than AS69. The absence of detectable heat of binding in ITC allows only an estimate to be made for a minimal Kd of the ZAW--synuclein interaction in the order of 10 μM (Mirecka et al., 2014). (a) Change in ThT fluorescence when a 30 μM solution of monomeric -synuclein was incubated in the presence of 5 μM pre-formed fibrils under quiescent conditions with increasing concentrations of ZAW. (b) Relative rates of fibril elongation with increasing concentrations of ZAW. For comparison to AS69, the dotted line corresponds to the solid line in Figure 4c.
Figure 5
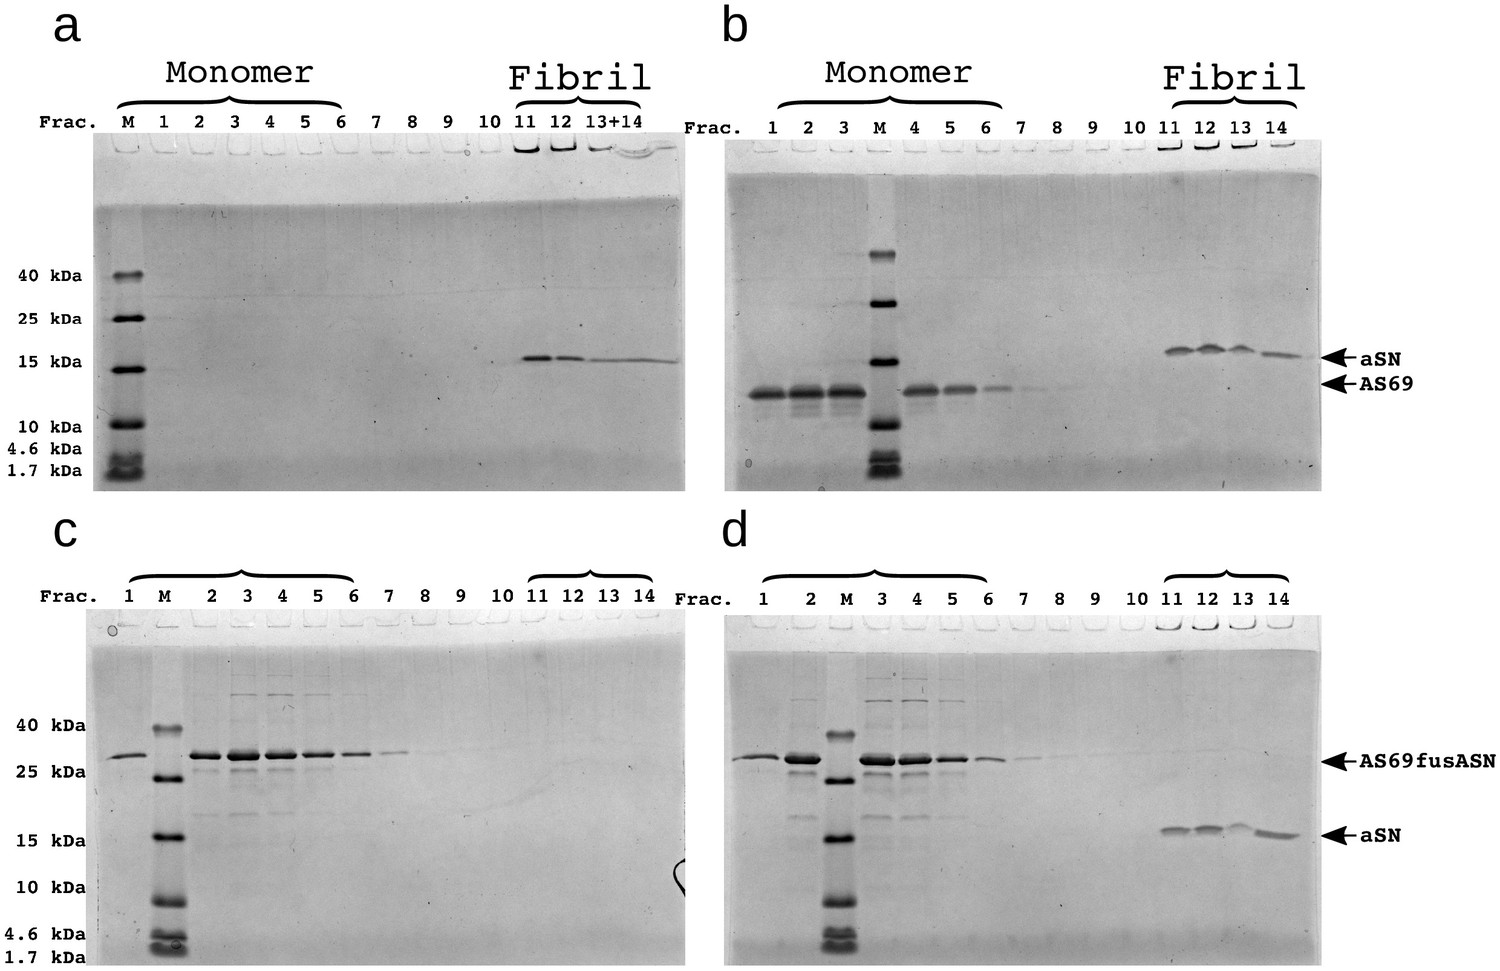
SDS-PAGE of density gradient centrifugation (DGC) experiments to probe the binding of AS69 to -synuclein fibrils at pH 7.4 after elongation experiments.
(a) 25 μM seeds, (b) 25 μM AS69 and 25 μM seeds, (c) 16.7 μM AS69fusASN, (d) 25 μM AS69fusASN and 25 μM seeds.
Figure 6 with 3 supplements
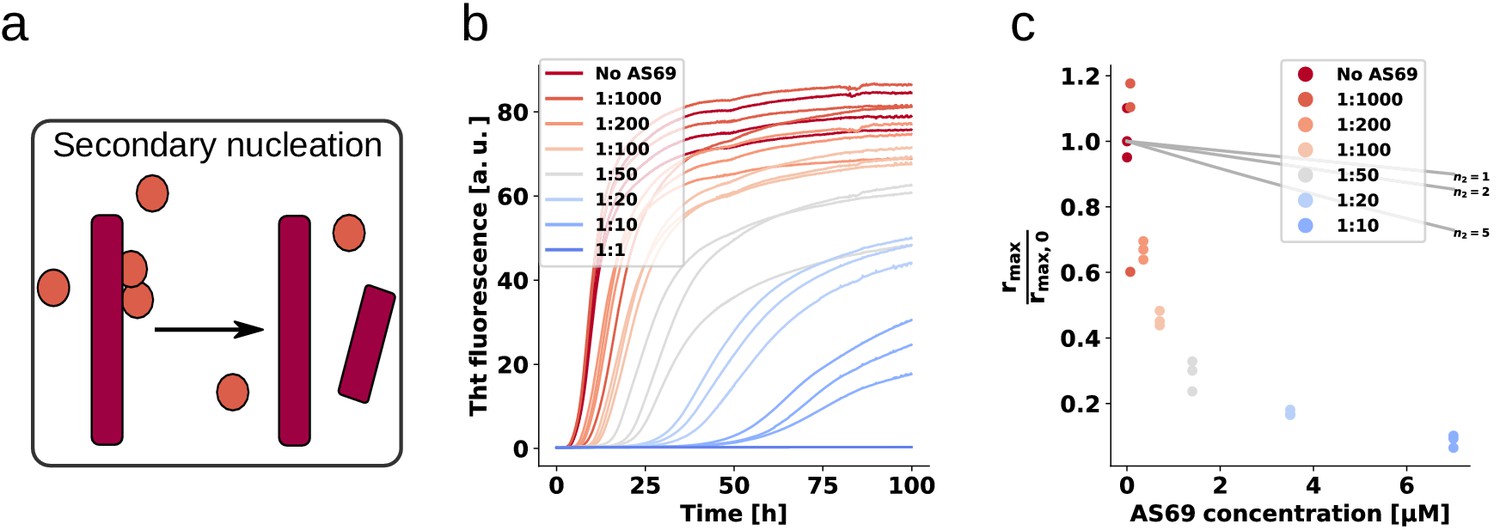
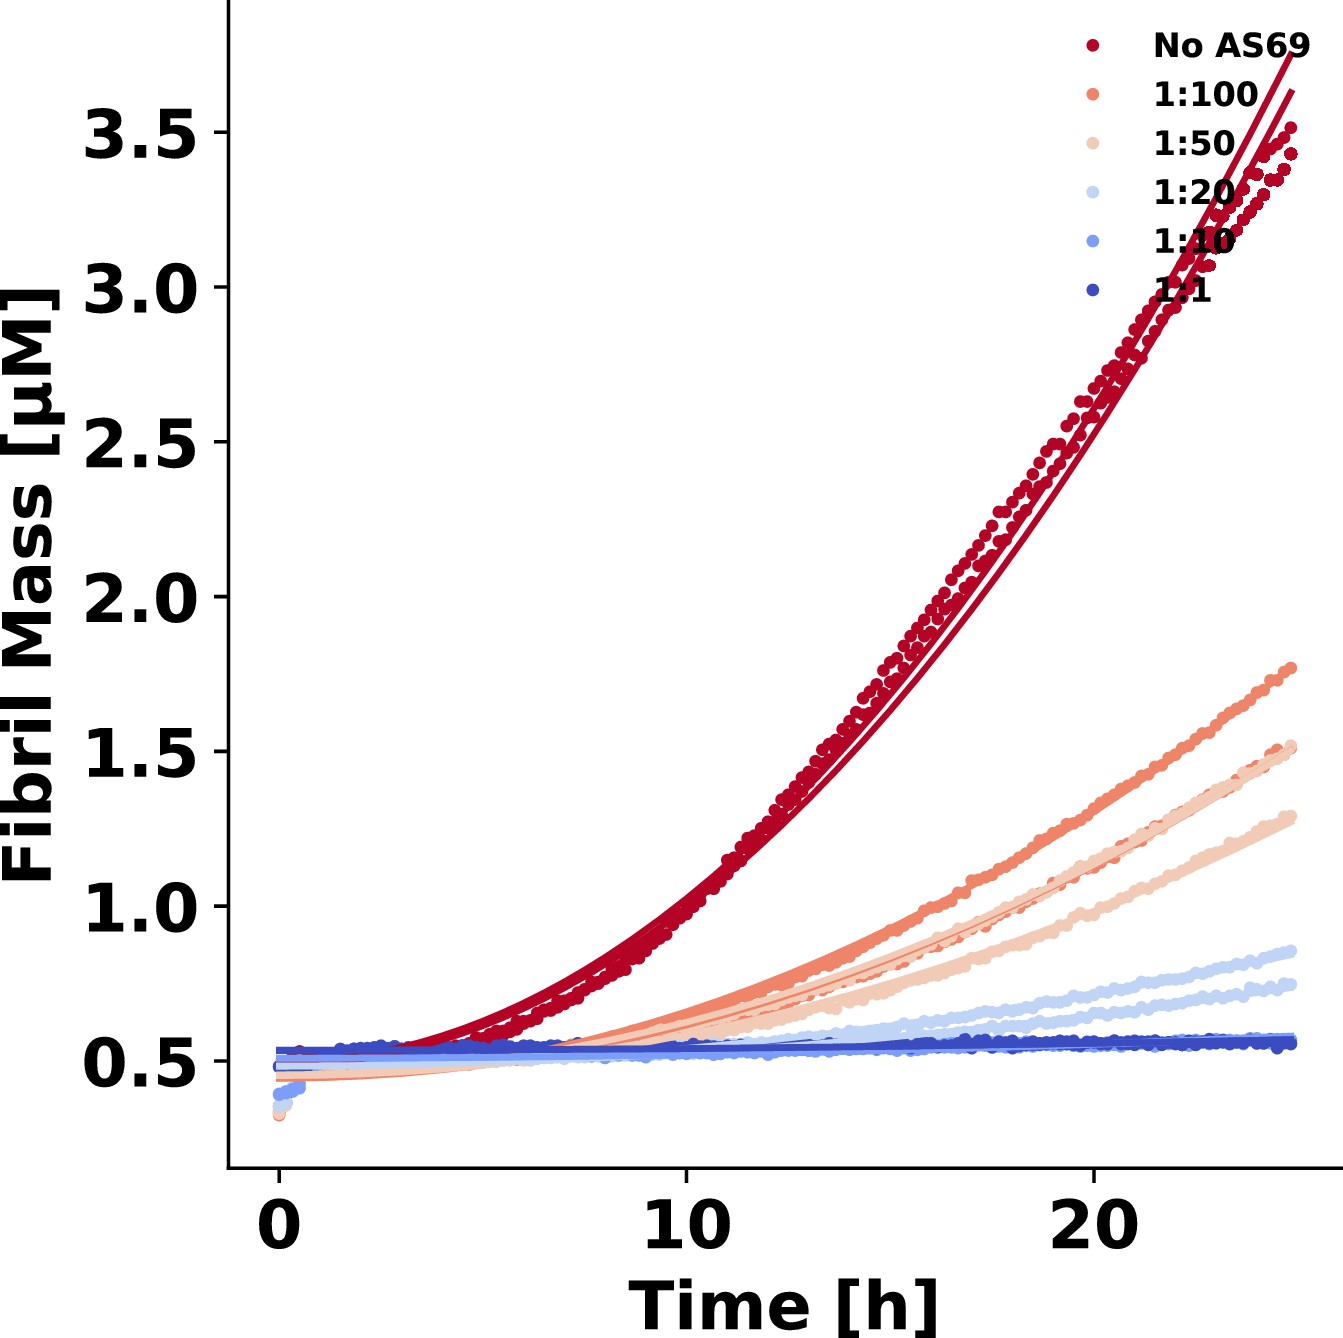
AS69 inhibits -synuclein fibril amplification.
(a) Schematic representation of fibril amplification through secondary nucleation Buell et al. (2014a). (b) Change in ThT fluorescence intensity when a 70 μM solution of monomeric -synuclein was incubated with increasing concentrations of AS69 in acetate buffer (pH 5.0) under quiescent conditions and weak seeding. (c) Relative rate of fibril amplification as a function of the concentration of AS69. The solid lines correspond to simulations based on the assumption that AS69 acts only through monomer sequestration, for different values of the monomer dependence (reaction order) of secondary nucleation (see Appendix 2 for details).
Figure 6—figure supplement 1
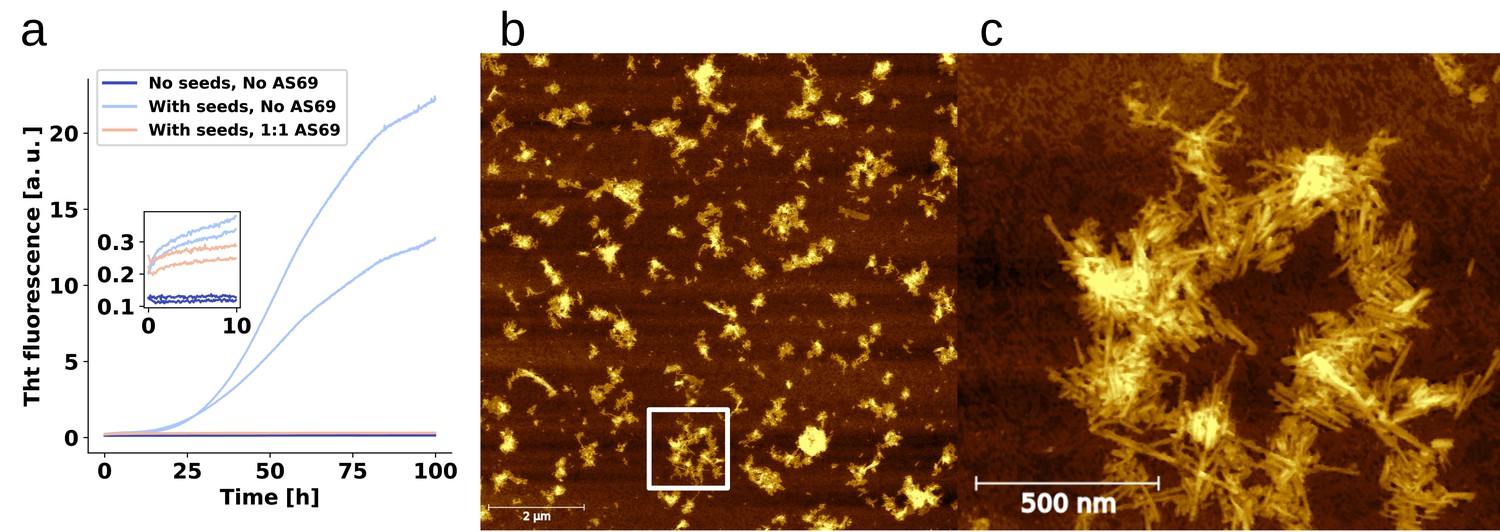
Seeds are required for aggregation under quiescent conditions.
(a) Change in ThT fluorescence intensity when a 70 μM solution of monomeric -synuclein was incubated either with or without pre-formed seeds, and with or without AS69 in acetate buffer (pH 5.0) under quiescent conditions. The inset shows the initial fluorescence intensity values. (b) AFM image of the seeds that were used for the experiment shown in (a), note the inhomogeneity in the dispersion of the fibrils, caused by the solution conditions that favour higher order assembly. The white square shows the approximate area of the zoom-in shown in (c).
Figure 6—figure supplement 2

Weakly seeded aggregation experiments at pH 5.0.
(a) Concentration of monomer left in solution after the weakly seeded experiments, as determined by the method described in Galvagnion et al. (2015). (b) The numerically computed first derivatives (using a ten point rolling average) of the weakly seeded kinetic time courses shown in Figure 6.
Figure 6—figure supplement 3
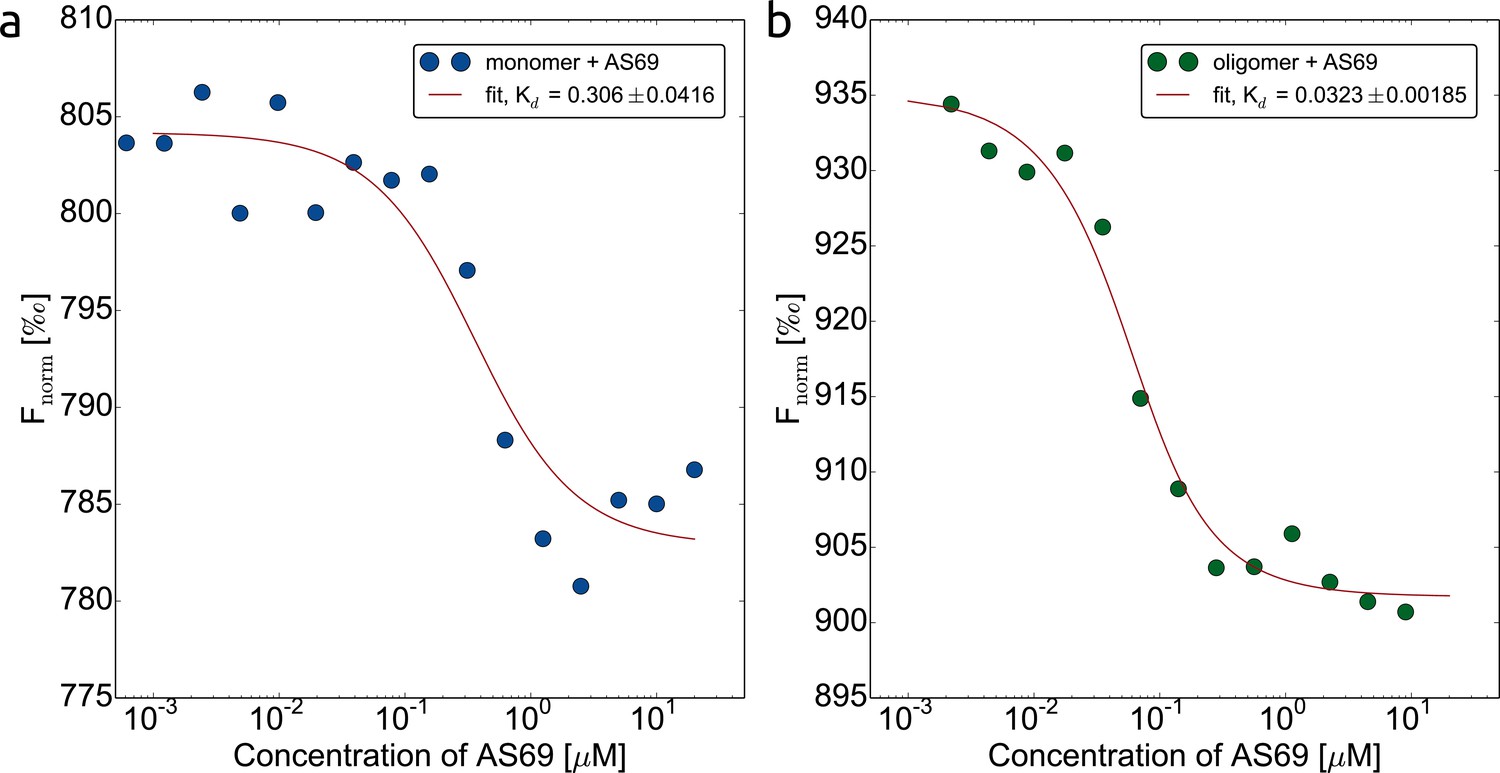
AS69 interacts with two distinct -synuclein species.
Binding of AS69 to monomeric (a) and oligomeric (Lorenzen et al., 2014) (b) -synuclein was quantified by microscale thermophoresis (MST) measurements (Wolff et al., 2016) in 20 mM phosphate buffer pH 7.4 and 50 mM NaCl. The oligomers used in this assay are kinetically stable and can be purified and studied in isolation (Lorenzen et al., 2014; Wolff et al., 2016). The preparation of labelled monomeric and oligomeric -synuclein is described in detail in the Materials and methods section.
Figure 7
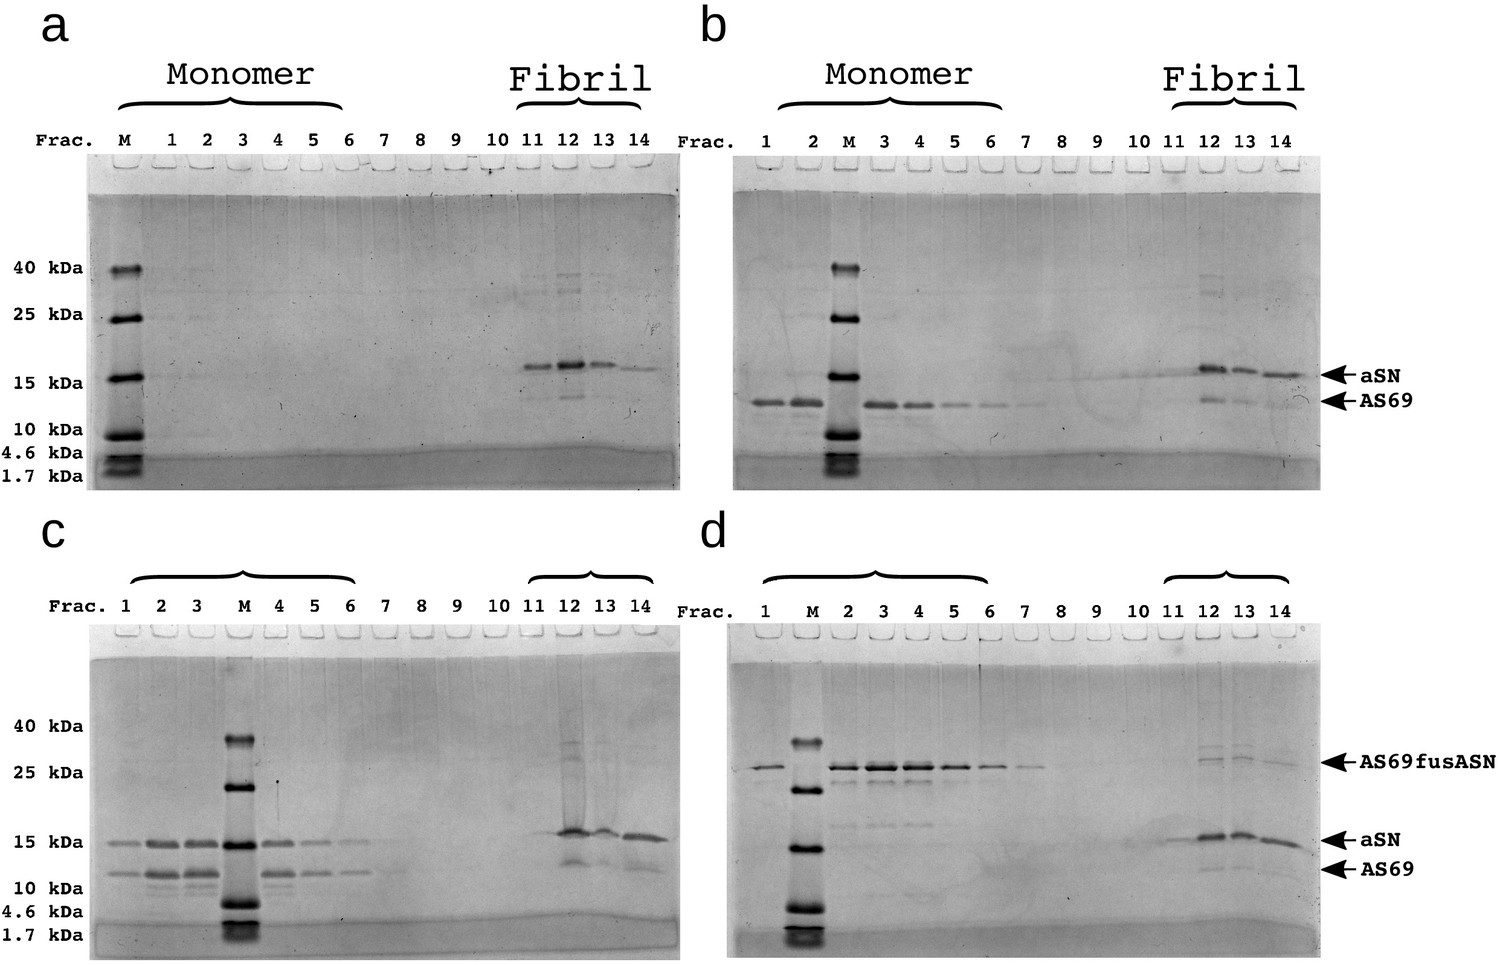
SDS-PAGE of density gradient centrifugation experiments to probe for binding of AS69 to fibril surfaces at pH 5.0.
(a) 12.5 μM seeds, (b) 12.5 μM AS69 and 12.5 μM seeds, (c) 12.5 μM AS69, 12.5 μM seeds and 12.5 μM monomer, and (d) 12.5 μM AS69fusASN and 12.5 μM seeds.
Figure 8 with 2 supplements
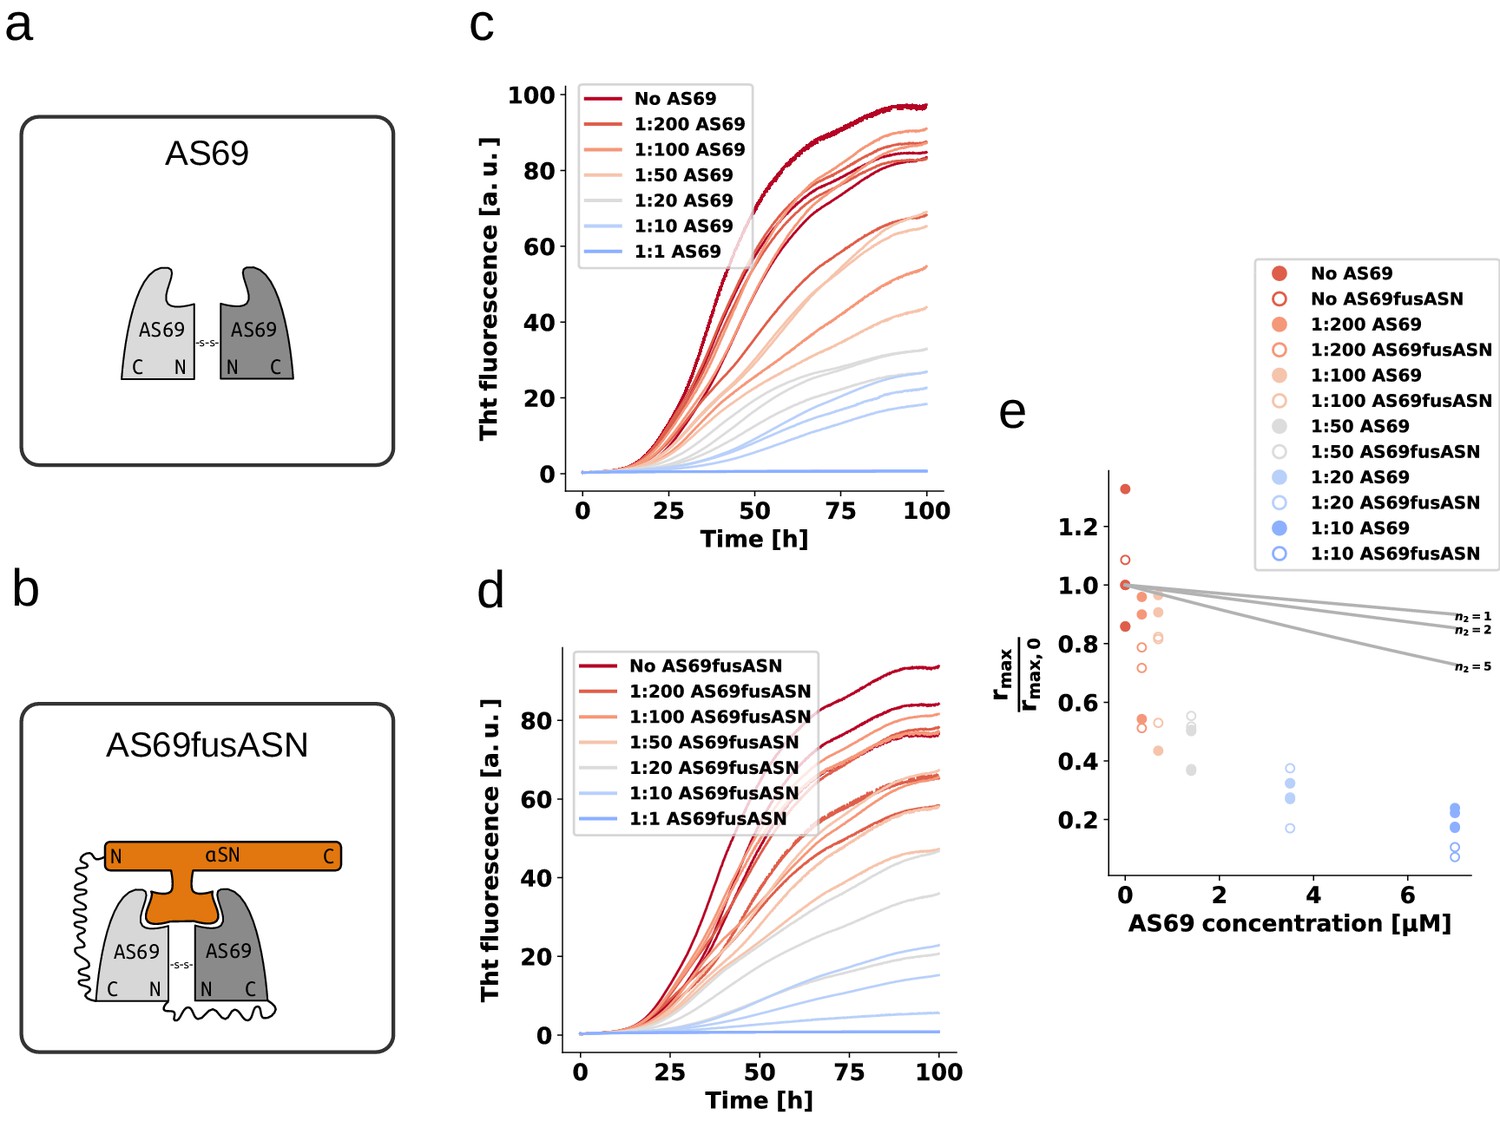
AS69 and AS69fusASN inhibit -synuclein fibril amplification to similar extent.
(a) and (b) Schematic representations of AS69 and AS69fusASN, respectively. (c), (d) Change in ThT fluorescence when a 70 μM solution of monomeric -synuclein was incubated with increasing concentrations of AS69 or AS69fusASN, respectively, in sodium acetate buffer (pH 5.0) under quiescent conditions. (e) Relative maximum rate of aggregation as a function of the concentration of AS69 (closed circles) and AS69fusASN (open circles). The solid lines correspond to simulations based on the assumption that AS69 acts only through monomer sequestration, for different values of the monomer dependence (reaction order) of secondary nucleation (see Appendix 2 for details).
Figure 8—figure supplement 1
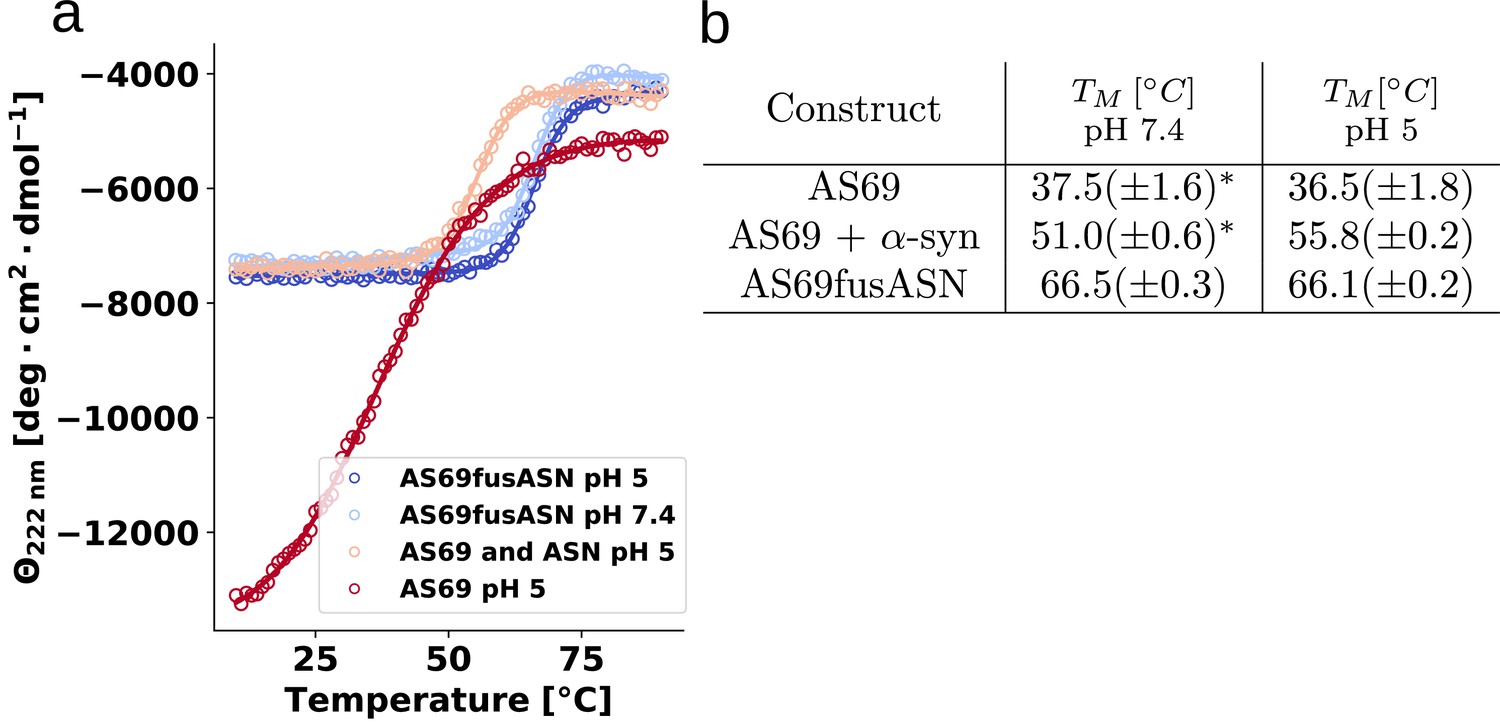
Determination of thermal stabilities of AS69 and its non-covalent and covalent complex with α-synuclein.
(a) Melting curves of 25 μM AS69, 25 μM AS69 + 25 μM -synuclein in 20 mM sodium acetate pH 5.0, and 25 μM AS69fusASN 20 mM sodium acetate pH 5.0, 17.5 μM AS69fusASN 20 mM phosphate buffer 50 mM NaCl pH 7.4.
Figure 8—figure supplement 2
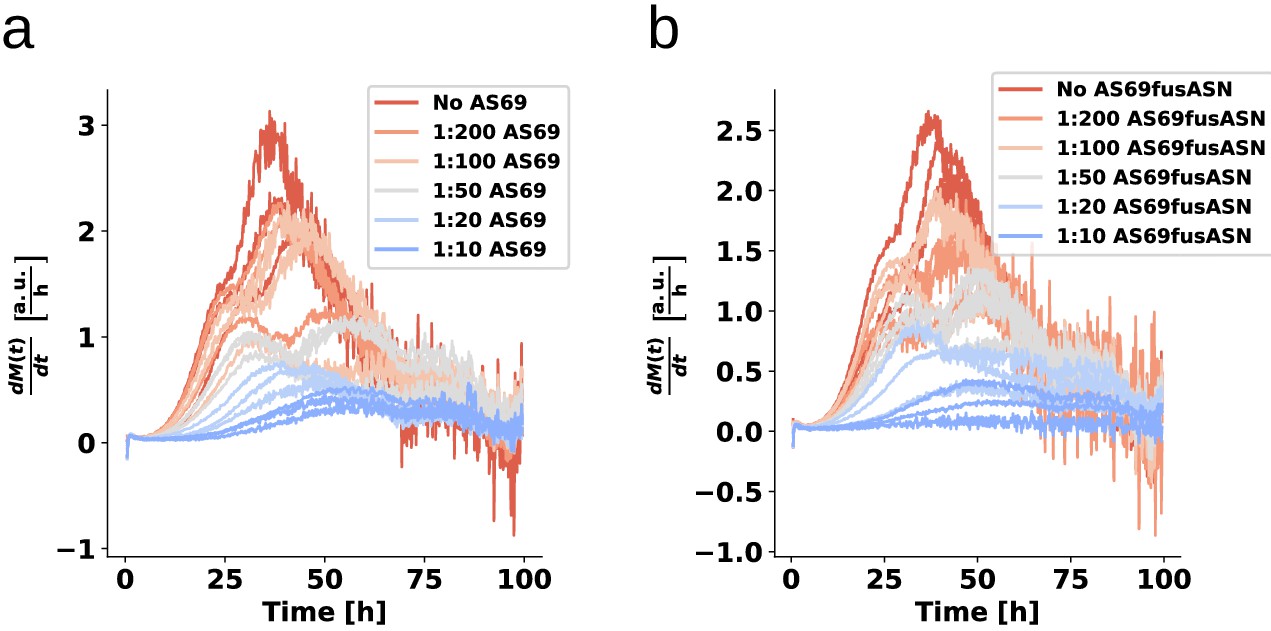
Weakly seeded aggregation experiments at mildly acidic pH 5.
Figure 9 with 2 supplements
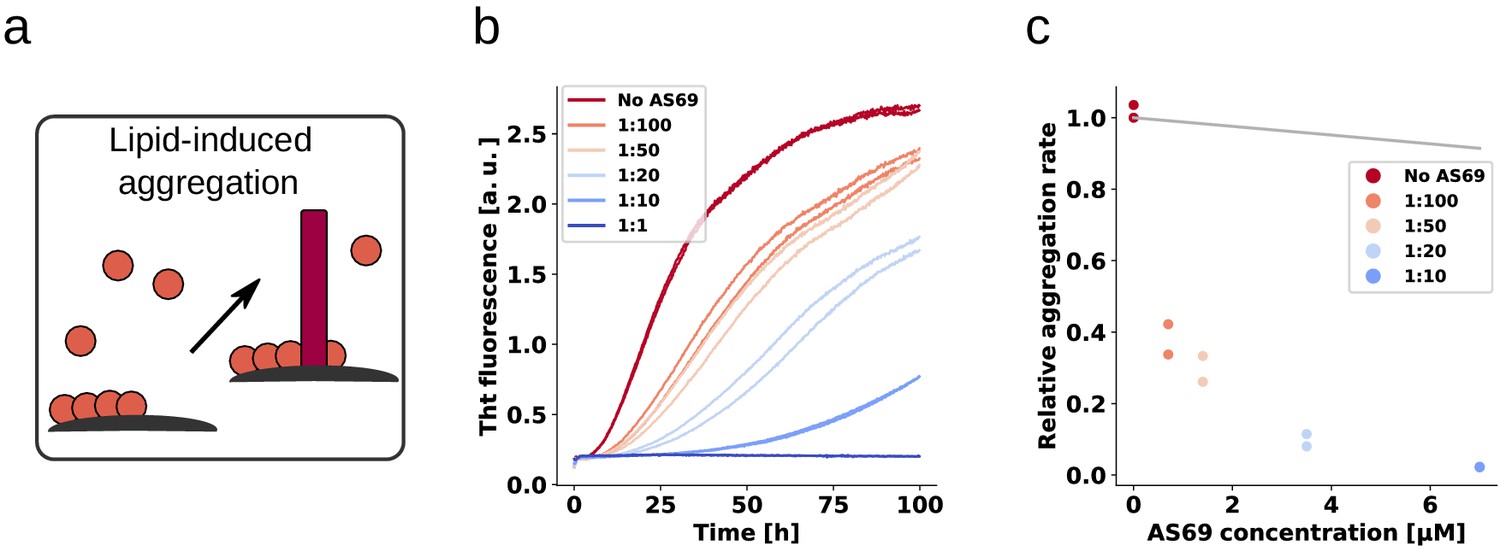
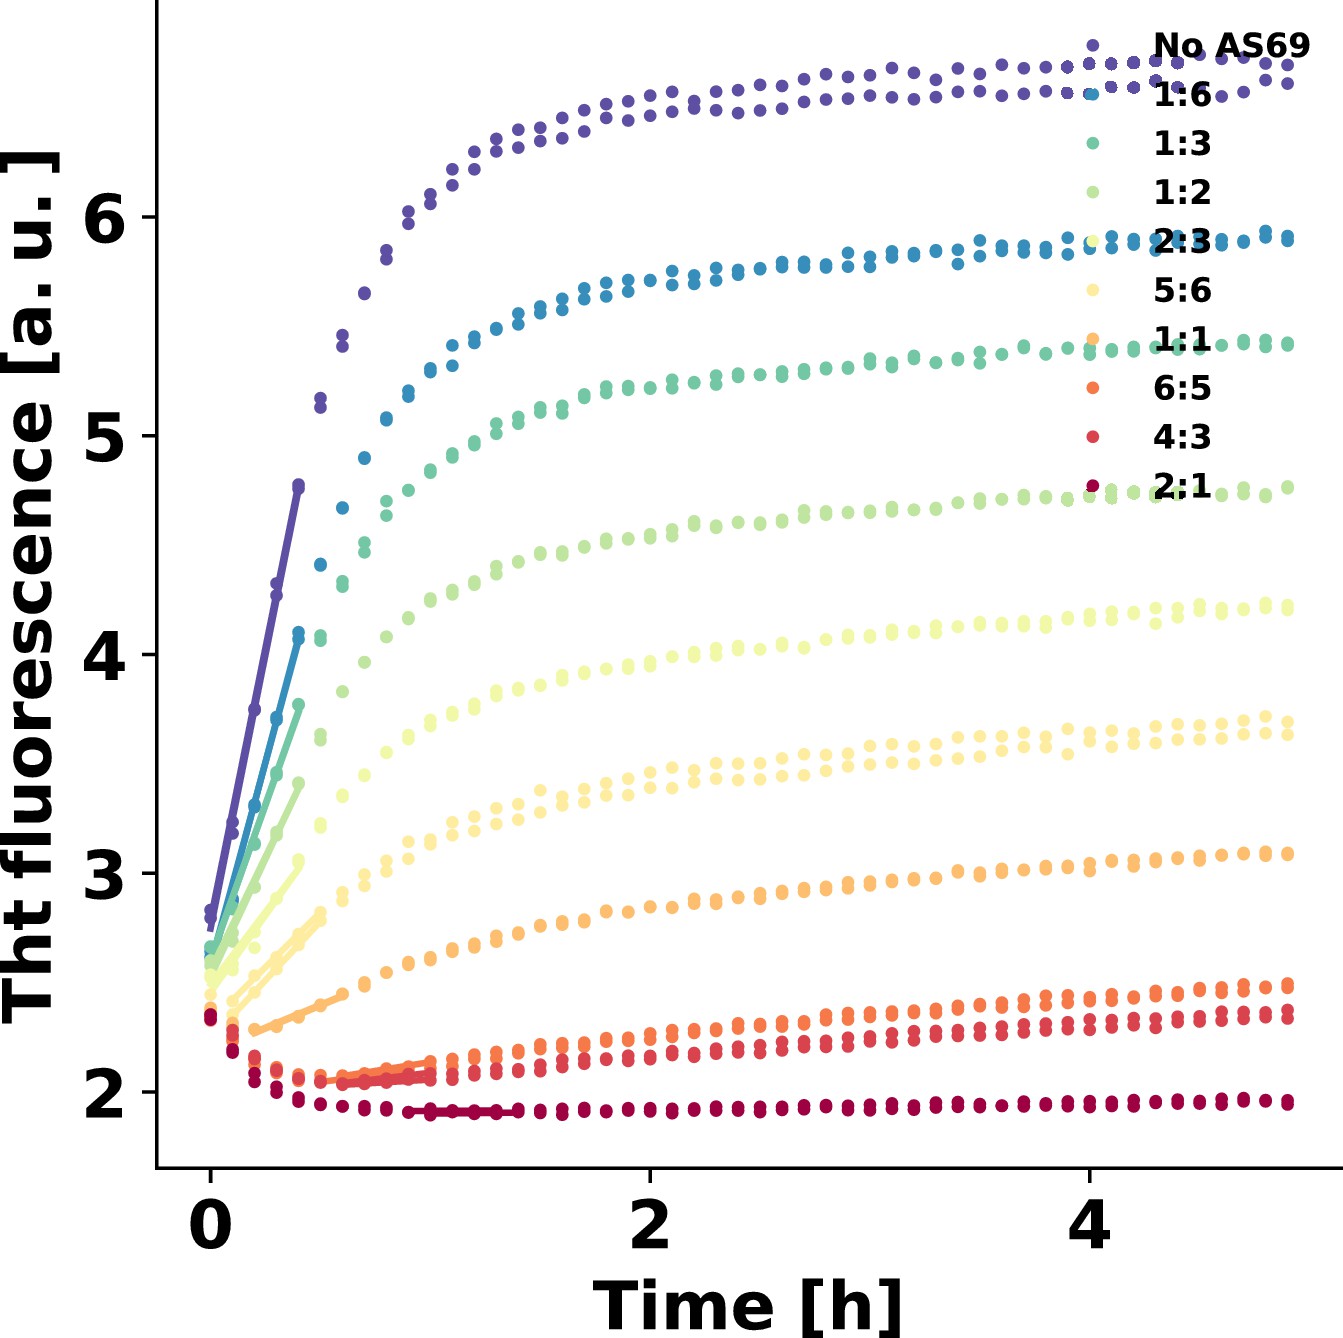
AS69 inhibits lipid-induced aggregation of α-synuclein.
(a) Schematic representation of lipid-induced aggregation (Galvagnion et al., 2015). (b) Change in ThT fluorescence intensity when a 70 μM solution of monomeric -synuclein was incubated with 100 μM DMPS-SUVs and increasing concentrations of AS69 in 20 mM phosphate buffer (pH 6.5) under quiescent conditions. (c) Relative rate of lipid-induced formation of -synuclein amyloid fibrils as a function of the concentration of AS69. The solid line corresponds to a simulation based on the assumption that AS69 acts only through monomer sequestration (see Appendix 3 for details).
Figure 9—figure supplement 1
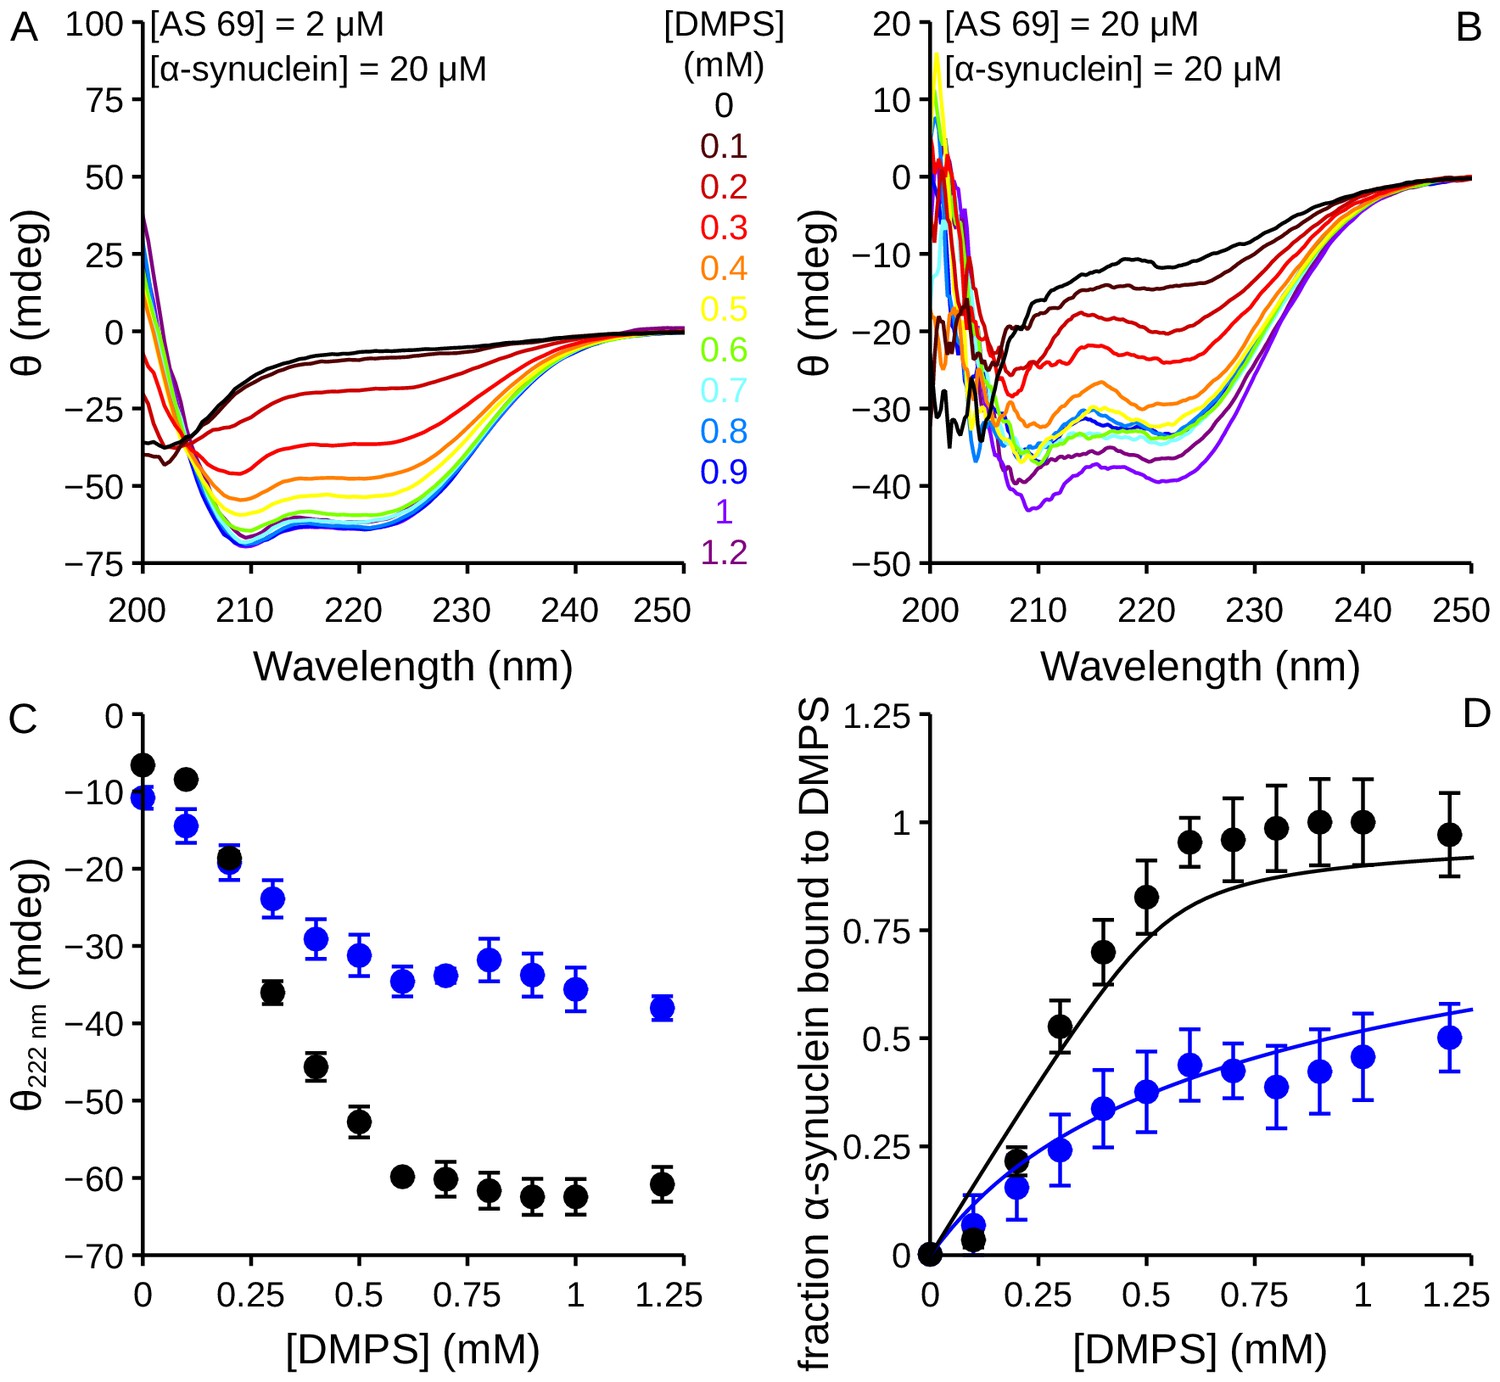
Influence of AS69 on the lipid-binding of -synuclein monitored using circular dichroism.
(a), (b) CD spectra of -synuclein (20 μM) in the presence of increasing concentrations of DMPS and 2 (a) or 20 (b) μM AS69. (c) Change in the CD signal of -synuclein measured at 222 nm when the protein was incubated in the presence of 2 (black dots) or 20 (blue dots) μM AS69 and increasing concentrations of DMPS. (d) Change in the fraction of -synuclein bound to DMPS vesicles in the presence of 2 (black dots) or 20 (blue dots) μM AS69. The solid lines correspond to predictions of the fraction of bound protein calculated using a competitive binding model with the binding constants previously determined for the systems DMPS:-synuclein (Galvagnion et al., 2015) and AS69:-synuclein (Mirecka et al., 2014).
Figure 9—figure supplement 2
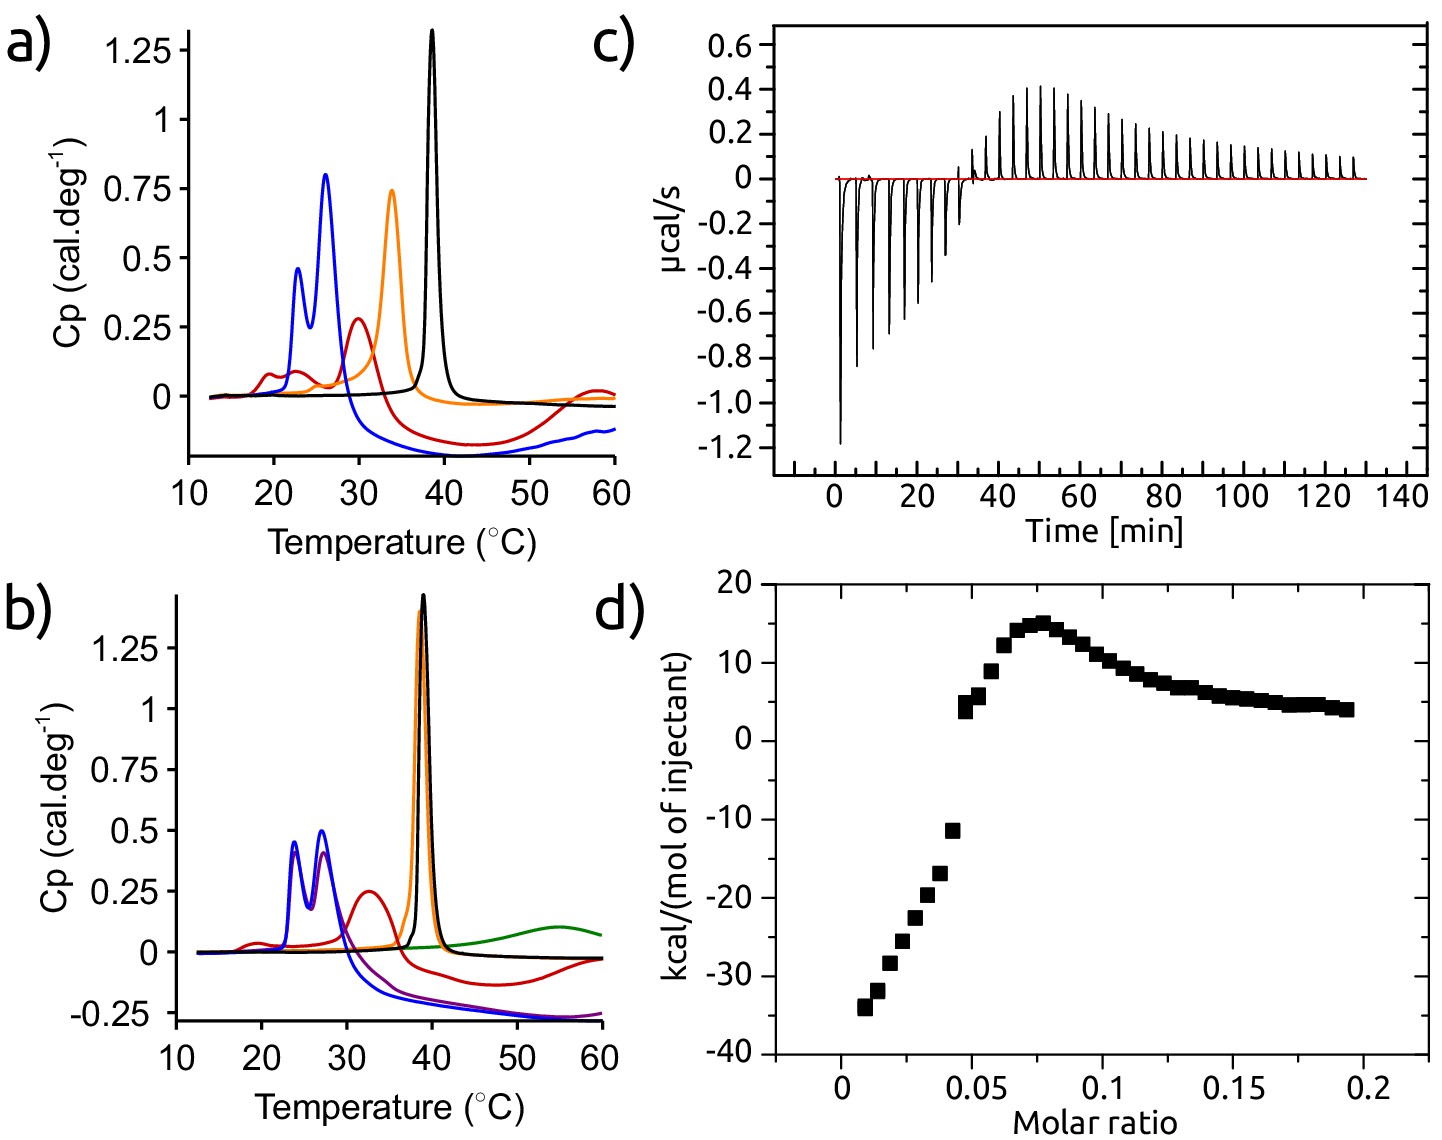
Calorimetric experiments designed to elucidate the molecular mechanism of inhibition of lipid-induced aggregation of -synuclein by AS69.
(a) DSC thermographs of 1 mM DMPS incubated in the absence (black) and the presence of 50 μM -synuclein (blue), 50 μM AS69 (orange) or 50 μM -synuclein and 50 μM AS69 (red). (b) Differential scanning calorimetry (DSC) thermographs of 1 mM DMPS incubated in the absence (black) or the presence of 33 μM -synuclein (blue), 33 μM -synuclein and 3.3 μM AS69 (purple), 33 μM -synuclein and 33 μM AS69 (red) or 3.3 μM AS69 (orange). The green curve corresponds to the DSC thermograph of the mixture 33 μM -synuclein and 33 μM AS69 (red). (c), (d) Isothermal titration calorimetry (ITC) experiments, in which a solution of 0.47 mM AS69 was titrated into 0.5 mM DMPS in 20 mM phosphate buffer pH 6.5 at 30°C, corresponding to the conditions under which the lipid-induced aggregation of -synuclein had been studied. These ITC experiments provide a direct confirmation of the binding of AS69 to lipid vesicles. The binding behaviour is complex and corresponds to more than one type of interaction. Therefore it is not straightforward to determine the binding affinity from these data.
Figure 10
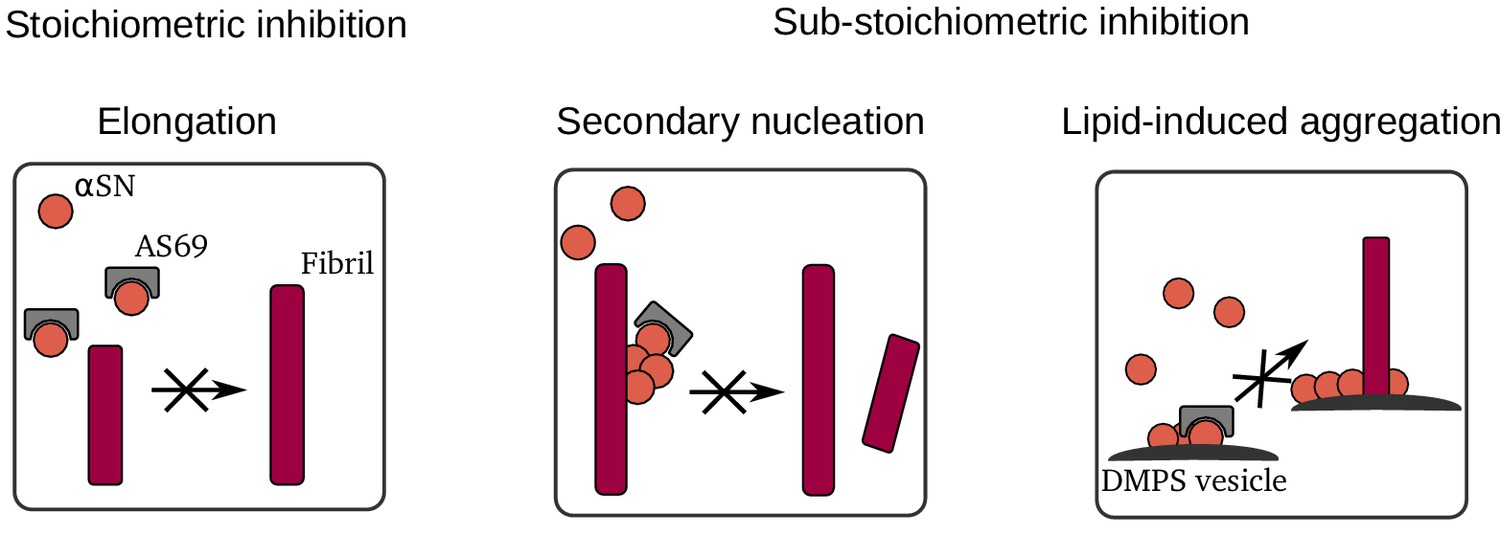
Summary of mechanisms by which AS69 inhibits amyloid fibril formation of -synuclein in vitro.
Appendix 1—figure 1
Linear fitting of the early times of strongly seeded aggregation kinetics.
Solid lines show the fits. These data were used to produce the plot in Figure 4c. At the highest inhibitor concentrations, the rates were so low that the temperature increase upon introduction of the plate into the platereader led to an initial decrease in fluorescence intensity. Therefore, the data was fitted once the fluorescence intensity had started to increase.
Appendix 1—figure 2
Seeded aggregation experiments at low monomer concentrations designed to estimate the concentration of monomeric -synuclein in equilibrium with fibrils.
The seed concentration is in all cases 0.75 μM and the ThT concentration is 10 μM. The experiment was performed at room temperature in order to slow the reaction down and avoid temperature effects on the fluorescence upon introduction of the multiwell plate into the fluorescence platereader.
Appendix 3—figure 1
Analysis of the inhibition of the lipid-induced aggregation of α-synuclein by AS69.
Tables
Table 1
Melting temperatures, Tm, obtained from fitting of CD melting curves in Figure 8—figure supplement 1.
*Data from Gauhar et al. (2014) was refitted to obtain the numerical values listed in the table.
| Construct | T [°C] at pH 7.4 | T [°C] at pH 5 |
|---|---|---|
| AS69 | 37.5(± 1.6)* | *36.5(± 1.8) |
| AS69 + -synuclein | 51.0(± 0.6)* | 55.8(± 0.2) |
| AS69fusASN | 66.5(± 0.3) | 66.1 (± 0.2) |
Additional files
Download links
A two-part list of links to download the article, or parts of the article, in various formats.
Downloads (link to download the article as PDF)
Open citations (links to open the citations from this article in various online reference manager services)
Cite this article (links to download the citations from this article in formats compatible with various reference manager tools)
An engineered monomer binding-protein for α-synuclein efficiently inhibits the proliferation of amyloid fibrils
eLife 8:e46112.
https://doi.org/10.7554/eLife.46112


