Notch signaling restricts FGF pathway activation in parapineal cells to promote their collective migration
- Université de Toulouse, CNRS (UMR 5547), France
Figures
Figure 1 with 3 supplements
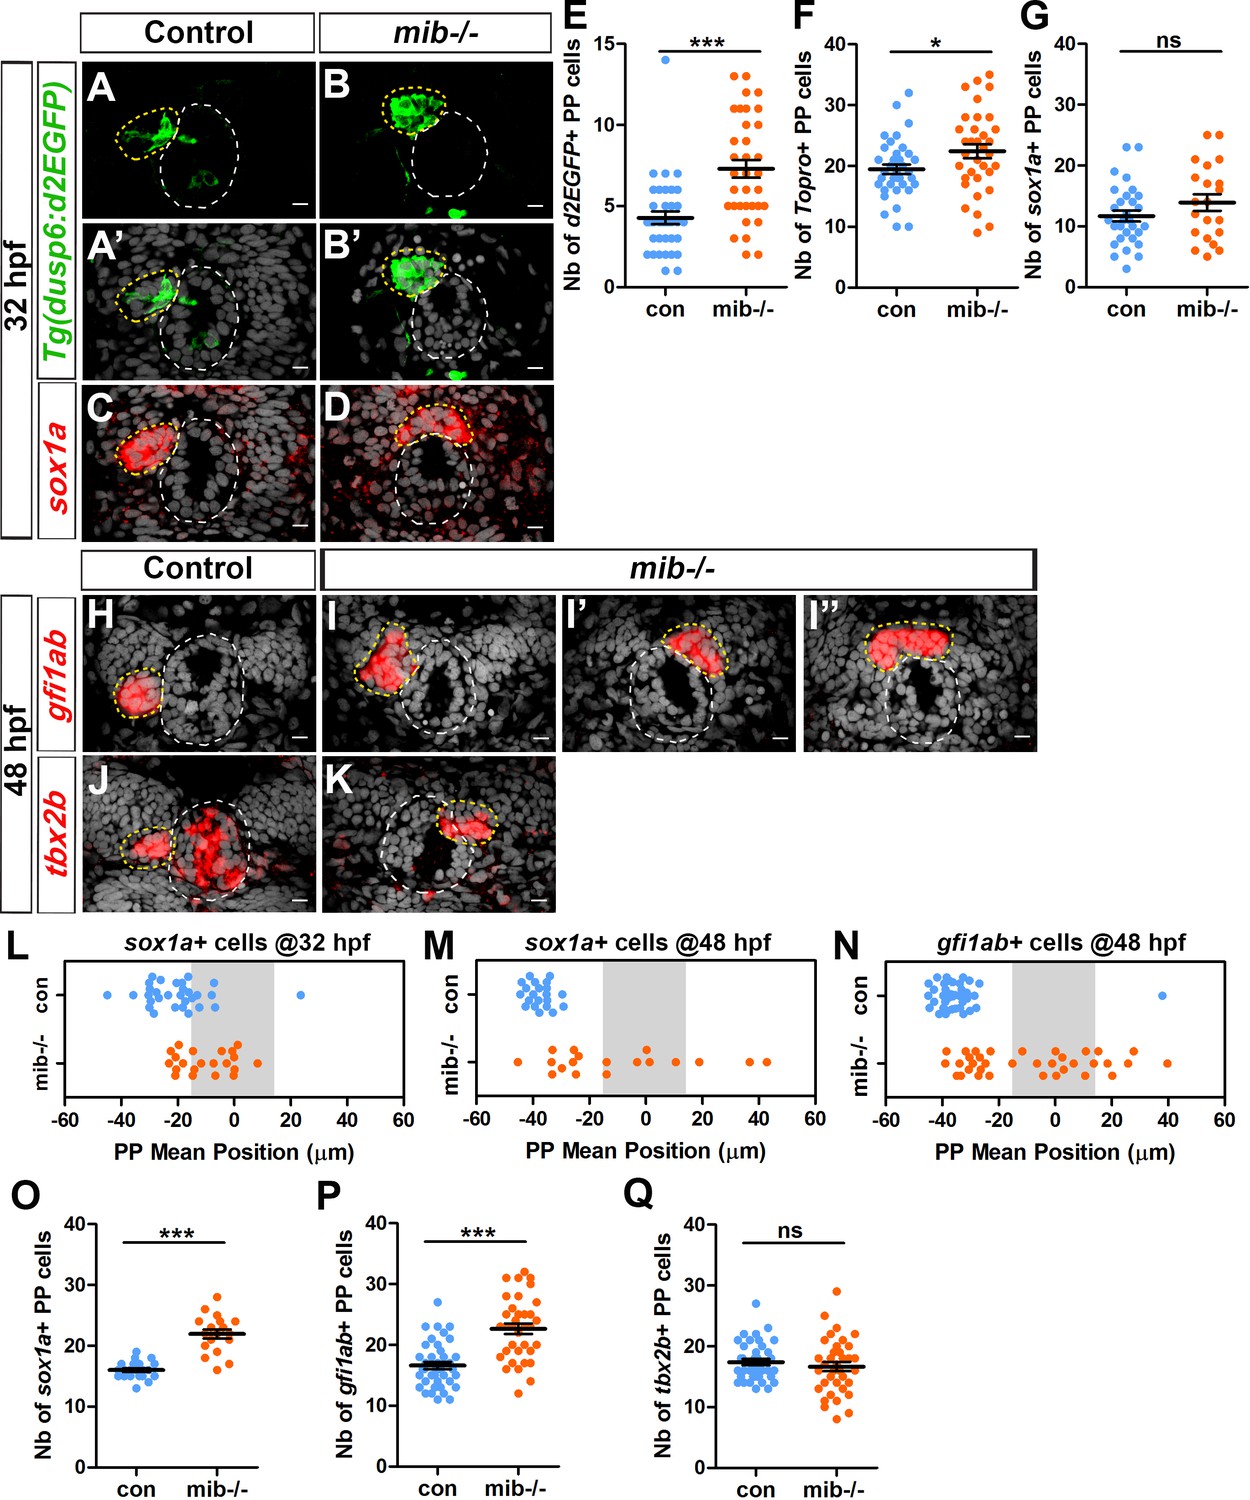
Increased activation of FGF signaling in mindbomb mutants correlates with defects in migration and specification of parapineal cells.
(A–D) Confocal sections showing the expression of the Tg(dusp6:d2EGFP) transgene (Green, (A–B’) or sox1a (red, (C–D) in the epithalamia of 32 hpf in control (A, A’, n = 36 and C, n = 30) and in mib-/- mutant embryos (B, B’, n = 34 and D, n = 21). Confocal sections are merged with a nuclear staining (gray, A’, B’, C, D) that makes the epiphysis (white circle) and parapineal (yellow circle) visible. Embryo view is dorsal, anterior is up; scale bar = 10 µm. (E–G) Dot plots showing the number (E–G) of Tg(dusp6:d2EGFP) (E), Topro-3 (F) and sox1a (G) positive parapineal cells in control (blue dots) or mib-/- mutant embryos (orange dots) at 32 hpf, with mean ± SEM. Tg(dusp6:d2EGFP) FGF reporter is expressed in more parapineal cells in mib-/- than controls (E; 7 ± 3 d2EGFP + cells in mib-/- mutant compared 4 ± 2 in siblings; p-value=3.845e-05, Welch t-test) while the expression of sox1a is similar in both contexts (G); the average number of parapineal cells counted with a nuclear marker increases slightly (F; 22 ± 7 in mib-/- mutants versus 19 ± 5 in sibling control embryos; p-value=0.037, Welch t-test). (H–I’’) Confocal sections showing the expression of gfi1ab (red) at 48 hpf in control embryos (H; n = 40) and in three examples of mib-/- mutant embryos (I-I’’; n = 35). (J–K) Confocal sections showing the expression of tbx2b (red) at 48 hpf in control embryos (J; n = 39) and in one example of mib-/- mutants embryo with the parapineal on the right (K; n = 36). (L–N) Dot plots showing the mean position of parapineal cells expressing sox1a at 32 hpf (L) sox1a at 48 hpf (M) or gfi1ab (N) (in µm distance to the brain midline (x = 0)) with each dot representing an embryo. Parapineal migration is usually delayed in mib-/- mutants at 32 hpf (L). At 48 hpf, the parapineal of mib-/- mutant embryos either did not migrate (n = 12/35 with a parapineal mean position between −15 µM and +15 µM (shaded zone) relative to brain midline (Reference 0)) or migrates either to the left (n = 17/35) or to the right (n = 6/35) (N, orange dots), while it usually migrated to the left in control embryos (N, n = 39/40, blue dots); p-value<0.0001, Welch t-test on absolute values. (O–Q) Number of parapineal cells expressing sox1a (O), gfi1ab (P) and tbx2b (Q) at 48 hpf in control (blue dots) or in mib-/- mutant embryos (orange dots). The number of sox1a and gfi1ab+ positive parapineal cells at 48 hpf is increased in mib-/- mutant embryos (p-value<0.0001 in Welch t-test) compared with controls (O, P) while the number of tbx2b expressing cells is unchanged (Q). Mean ± SEM are indicated as long and short bars. *** p-value<0.0001; * p-value<0.05 in Welch t-test. Data are representative of three experiments (H–I’’, N, P) or two independent experiments (A–G, J–M, O, Q). See also Figure 1—figure supplement 1, Figure 1—figure supplement 2 and Figure 1—figure supplement 3. Source files used for dot plots and statistical analysis are available in Figure 1—source data 1.
-
Figure 1—source data 1
Source files for data used to generate dot plots in Figure 1.
- https://doi.org/10.7554/eLife.46275.007
Figure 1—figure supplement 1
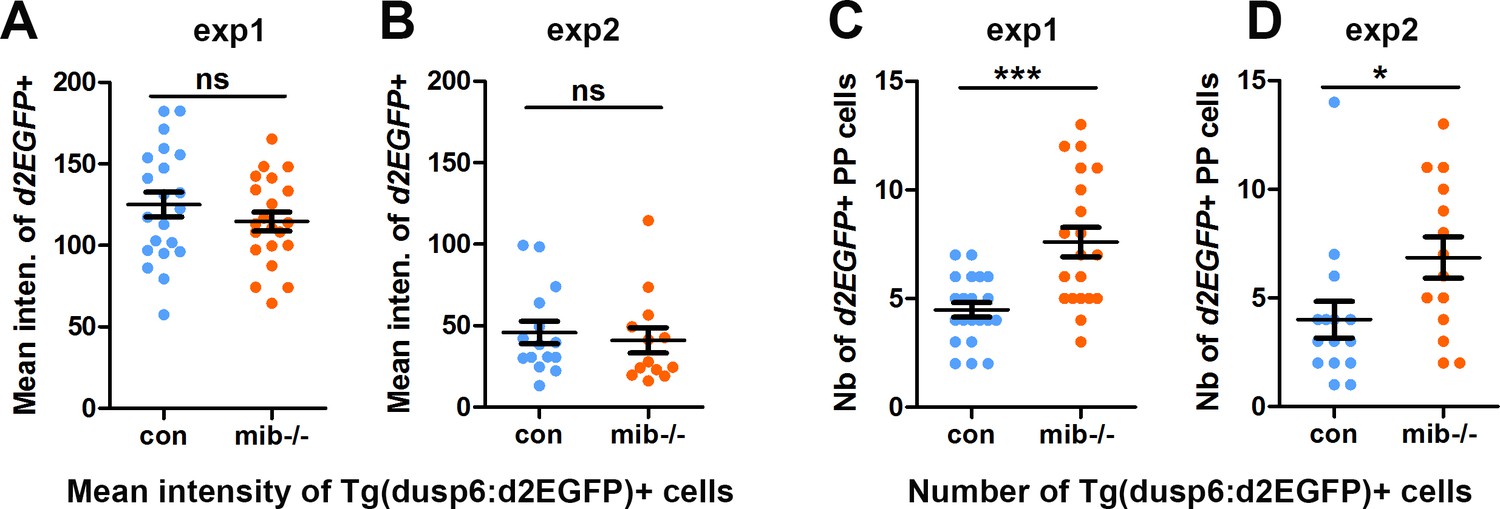
The number but not the mean intensity of Tg(dusp6:d2EGFP) expressing cells is increased in mib-/- mutants.
(A–B) Dot plots showing the mean GFP fluorescence intensity (A, B) of Tg(dusp6 :d2EGFP) expressing parapineal cells in the first (A) and second experiment (B) in controls (blue dots; A, n = 21; B, n = 15) or in mib-/- mutant embryos (orange dots; A, n = 21; B, n = 13) at 32 hpf stage; data are presented separately for the two experiments as the mean intensity threshold chosen to define Tg(dusp6 :d2EGFP)+ cells (See Materials and methods) differ between both experiments. (C–D) Dot plots showing the number of Tg(dusp6:d2EGFP) expressing parapineal cells in the first (C) and second experiment (D); merged data for both experiments are presented in the main manuscript as Figure 1E.
Figure 1—figure supplement 2
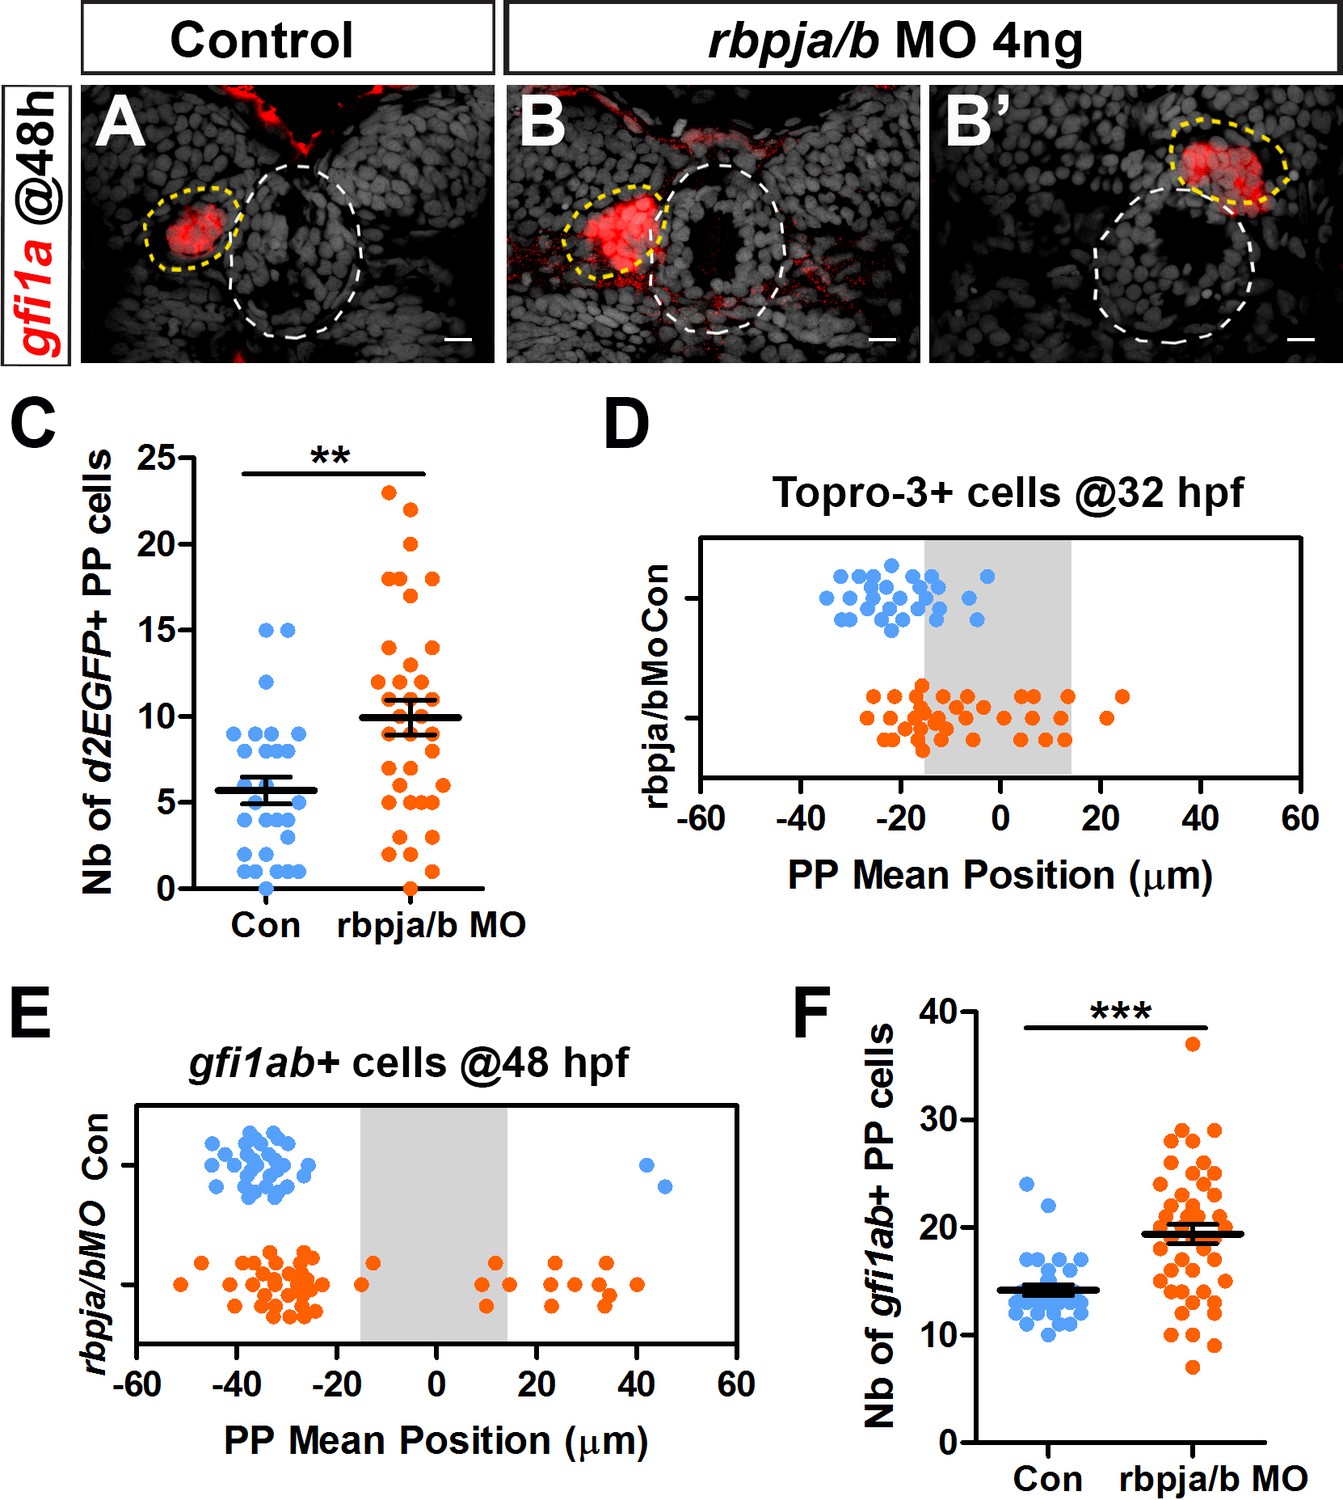
rbpja/b morphants phenocopy mindbomb mutants.
(A–B’) Confocal sections showing the expression of gfi1ab (red) at 48 hpf in control embryos (A, n = 33) and in two representative embryos injected with 4 ng of rbpja/b morpholinos (MO) (B, B’); sections are merged with nuclear staining (gray) to highlight the epiphysis (white circle) and parapineal (yellow circle). Embryo view is dorsal, anterior is up; scale bar = 10 µm. (C–D) Dot plots showing the number of Tg(dusp6:d2EGFP) positive parapineal cells (C) and the mean position of parapineal cells highlighted by nuclei staining (Topro-3) (D) at 32 hpf in embryos injected with 4 ng rbpja/b MO (orange dots; n = 36) or in controls (blue dots; n = 28). (E–F) Dot plots showing the mean position (E) or the number (F) of gfi1ab expressing parapineal cells in non-injected controls (blue dots, n = 33) or in rbpja/b MO injected embryos (orange dots, n = 46) at 48 hpf. Both the migration (distance from the midline; p-value=0.0001 in Welch t-test on absolute value) and laterality (left orientation of migration; p-value=0.0002 on Wilcoxon test) are affected in rbpja/b morphants (E). The number of gfi1ab+ cells is also increased in rbpja/b morphants (F, *** p-value<0.0001; Welch t-test). Data are representative of three (A–B’, E–F) or two experiments (C–D).
Figure 1—figure supplement 3
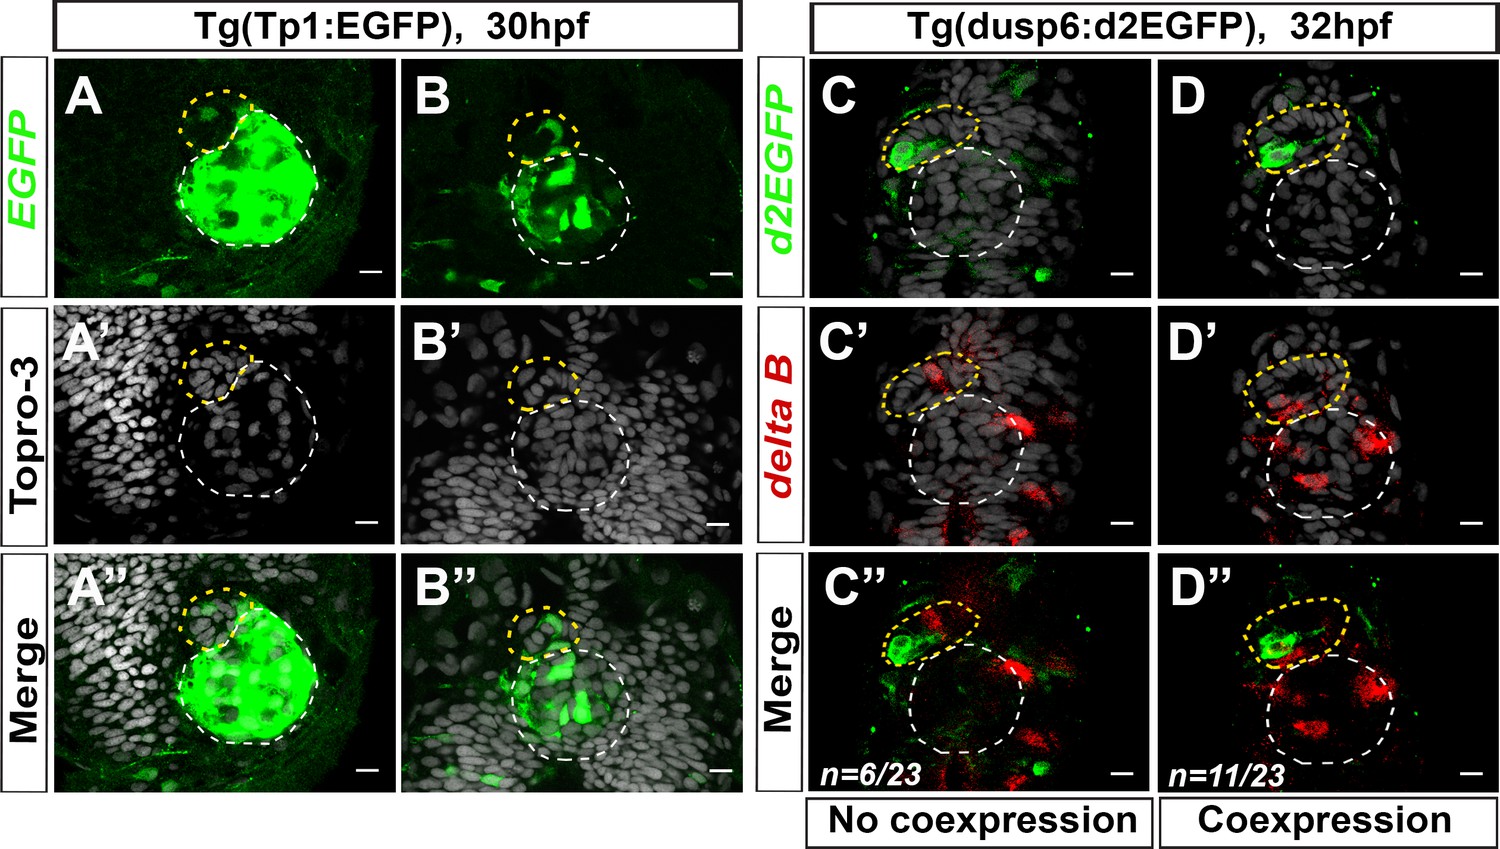
Components of the Notch pathway are mosaically expressed in the parapineal.
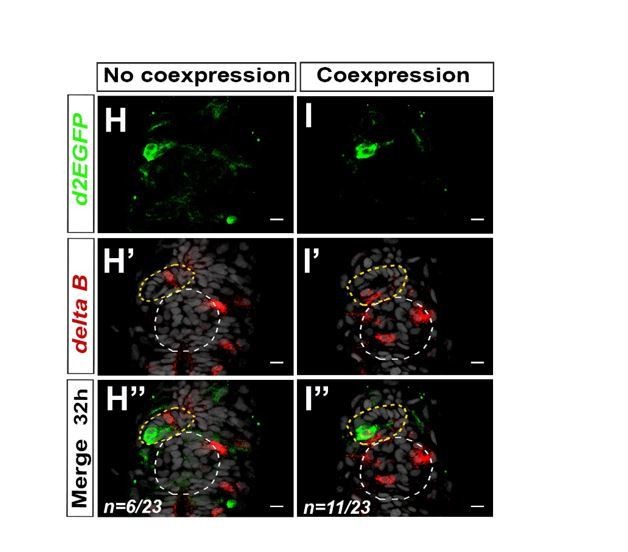
(A–B) Confocal sections showing the expression of Tg(Tp1bglob:EGFP) transgene (green, A, B), Topro-3 nuclear staining (gray, A’–B’) and merge (A’’–B’’) in the epithalamia of two embryos at 30 hpf (n = 3/19). Notch reporter transgene is strongly expressed in the epiphysis (white circle) and weakly detected in the parapineal (yellow circle) of few embryos (n = 3/19). Embryo view is dorsal, anterior is up; scale bar = 10 µm. Data corresponds to three experiments. (C–D’’) Confocal sections showing the expression of Tg(dusp6:d2EGFP) transgene (green, C, D) and deltaB (red, C’–D’) and merge (C’’–D’’) in the epithalamia of two representative embryos at 32 hpf. deltaB mRNA is detected in only one or two parapineal cells in most embryos (n = 17/23); staining is either co-expressed with Tg(dusp6:d2EGFP) (n = 11/23) or detected in Tg(dusp6:d2EGFP) negative cells (n = 6/23); in n = 6/23, deltaB was not detected in the parapineal. Embryo view is dorsal, anterior is up; epiphysis (white circle), parapineal (yellow circle); scale bar = 10 µm. Data are representative of two experiments.
Figure 2 with 3 supplements
Uncoupled roles for the Notch pathway in the specification, laterality and migration of parapineal cells.
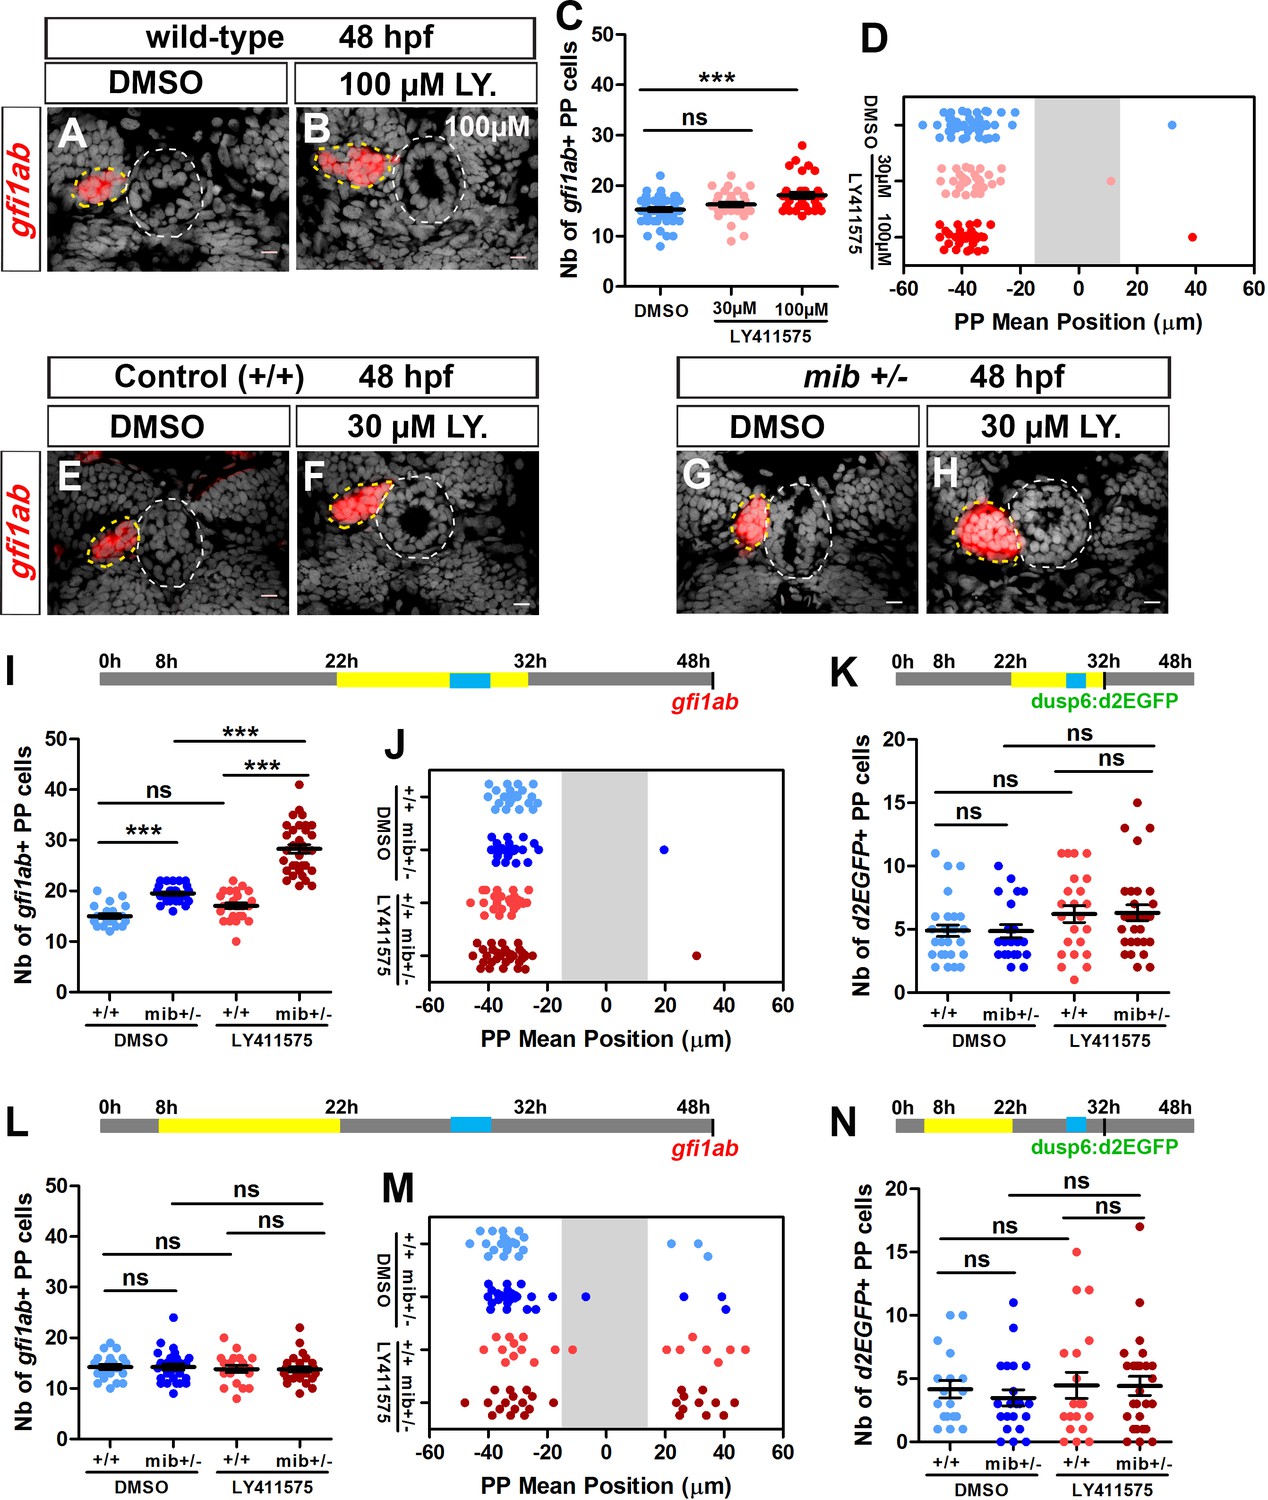
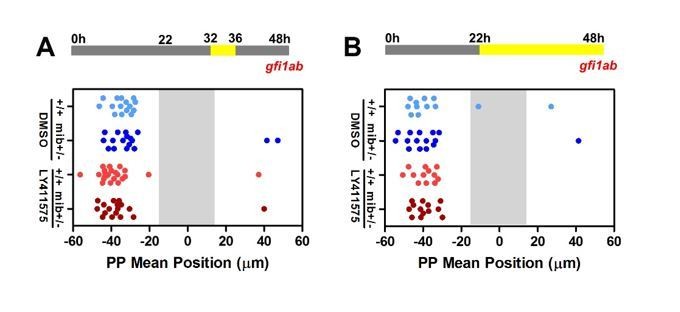
(A–B) Confocal sections showing the expression of gfi1ab (red) in embryos treated with DMSO (A; n = 24) or 100 µM LY411575 (B; n = 32) from 22 to 32 hpf and fixed at 48 hpf, merged with nuclear staining (gray). Embryo view is dorsal, anterior is up; epiphysis (white circle) and parapineal (yellow circle); scale bar = 10 µm. (C–D) Dot plots showing the number (C) and the mean position (D) of gfi1ab expressing parapineal (PP) cells at 48 hpf in embryos treated with DMSO (controls, blue dots, n = 47), with 30 µM LY411575 (light red dots, n = 31) or 100 µM LY411575 (red dots, n = 32) from 22 hpf to 32 hpf, with mean ± SEM; *** p-value=0.0003. (E–H) Confocal sections showing the expression of gfi1ab (red) merged with nuclear staining (gray) at 48 hpf, in wild-type (+/+) (E, F) or mib+/- embryos (G, H) treated with DMSO (E, n = 23 or G, n = 26) or with LY411575 (F, n = 25 and H, n = 34) from 22 to 32 hpf. (I–N) Upper panels show a schematic of the LY411575 treatment timeline (yellow box, 22 to 32 hpf for I-K or 8 to 22 hfp for dot plots L-N), and the time window corresponding to when the parapineal initiates its migration (blue box, 28 to 30 hpf). Dot plots showing the number (I, L) and the mean position (J, M) of gfi1ab expressing cells at 48 hpf, or the number of Tg(dusp6:d2EGFP) expressing cells at 32 hpf (K, N), in the parapineal of DMSO-treated wild-type (+/+, light blue dots; I-J, n = 23; L-M, n = 12; K, n = 28; N, n = 18), DMSO-treated mib+/- heterozygote (dark blue dots; I-J, ± = 26; L-M, n = 17; K, n = 21; N, n = 21), LY411575-treated wild-type ( light red dots; I-J, n = 25; L-M, n = 11; K, n = 23, N, n = 19) and LY411575-treated mib+/- (dark red dots, I-J, n = 34 or L-M, n = 16; K, n = 29, N, n = 26); each dot represents a single embryo. Mean ± SEM is shown in I, K, L, N; *** p-value<0.0001, in Wilcoxon test and Welch t-test. In J and M, there is no defect in migration per se (ns p-value in Welch t-test on absolute value) but LY411575 treatment from 8 to 22 hpf (M) triggers a laterality defect (increased number of embryos with a parapineal on the right). Data are representative of three (E–H, I–K) or two experiments (A–D and L–N). See also Figure 2—figure supplement 1, Figure 2—figure supplement 2 and Figure 2—figure supplement 3. Source files used for dot plots and statistical analysis are available in Figure 2—source data 1.
-
Figure 2—source data 1
Source files for data used to generate dot plots in Figure 2.
- https://doi.org/10.7554/eLife.46275.012
Figure 2—figure supplement 1
Effect of treatment with high dose of γ-secretase inhibitor from 22 to 32 hpf on the specification and migration of parapineal cells.
(A, B) Upper panel shows a schematic of LY411575 treatment timeline: wild-type (+/+) or mib+/- embryos were treated from 22 to 32 hpf with 200 µM of LY411575. Dot plots show the number (A) and the mean position (B) of gfi1ab expressing cells at 48 hpf in the parapineal of DMSO-treated controls (dark blue dots; n = 18), DMSO treated mib+/- (light blue dots; n = 18), LY411575 treated (dark red dots; n = 20) and LY411575 treated mib+/- (light red dots, n = 17); dots represent individual embryos. *** p-value<0.0001, ** p-value<0.01, * p-value<0.05, Welch t-test and Wilcoxon test; Data corresponds to one experiment.
Figure 2—figure supplement 2
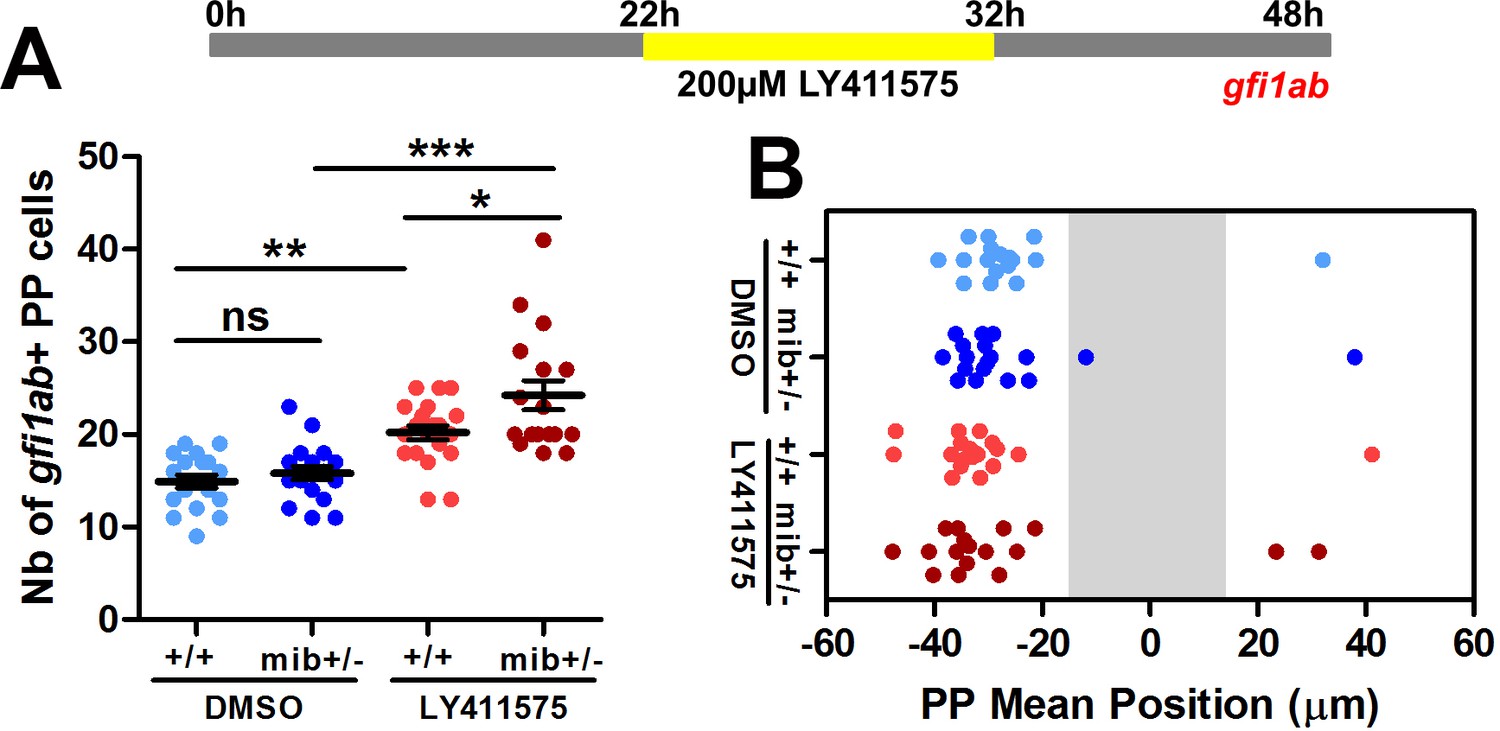
LY411575 treatment after 32 hpf does not affect the migration or the specification of parapineal cells.
(A–B) Upper panels show a schematic of the LY411575 treatment timeline, from 32 to 36 hfp for dot plots (A, C) or from 22 to 48 hpf (B, D). Dot plots show, for each embryo, the mean position (A–B) or the number (C–D) of gfi1ab expressing cells at 48 hpf in the parapineal of DMSO-treated wild-type (+/+, light blue dots; A,C, n = 12; B,D, n = 15), DMSO-treated mib+/- heterozygote (dark blue dots; A, C, ± = 15; B, D, n = 17), LY411575-treated wild-type (light red dots; A, C, n = 12; B, D, n = 23) and LY411575-treated mib+/- embryos (dark red dots, A, C, n = 13; B, D, n = 17). No migration defect was observed in either context. The number of gfi1ab expressing cells was not affected upon late LY411575 treatment from 32 to 36 hfp (C) or was increased upon LY411575 treatment from 22 to 48 hfp but in a similar way than observed for 22 to 32 hfp treatment; data correspond to one experiment.
Figure 2—figure supplement 3
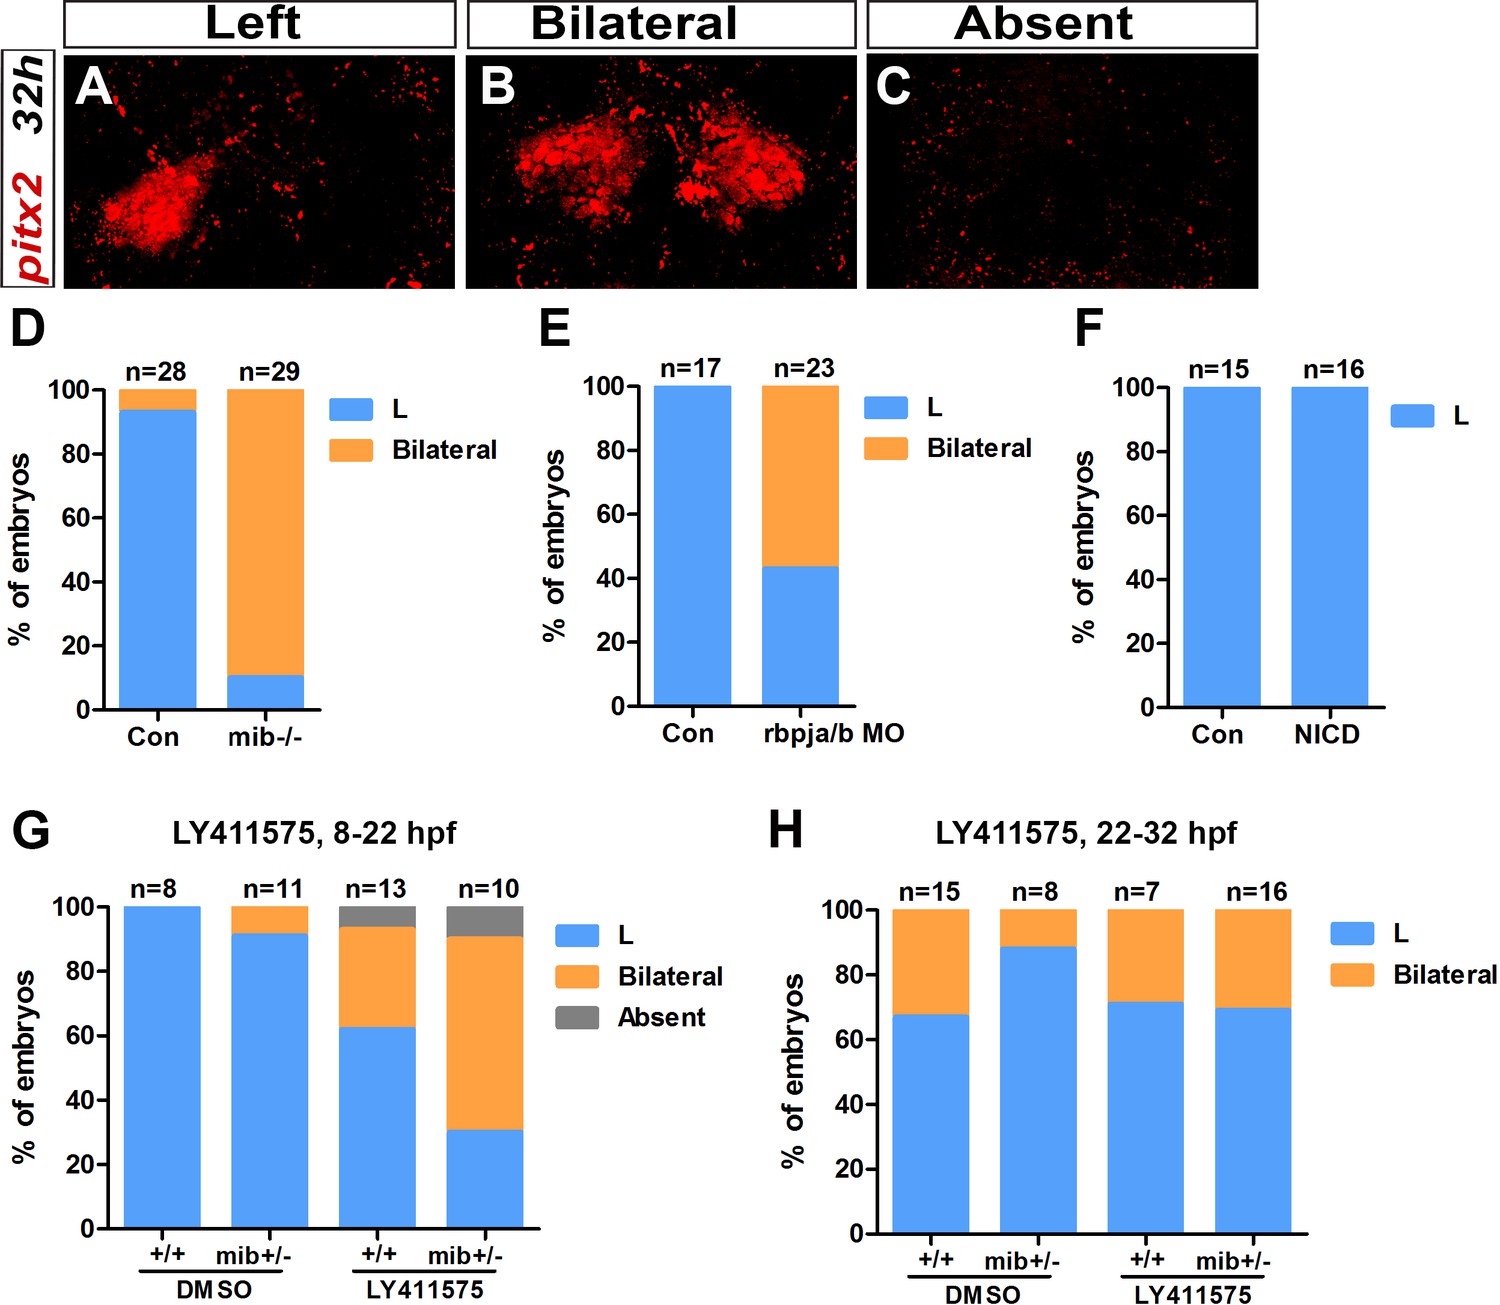
Early Notch loss-of-function results in bilateral Nodal pathway activation in the epithalamus.
(A–C) Confocal sections showing Left (A), Bilateral (B) or Absent (C) pitx2c expression in the epithalamus at 32 hpf (red). Embryo view is dorsal, anterior is up; scale bar = 10 µm. (D–H) Histogram showing the percentage of embryos with Left (L, blue), Bilateral (orange) and Absent (gray) pitx2c expression in mib-/- mutant embryos (D), in rbpja/b morphant (MO) embryos (E), in embryos expressing NICD (Notch Intra-cellular Domain) (F) and in embryos treated with 30 µM of LY411575 from 8 to 22 hpf (G) or from 22 to 32 hpf (H). Genetic background, treatment and embryos numbers are indicated below each bar; Con: control sibling embryos. Data are representative of two (D–F) or one experiment (E, G, H).
Figure 3 with 1 supplement
Ectopic Notch signaling triggers decreased FGF activation and defects in migration and specification of parapineal cells.
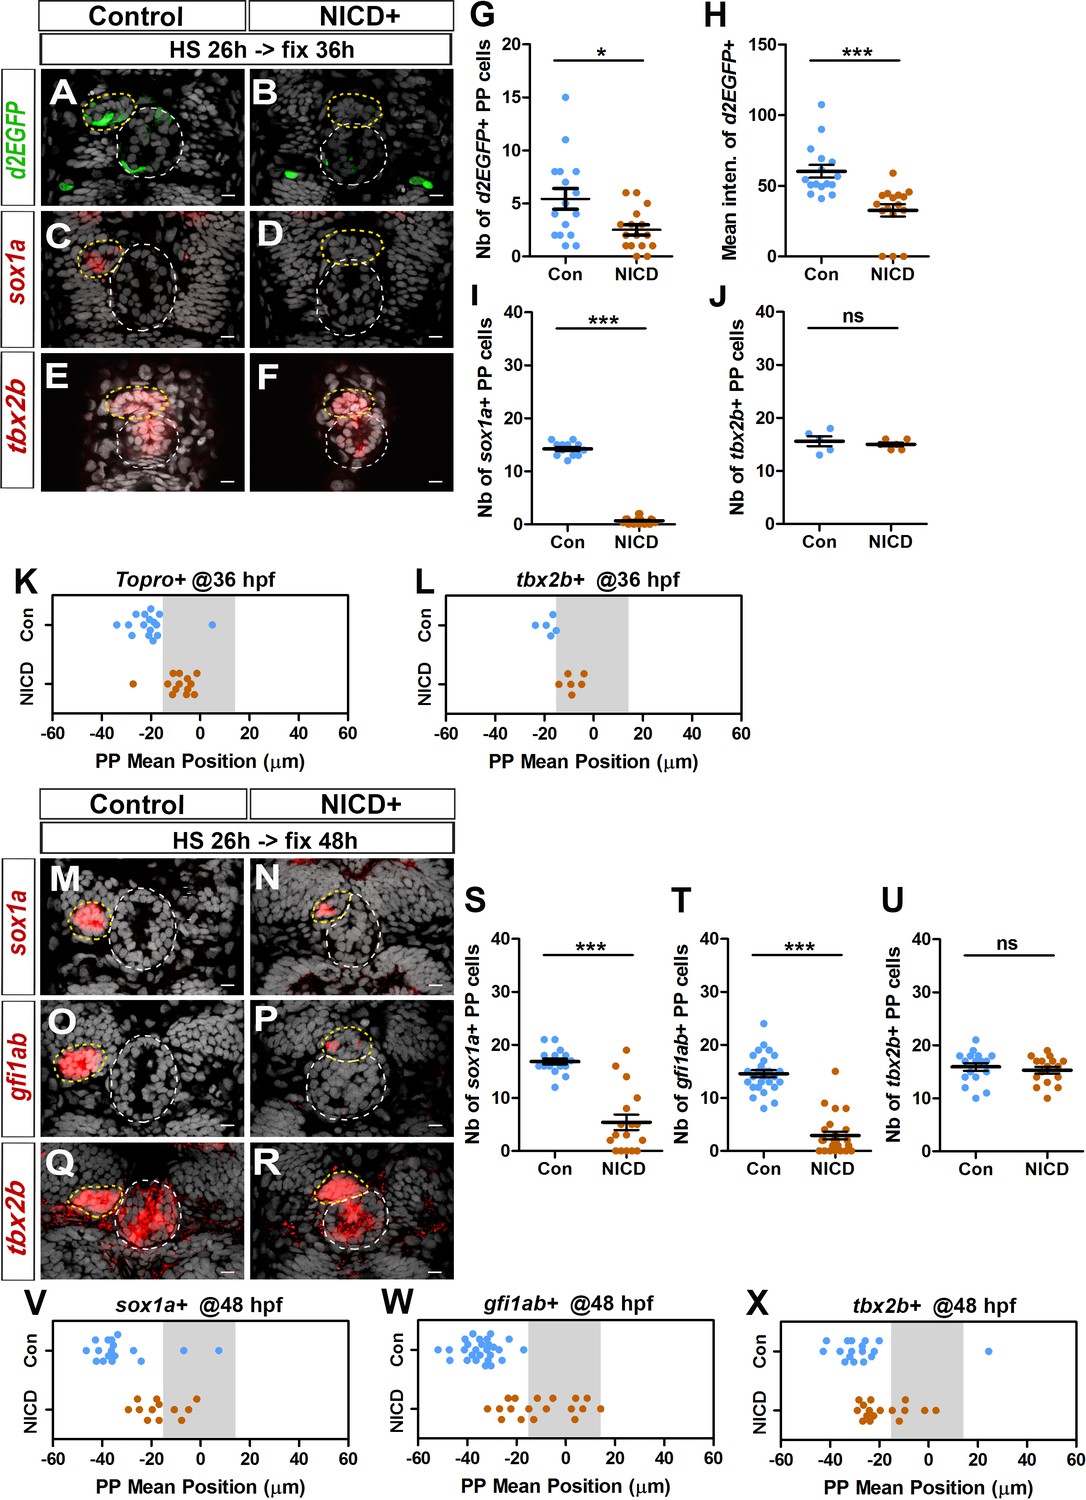
(A–F) Confocal sections showing the expression of Tg(dusp6 :d2EGFP) (A-B, green), sox1a (C-D, red) or tbx2b (E-F, red) at 36 hpf, in control embryos (A, n = 16; C, n = 12; E, n = 5) or in Tg(hsp70l:Gal4), Tg(UAS:myc-notch1a-intra) embryos (B, n = 16; D, n = 17; F, n = 6) following a heat-shock (HS) at 26 hpf; sections are merged with nuclei staining (gray). (G–L) Dot plots showing the number (G) and the mean intensity fluorescence (H) of Tg(dusp6 :d2EGFP) expressing parapineal cells, the number of sox1a (I) and tbx2b (J) expressing parapineal cells, or the mean position of parapineal cells highlighted by Topro-3 nuclei staining (K) and tbx2b + parapineal cells (L) in controls (blue dots) or in NICD expressing embryos (orange dots) at 36 hpf following heat shock at 26 hpf. (M–R) Confocal sections showing the expression of sox1a (M–N), gfi1ab (O–P) or tbx2b (Q–R) (red) merged with nuclei staining (gray), at 48 hpf, in the epithalamia of control (M, n = 17; O, n = 27; Q, n = 17) or Tg(hsp70l:Gal4);Tg(UAS:myc-notch1a-intra) double transgenic embryos (N, n = 17; P, n = 25; R, n = 16), following heat-shock (HS) at 26 hpf. The expression of sox1a and gfi1ab is lost or decreased while tbx2b expression is unchanged in the parapineal of NICD expressing embryos. (S–X) Dot plots showing the number of sox1a (S), gfi1ab (T) and tbx2b (U) expressing parapineal cells at 48 hpf in controls (blue dots) or in embryos expressing NICD after heat shock at 26 hpf (orange dots) and the corresponding mean position of the cells (V–X) when expression was detected (number of sox1a + or gfi1ab+ cells > 0). In confocal sections, embryo view is dorsal, anterior is up; epiphysis (white circle) and parapineal gland (yellow circle); scale bar = 10 µm. Mean ± SEM is indicated on dot plots G-J and S-U; *** p-value<0.0001, * p-value<0.05 in Welch t-test and Wilcoxon test. For migration dot plots, p-value<0.01 (L) or p-value<0.001 (K and V–X) in pairwise Wilcoxon test and Welch t-test on absolute values. Data are representative of three (O, P, T, W) or two experiments (A–D, G–I, M–N, Q–R, S, U, V, X); data based on tbx2b expression at 36 hpf (E–F, J, L) represents one experiment. See also Figure 3—figure supplement 1. Source files used to generate dot plots and for statistical analysis are available in Figure 3—source data 1.
-
Figure 3—source data 1
Source files for data used to generate dot plots in Figure 3.
- https://doi.org/10.7554/eLife.46275.015
Figure 3—figure supplement 1
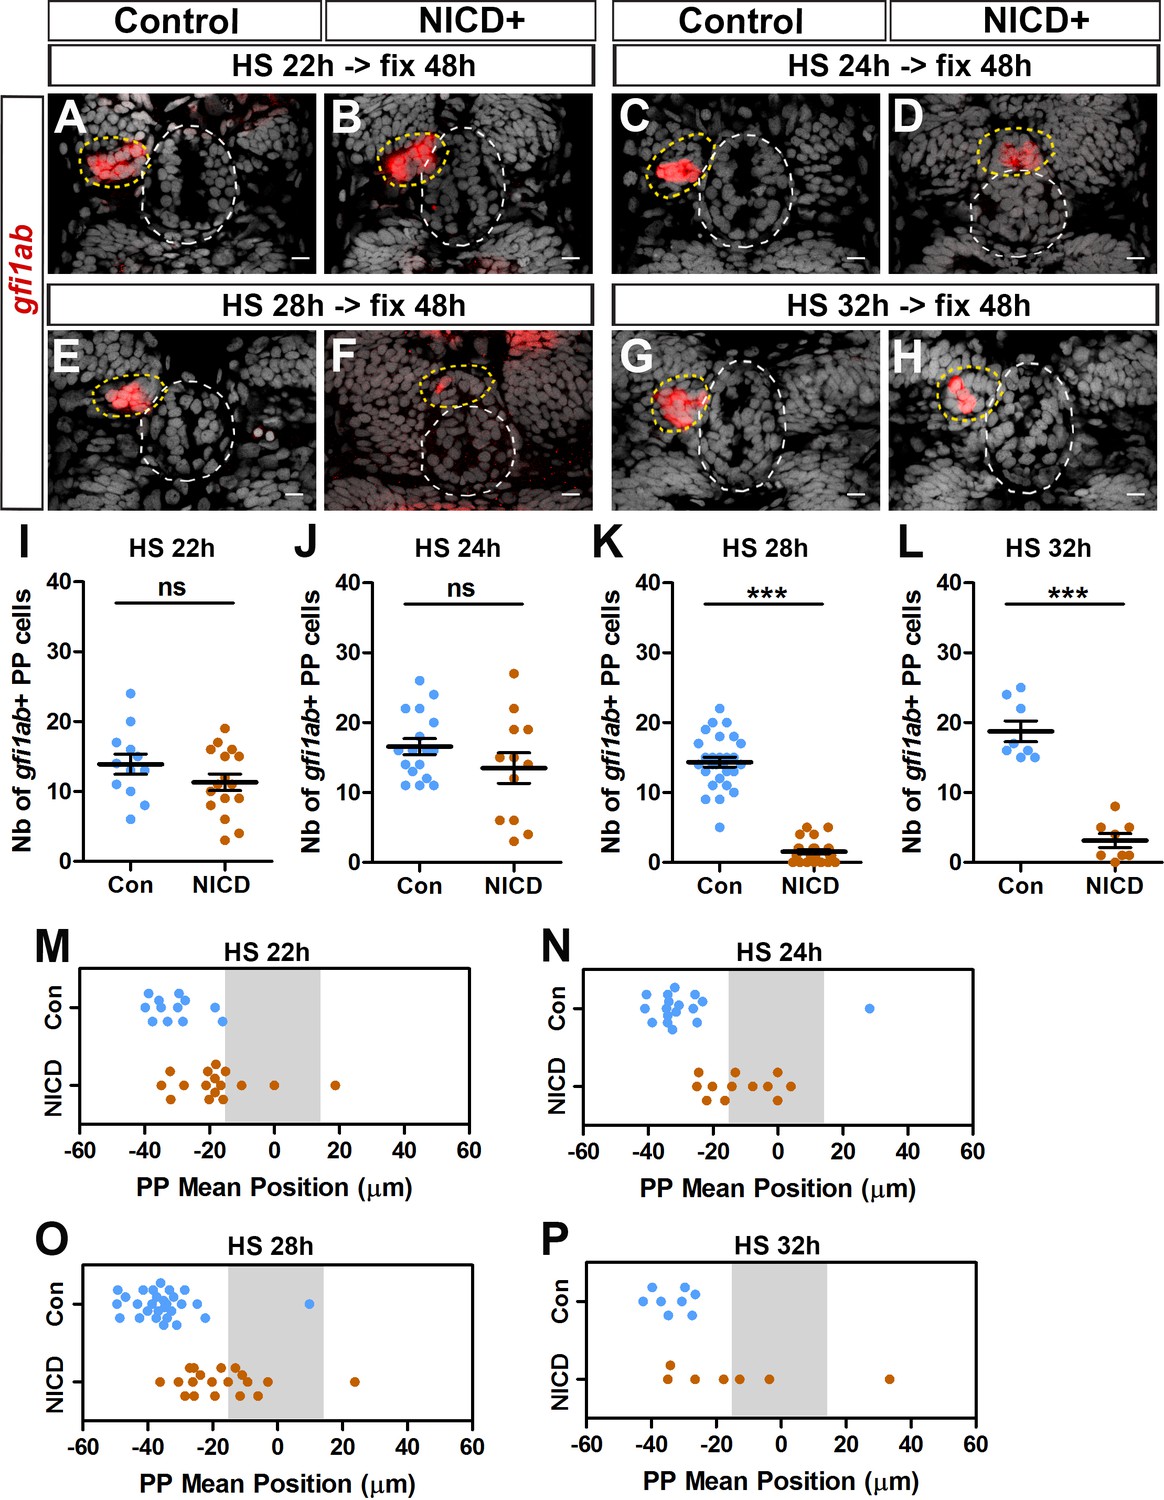
Effect of activation of the Notch pathway at 22, 24, 28 and 32 hpf on the migration and specification of parapineal cells.
(A–H) Confocal sections showing the expression of gfi1ab (red) at 48 hpf in control embryos (A, n = 27; C, n = 17; E, n = 28; G, n = 8) or in Tg(hsp70l:Gal4);Tg(UAS:myc-Notch1a-intra) double heterozygous embryos (B, n = 16; D, n = 12; F, n = 26; H, n = 8) following heat-shock (HS) induction at 22 hpf (A, B), 24 hpf (C, D), 28 hpf (E, F), 32 hpf (G, H); images are merged with nuclear staining (gray) to visualize the epiphysis (white circle) and parapineal (yellow circle). Embryo view is dorsal, anterior is up; scale bar = 10 µm. (I–P) Dot Plots showing the quantification of the number (I-L) and the mean position (M–P) of gfi1ab expressing parapineal (PP) cells in control (blue dots) or in NICD+ embryos (orange dots) at 48 hpf, following heat-shock (HS) induction at 22 hpf (I, M), 24 hpf (J, N), 28 hpf (K, O), 32 hpf (L, P). The number of gfi1ab+ parapineal cells was significantly decreased in embryos expressing NICD from 28 and 32 hpf but not from 22 and 24 hpf; mean ± SEM is indicated on dot plots I-L; *** p-value<0.0001 in Welch t-test and Wilcoxon test. Parapineal migration was affected in embryos expressing NICD from 22, 24 or 28 hpf; p-value=0.0018 (M), <0.0001 (N), <0.0001 (O) in Welch t-test in absolute values; defects were variable but also significant in embryos expressing NICD from 32 hpf, p=0.0369 (P). Data are representative of three (HS@28 hpf; E–F, K, O) or two experiments (HS@24 hpf; C–D, J, N); data shown in A-B, I, M and G-H, L, P (HS@22 hpf and 32 hpf) correspond to one experiment.
Figure 4

Decreasing or increasing FGF signaling rescues or aggravates the parapineal migration defect in Notch loss-of-function.
(A–D) Confocal sections showing the expression of gfi1ab (red) merged with nuclei staining (gray) at 48 hpf in representative control sibling (A–B) or mib-/- mutant embryos (C–D) treated from 24 to 32 hpf with DMSO (A, C) or 5 µM SU5402 (B, D). Parapineal migration is not affected in controls embryos treated with 5 µM of SU5402 (A–B); in C-D, examples show a parapineal that failed to migrate in a DMSO treated mib-/- mutant embryos (C) or that migrated to the left in a SU5402 treated mib-/- mutant embryos (D). Embryo view is dorsal, anterior is up; epiphysis (white circle) and parapineal (yellow circle); scale bar = 10 µm. (E–F) Upper panel show a schematic of the SU5402 (or DMSO) treatment timeline (24–32 hpf) in control and mib-/- mutant embryos. Dot plots showing the number (E) and the mean position (F) of gfi1ab expressing parapineal (PP) cells at 48 hpf in control embryos treated with DMSO (light blue dots; n = 32) or with 5 µM SU5402 (dark blue dots, n = 31), and in mib-/- mutant embryos treated with DMSO (orange dots, n = 31) or with SU5402 (yellow dots, n = 41). The number of gfi1ab-positive cells is increased in mib-/- mutants embryos, regardless of whether they were treated with SU5402 or DMSO (DMSO control versus DMSO mib-/-, ** p-value=0.0042; SU5402 control versus SU5402 mib-/-, ** p-value=0.0086, Welch t-test). The parapineal fails to migrate in 52% of DMSO treated mib-/- mutant embryos (PP mean position between −15 µm to +15 µm, gray-shaded area), and this proportion decreases to 19% of SU5402 treated mib-/- mutant embryos; p-value=0.0139 on a Chi-square test and p=0.0103 on a Welch t-test on absolute value. (G) Upper panel shows a schematic of the SU5402 (or DMSO) treatment timeline (24–32 hpf) in control and mib-/- mutant embryos. Dot plot showing the number of Tg(dusp6:d2EGFP) expressing parapineal cells at 32 hpf in control embryos treated with DMSO (light blue; n = 20) or with 5 µM SU5402 (dark blue, n = 18), and in mib-/- mutant embryos treated with DMSO (orange, n = 17) or with SU5402 (yellow, n = 21). The number of Tg(dusp6:d2EGFP)+ cells is increased in DMSO treated mib-/- mutants versus controls (p-value=0.0077) but is decreased in SU5402 treated mib-/- mutants compared to DMSO treated mib-/- mutants (p-value=0.0248 in Welch’s t-test). (H–I) Upper panel in H shows a schematic of heat shock timeline in Tg(hsp70:ca-fgfr1) embryos injected with rbpja/b morpholinos (MO). Dot plots showing the number (H) and the mean position (I) of gfi1ab expressing parapineal cells in control embryos that carry (purple dots; n = 55) or do not carry the Tg(hsp70:ca-fgfr1) transgene (light blue dots; n = 54), or in rbpja/bMO injected embryos that carry (dark red dots; n = 73) or do not carry the Tg(hsp70:ca-fgfr1) transgene (orange dots; n = 67). In rbpja/b morphants expressing Tg(hsp70:ca-fgfr1), the parapineal failed to migrate in 25% of embryos (n = 18/73; p-value=0.0007 Welch’s t-test on absolute value and p-value=0.0232 in Chi-square test), a defect significantly higher than expected from merely adding the effects of activated receptor transgene and rbpja/b MO injections alone (p-value=0.0001 in Welch t-test on absolute value and p-value=0.0003 in Chi-square test). Data are representative of four (H–I), three (A–F) or two experiments (G). Source files used to generate dot plots and for statistical analysis are available in Figure 4—source data 1.
-
Figure 4—source data 1
Source files for data used to generate dot plots in Figure 4.
- https://doi.org/10.7554/eLife.46275.017
Author response image 1
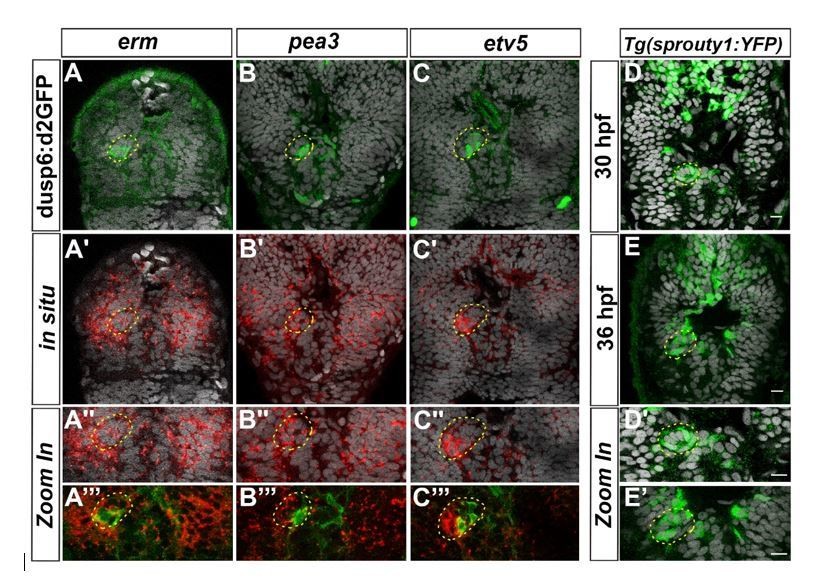
Expression of others FGF target genes in the epithalamus.
Confocal sections of the head of Tg(dusp6:d2EGFP) embryos (A-C’’’) at 36 hpf after a whole-mount in situ hybridization against erm (red, A-A’’’), pea3 (red, B-B’’’), etv5a (red, C-C’’’) or of Tg(sprouty1:YFP) embryos at 30 hpf (D-D’) or 36 hpf (E, E’) after immunostaining against GFP (Green; A-E’); the pictures are merged with cell nuclei staining (Topro-3 in grey) that makes brain structures visible and specially the parapineal (yellow circle). A’’-C’’’, D’-E’ show Zoom in of merge pictures. Embryos are viewed dorsally with anterior up.
Author response image 2
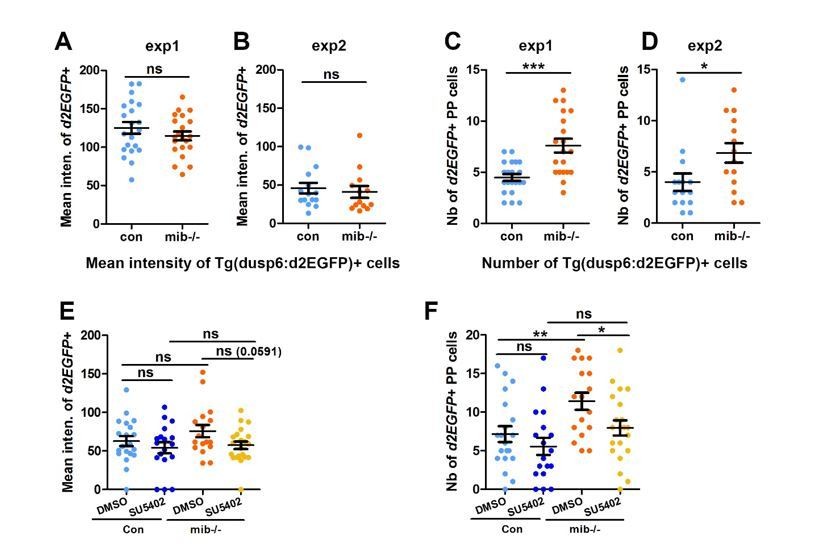
The number but not the mean intensity of Tg(dusp6:d2EGFP) expressing cells is increased in mib-/- mutants.
(A-B) Dot plots showing the mean GFP fluorescence intensity (A, B) of Tg(dusp6:d2EGFP) expressing parapineal cells in the first (A) and second experiment (B) in controls (blue dots; A, n=21; B, n=15) or in mib-/-mutant embryos (orange dots; A, n=21; B, n=13) at 32 hpf stage. (C-D); we chose to present data for the 2 experiments separately as the mean intensity threshold chosen to define Tg(dusp6:d2EGFP)+ cells differ between both experiments. (C-D) Dot plots showing the number of Tg(dusp6:d2EGFP) expressing parapineal cells in the first (C) and second experiment (D); merged data for both experiments are presented in the Manuscript as Figure 1E. (E-F) Dot plots showing the mean fluorescence intensity of Tg(dusp6:d2EGFP) expressing parapineal in control embryos treated with DMSO(light blue; A, n=20) or with 5 µM SU5402 (dark blue; A, n=18), and in mib-/-mutant embryos treated with DMSO (orange; A, n=17) or with SU5402 (yellow; A, n=21) at 32 hpf stage. Mean ± SEM is indicated; ns, p-value>0,05; * p-value<0,05; ** p-value<0,01 in Welch t-test.
Author response image 3

Notch target genes her6 and her9 are mosaïcally expressed in parapineal cells.
(A-D) Confocal sections showing the expression of her6 (A, B) and her9 (C, D) (red) at 32 hpf in control embryos (A, C) and in mib-/- mutant embryos (B, D) merged with a cell nuclei staining (grey). (E-F) Dot plots showing the number of her6 (E) and her9 (F) in control (Blue marks) and mib-/- mutant embryos (Orange marks). Embryo view is dorsal, anterior is up; epiphysis (white circle), parapineal gland (yellow circle); scale bar=10 µm. Mean ± SEM are indicated as long and short bars. ** P-value<0.01; * P-value<0.05 in welsh t test (Wilcoxon test); data corresponds to one experiment.
Author response image 4
Late LY41 treatment does not affect parapineal migration.
(A-B) Upper panels show a schematic of the LY411575 treatment timeline, from 32 to 36 hfp (A) or 22 to 48 hpf (B) for dot plots. Dot plots showing, for each embryo, the mean position of gfi1ab expressing cells at 48 hpf in the parapineal of DMSO treated wild-type (+/+, light blue dots; A, n=12; B, n=15), DMSO treated mib+/- heterozygote (dark blue dots; A, n=15; B, n=17), LY411575 treated wild-type (light red dots; A, n=12; B, n=23) and LY411575 treated mib+/- embryos (dark red dots, A, n=13; B, n=17). No migration defect was observed in either context; data corresponds to one experiment.
Author response image 5
Notch ligand deltaB is mosaically expressed in the parapineal.
(A-B’’) Confocal sections showing the expression of Tg(dusp6:d2EGFP) transgene (green, A, B) or deltaB (red, A’-B’) and merge (A’’-B’’) in the epithalamia of two representative embryos at 32 hpf. deltaB mRNA is detected in only one or two parapineal cells in most embryos (n=17/23); staining is either co-expressed with Tg(dusp6:d2EGFP) (n=11/23) or detected in Tg(dusp6:d2EGFP) negative cells (n=6/23); in n=6/23, deltaB was not detected in the parapineal. Embryo view is dorsal, anterior is up; epiphysis (white circle), parapineal gland (yellow circle); scale bar=10 µm. Data representative of 2 experiments.
Tables
Key resources table
| Reagent type (species) or resource | Designation | Source or reference | Identifiers | Additional information |
|---|---|---|---|---|
| Genetic reagent (D. rerio) | mibta52b | Itoh et al., 2003 | RRID:ZFIN_ZDB-GENO-071218-1 | |
| Genetic reagent (D. rerio) | fgf8ti282a (ace) | Reifers et al., 1998 | RRID:ZFIN_ZDB-GENO-980202-822 | |
| Genetic reagent (D. rerio) | Tg(hsp70:Gal4)kca4 | Scheer et al., 2001 | RRID:ZFIN_ZDB-ALT-020918-6 | |
| Genetic reagent (D. rerio) | Tg(UAS:myc-Notch1a-intra)kca3 | Scheer and Campos-Ortega, 1999 | RRID:ZFIN_ZDB-ALT-020918-8 | |
| Genetic reagent (D. rerio) | Tg(hsp70:ca-fgfr1; cryaa:DsRed)pd3 | Marques et al., 2008 Neilson and Friesel, 1996 | RRID:ZFIN_ZDB-GENO-090127-1 | |
| Genetic reagent (D. rerio) | Tg(dusp6:d2EGFP)pt6 | Molina et al., 2007 | RRID:ZFIN_ZDB-GENO-071017-5 | |
| Genetic reagent (D. rerio) | Tg(Tp1bglob:EGFP)ia12 | Corallo et al., 2013 | RRID:ZFIN_ZDB-ALT-130115-3 | |
| Sequence-based reagent | rbpja/su(H)1; rbpjb/su(H)2 | Echeverri and Oates, 2007 | ZFIN ID : ZDB-FISH-150901–13686 | |
| Antibody | Rabbit anti-GFP | Torrey Pines Biolabs | TP-401 RRID:AB_10013661 | 1/1000 |
| Antibody | Goat anti-rabbit IgG Alexa 488-conjugated | Molecular probe | A11034 | 1/1000 |
| Chemical compound, drug | LY411575 | MedChem Express | HY-50752 | Rothenaigner et al., 2011 |
| Chemical compound, drug | SU5402 | Calbiochem | 572630 | Mohammadi et al., 1997 |
| Other | Fast Red | Sigma Aldrich | F46-48 | |
| Other | ToPro-3 | Molecular probe | T3605 | 1/1000 |
Additional files
-
Transparent reporting form
- https://doi.org/10.7554/eLife.46275.018
Download links
A two-part list of links to download the article, or parts of the article, in various formats.
Downloads (link to download the article as PDF)
Open citations (links to open the citations from this article in various online reference manager services)
Cite this article (links to download the citations from this article in formats compatible with various reference manager tools)
Notch signaling restricts FGF pathway activation in parapineal cells to promote their collective migration
eLife 8:e46275.
https://doi.org/10.7554/eLife.46275


