Contractile acto-myosin network on nuclear envelope remnants positions human chromosomes for mitosis
- University of Dundee, United Kingdom
- University of Sussex, United Kingdom
- University of Minnesota, United States
Figures
Figure 1 with 5 supplements
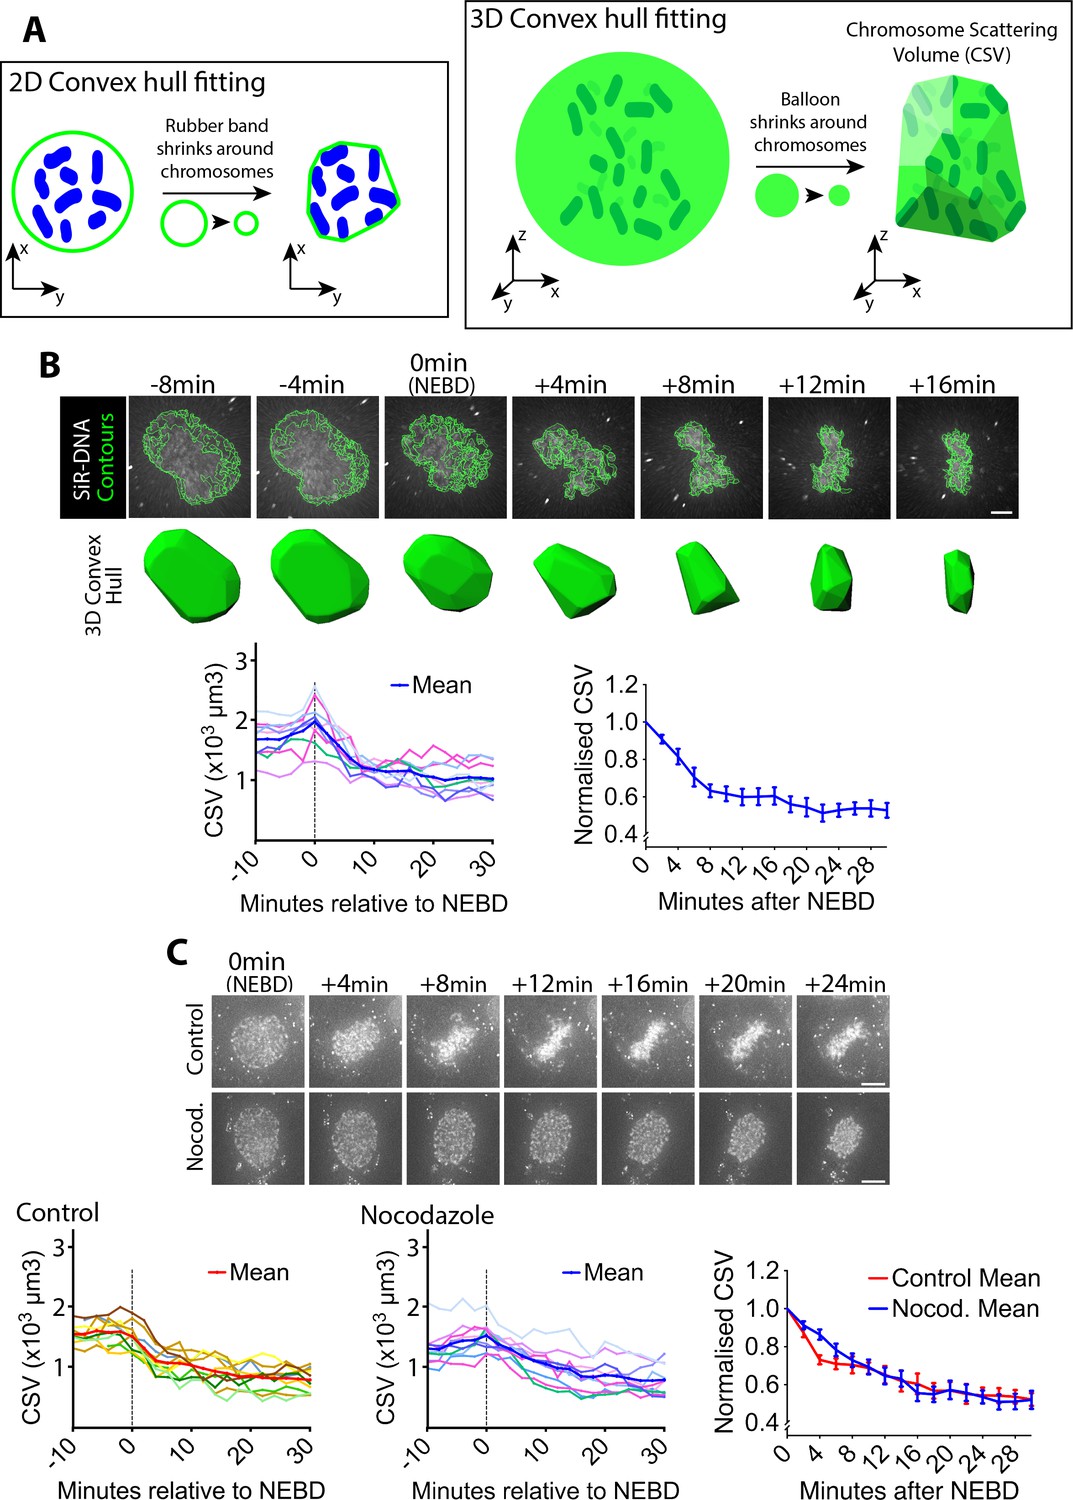
Chromosome scattering volume is reduced in early prometaphase, independently of spindle MTs.
(A) Diagrams show how the chromosome scattering volume (CSV) was defined. Left-hand diagram shows how the convex hull was generated in two dimensions (2D) to represent chromosome distribution. A ‘rubber band’ (green) shrinks around chromosomes (blue) in 2D to create a convex hull or a minimum polygon wrapping chromosomes. Right-hand diagram shows how the convex-hull was generated in three dimensions (3D) to represent chromosome distribution. A ‘balloon’ (green) shrinks around chromosomes (dark green) in 3D to create a convex hull or a minimal polyhedron wrapping chromosomes. The volume of the 3D convex hull (chromosome scattering volume; CSV) quantifies how widely chromosomes are scattered in space. (B) CSV decreases immediately after NEBD. Images (top) are z-projections (z-sections are projected to 2D images) of a representative cell stained with SiR-DNA to visualize chromosomes (white) alongside their perimeter contours at z-sections (green lines; see Materials and methods). Time is shown, relative to NEBD. Timing of NEBD was determined by observation that GFP-LacI-NLS spread out of the nucleus (Figure 1—figure supplement 1). Scale bars, 6 µm. Bottom shows corresponding CSV (green). The left-hand graph shows CSV measurements in individual cells aligned by the time relative to NEBD (n = 9). To make the right-hand graph, these CSV values were normalized to the CSV value at NEBD in each cell, and the mean of the normalized CSV values were plotted at each time point. Error bars, s.e.m. (C) CSV decreases after NEBD even in the absence of MTs. Images (z-projections) show representative cell with SiR-DNA-stained chromosomes, which entered mitosis in the presence of 3.3 µM nocodazole (Nocod., bottom) or DMSO (control, top). 0.5 µM MK-1775 Wee1 inhibitor was used in both conditions to allow cells to enter mitosis. Time is shown relative to NEBD. Timing of NEBD was determined by observation that GFP-LacI-NLS spread out of the nucleus (Figure 1—figure supplement 1). Scale bars, 10 µm. Left-hand and center graphs show CSV measurements in individual control and nocodazole-treated cells, respectively (n = 10 each). The right-hand graph compares the means of normalized CSV between the nocodazole-treated and control cells (error bars, s.e.m.), as in the right-hand graph in (B). Reduction of normalized CSV was not significantly different between control and nocodazole treatment, when all the time points were considered by two-way ANOVA (p=0.81). Nonetheless, normalized CSV was significantly different between the two groups at +4 min (t-test, p=0.0016), but not at other time points.
-
Figure 1—source data 1
Data at individual time points in individual cells.
- https://doi.org/10.7554/eLife.46902.008
Figure 1—figure supplement 1
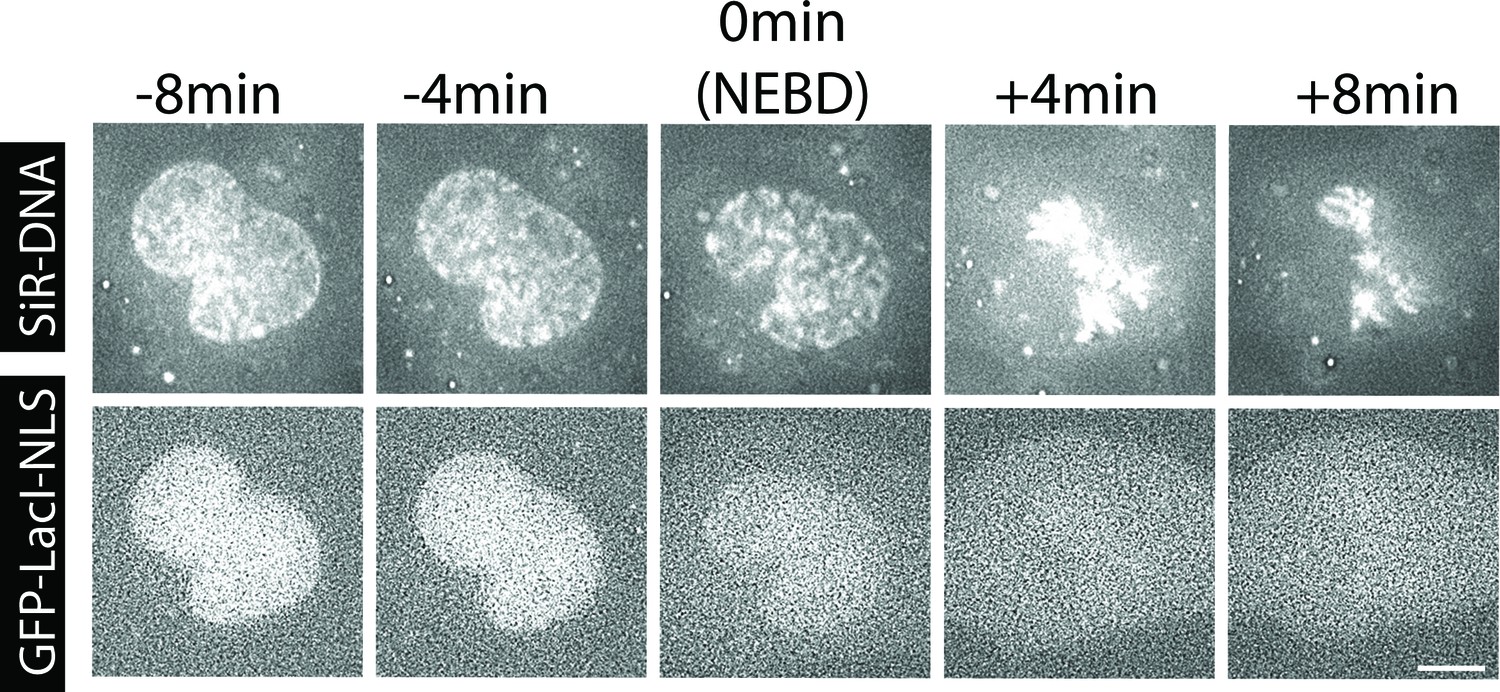
Method for estimation of the NEBD timing.
Images of the same cell shown in Figure 1B. Top-row images show SiR-DNA-stained chromosomes. Bottom-row images show GFP-LacI-NLS (nuclear localization signal). The timing of NEBD was determined through observation of GFP-LacI-NLS spreading out of nucleus. Scale bars, 10 µm.
Figure 1—figure supplement 2
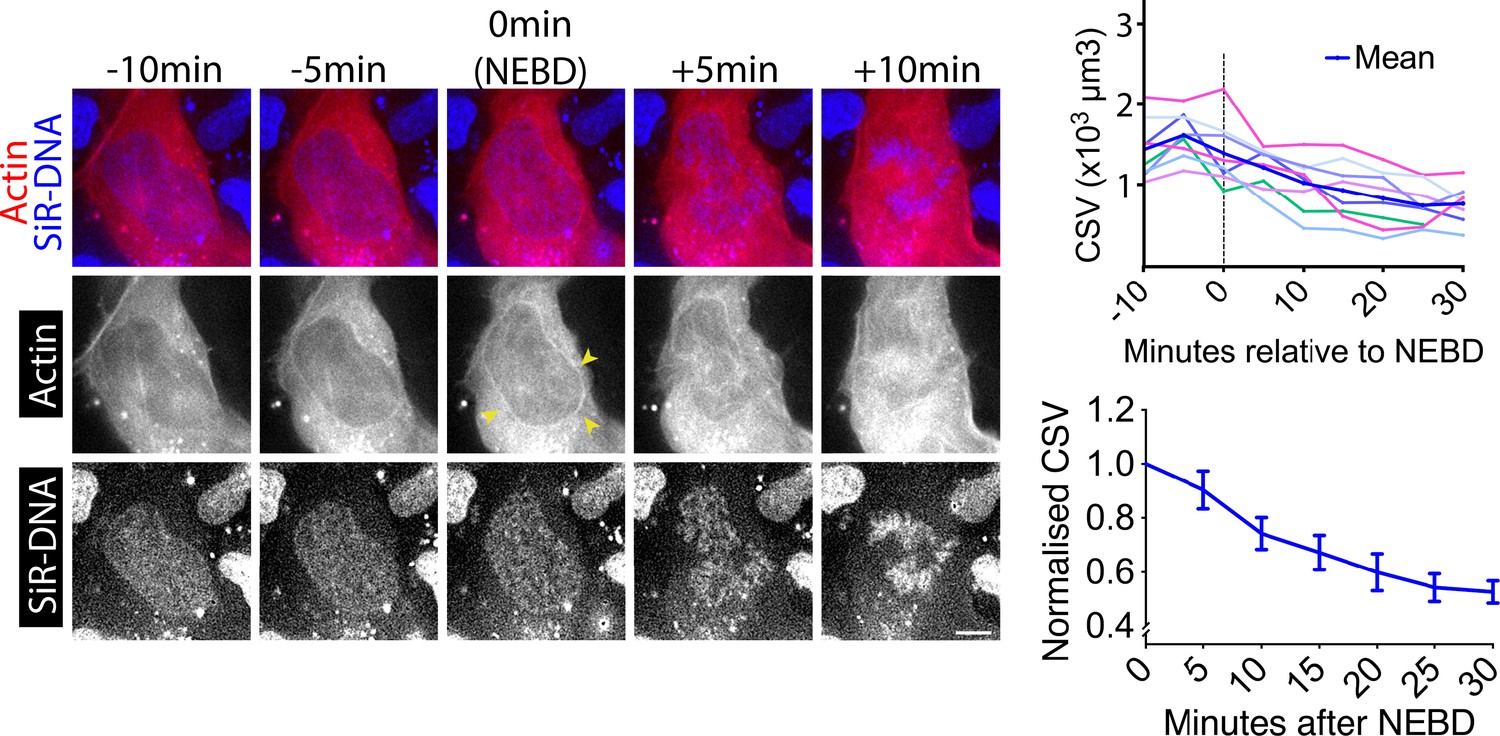
CSV decreases and actin accumulates on the NE around NEBD in asynchronous wild-type U2OS cells (without cdk1-as).
Images show single z-sections of a U2OS cell with SiR-DNA-stained chromosomes (blue), expressing mCherry-Lifeact (red) and undergoing NEBD. Yellow arrowheads indicate location of the actin network. Time is shown, relative to NEBD. Timing of NEBD was determined by observation that GFP-LacI-NLS spread out of the nucleus (Figure 1—figure supplement 1). Scale bars, 10 µm.
Figure 1—figure supplement 3

Confirmation that MTs are absent after nocodazole treatment.
Immunostaining of fixed cells to test the presence or absence of microtubules (MTs) within cells. Cells were analyzed by live-cell imaging for Figure 1C, and then fixed and immunostained for MTs (and LaminB1 as a control) to confirm that MTs were depleted within cells, after nocodazole treatment (right) but not in control. Images are projections of 4 Z-sections at 1 µm interval. Scale bars, 10 µm.
Figure 1—figure supplement 4
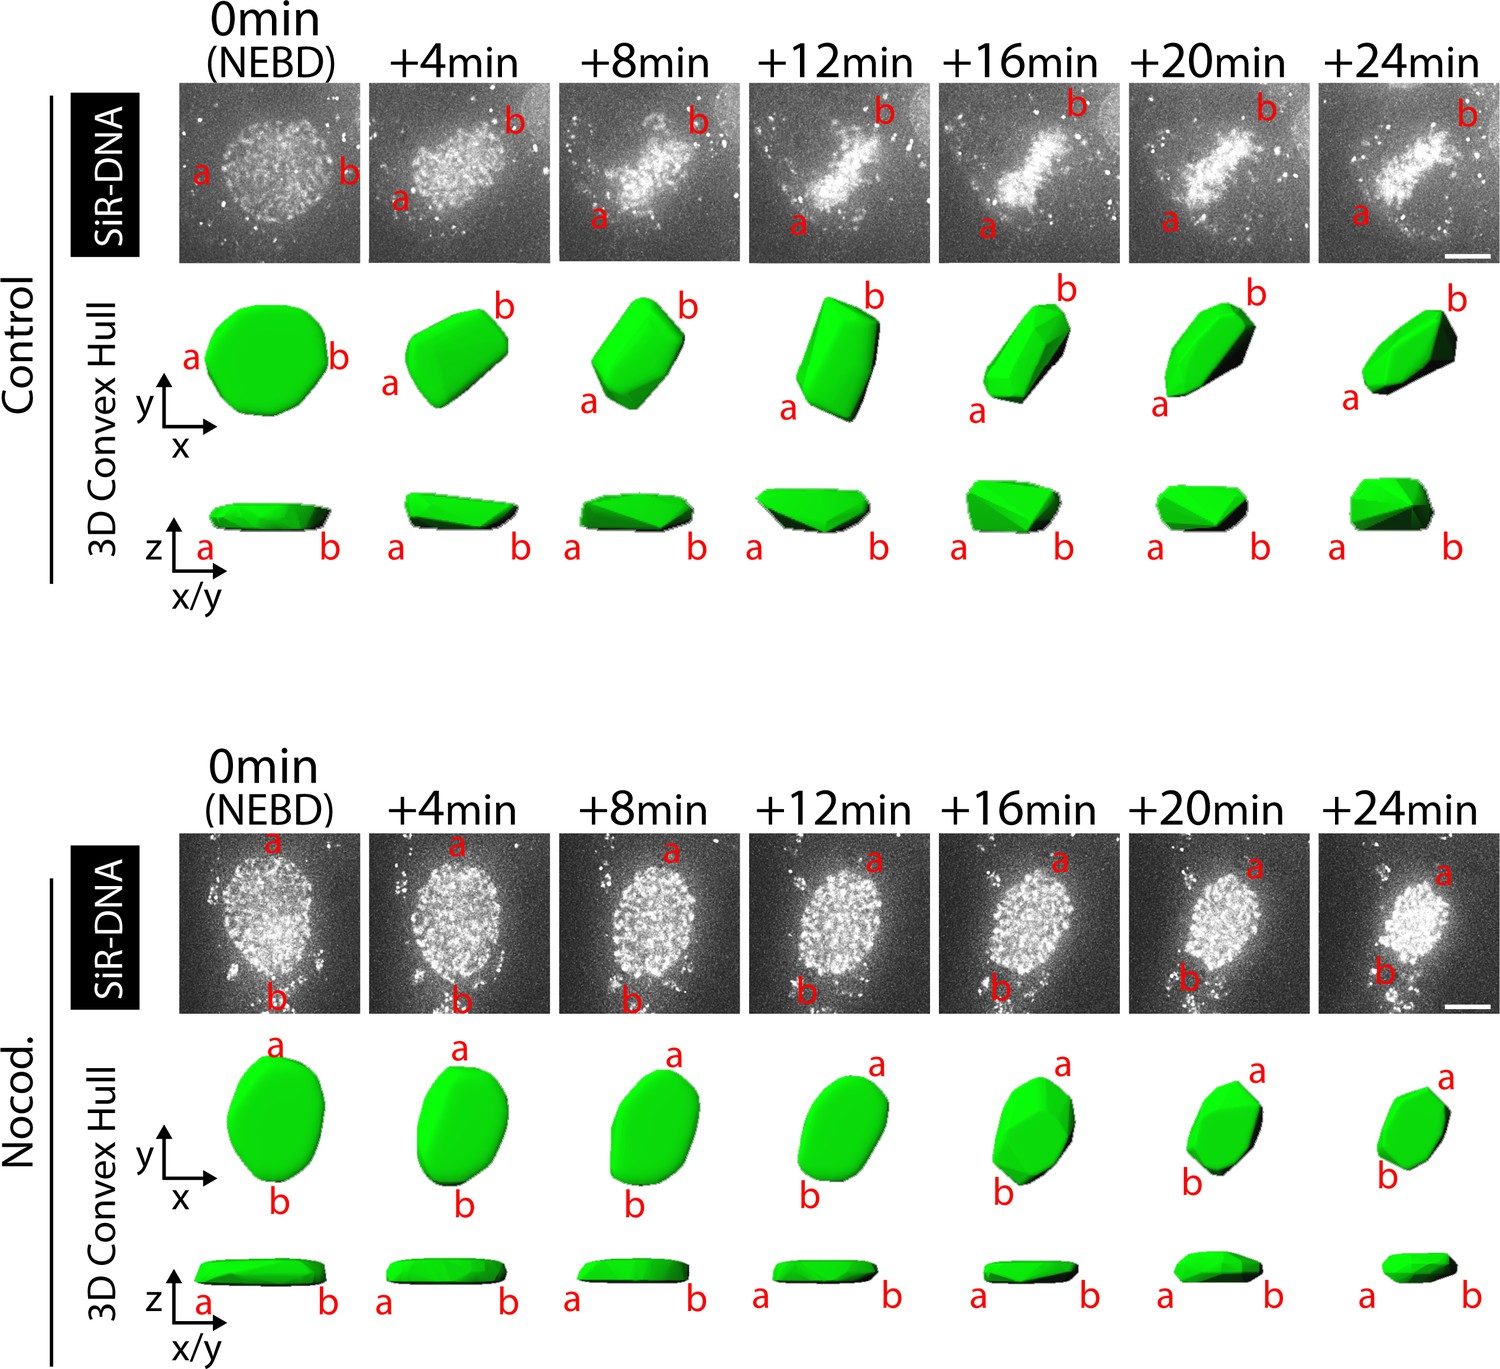
The chromosome distribution in three-dimensional space with and without nocodazole treatment.
The 3D convex hull of the cell in Figure 1C (top) is shown over the time course. The 3D convex hull (green) is viewed on two planes, that is x-y and z-x/y planes. ‘a’ and ‘b’ show the corresponding orientation in images and the 3D convex hull. Scale bars in images, 10 µm. The result suggests that chromosomes were spread more widely along the z-axis during +12 min to +24 min in the control cell than in the nocodazole-treated cell. This was generally the case when control cells and nocodazole-treated cells were compared. It explains why CSV are similar on average between the two conditions even if chromosomes are spread more widely on x-y planes during this period in nocodazole-treated cells than in control cells (Figure 1C).
Figure 1—figure supplement 5
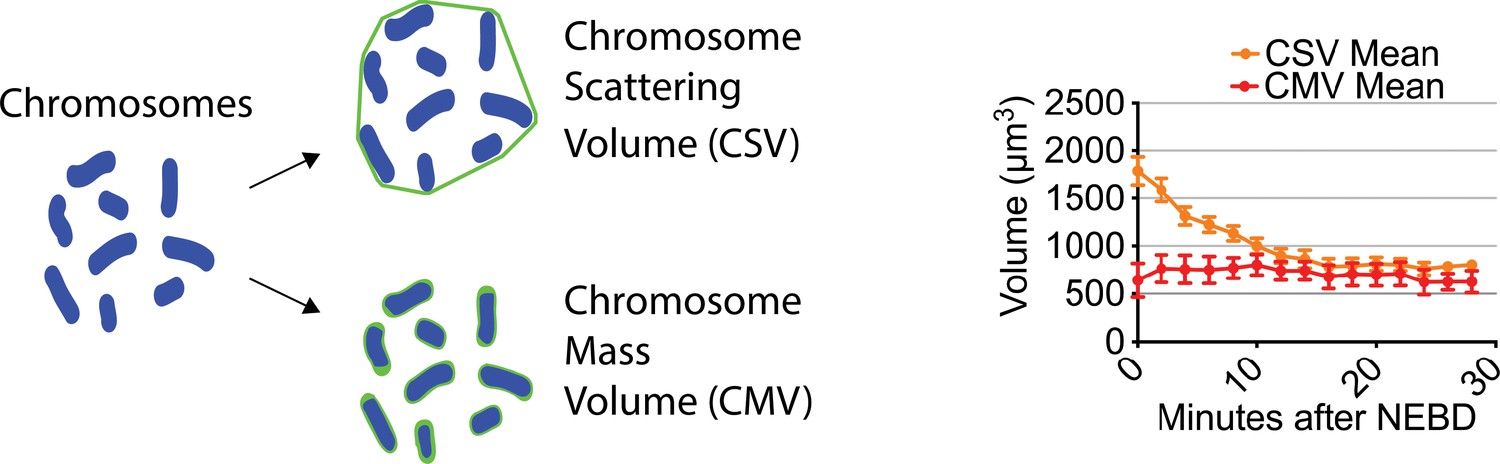
Chromosome mass volume did not considerably change after NEBD.
Diagram (left) shows how CSV (chromosome scattering volume) and CMV (chromosome mass volume) were determined. Graph (right) shows the mean of CMV (n = 3) and CSV (n = 8). CSV data are from Figure 3A. Error bars, s.e.m.
Figure 2 with 2 supplements
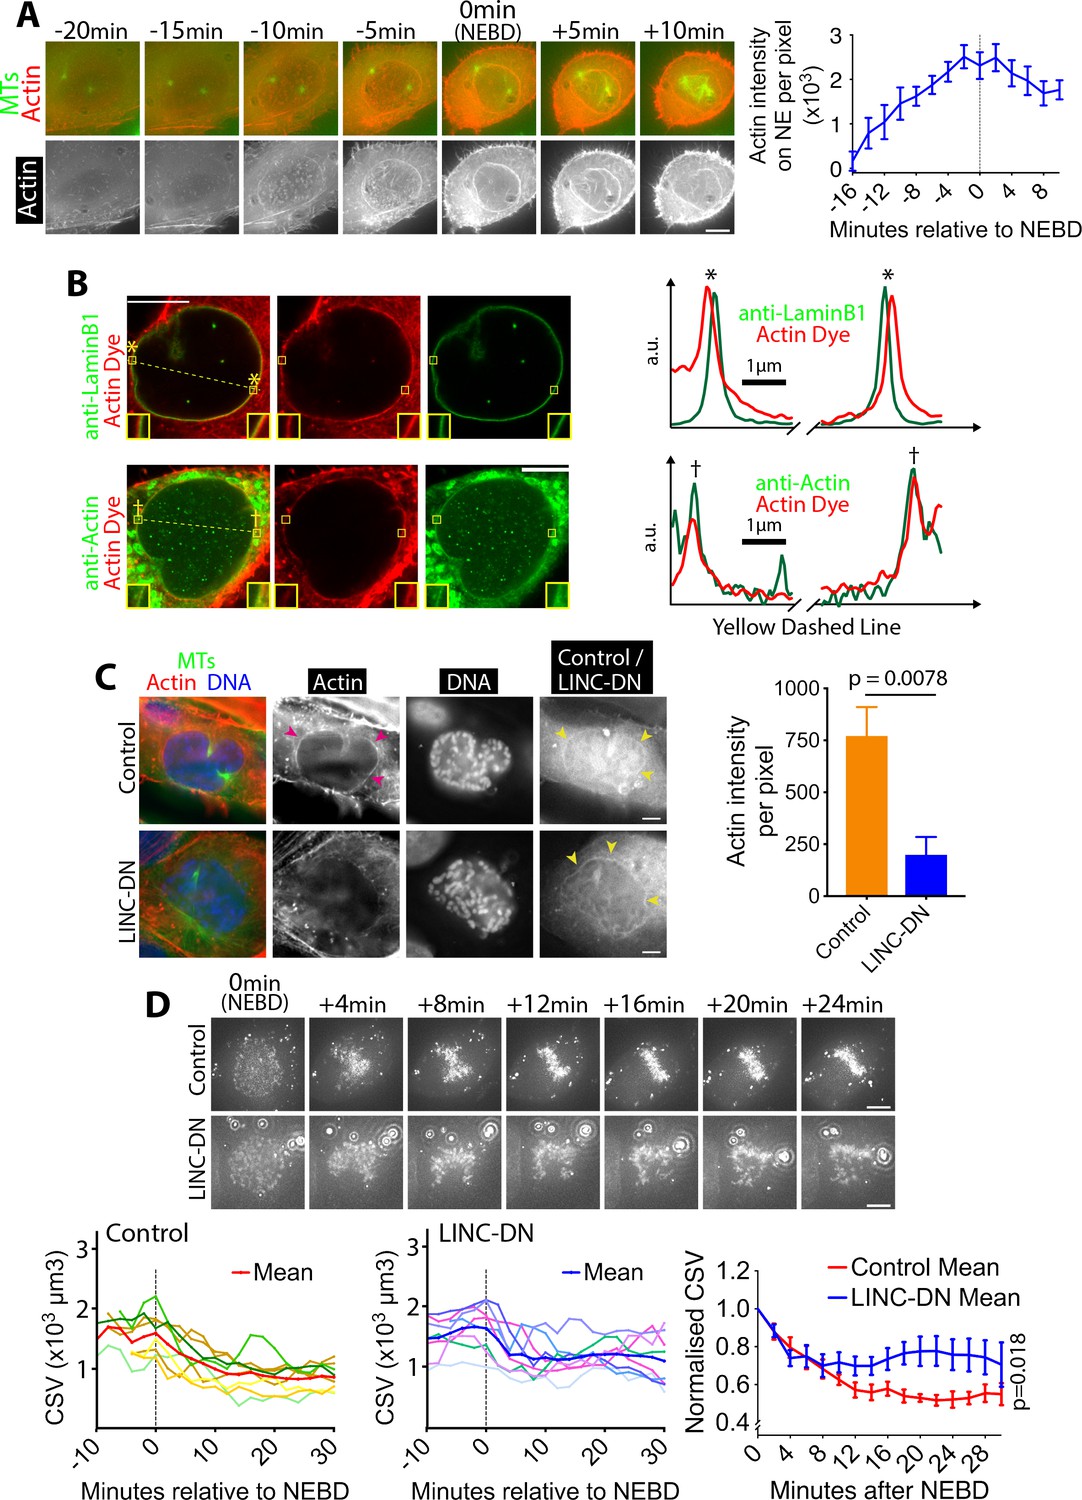
Actin accumulates outside of the NE in prophase, and its network shrinks after NEBD.
(A) Actin accumulates on the NE around NEBD. Images (z-projections) show a representative cell expressing GFP-tubulin and mCherry-Lifeact (that fluorescently marks F-actin). Time is relative to NEBD. Timing of NEBD was determined by the influx of cytoplasmic GFP-tubulin into the nucleus. Scale bars, 10 µm. Graph shows mean Lifeact fluorescence intensity (per pixel) around the nucleus over time (n = 8; error bars, s.e.m). (B) Actin localizes outside of the NE. Images show single super-resolution z-sections of cells, which were fixed and stained for actin with phalloidin (actin dye; red). Cells were also immunostained (green) with anti-Lamin B1 (top) or anti-actin antibody (bottom), respectively. The same secondary antibody was used for the two immunostainings. These cells were undergoing chromosome compaction (confirmed by DNA staining). Insets show magnification of the regions in yellow boxes. Scale bar, 10 µm. Graphs show intensity of actin dye (red) and immunostaining (green) along the dashed yellow lines in left images (middle parts are omitted). The peaks in graphs, marked with asterisks (top) and daggers (bottom), locate at the regions in yellow boxes in left images. a.u, arbitrary unit. (C) The LINC complex is required for accumulation of the actin network. Images show single z-sections of representative cells, expressing either an RFP-tagged LINC-DN construct (SR-KASH) or an RFP-tagged control construct (KASH∆L) (Luxton et al., 2010). Cells were stained for actin with phalloidin (red), DNA with Hoechst 33342 (blue) and MTs with anti-tubulin antibody (green). Right-hand-most images show RFP signals showing localisation of the LINC-DN or control construct. To focus on cells in prophase or early prometaphase, we analyzed cells where chromosome compaction had started and the centrosomes had separated, but bipolar spindle formation had not yet been completed. MK-1775 Wee1 inhibitor was used to make the same condition as in (D). Magenta arrowheads indicate the actin network on NE in control. Yellow arrowheads indicate localization of LINC-DN and its control on NE. Scale bars, 10 µm. Graph on right shows mean intensity of actin signal around the nucleus in cells expressing LINC-DN vs a control construct (control n = 18, LINC-DN n = 10). p value was obtained by t-test. Error bars, s.e.m. D)Removal of the actin network results in incomplete CSV reduction after NEBD. Images (z-projections) show a cell with SiR-DNA-stained chromosomes, expressing either LINC-DN or a control construct. Localization of LINC-DN and its control was as (C). MK-1775 was used in both conditions to allow cells to enter mitosis. Time is relative to NEBD. Timing of NEBD was determined by observation that GFP-LacI-NLS spread out of the nucleus (Figure 1—figure supplement 1). Scale bars, 10 µm, Left-hand and center graphs show CSV measurements in individual cells expressing control and LINC-DN constructs, respectively (n = 8 each). The right-hand graph compares the means of normalized CSV (as in Figure 1B). Error bars, s.e.m. p value (control vs LINC-DN) was obtained by two-way ANOVA.
-
Figure 2—source data 1
Data at individual time points in individual cells.
- https://doi.org/10.7554/eLife.46902.013
Figure 2—figure supplement 1

The volume inside of the actin network is rapidly reduced after NEBD.
Graph shows the mean of normalized volume inside the actin network (normalized to the volume at NEBD in each cell) after NEBD (n = 7). Error bars, s.e.m. p-value was determined by one-way ANOVA for data during 0–6 min. Note that it was difficult to quantify this volume after 6 min because actin signals were not continuous on the NE remnant region.
Figure 2—figure supplement 2
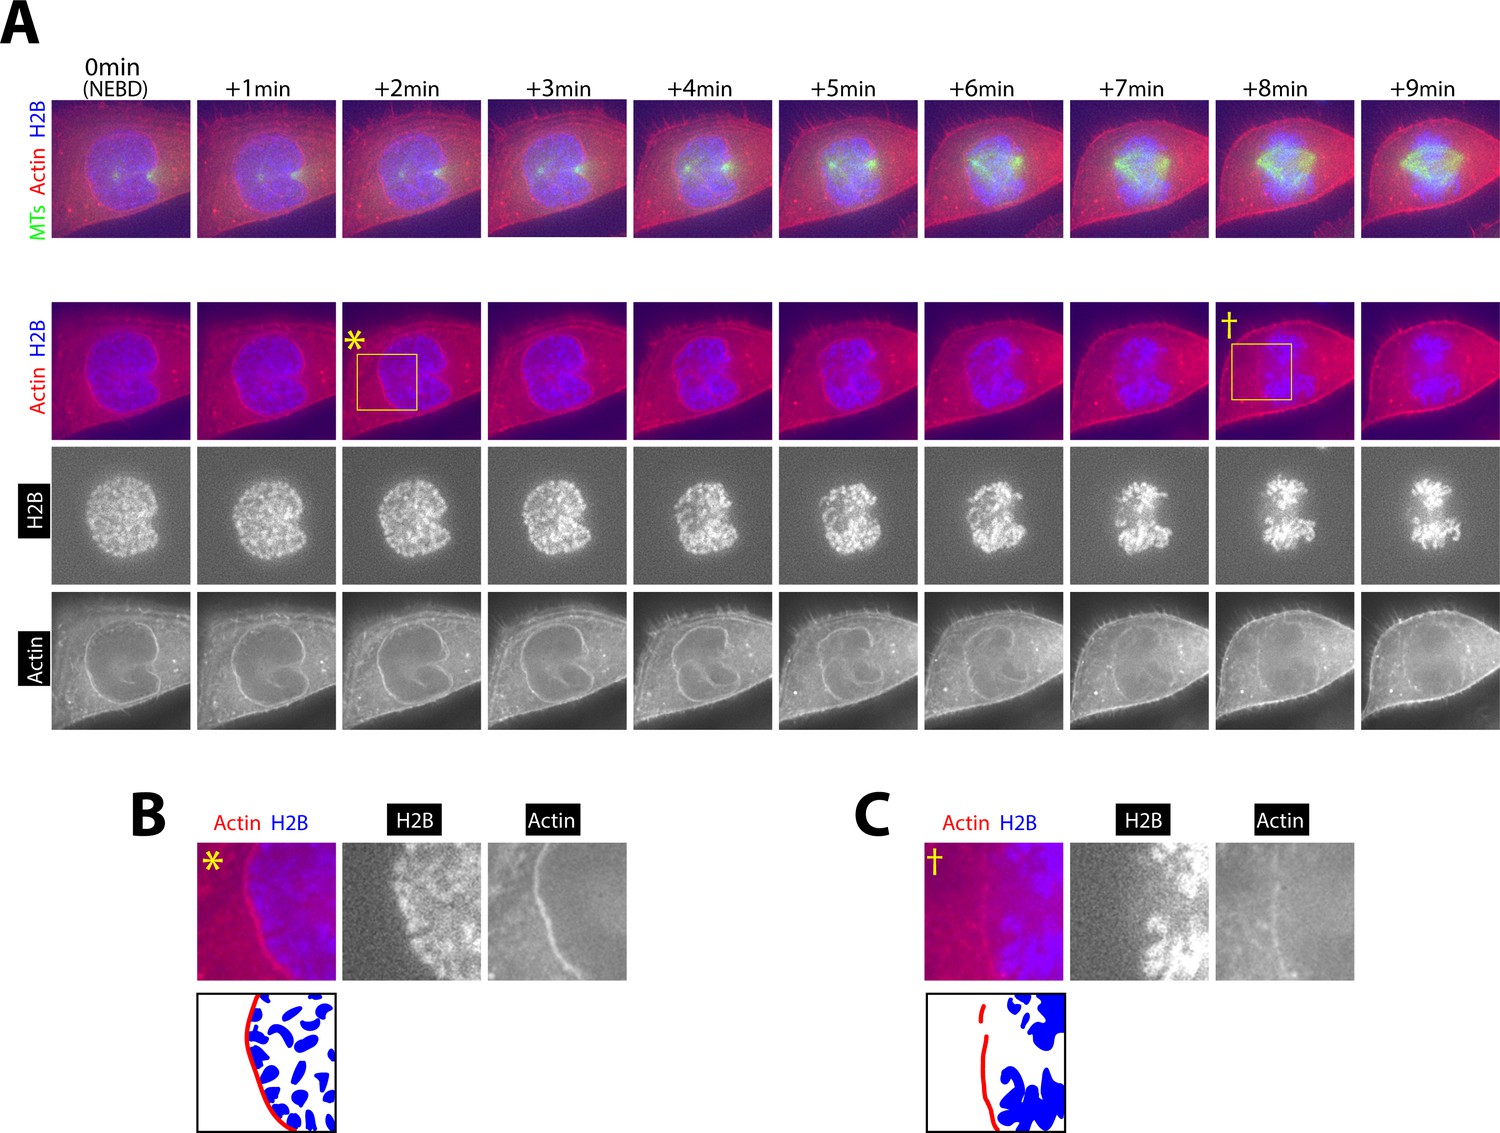
During contraction of the actin network, outermost chromosomes are located right beneath the network.
Images show projections of five z-sections (A, top row) and two z-sections (A, other rows) of a representative cell, expressing histone 2B (H2B)-cerulean, GFP-Tubulin and mCherry-Lifeact, in early mitosis. Yellow rectangles at 2 min and 8 min indicate the region magnified in the images in B and C. Timing of NEBD (time zero) was determined by influx of GFP-tubulin into the nucleus. Scale bars, 10 µm.
Figure 3 with 6 supplements
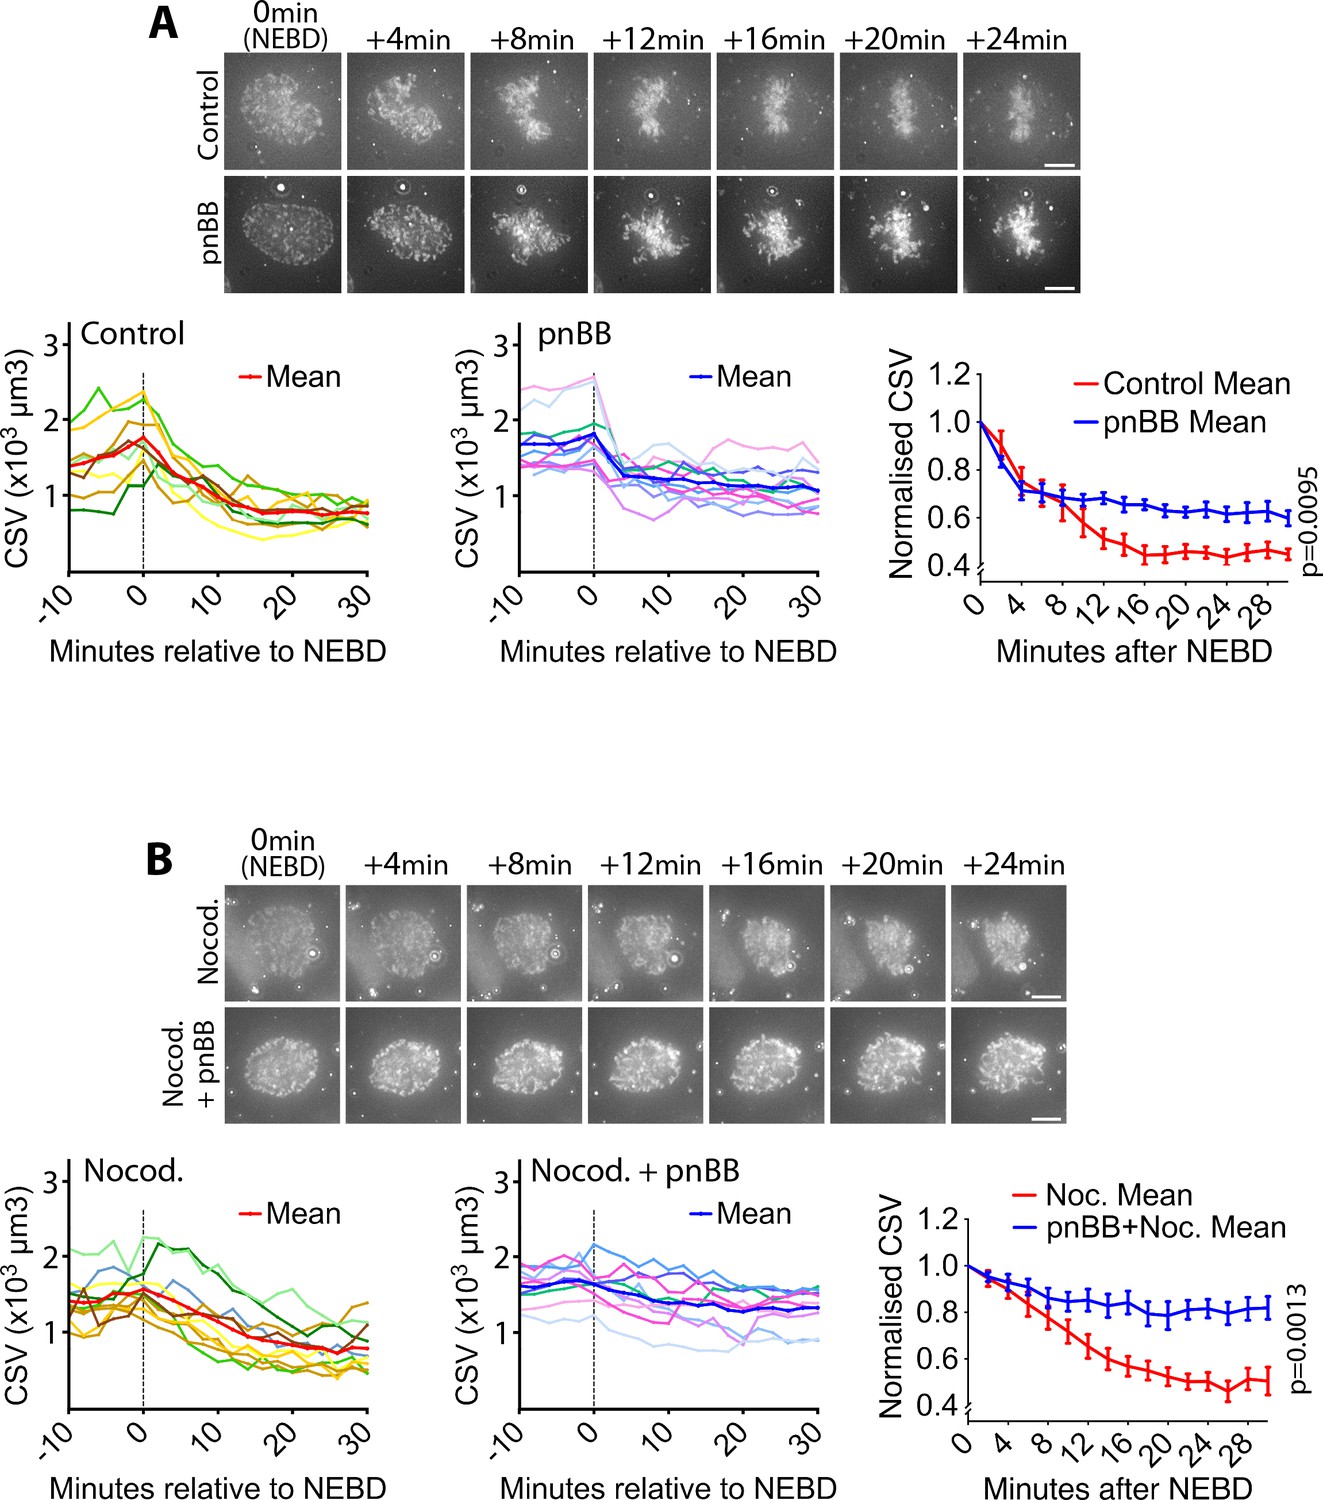
Myosin II activity is required for the CSV reduction after NEBD.
(A) Inhibition of myosin II activity alleviates CSV reduction after NEBD. Images (z-projections) show representative cells with SiR-DNA-stained chromosomes, which entered mitosis in the presence of 50 µM paranitroblebbistatin (pnBB, bottom) or DMSO (control, top). Time was relative to NEBD. Timing of NEBD was determined by observation that GFP-LacI-NLS spread out of the nucleus (Figure 1—figure supplement 1). Scale bars, 10 µm. Left-hand and center graphs show CSV measurements in individual control and pnBB-treated cells, respectively (pnBB, n = 10; control, n = 8). The right-hand graph compares the means of normalized CSV (as in Figure 1B) in each condition. Error bars = s.e.m. p value (control vs pnBB) was obtained by two-way ANOVA. (B) CSV reduction is almost completely alleviated when myosin II activity is inhibited in the absence of MTs. Images (z-projections) show representative cells with SiR-DNA-stained chromosomes, which entered mitosis in the presence of 3.3 µM nocodazole plus 50 µm pnBB (Nocod. + pnBB, bottom), or 3.3 µM nocodazole (Nocod., top). 0.5 µM MK-1775 Wee1 inhibitor was used to allow cells to enter mitosis in both conditions. Time was relative to NEBD. Timing of NEBD was determined by observation that GFP-LacI-NLS spread out of the nucleus (Figure 1—figure supplement 1). Scale bars, 10 µm. Left-hand and center graphs show CSV measurements in individual cells treated by nocodazole alone and by nocodazole plus pnBB, respectively (nocodazole treated n = 10, nocodazole and pnBB treated n = 9). The right-hand graph compares the means of normalized CSV (as in Figure 1B) in each condition. Error bars = s.e.m. p-Value (nocodazole vs pnBB +Nocodazole) was obtained by two-way ANOVA.
-
Figure 3—source data 1
Data at individual time points in individual cells.
- https://doi.org/10.7554/eLife.46902.024
Figure 3—figure supplement 1
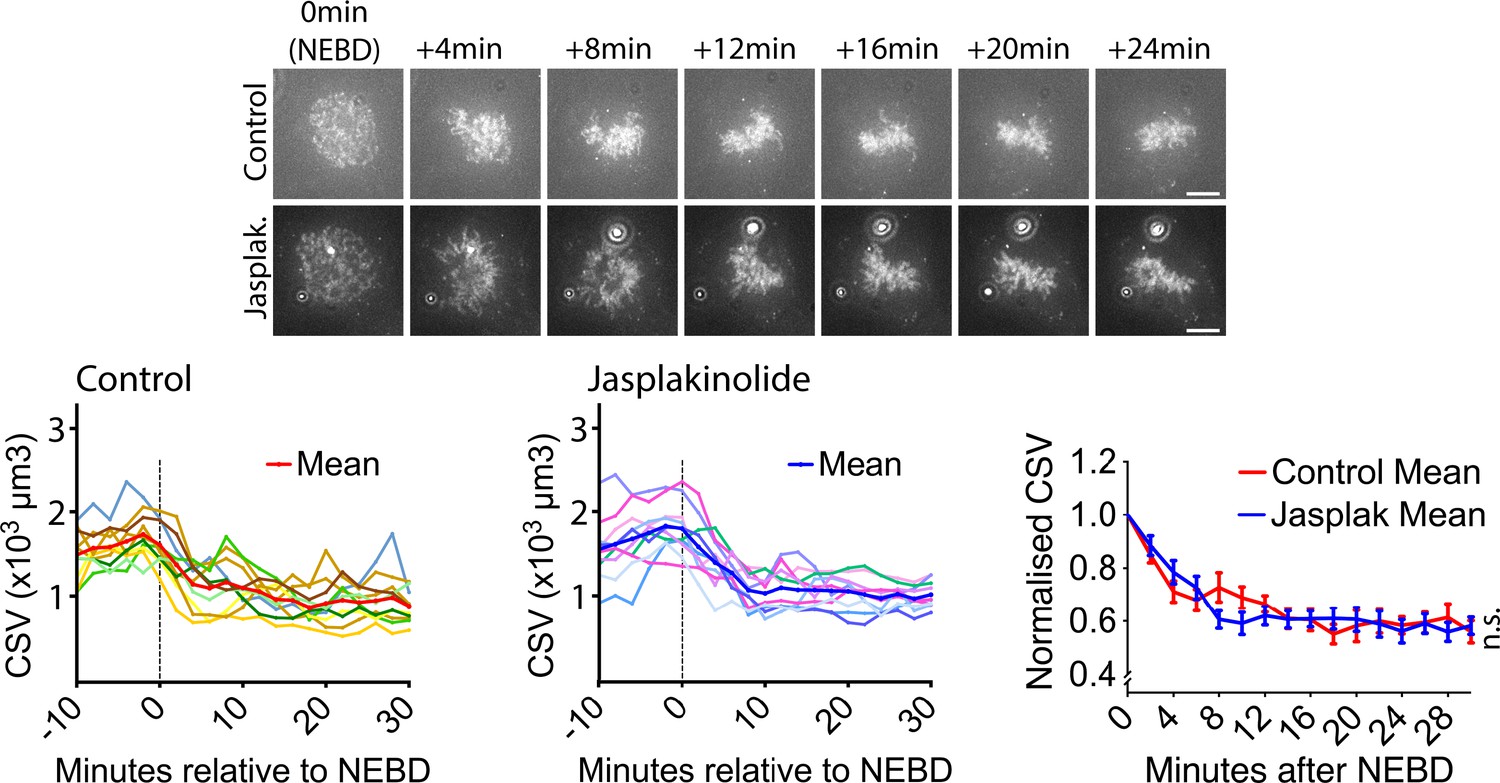
Actin depolymerization inhibitor does not change CSV reduction after NEBD.
Images (z-projections) show SiR-DNA-stained chromosomes in representative cells incubated in the presence of 1 µM jasplakinolide (Jasplak., bottom) or DMSO (control, top). Time is relative to NEBD. Timing of NEBD was determined by observation that GFP-LacI-NLS spread out of the nucleus (Figure 1—figure supplement 1). Scale bars, 10 µm. Left-hand and center graphs show CSV measurements in individual cells in control and with jasplakinolide, respectively (n = 10 each). The right-hand graph compares the means of normalized CSV (as in Figure 1B). Error bars. s.e.m. n.s. = not significant (control vs jasplakinolide-treated), determined by two-way ANOVA.
Figure 3—figure supplement 2
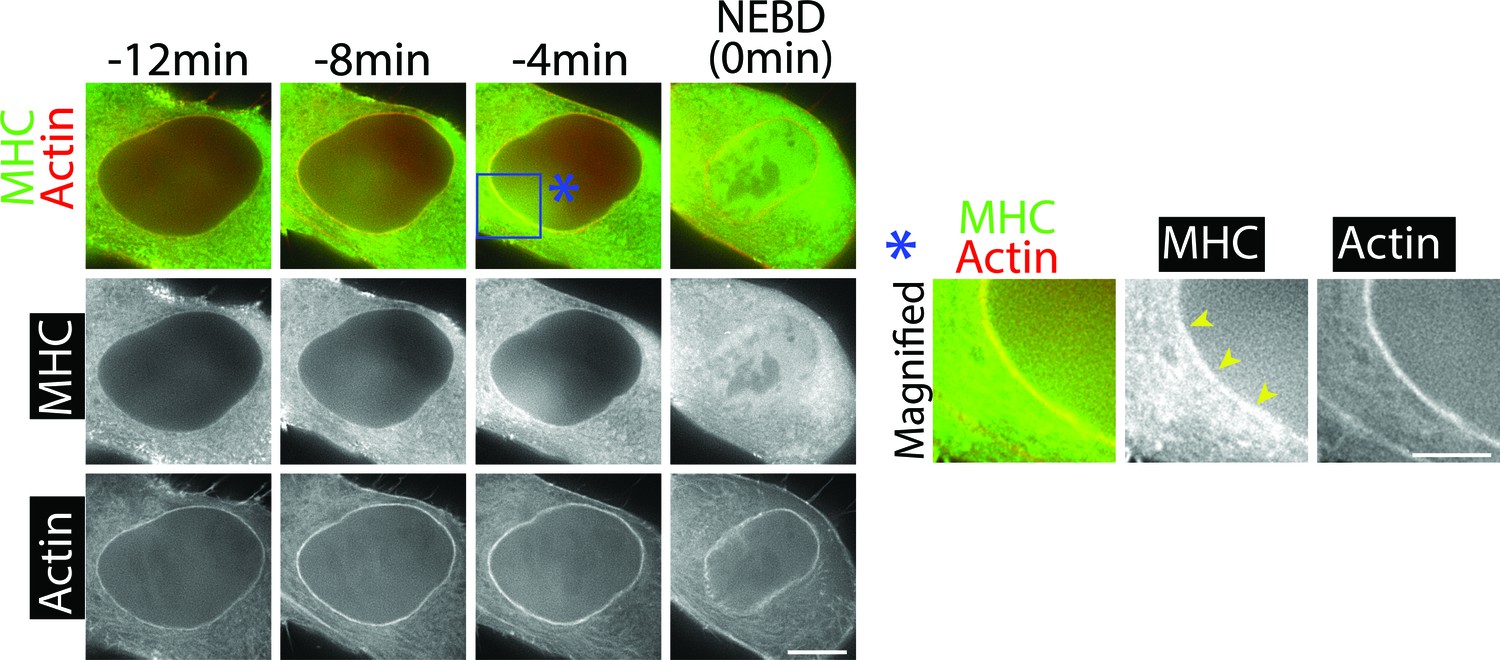
Myosin II co-localizes with the actin network on the NE in prophase.
Images on left (single Z-sections) show a representative cell expressing mCherry-Lifeact and GFP-NMHCII-A (GFP-tagged Myosin II-A heavy chain). MHC denotes myosin II heavy chain. Scale bars, 10 µm. Images on right show magnification of the rectangle region at −4 min in the image at left. Yellow arrowheads indicate MHC signals co-localizing with the NE-associated actin network. Scale bars, 5 µm. Time is shown relative to NEBD, whose timing was determined by the influx of GFP-NMHC-II A into the nucleus.
Figure 3—figure supplement 3
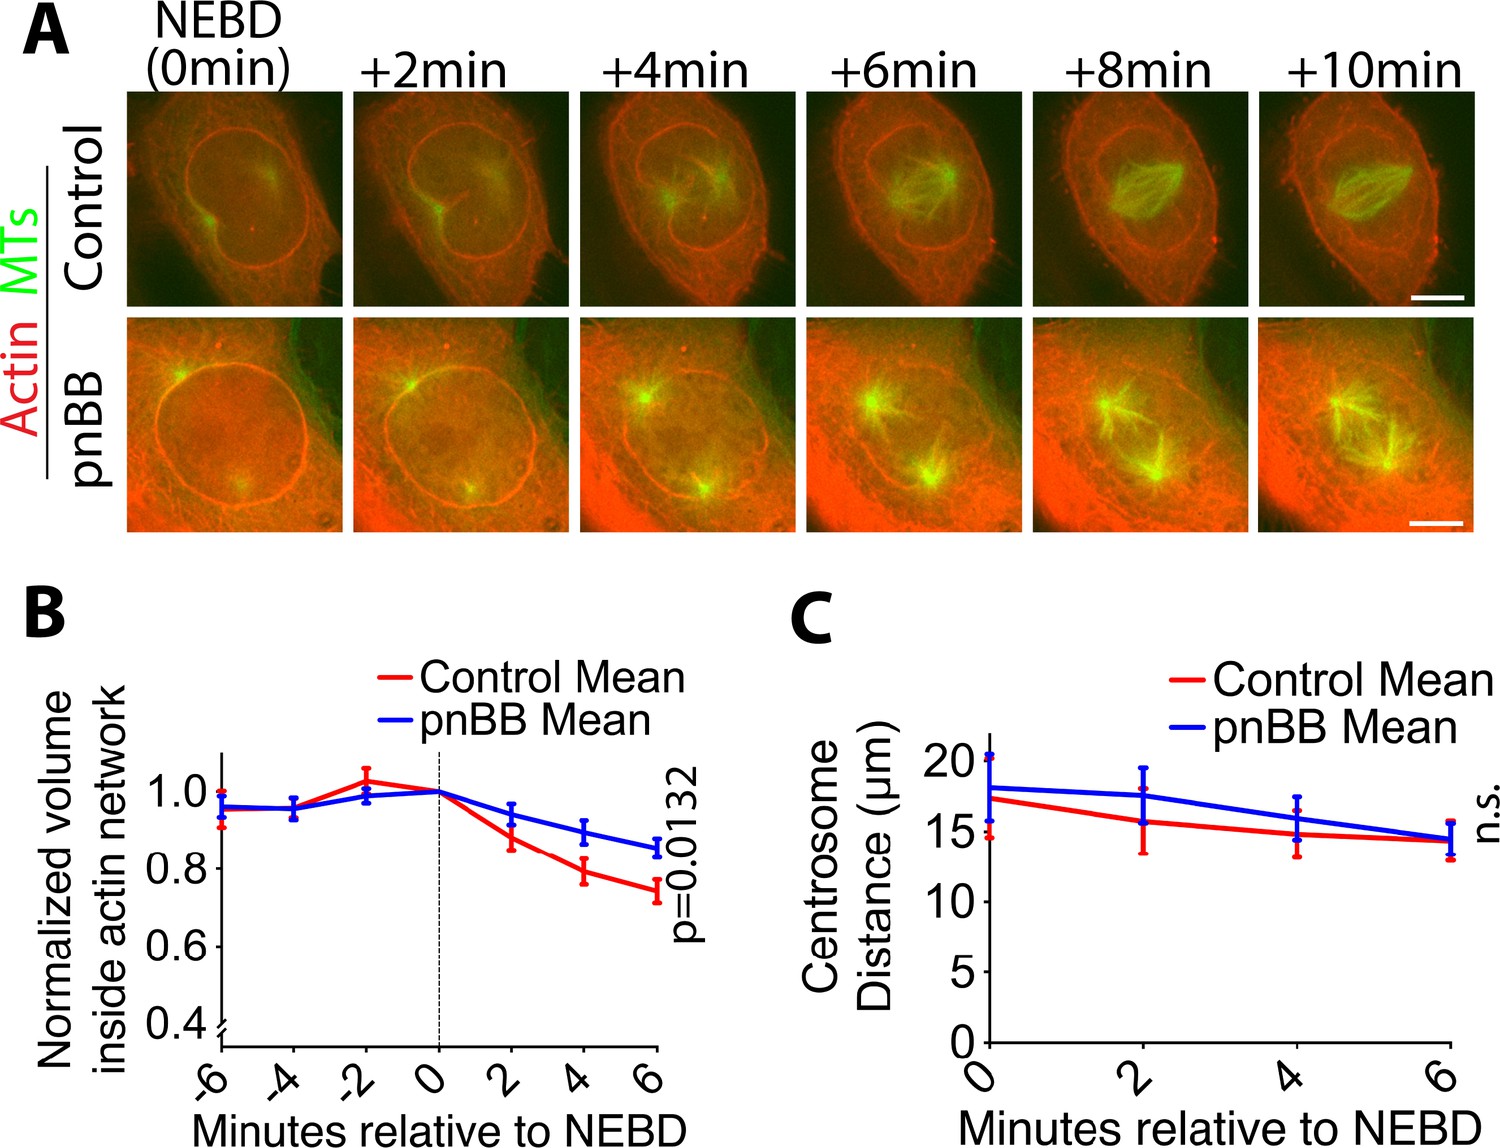
Myosin II inhibition alleviates contraction of the actin network on the NE remnant after NEBD.
(A) Images (projections of two consecutive z-sections where spindle poles were in focus) show representative cells expressing GFP-tubulin and mCherry-Lifeact in the presence of 50 µM paranitroblebbistatin (pnBB, bottom) or DMSO (control, top). Scale bars, 10 µm. Timing of NEBD was determined by influx of GFP-tubulin into the nucleus. (B) Graph shows the mean of normalized volume inside the actin network (normalized to the volume at NEBD in each cell) after NEBD in the presence (blue line) and absence (red line) of pnBB (n = 8 each). p-Value (control vs pnBB) was obtained by two-way ANOVA. Error bars, s.e.m. (C) Graph shows mean centrosome distance soon after NEBD in the presence (blue line) and absence (red line) of pnBB. n = 8 in both conditions. p-Value (control vs pnBB) was obtained by two-way ANOVA. n.s., not significant. Error bars, s.e.m.
Figure 3—figure supplement 4
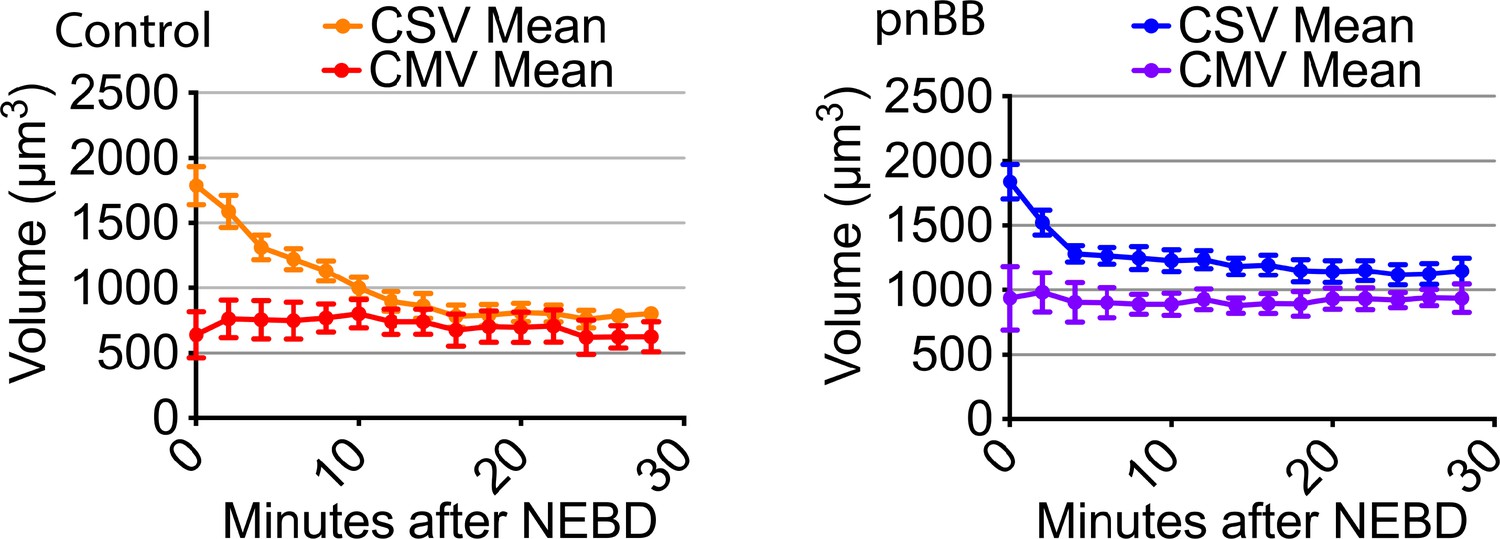
Myosin II inhibition does not affect chromosome mass volume (CMV) after NEBD.
Graphs show means of CSV and CMV in the presence (right, pnBB) and absence (left, control) of 50 µM pnBB (CSV n = 10, CMV n = 3; error bars. s.e.m.). CSV data are from Figure 3A. Graph at left-hand is identical to the graph in Figure 1—figure supplement 5 and shown here again for comparison.
Figure 3—figure supplement 5
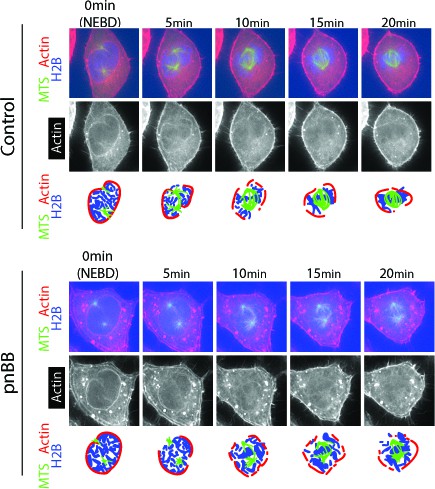
Myosin II inhibition often leaves the actin network extending beyond the spindle poles soon after NEBD.
Images (projections of two consecutive z-sections where spindle poles were in focus) show representative cells expressing GFP-tubulin, mCherry-Lifeact and H2B-cerulean in the presence of 50 µM paranitroblebbistatin (pnBB, bottom) or DMSO (control, top). Scale bars, 10 µm. Diagrams indicate position of actin network, chromosomes and MTs/spindle poles. Timing of NEBD was determined by influx of GFP-tubulin (not incorporated to MTs) into the nucleus. In the representative pnBB-treated cell shown here, the actin network extends beyond a spindle pole after NEBD (5–20 min); this is particularly clear at the spindle pole in bottom.
Figure 3—figure supplement 6
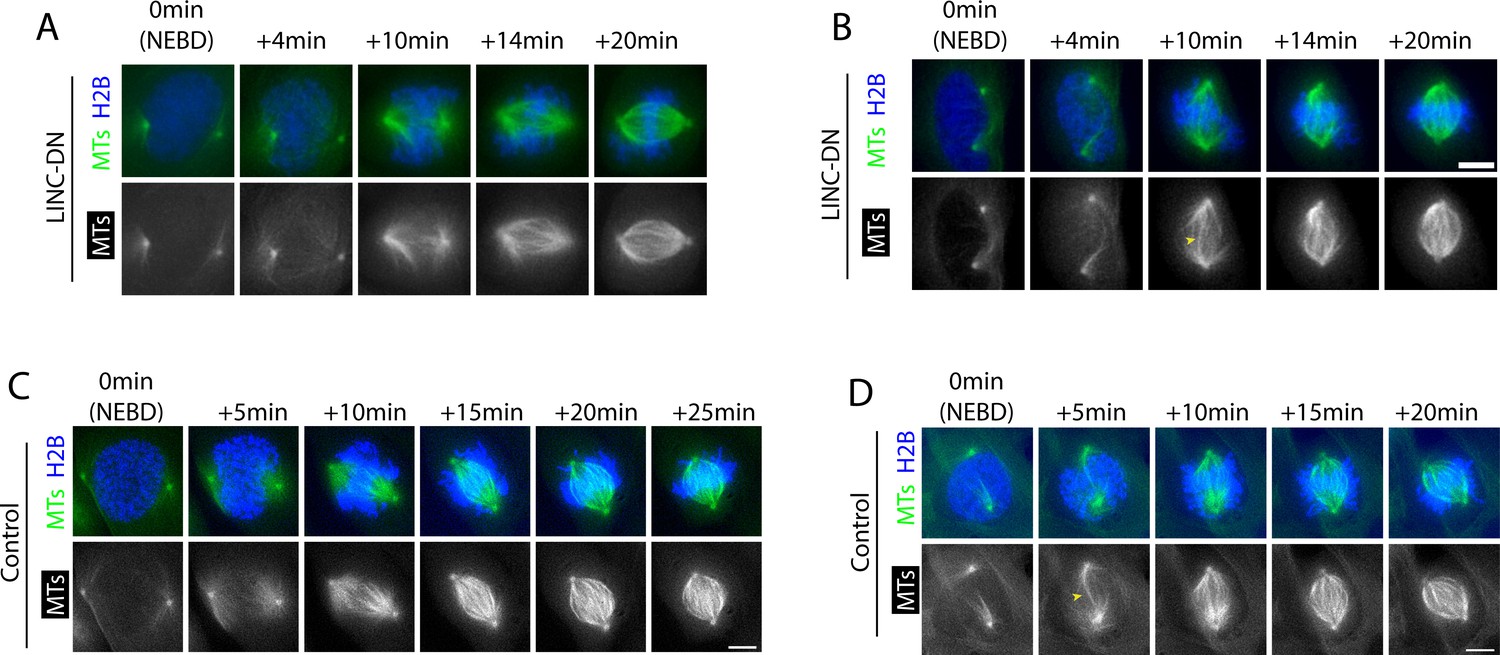
Atypical spindle morphology is found in LINC-DN-expressing and control cells, soon after NEBD.
We observed that LINC-DN-expressing and pnBB-treated cells sometimes showed atypical spindle morphology, which includes (A) spindle MTs extending from a pole in wide-ranging directions (A) in the current figure, LINC-DN,+10 and+14 min; Figure 3—figure supplement 3, pnBB,+8 and+10 min) and (B) a bundle of inter-polar MTs (B) in the current figure, LINC-DN,+10 min, yellow arrow head; Figure 3—figure supplement 5, pnBB,+10 min). Such atypical spindle morphology is also found in control cells during the early stage of bipolar-spindle formation; (A) is shown in (C) at +10 min, while (B) is shown in D at +5 min (yellow arrow head). As far as we observed, it did not seem that there were obvious difference in the spindle morphology between control cells, LINC-DN expressing cells and pnBB-treated cells.
Figure 4

Local inhibition of myosin II activity results in local alleviation of CSV reduction.
(A) Diagram shows that azidoblebbistatin (azBB) is covalently linked to the myosin II heavy chain and inhibits its activity in the half of the nucleus exposed to infrared light. (B) Images (projections of three z-sections) show SiR-DNA-stained chromosomes in representative cells that were incubated in the presence of 5 µM azidoblebbistatin (azBB, right) or DMSO (control, left). The half of the nucleus in blue and green was exposed to 860 nm light just prior to NEBD, while the half in red and orange was not. Time was relative to NEBD. Timing of NEBD was determined by observation that GFP-LacI-NLS spread out of the nucleus (Figure 1—figure supplement 1). Scale bars, 10 µm. Diagrams show how the indicated area was reduced at +4 min, relative to the area at NEBD. (C) Graphs show means of normalized CSV in half of the nucleus, which was exposed vs non-exposed to infra-red (IR), in the presence (bottom) and absence (top) of azBB (control n = 5, azBB n = 7). Colors of lines match the colors that border the half nuclei in D. p-Value (exposed vs non-exposed to IR) was obtained by two-way ANOVA. n.s., not significant. Error bars, s.e.m. CSV was normalized as in Figure 1B.
-
Figure 4—source data 1
Data at individual time points in individual cells.
- https://doi.org/10.7554/eLife.46902.028
Figure 5 with 4 supplements
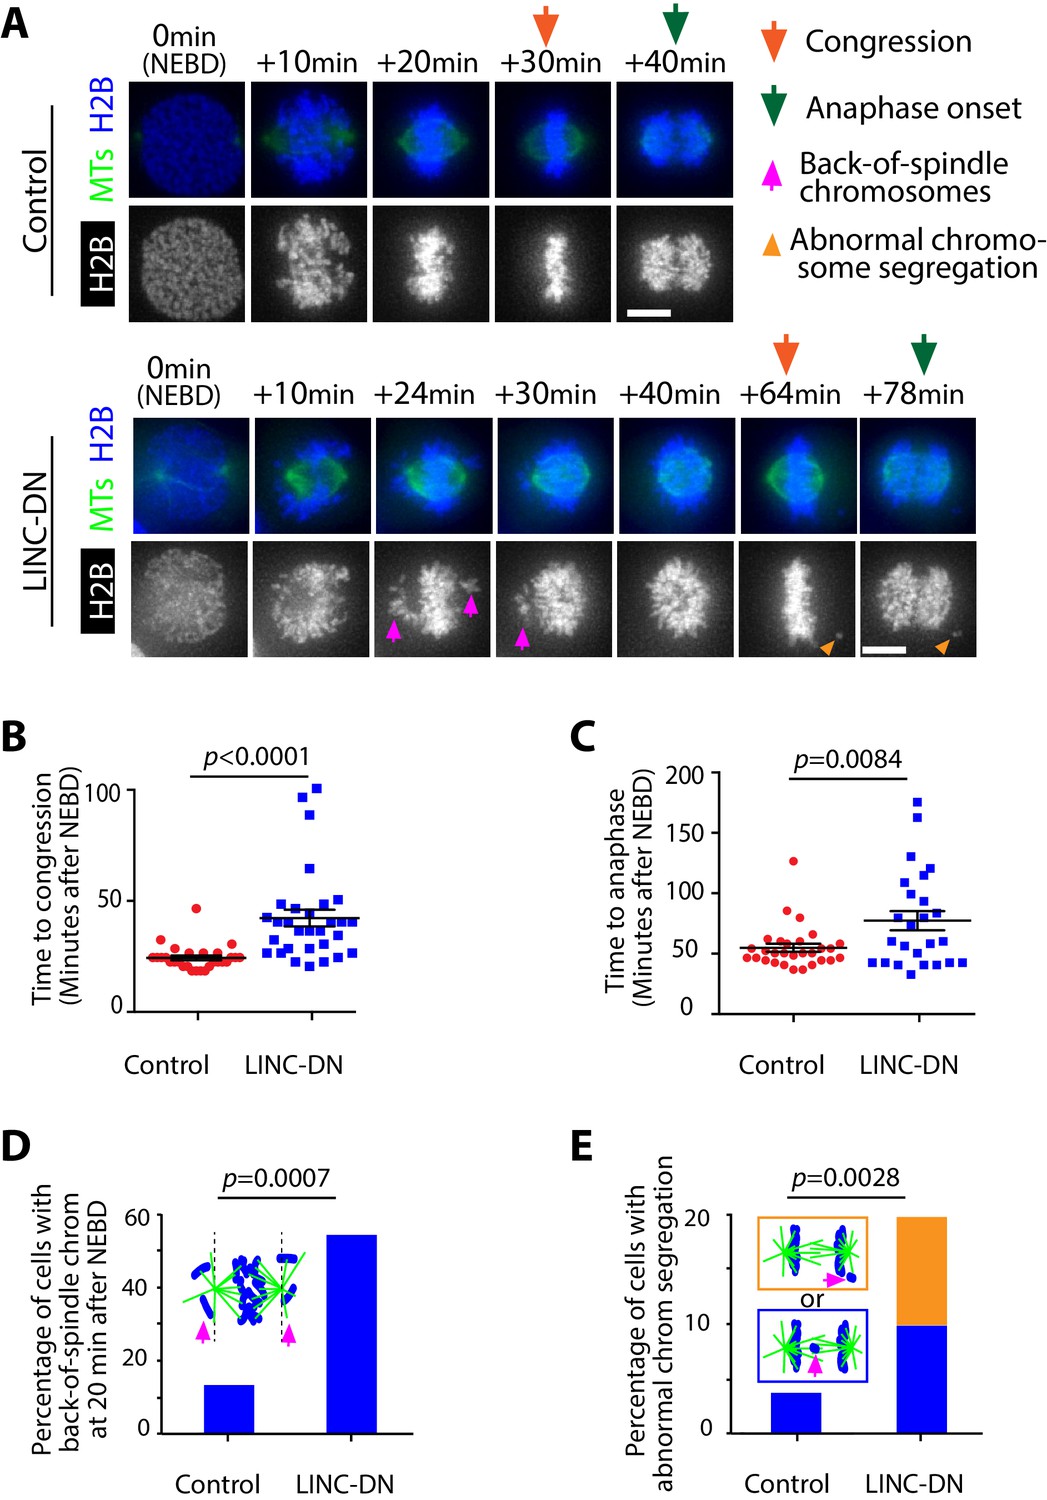
Evidence that removal of actin network delays chromosome congression and anaphase onset, and increases frequency of abnormal chromosome segregation.
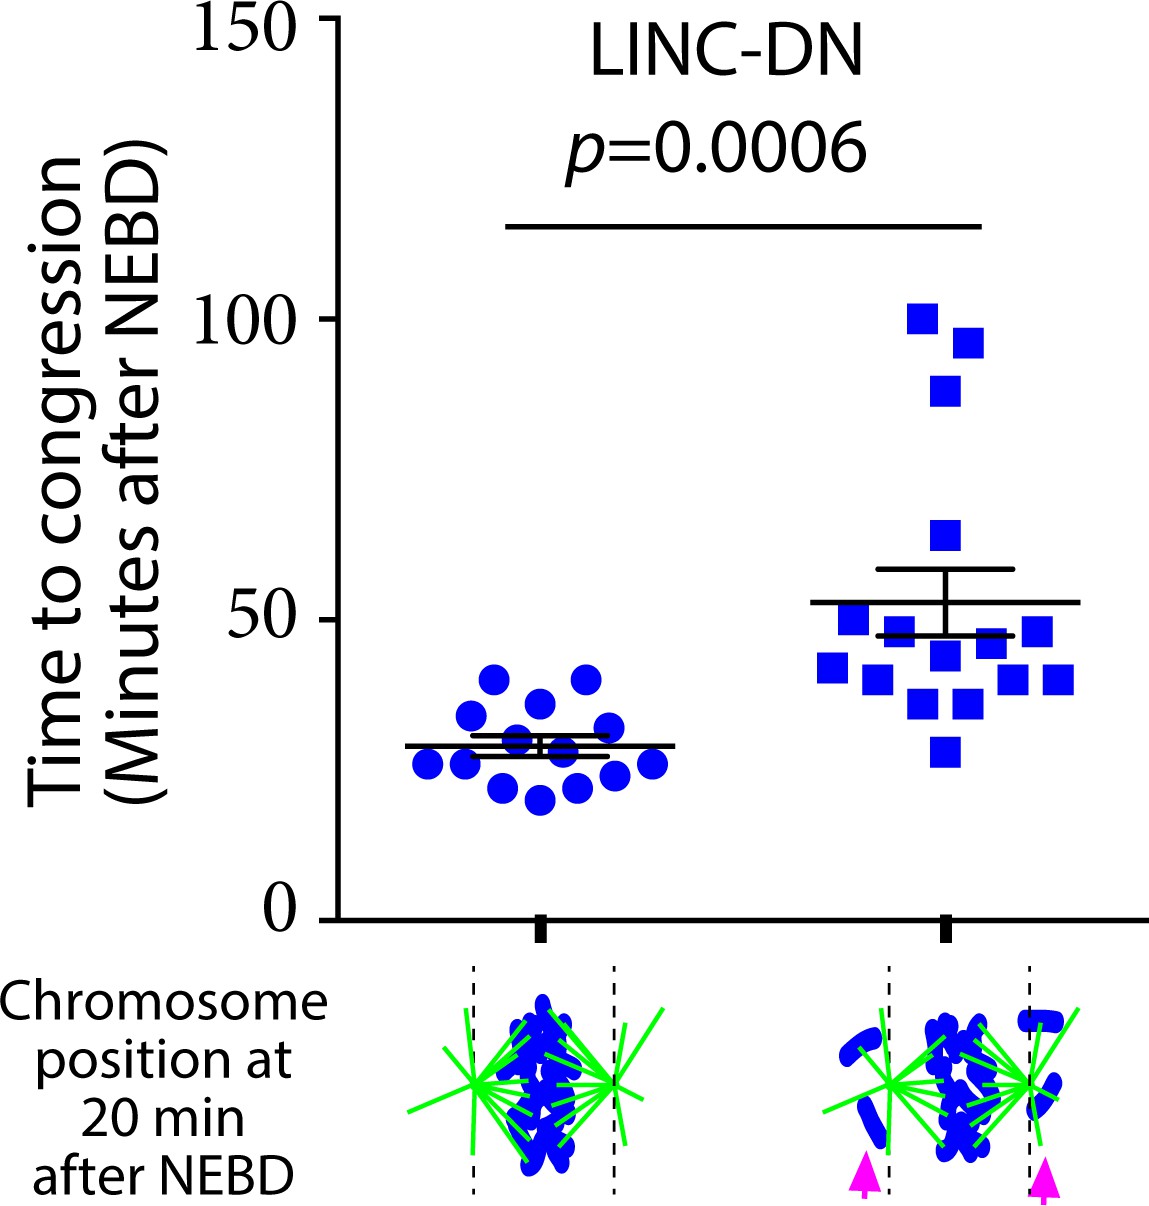
(A) Images (z-projections) show representative cells expressing histone 2B (H2B)-cerulean and GFP-tubulin. They progress from NEBD to anaphase, expressing either LINC-DN or a control construct. Orange arrows indicate time points at which congression was completed, while green arrows indicate time points of anaphase onset. Magenta arrows indicate chromosomes at backside of the spindle (back-of spindle chromosomes; see D). Light orange arrowheads indicate abnormal chromosome segregation during anaphase (see E). (B) Graph compares time (minutes) from NEBD to chromosome congression in cells expressing LINC-DN (n = 30) versus a control construct (n = 28). p-Value was obtained by t-test, error bars = s.e.m. (C) Graph compares time (minutes) from NEBD to the anaphase onset in cells expressing LINC-DN (n = 25) versus a control construct (n = 29). p-Value was obtained by t-test, error bars = s.e.m. (D) Graph shows the percentage of cells with chromosomes at backside of the spindle (back-of-spindle chromosomes) at 20 min after NEBD in cells expressing LINC-DN (n = 37) versus a control construct (n = 31). p value was obtained by Fisher’s exact test. (E) Graph shows the percentage of cells with abnormal chromosome segregation during anaphase, in cells expressing LINC-DN (n = 41) versus a control construct (n = 83). Two types of abnormal chromosome segregation were observed in LINC-DN-expressing cells during anaphase, that is chromosomes at the back-of-spindle (orange) and lagging chromosomes between two poles (blue), which were color-coded in diagram and separately counted in graph. p-Value was obtained by Fisher’s exact test (three categories; normal segregation and two types of abnormal segregation).
-
Figure 5—source data 1
Data in individual cells.
- https://doi.org/10.7554/eLife.46902.034
Figure 5—figure supplement 1
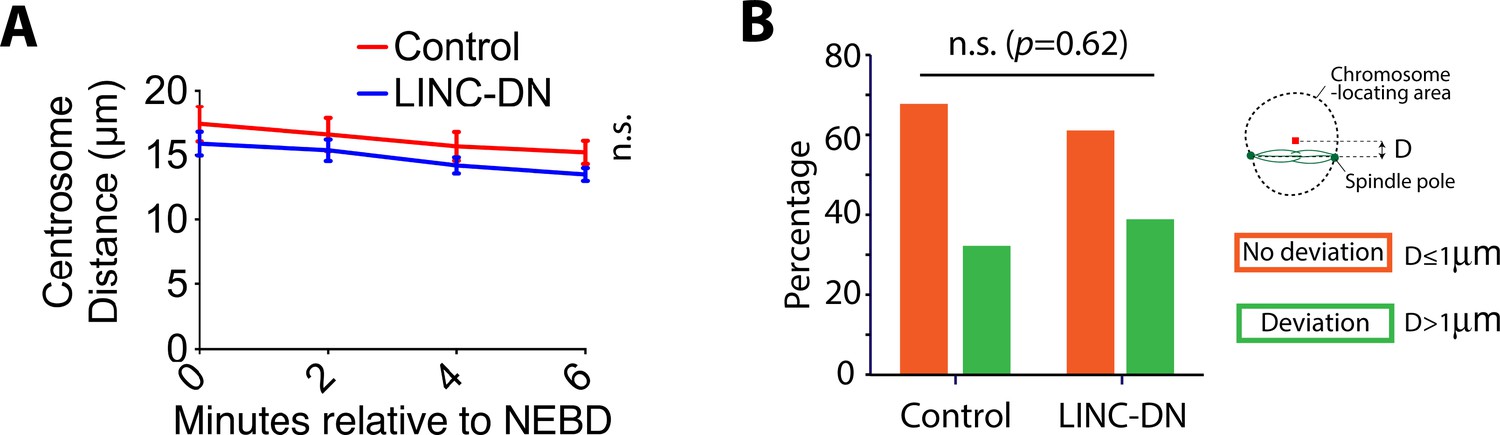
LINC-DN expression did not change the distance between centrosomes and did not cause deviation of the spindle from the center of the nucleus.
(A) Images acquired for Figure 5A were analyzed further. Graph shows the mean centrosome distance after NEBD in cells expressing a control construct (n = 33) or LINC-DN (n = 35). Error bars, s.e.m. p-Value (control vs LINC-DN) was obtained by two-way ANOVA. n.s., not significant. (B) Images acquired for Figure 5A were analyzed further. Graph shows the deviation of the spindle from the center of the chromosome-locating area, at 10 min after NEBD, in cells expressing a control construct (n = 31) or LINC-DN (n = 35). When the spindle axis is more (or less) than 1 µm from the center of the chromosome-locating area, it was scored that the spindle axis deviated (or not deviated) from the center. n.s., not significant, determined by Fisher’s exact test.
Figure 5—figure supplement 2
The presence of back-of-spindle chromosomes soon after NEBD leads to a delay in chromosome congression.
Graph compares time (minutes) from NEBD to chromosome congression in cells expressing LINC-DN with (right, n = 16) versus without (left, n = 14) back-of-spindle chromosomes (magenta arrows) at 20 min after NEBD. Images acquired for Figure 5A were analyzed further. p value was obtained by t-test.
Figure 5—figure supplement 3
pnBB treatment delays chromosome congression and anaphase onset, and increases frequency of abnormal chromosome segregation.
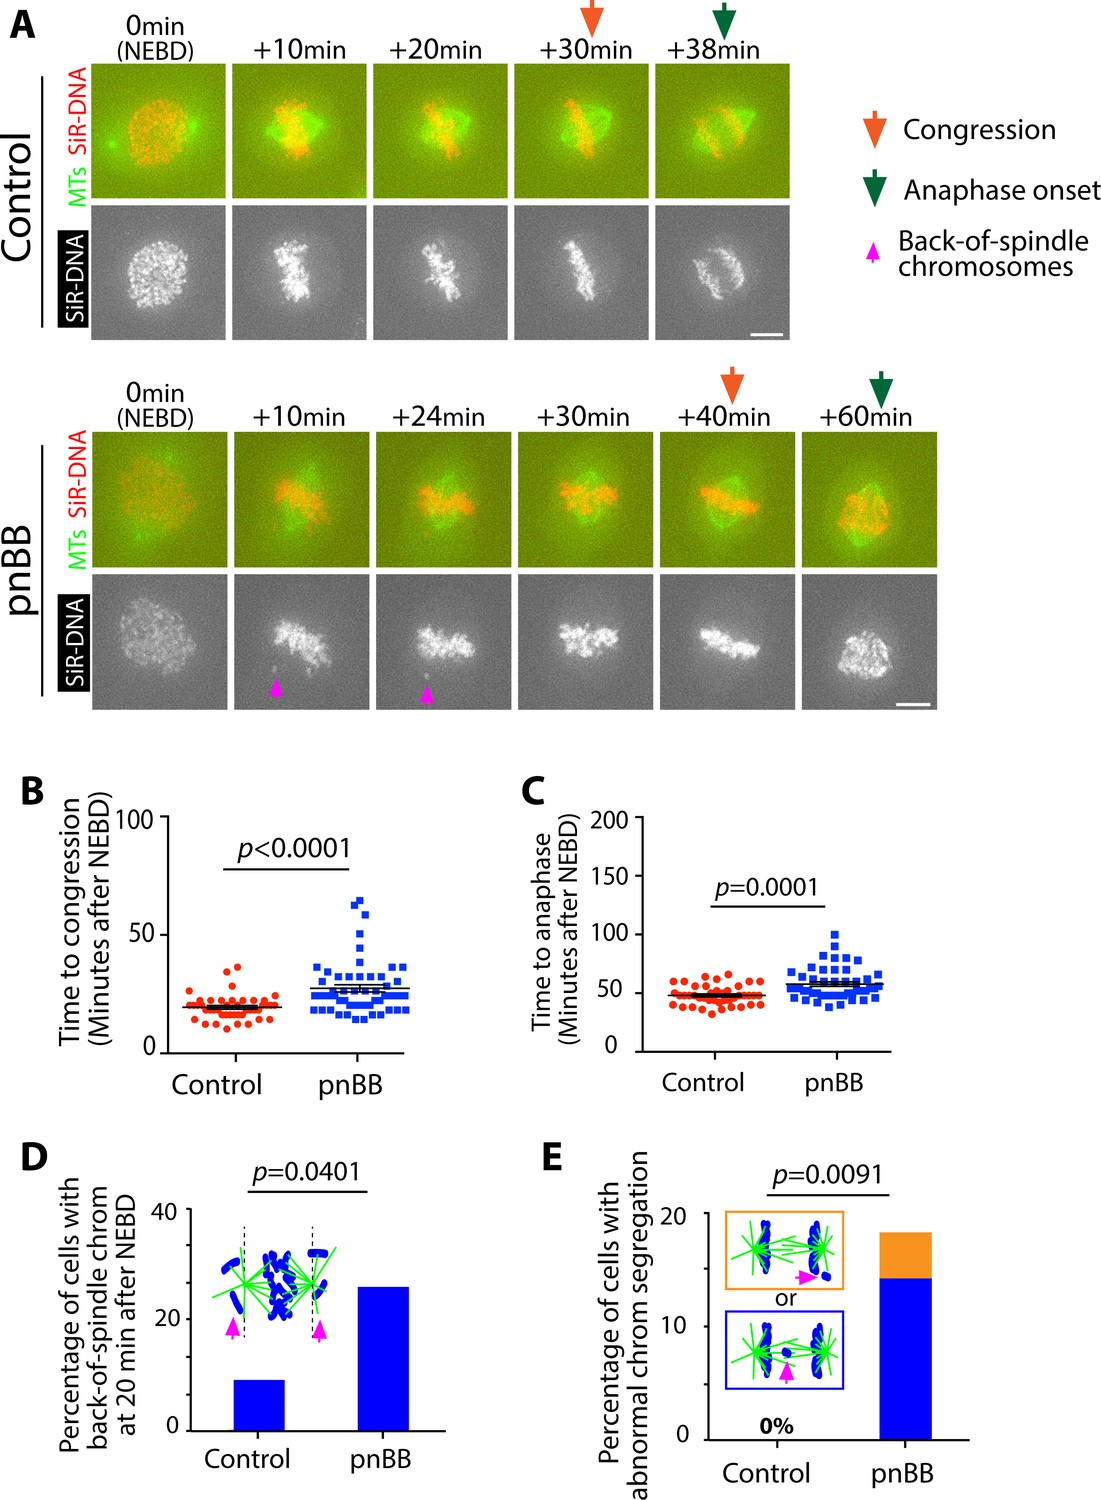
(A) Images (z-projections) show representative pnBB-treated and control cells with GFP-tubulin and SiR-DNA-stained chromosomes. They progress from NEBD to anaphase. Orange arrows indicate time points at which congression was completed, while green arrows indicate time points of anaphase onset. Magenta arrows indicate chromosomes at backside of the spindle (back-of spindle chromosomes; see D). (B) Graph compares time (minutes) from NEBD to chromosome congression in pnBB-treated (n = 54) and control (n = 44) cells. p value was obtained by t-test, error bars = s.e.m. (C) Graph compares time (minutes) from NEBD to the anaphase onset in pnBB-treated (n = 48) and control (n = 42) cells. p-Value was obtained by t-test, error bars = s.e.m. (D) Graph shows the percentage of cells with chromosomes at backside of the spindle (back-of-spindle chromosomes) at 20 min after NEBD in pnBB-treated (n = 57) and control (n = 43) cells. p-Value was obtained by Fisher’s exact test. (E) Graph shows the percentage of cells with abnormal chromosome segregation during anaphase, in pnBB-treated (n = 49) and control (n = 39) cells. Two types of abnormal chromosome segregation were observed in pnBB-treated cells during anaphase, that is chromosomes at the back-of-spindle (orange) and lagging chromosomes between two poles (blue), which were color-coded in diagram and separately counted in graph. p-Value was obtained by Fisher’s exact test (three categories; normal segregation and two types of abnormal segregation).
Figure 5—figure supplement 4
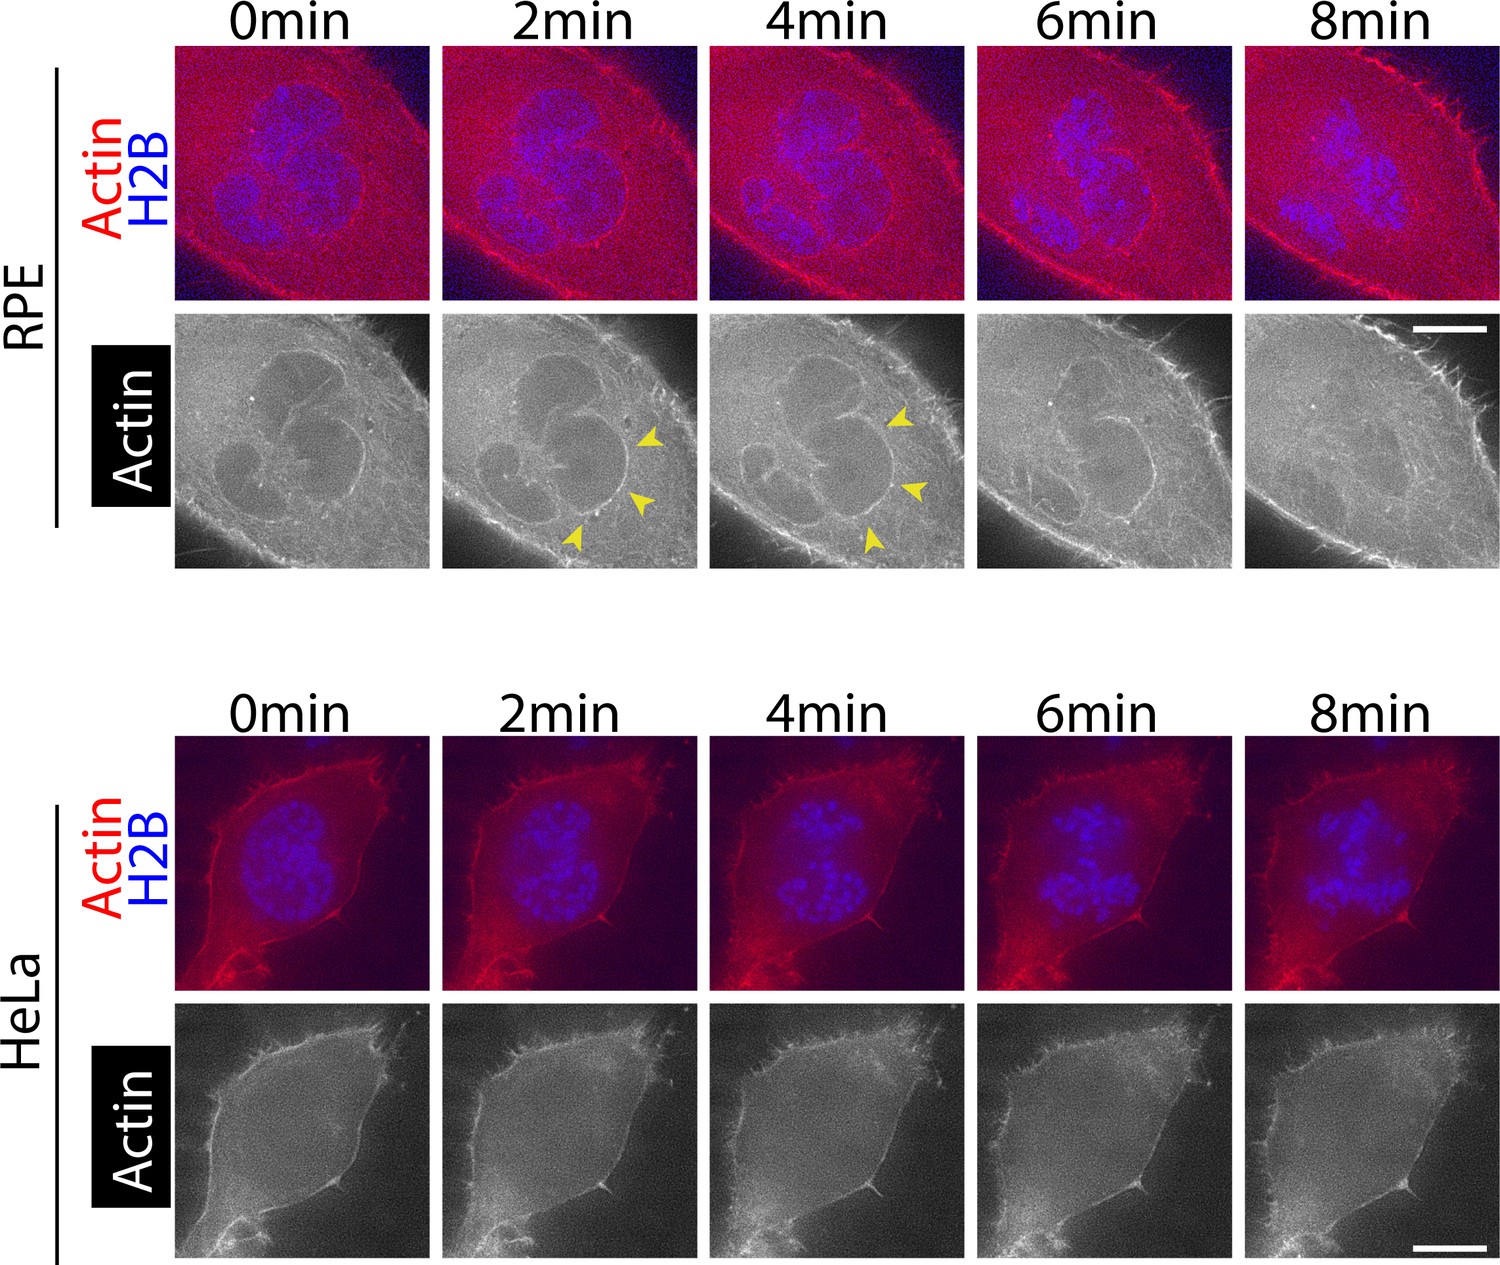
RPE cells show accumulation of actin on the NE in early mitosis, but HeLa cells do not.
(A) RPE cells show accumulation of actin on the NE in early mitosis. RPE cells expressing mCherry-Lifeact and H2B-cerulean were arrested with RO-3306 treatment and released to fresh media. 10 min after the release, images were acquired. Single Z sections in early mitosis are shown here. Time 0 is set arbitrarily. Yellow arrowheads indicate location of actin network. Scale bars, 10 µm. (B) HeLa cells do not show apparent accumulation of actin on the NE in early mitosis. HeLa cells expressing mCherry-Lifeact and H2B-cerulean were arrested with RO-3306 treatment and released to fresh media. 10 min after the release, images were acquired. Single Z sections in early mitosis are shown here. Time 0 is set arbitrarily. Scale bars, 10 µm.
Figure 6

Summary diagram.
Prior to NEBD, the LINC complex promotes the accumulation of acto-myosin to the cytoplasmic side of the nuclear envelope (i, ii). Upon NEBD, myosin II promotes contraction of the acto-myosin network on the NE remnant, thus reducing the CSV (iii). Constraining chromosomes from scattering results in efficient chromosome interaction with the spindle MTs and timely chromosome congression (iii, iv).
Videos
Video 1
CSV decreases after NEBD even in the absence of MTs.
Video of representative cells (Control and Nocodazole-treated) shown in Figure 1C (SiR-DNA staining). Frame intervals are 2 min. Video is shown at 600x speed.
Video 2
Actin accumulates on the NE around NEBD.
Video of representative cells shown in Figure 2A (expressing GFP-tubulin and mCherry-Lifeact). Frame intervals are 1 min. Video is shown at 600x speed.
Video 3
During contraction of the actin network, outermost chromosomes are located right beneath the network.
Video of representative cells shown in Figure 2—figure supplement 2 (expressing mCherry-Lifeact, GFP-tubulin and H2B-cerulean). GFP-tubulin is not shown in the Video. Frame intervals are 1 min. Video is shown at 600x speed.
Video 4
Removal of the actin network results in slower CSV reduction after NEBD.
Video of representative cells (Control and LINC-DN expressing) shown in Figure 2D (SiR-DNA staining). Frame intervals are 2 min. Video is shown at 600x speed.
Video 5
Inhibition of myosin II activity alleviates CSV reduction after NEBD.
Video of representative cells (Control and pnBB treated) shown in Figure 3A (SiR-DNA staining). Frame intervals are 2 min. Video is shown at 600x speed.
Video 6
CSV reduction is almost completely alleviated when myosin II activity is inhibited in the absence of MTs.
Video of representative cells (Nocodazole and Nocodazole +pnBB treated) shown in Figure 3B (SiR-DNA staining). Frame intervals are 2 min. Video is shown at 600x speed.
Video 7
Evidence that removal of actin network delays chromosome congression and anaphase onset.
Video of representative cells (Control and LINC-DN expressing) shown in Figure 5A (expressing GFP-tubulin and H2B-cerulean). Frame intervals are 2 min. Video is shown at 600x speed.
Tables
Key resources table
| Reagent type (species) or resource | Designation | Source or reference | Identi-fiers | Additional information |
|---|---|---|---|---|
| Cell line (Human) | U2OS cdk1-as | Rata et al., 2018 | ||
| Cell line (Human) | wild-type U2OS | ATCC | HTB-96 | |
| Cell line (Human) | HeLa | ATCC | CCL-2 | |
| Cell line (Human) | hTERT RPE | ATCC | CRL-4000 | |
| Transfected construct (Human) | p3'SSclonedimer pF9-poly-EGFP-lacI-NLS (GFP-LacI-NLS) | Hori et al., 2013 | ||
| Transfected construct (Human) | mCherry-Lifeact-7 (mCherry-Lifeact) | Addgene | #54491 | A gift from Michael Davidson |
| Transfected construct (Human) | pGFP-alphaTub (GFP-Tubulin) | Other | A gift from Jason Swedlow lab | |
| Transfected construct (Human) | mRFP1-SR-KASH (LINC-DN) | Luxton et al., 2010 | ||
| Transfected construct (Human) | mRFP1-KASH-ΔL (Control) | Luxton et al., 2010 | ||
| Transfected construct (Human) | pCS-H2B-cerulean (H2B-Cerulean) | Other | A gift from Sean Megason Lab | |
| Transfected construct (Human) | CMV-GFP-NMHC II-A (MHC-GFP) | AddGene | #11347 | A gift from Robert Adelstein |
| Antibody | anti-Tubulin (Rat monoclonal) | Cell Signalling Technology | YL1/2 | Used at 1:1000 dilution |
| Antibody | anti-LaminB1 (Rabbit polyclonal) | Abcam | ab16048 | Used at 1:1000 dilution |
| Antibody | anti-Actin (Rabbit polyclonal) | Thermo-Fisher | PA1-183 | Used at 1:1000 dilution |
| Antibody | A488 goat anti-Rabbit | Thermo-Fisher | A-11034 | Used at 1:1000 dilution |
| Antibody | A488 donkey anti-Rat | Thermo-Fisher | A-21208 | Used at 1:1000 dilution |
| Antibody | A594 goat anti-Rabbit | Thermo-Fisher | A-11037 | Used at 1:1000 dilution |
| Chemical compound, drug | Phalloidin DyLight 650 | Invitrogen | 13454309 | Used at 1:1000 dilution |
| Chemical compound, drug | Hoechst 33342 | Sigma-Aldrich | 14533 | Used at 1:2000 dilution |
| Chemical compound, drug | SiR-DNA | tebu-bio | SC007 | Used at 100 nm |
| Chemical compound, drug | 1NM-PP1 | Merck Millipore | 529581 | Used at 1 μM |
| Chemical compound, drug | RO-3306 | Merck Millipore | 217699 | Used at 10 μM |
| Chemical compound, drug | nocodazole | Sigma | M1404 | Used at 3.3 μM |
| Chemical compound, drug | paranitroblebbistatin (pnBB) | motorpharmacology | Used at 50 μM | |
| Chemical compound, drug | azidoblebbistatin (azBB) | motorpharmacology | Used at 5 μM | |
| Chemical compound, drug | jasplakinolide | Merck | J4580 | Used at 1 μM |
| Chemical compound, drug | MK-1775 | Selleck Chemicals | S1525 | Used at 500 nM |
| Software, algorithm | Imaris, 3D surface tool | Bitplane | ||
| Software, algorithm | Imaris, Convex Hull generation tool | Bitplane | Convex Hull tool from filament tool adapted for 3D surface tool | |
| Software, algorithm | Fiji | https://fiji.sc/ |
Additional files
-
Transparent reporting form
- https://doi.org/10.7554/eLife.46902.037
Download links
A two-part list of links to download the article, or parts of the article, in various formats.
Downloads (link to download the article as PDF)
Open citations (links to open the citations from this article in various online reference manager services)
Cite this article (links to download the citations from this article in formats compatible with various reference manager tools)
Contractile acto-myosin network on nuclear envelope remnants positions human chromosomes for mitosis
eLife 8:e46902.
https://doi.org/10.7554/eLife.46902


