A new family of cell surface located purine transporters in Microsporidia and related fungal endoparasites
- Newcastle University, United Kingdom
Figures
Figure 1 with 4 supplements
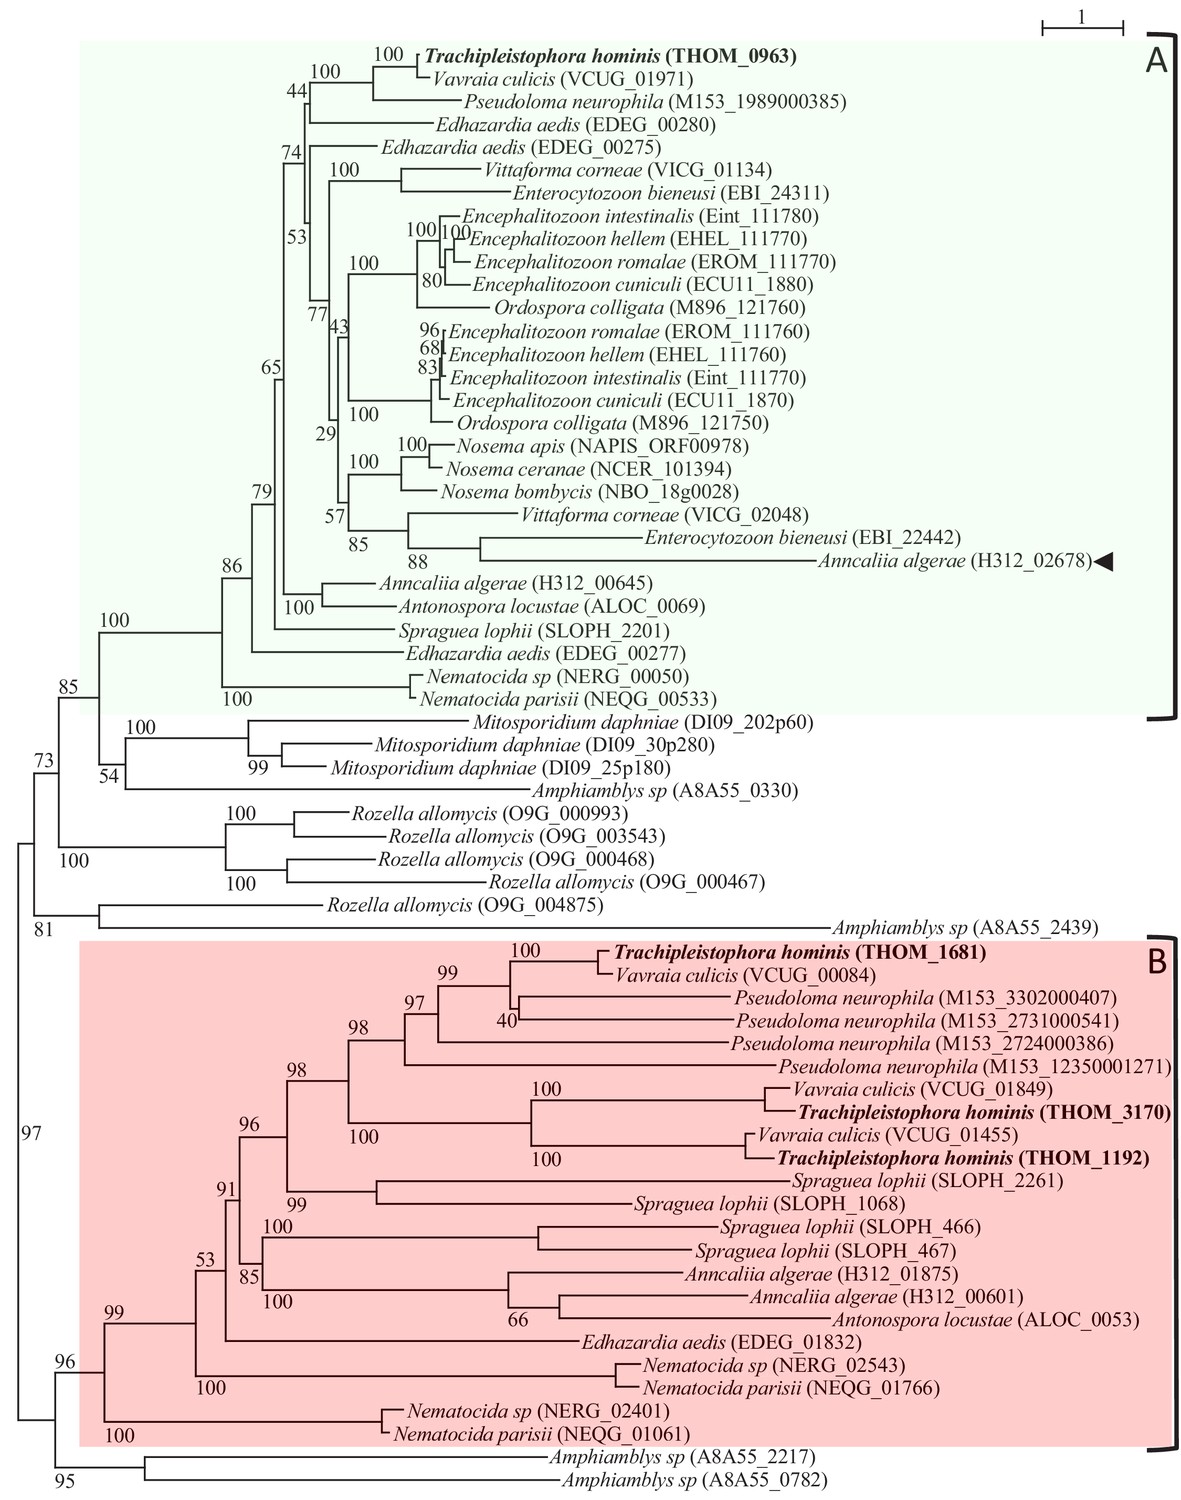
Protein maximum-Likelihood phylogeny of MFS transporters from Microsporidia and close relatives.
The MFS sequences from the core Microsporidia (see Corsaro et al., 2016; Galindo et al., 2018) and their close relatives from the genus Amphiamblys, Mitosporidium, and Rozella clustered in two distinct clades based on the rooting inferred from a broader analysis (Figure 1—figure supplements 1 and 2). Microsporidia genomes encode at least one member of clade A (highlighted with the green box). All Microsporidia sequences (except one - arrowhead) in clade A possess a distinctive indel (see main text and Figure 1—figure supplement 3). Some sequences from the Rozellomycota including Rozella allomycis, Mitosporidium daphniae and Amphiamblys sp. also cluster with Microsporidia clade A or clade B sequences (the Microsporidia clade B is highlighted with the red box). A number of Microsporidia and Rozellomycota species appear to have lost their clade B homologues. Lineage-specific expansions can be observed for several species in clade A or B. The maximum likelihood phylogeny was inferred with the LG+C60 model in IQ-TREE with ultrafast bootstrap branch support values (1000 replicates). The scale bar (top right) represents the number of inferred amino acid changes per site.
-
Figure 1—source data 1
MFS protein sequences from Microsporidia and Rozellomycota analysed in this study.
Pfam domain analysis of individual protein sequences for all Microsporidia MFS members of the family c_456 entries and close homologues identified in related species from the Rozellomycota (Figure 1). Note that for some proteins more than one significant Pfam hit is listed.
- https://doi.org/10.7554/eLife.47037.008
-
Figure 1—source data 2
MFS homologues from the family c_456 (Nakjang et al., 2013) encoded by the genome of two recently sequenced Rozellomycota species.
- https://doi.org/10.7554/eLife.47037.009
Figure 1—figure supplement 1

Maximum likelihood phylogeny of homologues to ThMFS proteins including a broad range of eukaryotes and prokaryotes.
The tree was inferred under the LG+C60 model. The full details, including ultrafast bootstrap support values (1000 replicates), species names and sequence identifiers are shown in Figure 1—figure supplement 2. The arrow indicates the inferred gene duplication event affecting Microsporidia and Rozellomycota that gave rise to clade A and B discussed in the text. Ultrafast bootstrap support values (1000 replicates) on key branches are indicated.
Figure 1—figure supplement 2

Detailed phylogeny of MFS proteins shown in Figure 1—figure supplement 1.
The Figure illustrates the ultrafast bootstrap support values (1000 replicates) for all branches, full species names and the GenBank GI numbers for each protein sequence are included in the alignment.
Figure 1—figure supplement 3

Comparisons of indels in the extracellular loop between the 7th and 8th transmembrane domains present in Microsporidia MFS proteins from clade A.
(A) Illustration of the ThMFS1 - THOM_0963 indel in the context of the predicted topology of the entire protein illustrated in Figure 1—figure supplement 4. The two arrows indicate the residues at either end of the indel, see alignment in panel B. (B) Amino acid alignment illustrating the position of the indels in Microsporidia MFS proteins of clade A (boxed in red). All investigated Microsporidia species encode at least one protein from clade A. The indel was acquired in a common ancestor of the core Microsporidia (as defined in Corsaro et al., 2016; Galindo et al., 2018) and was retained in most species and sequences, suggesting a possible functional role. For one protein from Anncallia algerae the indel has been dramatically reduced in size (Locus tag H312_02678, highlighted with black arrow head).
Figure 1—figure supplement 4
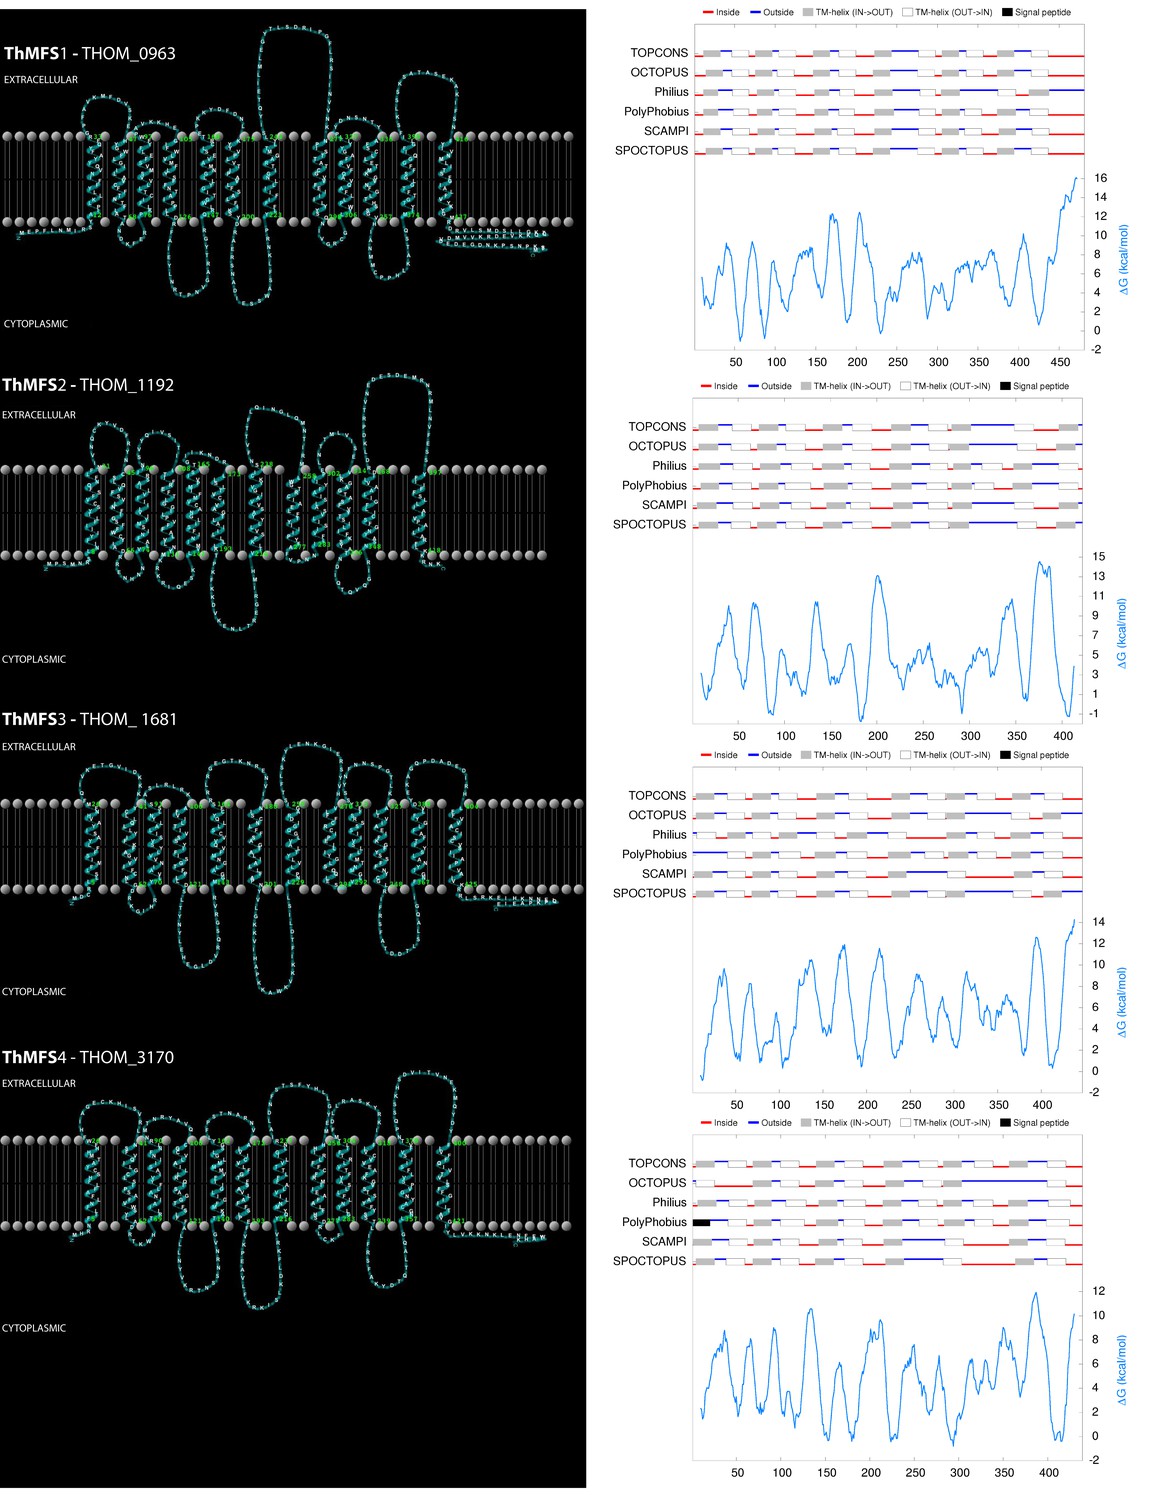
Predicted topology of the ThMFS1-4 proteins.
A topology model of the ThMFS1-4 membrane proteins is illustrated together with its prediction statistics by the indicated program. The ThMFS1-THOM_0963, ThMFS3-THOM_1681, and ThMFS4-THOM_3170 models are based on the TOPCONS consensus sequence (Tsirigos et al., 2015). For ThMFS2-THOM_1192, TOPCONS predicted a 11 TMD topology, whereas Philius and PolyPhobius both predict 12 TMDs and this topology is also supported by additional programs (TMHMM and HMMTOP, data not shown). Furthermore, the close evolutionary relationship of the four proteins supports a similar structure. Therefore, we also propose a 12 TMD topology for ThMFS2-THOM_1192 and its illustration is based on the Philius prediction. Models were visualised with TMRPres2D (Spyropoulos et al., 2004).
Figure 2 with 9 supplements
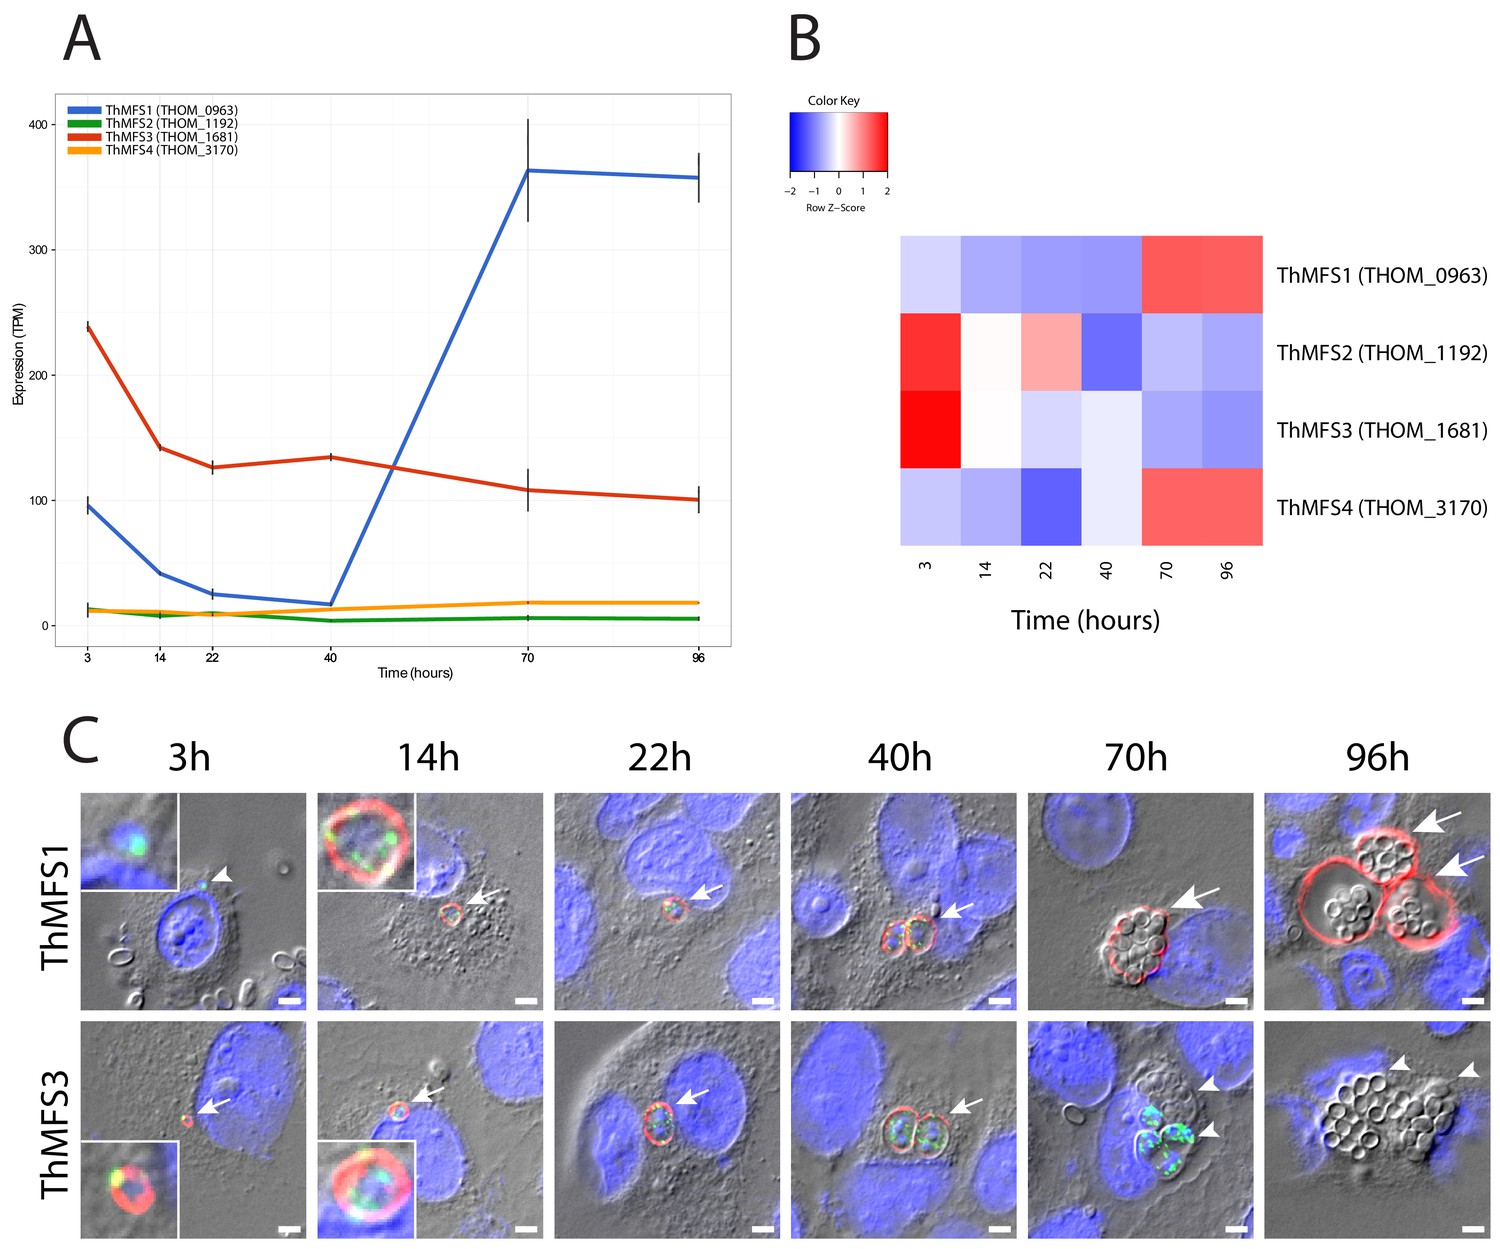
Transcription and subcellular localization of T. hominis MFS- proteins in a synchronised infection.
(A) RNA-Seq data for the four ThMFS1-4 encoding genes for six time points post infection corresponding to key stages of the T. hominis infection cycle. The Y-axis shows transcripts per million reads (TPM - Black lines indicate the value from each replicate) against time on the X-axis (hours). (B) Relative abundance of transcripts (Z-score - normalised values based on the average TPM for each gene) for each ThMFS gene across the time points illustrated in panel A. (C) IFA data for ThMFS1 (THOM_0963) (rabbit 94, antisera dilution 1:50, red) and ThMFS3 (THOM_1681) (rabbit 91, antisera dilution 1:50, red) proteins showing localization to the periphery of parasites. Time points were chosen based on the following stage-specific features appearing post infection: 3 hr germinated sporoplasm (smallest vegetative cells of the parasite, see inset for zoom in on the parasite), 14 hr unicellular meronts (see inset for zoom in on the parasite), 22 hr first nuclear division, 40 hr first cellular division, 70 hr initiation of cellular differentiation into sporonts and spores, 96 hr fully mature spores within the SPOV (Dean et al., 2018). Small arrows indicate labelled parasites, large arrows indicate labelled SPOV, small arrow heads indicate unlabelled parasites (3 hr and 70 hr) or unlabelled SPOV (96 hr). Infection of new host cells from mature spores can be observed in the later time points (an example is illustrated in Figure 2—figure supplement 9). ThMFS1 was not detectable at the first time point whereas the sporoplasms were labelled with the ThmitHsp70 mitosomal marker (rat antisera dilution 1:200, green). Quantification of the different IFA signals (ThMFS1, ThMFS3 and mitHsp70) (Figure 2—source data 3, Figure 2—figure supplement 2) is consistent with the pattern observed in panel 2C. The nuclei of the mammalian host cells (large nuclei) and parasites (small nuclei) were labelled with DAPI (blue). The scale bar is 2 µm.
-
Figure 2—source data 1
SNP analysis of the ThMFS1-4 ORFs.
SNP analyses was performed on the published RNA-Seq data for T. hominis (Watson et al., 2015).
- https://doi.org/10.7554/eLife.47037.020
-
Figure 2—source data 2
Transcriptomics data for ThMFS1-4 and ThNTT1-4 transporters.
Transcript per million reads (TPM) values are tabulated for the four ThMFS (this study) and four ThNTT (Dean et al., 2018) genes for comparison. Mean and corresponding individual values from replicates for the tested time points for each gene are shown. Published values for NTT (Dean et al., 2018) of corresponding Fragments Per Kilobase per Million mapped reads (FPKM) are also shown for comparison with values for the ThMFS1-4.
- https://doi.org/10.7554/eLife.47037.021
-
Figure 2—source data 3
Quantifications of IFA signals for ThMFS1-4 and mitHsp70.
See Figure 2—figure supplements 2 and 4.
- https://doi.org/10.7554/eLife.47037.022
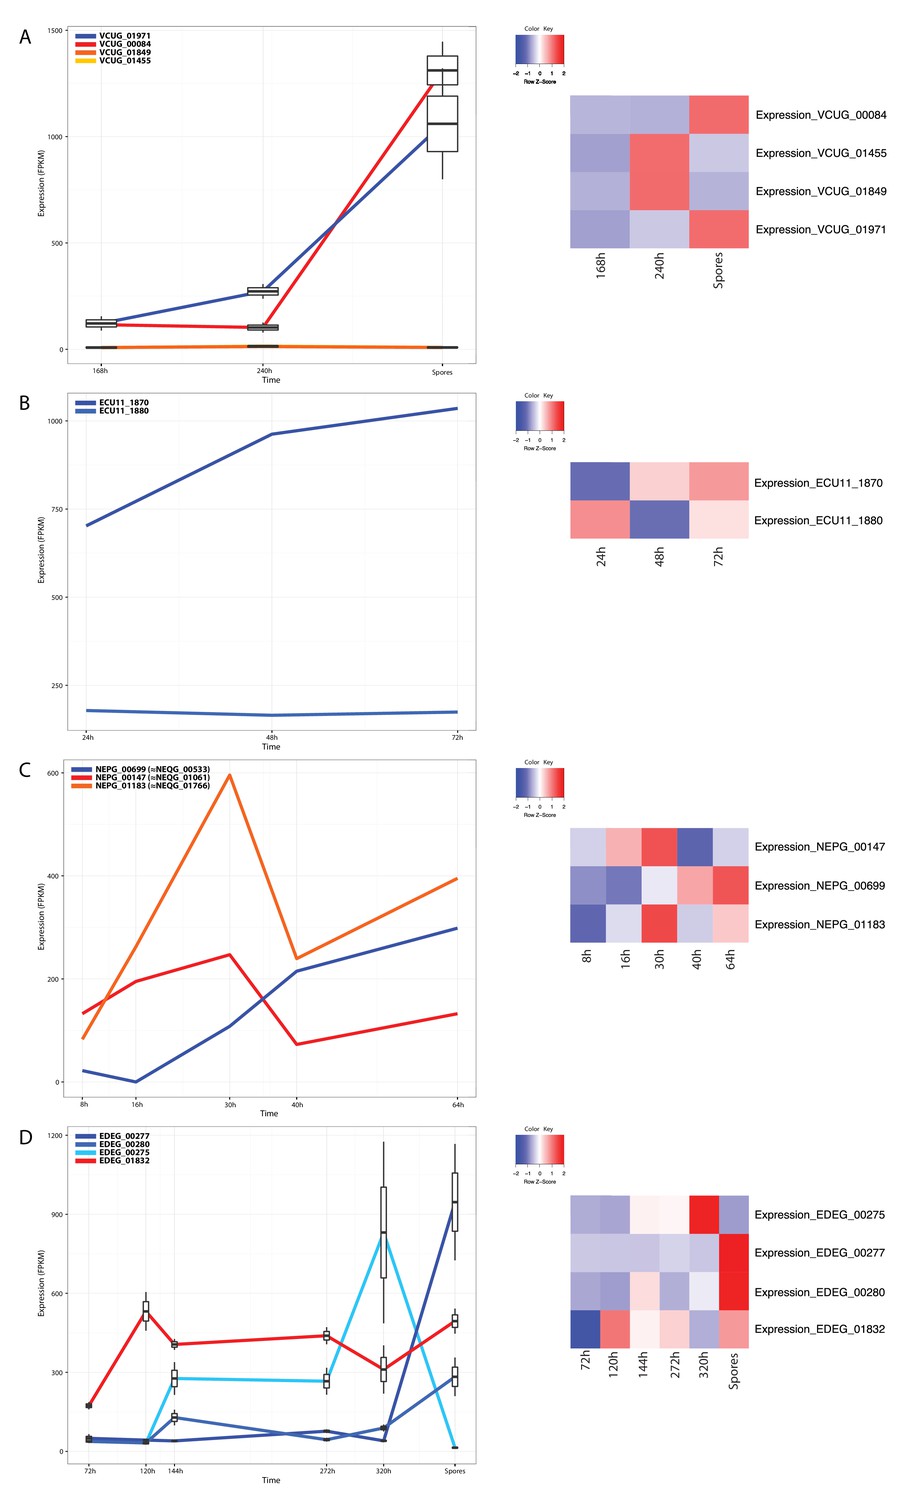
Figure 2—figure supplement 1
Published RNA-Seq data from the Microsporidia Vavraia culicis, Encephalitozoon cuniculi, Nematocida parisii and Edhazardia aedis.
Expression values for MFS homologues were extracted from published data for four Microsporidia species (Cuomo et al., 2012; Desjardins et al., 2015; Grisdale et al., 2013). Left panel: Expression (FPKM values) over time. Clade A candidates are shown in blue, clade B candidates in red or orange. Right panel: Heat maps illustrating changes in relative expression levels (z-scores) between the investigated timepoints. The following sequences shared between T. hominis and V. culicis are orthologous: ThMFS1-THOM_0963–VCUG_01971; ThMFS2-THOM_1192–VCUG_01455; ThMFS3-THOM_1681–VCUG_00084; ThMFS4-THOM_3170–VCUG_01849 (see Figure 1 for phylogeny supporting orthology).
Figure 2—figure supplement 2
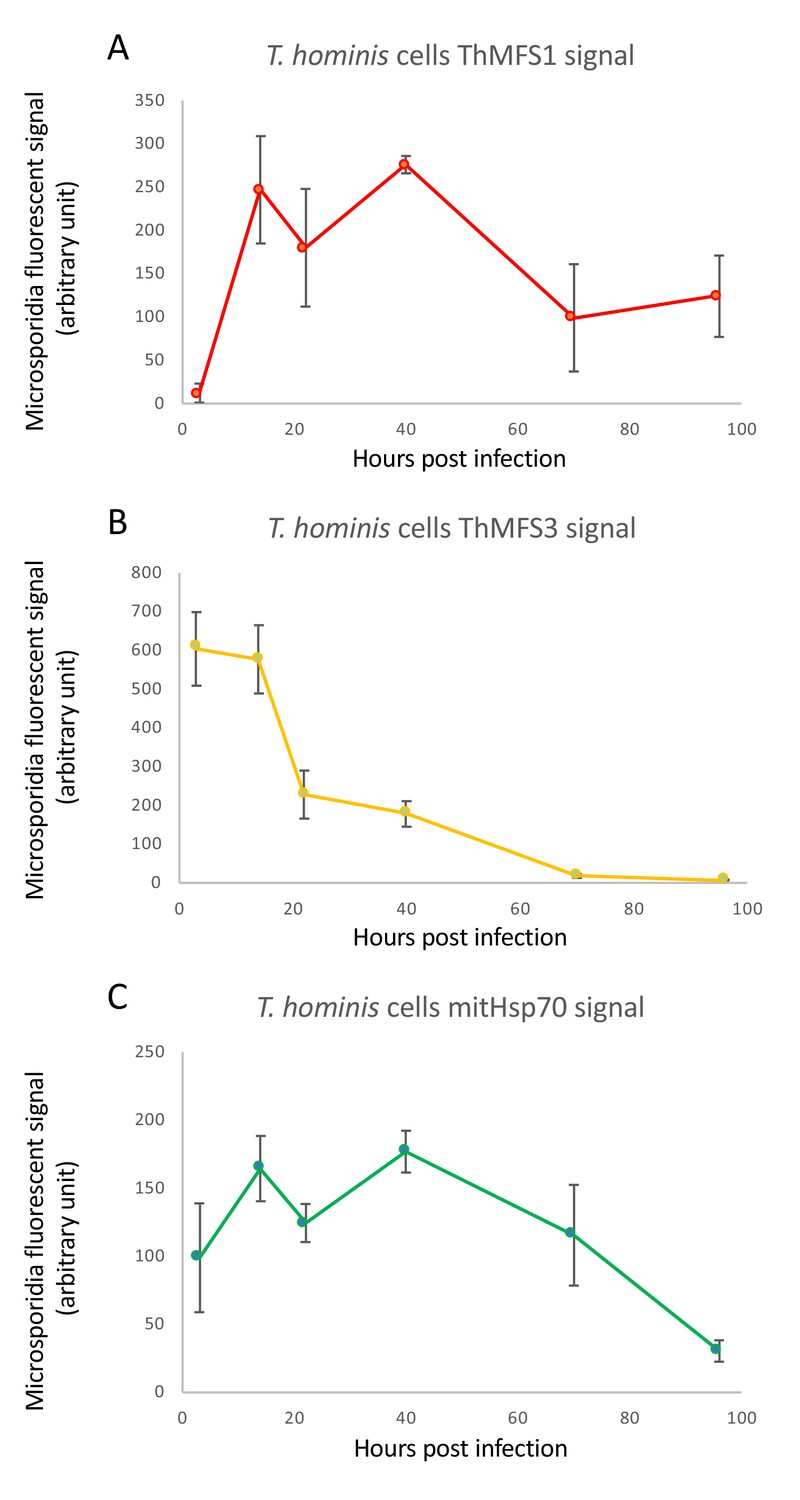
Comparison of IFA signal quantification for ThMFS1, ThMFS3 and mitHsp70.
Quantification of parasite specific IFA signals (y-axis, arbitrary units) for ThMFS1 performed on 3–4 parasites (A), ThMFS3 performed on 3–4 parasites (B) and mitHs70 (C) performed on 5–6 parasites for the six different time points post infection (x-axis, hours). The data for mitHsp70 combines cells (5–6 parasites) from the ThMFS1 and ThMFS3 IFA data.
Figure 2—figure supplement 3
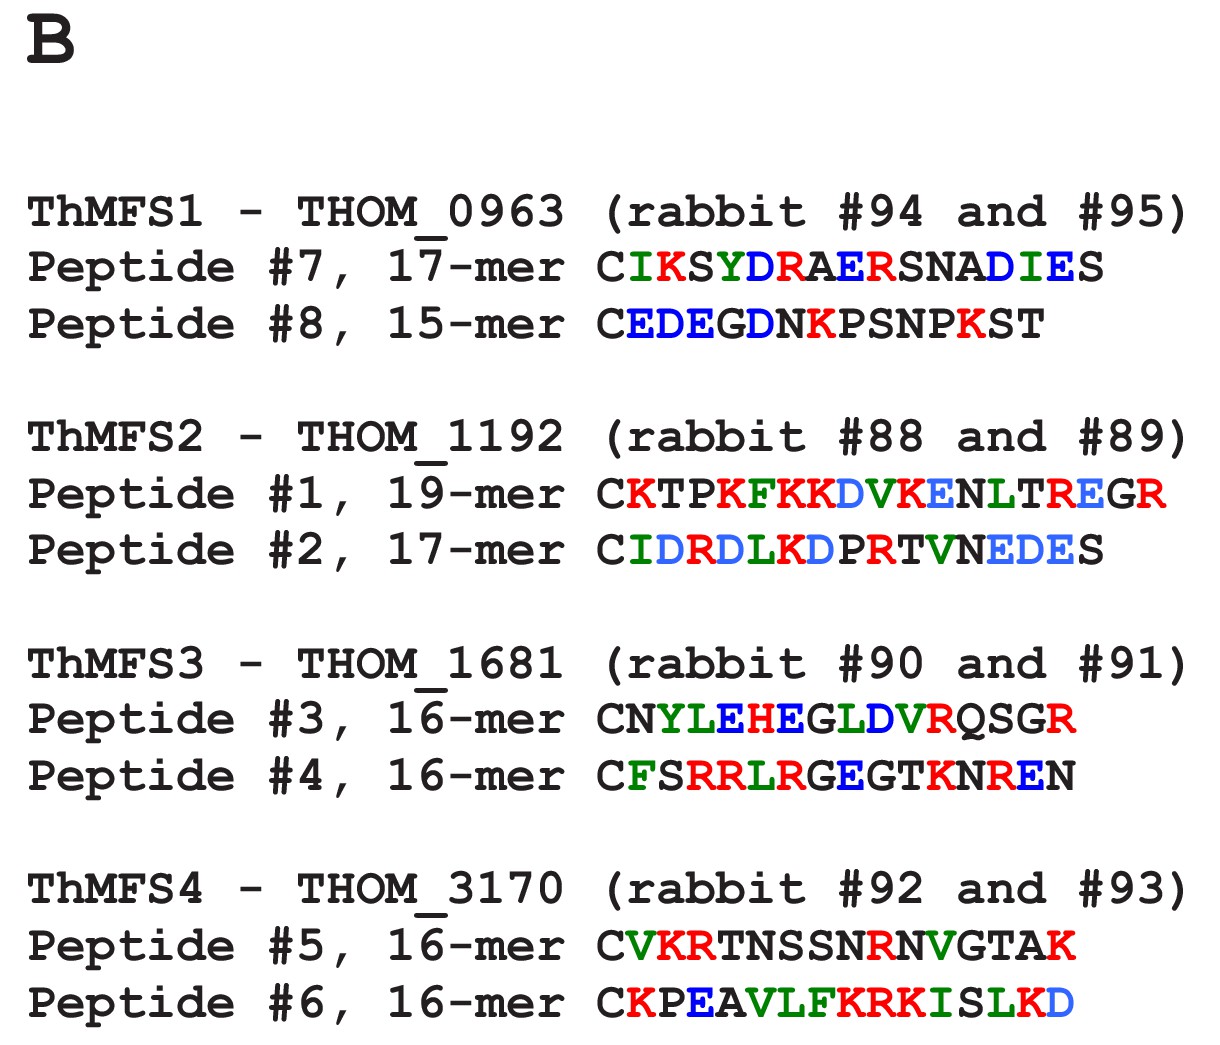
Peptide designed to generate specific antisera for the ThMFS1-4 proteins.
(A) Alignment of ThMFS1-4 proteins highlighting the selected peptide sequences used to generate antisera. Two peptides per protein were selected to optimise their solubility and specificity for a given protein. All peptides correspond to the most soluble segments of the proteins with corresponding TMD highlighted in grey shading as inferred by the analyses described in Figure 2—figure supplement 4. The locus tags in bold correspond to the two proteins detected by IFA in T. hominis infected RK13 cells with the anti-peptide antisera (Figure 2C). (B) Details of the sequence features of peptides used to generate the rabbit antisera for the four ThMFS1-4 proteins. Red: positively charged residues. Blue: negatively charged residues. Green: hydrophobic residues. Black: uncharged residues.
Figure 2—figure supplement 4
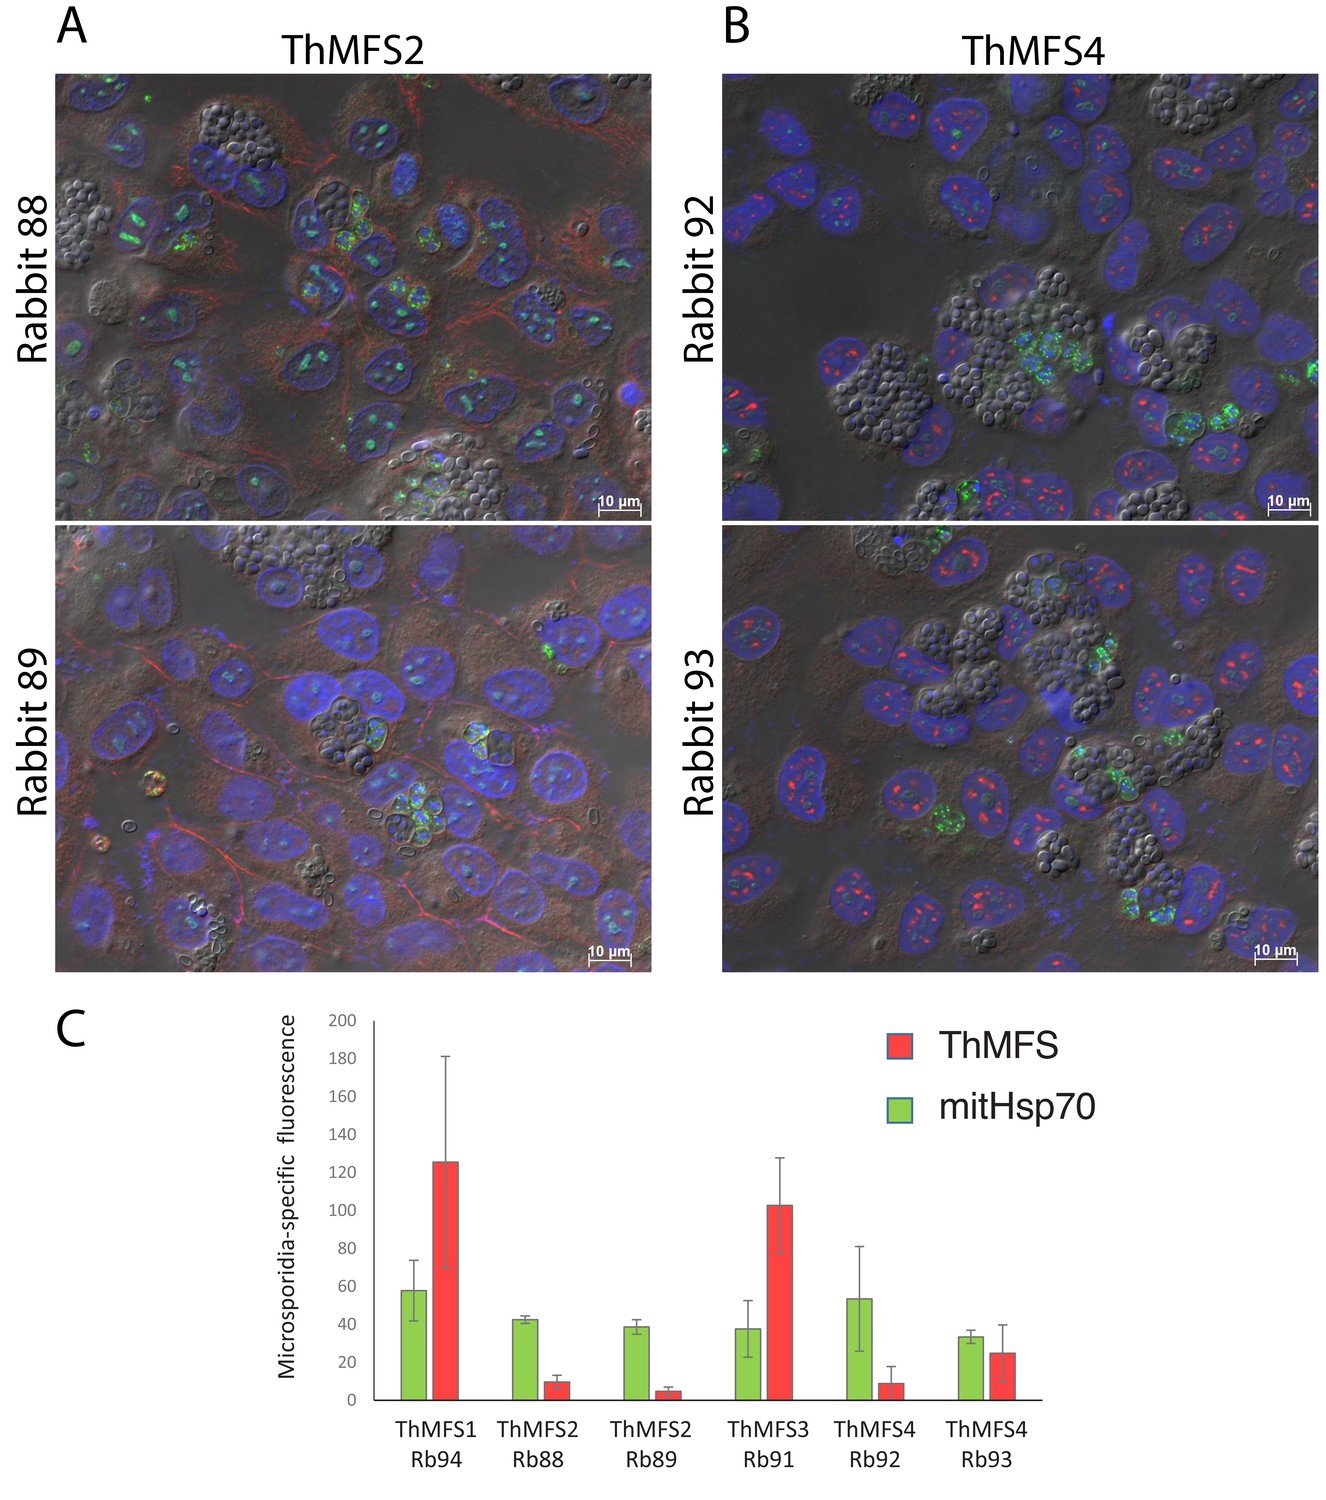
Comparison of the IFA signals for antisera for ThMFS1-4 and mitHsp70.
Broad fields IFA images from T. hominis-infected RK13 cells incubated with rabbit antisera (affinity purified antibodies) that did not generate parasite-specific signal: (A) ThMFS2 rabbit 88 and 89 and (B) ThMFS4 rabbit 92 and 93. A mix of early and late meronts stages (labelled with rat antisera for mitHsp70) can be observed in panels A and B. Spores can be seen within SPOVs. In panels A and B there is no parasite associated ThMFS2/4 signal (red channel) and only weak labelling of host cell-associated structures. Panel C compares the quantification of parasite specific IFA signal (y-axis, arbitrary units) for ThMFS1-4 (red) and mitHs70 (green) for the indicated rabbit antisera. The antisera that generated parasite-specific signals (Figure 2C) have significantly higher values for the rabbit antisera (red channel – anti ThMFS1/3). In contrast, the signal from the rat antisera (green channel – anti mitHsp70) is more homogenous across all IFA analyses, as expected when meront stages of the parasites are present.
Figure 2—figure supplement 5
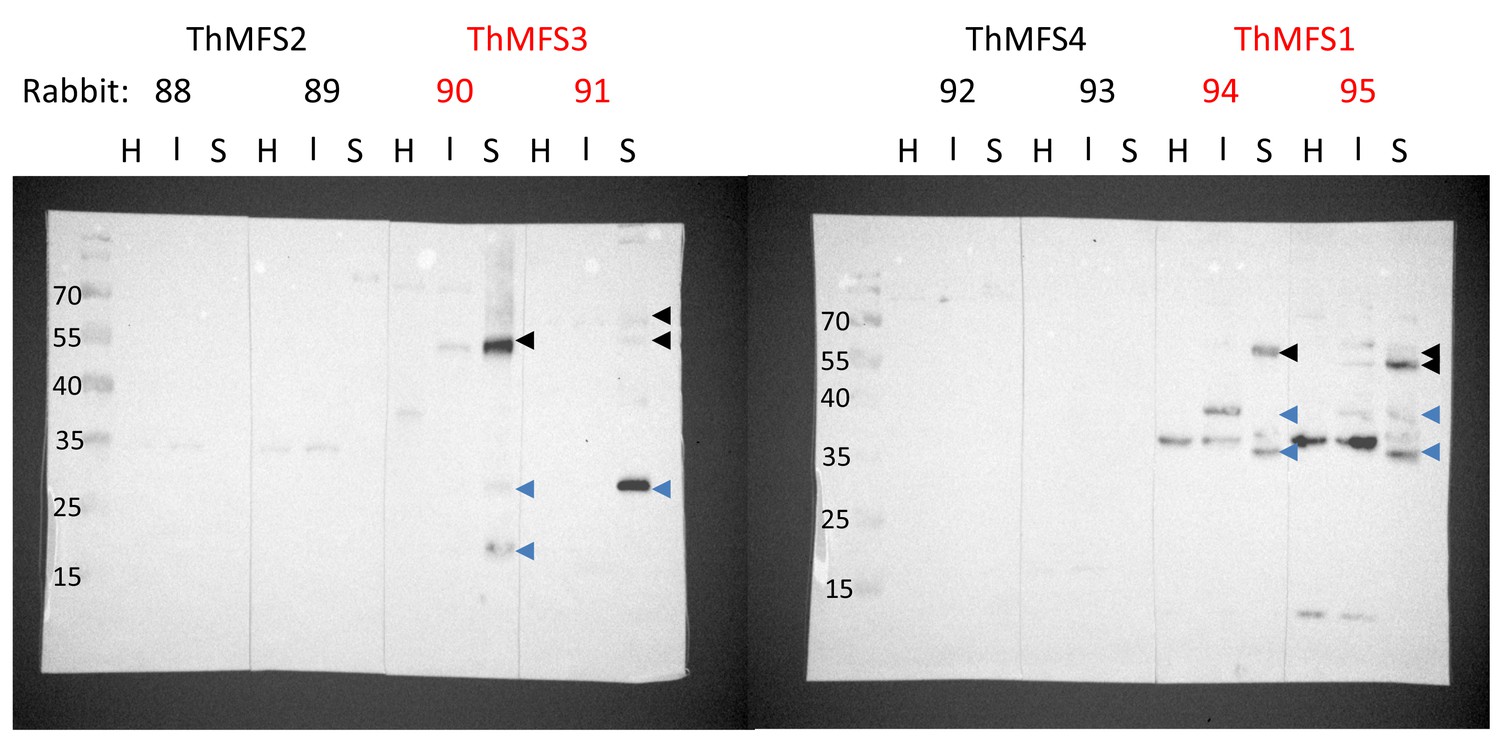
Western blot analysis on total protein extracts from host cells and parasites with antisera against ThMFS1-4.
Affinity purified antibodies (from rabbit antisera 88–95, 1/1000 dilution) were used for Western blot analyses on total protein extracts from RK13 cells (H, 10 µg proteins), T. hominis infected RK13 cells (I, 10 µg proteins) and purified T. hominis spores (S, 5 µg proteins). The two sets of antisera that give parasite specific IFA signals are indicated in red. Conspicuous parasite specific bands are indicated by arrow heads. Black arrowheads highlight bands with apparent Mw that correspond approximately to full length ThMFS proteins (calculated Mw: ThMFS1, 55 kDa and ThMFS3, 50 kDa). Blue arrowheads highlight potential degradation products of the full-length proteins. Some bands are not parasite specific as they appear in both control non-infected cells (H) and parasite-infected cells (I). The antisera for ThMFS2 (Rabbit 88 and 89) and ThMFS4 (rabbit 92 and 93) that gave no parasite-specific IFA signal are also characterised by the absence of parasite-specific signals in the western blot. The Mw (kDa) of the pre-stained markers are indicated on the left.
Figure 2—figure supplement 6
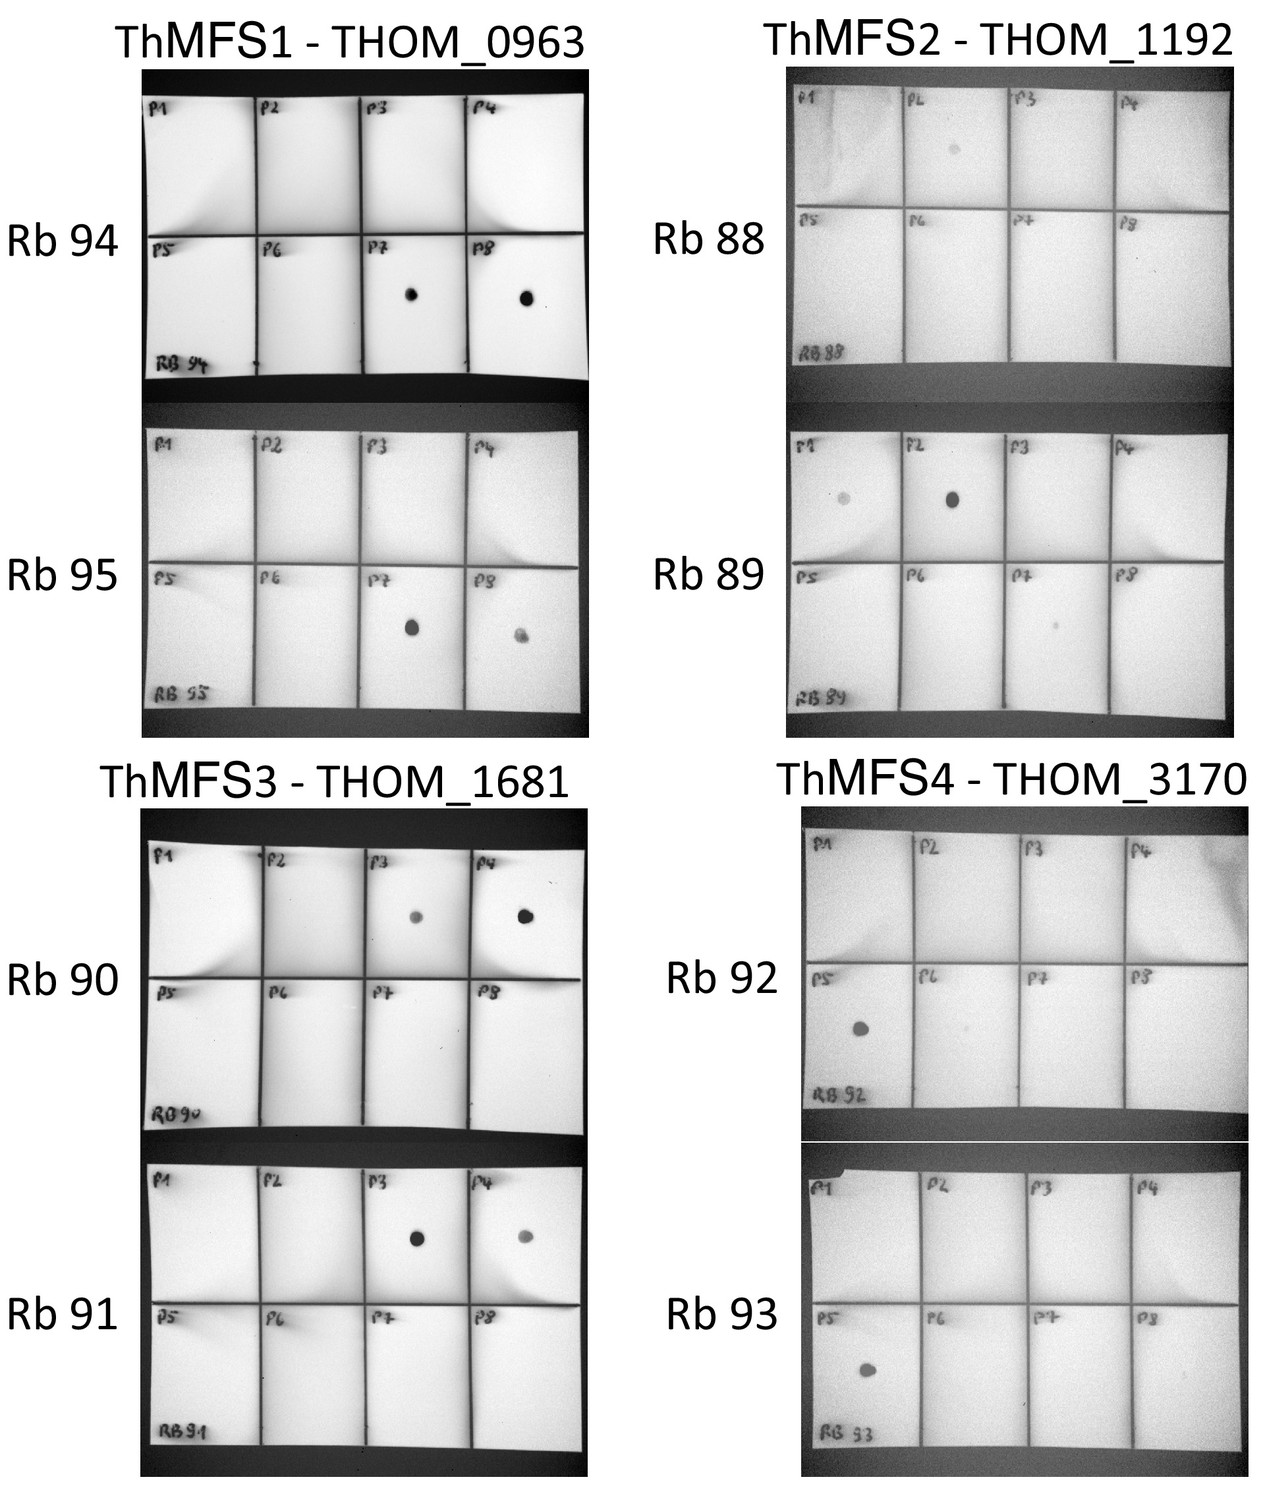
Dot blots on peptides to test the specificity of anti-ThMFS1-4 rabbit antibodies.
Affinity purified antibodies from rabbit antisera were diluted 1:1000 for Western blot analyses on nitrocellulose membranes. For each pair of peptides two rabbits were immunised with the numbers Rb 88–95 specifying individual rabbits. 300 ng of each peptide was deposited on the membrane and then processed for immunodetection with the specified rabbit antisera (Rb 88–95) in combination with goat anti-rabbit secondary antibody conjugated to HRP (dilution 1:10000).
Figure 2—figure supplement 7
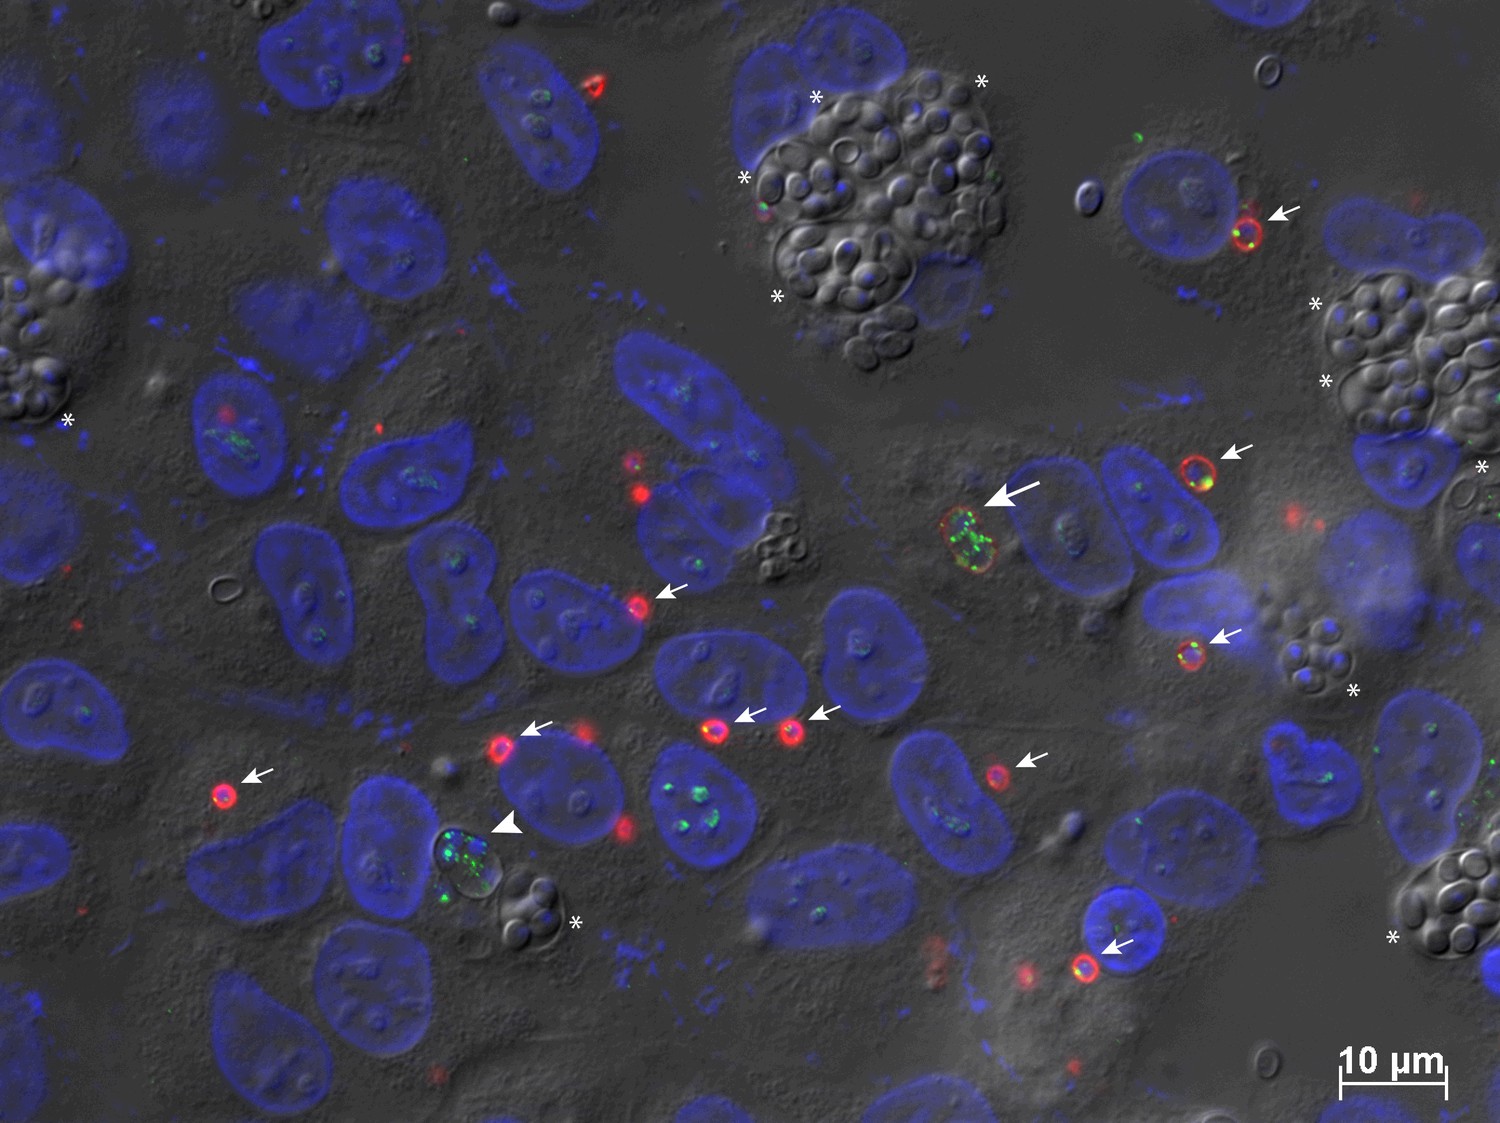
ThMFS3 IFA detection in highly infected RK13 cells containing mixed stages of the parasite infection cycle.
The affinity purified antibodies for ThMFS3 were used to label highly infected RK13 cells following several days of infection. A mix of cellular stages can be seen including early sporoplasms and meronts (small arrows), later meront with weak signal (equivalent to 40 hr in Figure 2C, one cell, large arrow), and later meront stage with no signal (larger cell equivalent to 70 hr in Figure 2C, one cell, large arrow head) differentiating sporonts in SPOV (with DAPI labelled nuclei, stars) and mature spores in SPOV (with no labelled nuclei, stars). These data further support the variation of ThMFS3 IFA signal observed across the time points illustrated in Figure 2C., including the loss of the signal for ThMFS3 in the last two time points (70 hr and 96 hr post infection).
Figure 2—figure supplement 8
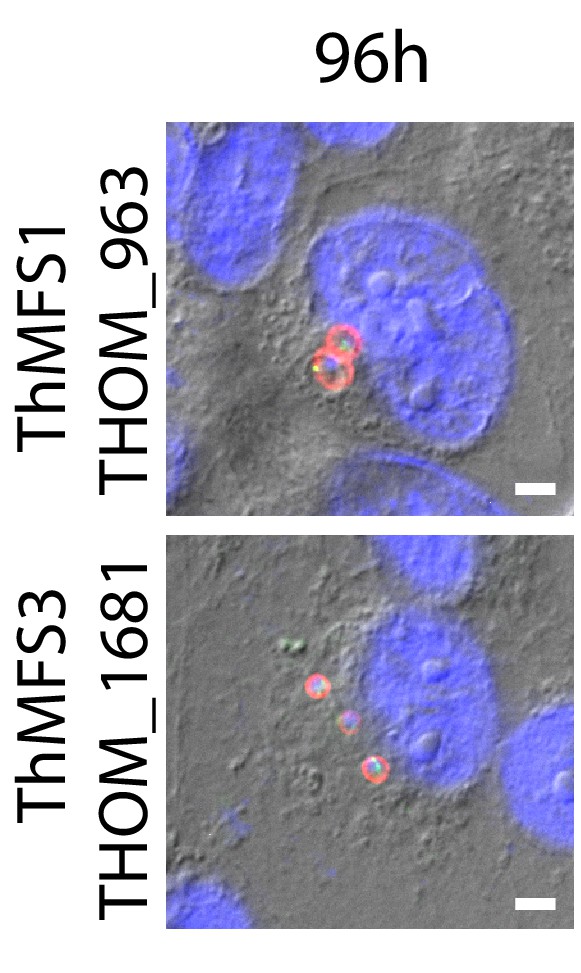
Evidence for re-infections from germination of newly formed mature spores in the late time point post infection (96 hr) from IFA for ThMFS1 and ThMFS3.
Panels are distinct fields from the same sample shown in Figure 2C illustrating the appearance of additional cellular stages of the parasite in the 96 hr post infection time point indicating re-infection from newly mature spores that underwent germination. Both the ThMFS1 and ThMFS3 antisera label the early stage meronts present at 96 hr post infection. For ThMSF1, the size of labelled cells is reminiscent of those observed at 14 hr post-infection (larger cells compared to those observed 3 hr post-infection), whereas for ThMFS3 the cell size is reminiscent of those observed at 3 hr post-infection (smaller cells compared to those observed 14 hr post-infection). Scale bar 2 µm.
Figure 2—figure supplement 9
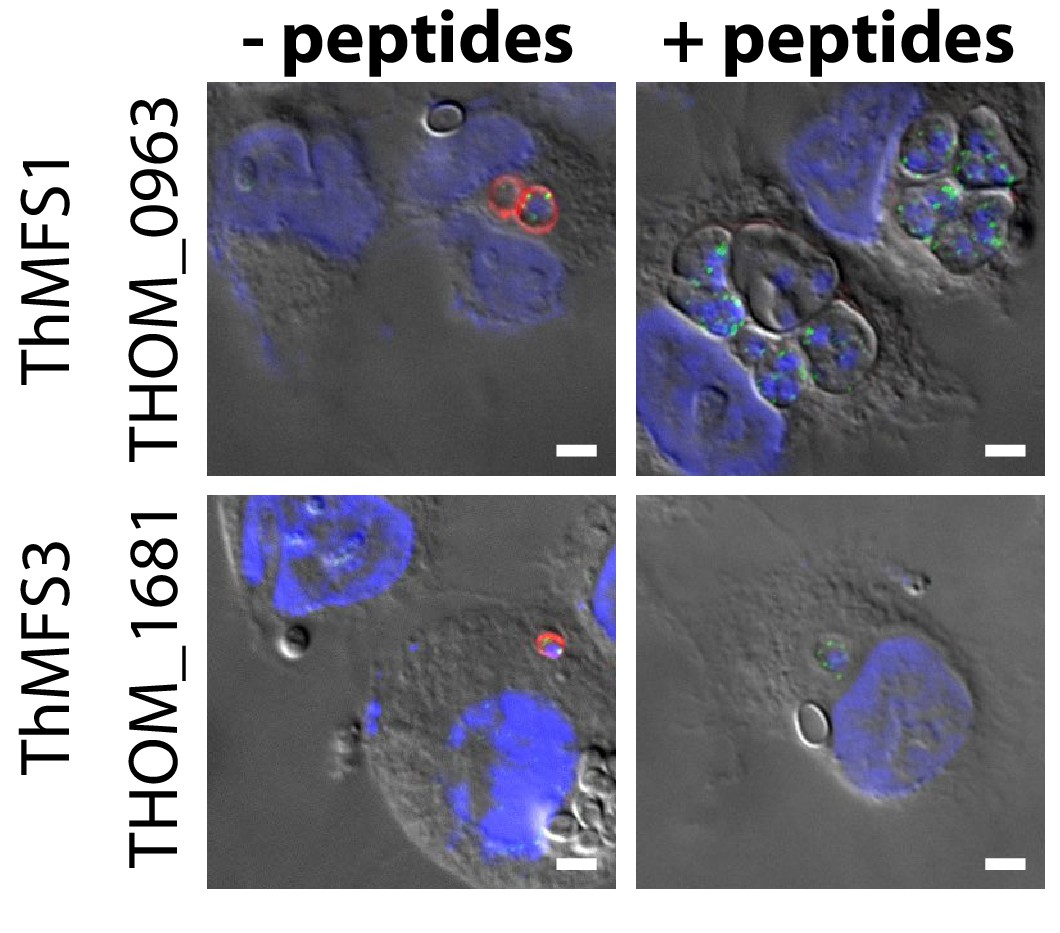
Peptide competition experiments demonstrate the specificity of antisera against the ThMFS1 and ThMFS3 proteins.
Rabbit antisera were used at a 1:50 dilution to detect the ThMFS1 and ThMFS3 proteins respectively. Addition of peptides that were used as antigens for antibody production (see Figure 2—figure supplement 3 for details) at a 200x molar excess resulted in the complete loss of IFA signal for the ThMFS (red) but not mitHsp70 (green), supporting the specificity of the respective affinity purified anti ThMFS antibodies.
Figure 3
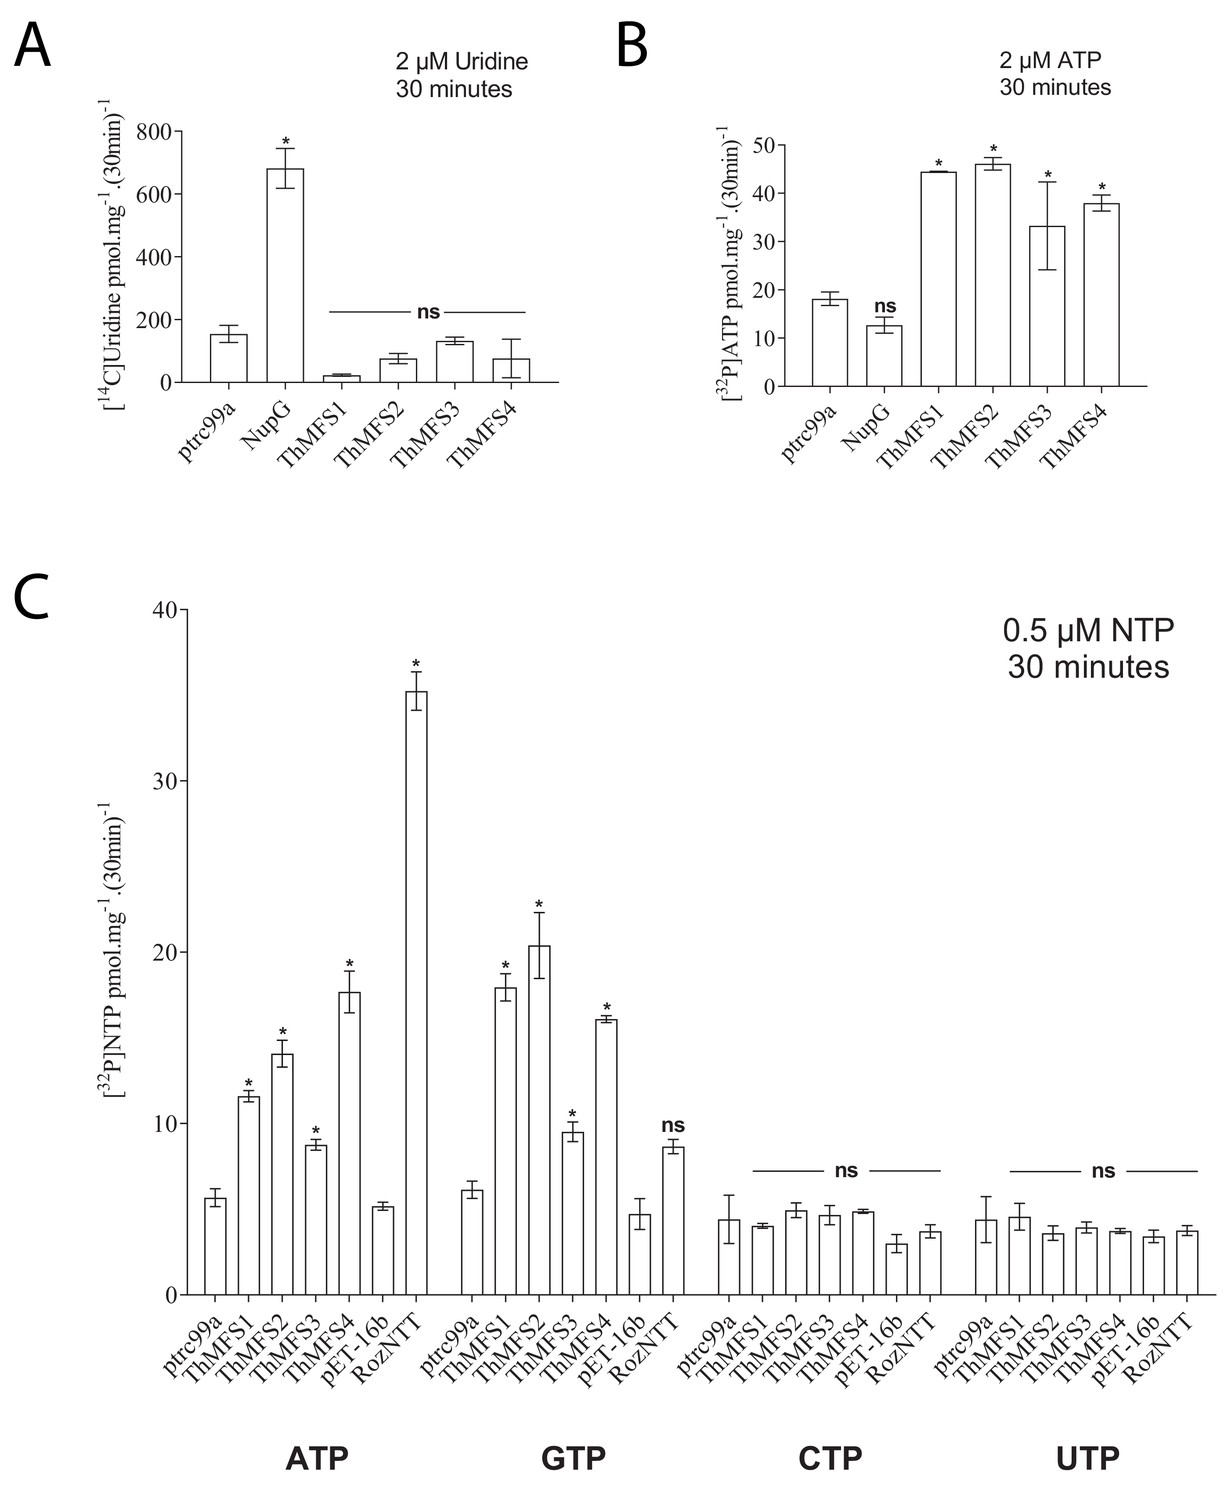
Transport assay for the nucleoside uridine and selected nucleotides in E. coli expressing recombinant E. coli NupG, ThMFS1-4 proteins or Rozella allomycis NTT.
(A) Radiolabelled uridine uptake assay with E. coli cells expressing the native E. coli NupG transporter or one of the four ThMFS proteins (ThMFS1-4) cloned into the expression vector ptrc99a. The empty ptrc99a plasmid was used as a control for background transport of the radiolabelled substrate. (B) Radiolabelled ATP import assay for the same five genes as in (A) and with the same control of the empty ptrc99a plasmid. (C) Uptake assays for the four radiolabelled nucleotides (α32P-) ATP, GTP, CTP and UTP using the same expression system as in A and B. The same control (empty ptrc99a plasmid) was used for each tested substrate. For the Rozella NTT (RozNTT) cloned in pET16b, the control was the empty plasmid pET16b (Dean et al., 2018). N = 3 for each condition and the error bars represent standard deviations. Significant differences at p<0.05 (one-way ANOVA) between controls (empty plasmids, ptrc99a or pET-16b) and individual transporters are shown with * (ns: non-significant).
-
Figure 3—source data 1
Raw data and their processing to calculate the transport of the tested nucleoside or nucleotides by ThMFS1-4 and control transporters expressed in E. coli (worksheet 1: panels A and B; worksheet 2: panel C).
- https://doi.org/10.7554/eLife.47037.024
Figure 4
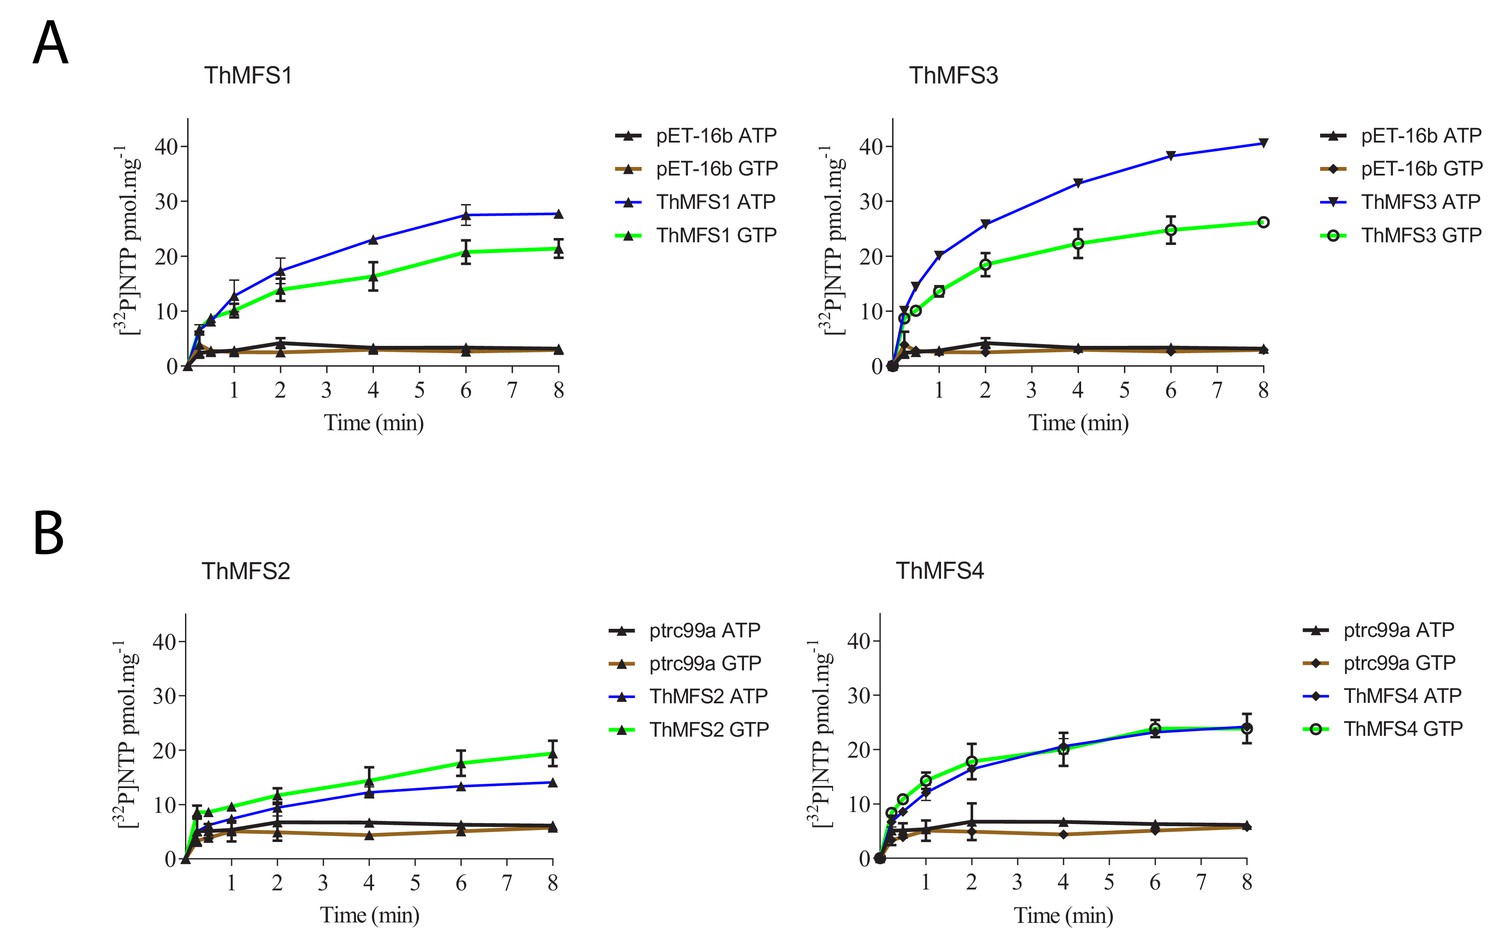
Time course of ATP and GTP uptake by E. coli cells expressing recombinant ThMFS1-4 proteins.
Each ThMFS transporter was assayed using both E. coli-expression vector systems (pET16b or ptrc99a) with the results shown being taken from the experiment with the highest transport activity. In each experiment, the corresponding empty plasmid was used as control for background transport. The indicated substrates were all used at 0.5 µM. (A) Uptake assay for the ThMFS1 (THOM_0963) protein expressed using pET16b in E. coli Rosetta2(DE3)pLysS and the native (not codon optimised) ORF. (B) Uptake assay for the ThMFS2 (THOM_1192) protein expressed with the ptrc99a plasmid system in E. coli GD1333 and the E. coli codon optimised synthetic ORF. (C) Uptake assay for the ThMFS3 (THOM_1681) protein expressed with pET16b system in E. coli Rosetta2(DE3)pLysS and the native ORF. (D) Uptake assay for the ThMFS4 (THOM_3170) protein expressed with the ptrc99a plasmid system in E. coli GD1333 and the E. coli codon optimised synthetic ORF. N = 3 for each condition with the error bars representing standard deviations. All 8 min time points for specified transporters and nucleotides were significantly different at p<0.05 (one-way ANOVA) from controls (empty plasmids, ptrc99a or pET-16b).
-
Figure 4—source data 1
Raw data and their processing to calculate the transport of the tested nucleotides by ThMFS1-4 expressed in E. coli (worksheet 1: panels A and C; worksheet 2: panels B and D).
- https://doi.org/10.7554/eLife.47037.026
Figure 5 with 1 supplement
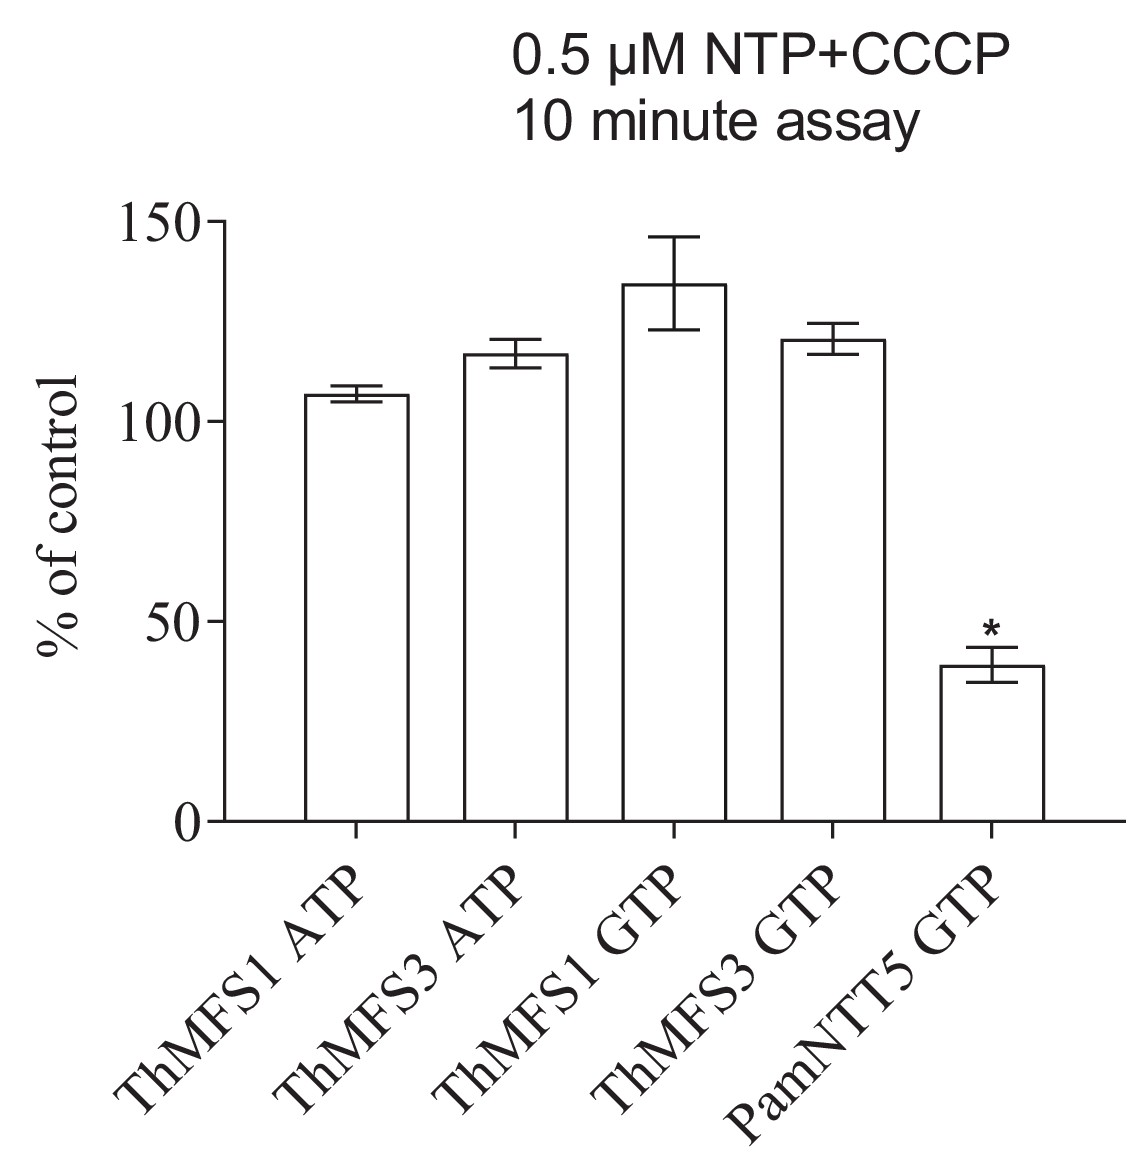
Lack of impact of the protonophore CCCP on nucleotide import in E. coli expressing the two parasite cell-surface located ThMFS proteins.
[α32P]-nucleotide import by ThMFS1, ThMFS3, and by the Protochlamydia amoebophila symporter NTT5 (PamNTT5) (Haferkamp et al., 2006) was compared in the absence (control, set to 100%) and presence of the protonophore CCCP. The GTP and ATP H+-symporter PamNTT5 was used as a positive control for CCCP inhibition (Haferkamp et al., 2006). N = 3 for each condition with the error bars representing standard deviations. The significant reduction of transport between control (no CCCP) and CCCP treatments at p<0.05 (one-way ANOVA) is indicated with *.
-
Figure 5—source data 1
Raw transport data and their processing to investigate the impact of the protonophore CCCP on nucleotide import in E. coli expressing ThMFS1, ThMFS3 or the control PamNTT5 (Figure 5, Figure 5—figure supplement 1).
- https://doi.org/10.7554/eLife.47037.029
Figure 5—figure supplement 1
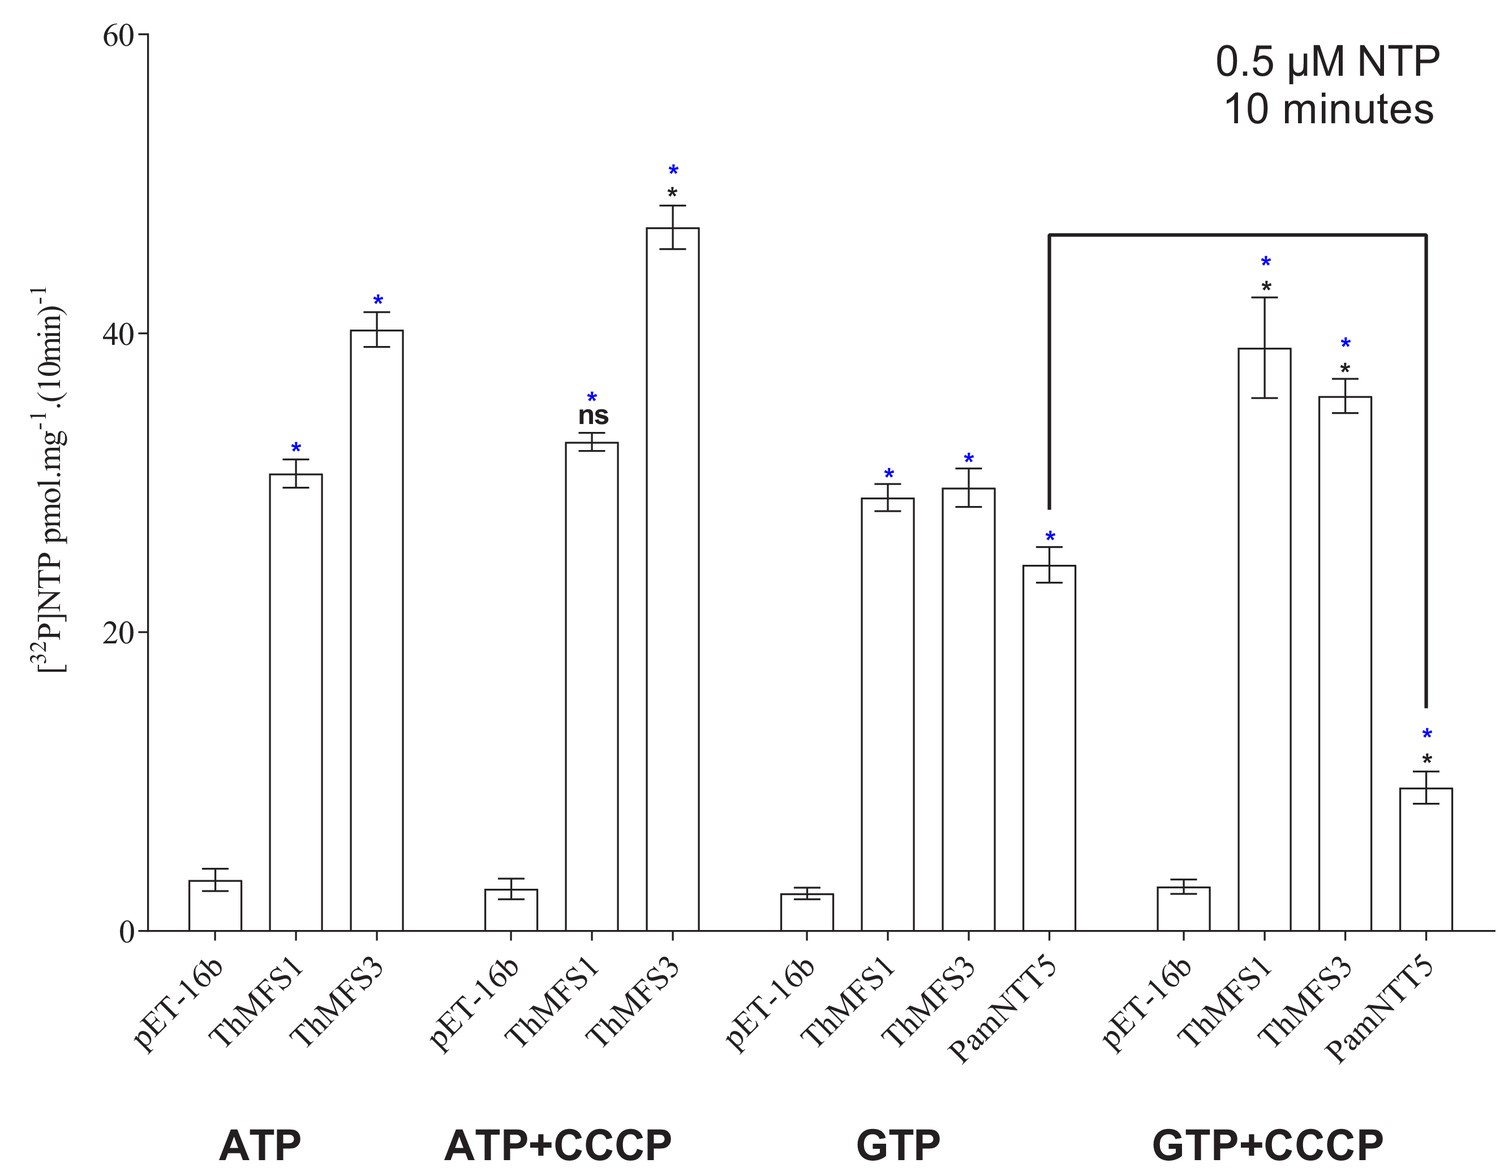
Impact of the protonophore CCCP on nucleotide transport by E. coli expressing ThMFS1, ThMFS3 or the control PamNTT5.
The transport data used to generate Figure 5. Uptake assays were performed using radiolabelled nucleotides in presence or absence of the protonophore CCCP. The drug did not inhibit nucleotide uptake in E. coli cells expressing ThMFS1 or ThMFS3. Inhibition of GTP uptake by PamNTT5 expressing E. coli cells (positive control; Haferkamp et al., 2006) demonstrated that the drug was functional. Significant differences at p<0.05 (one-way ANOVA) between controls (empty plasmid) and indicated transporters are shown with blue stars (*) or between untreated and CCCP treatments are shown with black stars (*) (the black line highlights the comparison for the PamNTT5 transporter). N = 3 with error bars representing standard deviation.
Tables
Key resources table
| Reagent type (species) or resource | Designation | Source or reference | Identifiers | Additional information |
|---|---|---|---|---|
| Gene (T. hominis) | ThMFS1, native ORF, MFS family c_456 in Nakjang et al. (2013) | PCR cloned T. hominis gDNA Heinz et al. (2012) | JH993885.1 (GenBank accessions) | THOM_0963 (locus tags) |
| Gene (T. hominis) | ThMFS2, native ORF MFS family c_456 in Nakjang et al. (2013) | PCR cloned T. hominis gDNA Heinz et al. (2012) | MH824667 (GenBank accessions) | THOM_1192 (locus tags) |
| Gene (T. hominis) | ThMFS3, native ORF, MFS family c_456 in Nakjang et al. (2013) | PCR clonedT. hominis gDNA Heinz et al. (2012) | MH824668 (GenBank accessions) | THOM_1681 (locus tags) |
| Gene (T. hominis) | ThMFS4, native ORF, MFS family c_456 in Nakjang et al. (2013) | PCR cloned T. hominis gDNA Heinz et al. (2012) | JH994098.1 (GenBank accessions) | THOM_3170 (locus tags) |
| Gene (T. hominis) | ThMFS1 Synthetic ORF | GeneArt, Thermo Fisher Scientific | MH824663 (GenBank accessions) | Codon optimised for E. coli with an HA tag at the C-termini |
| Gene (T. hominis) | ThMFS2 Synthetic ORF | GeneArt, Thermo Fisher Scientific | MH824664 (GenBank accessions) | Codon optimised for E. coli with an HA tag at the C-termini |
| Gene (T. hominis) | ThMFS3 Synthetic ORF | GeneArt, Thermo Fisher Scientific | MH824665 (GenBank accessions) | Codon optimised for E. coli with an HA tag at the C-termini |
| Gene (T. hominis) | ThMFS4 Synthetic ORF | GeneArt, Thermo Fisher Scientific | MH824666 (GenBank accessions) | Codon optimised for E. coli with an HA tag at the C-termini |
| Sequenced-based reagent | THOM_0963 VspI F | This study | PCR primer ThMFS1-F | TGCACCATTAATGAACCGTT TTTGAACATG |
| Sequenced-based reagent | THOM_0963 BglII R | This study | PCR primer ThMFS1-R | CACTTGAGAT CTTTACATCG TAGACTTAGG |
| Sequenced-based reagent | THOM_1192 NdeI F | This study | PCR primer ThMFS2-F | TGCACCCATA TGCCATCAAT GAATAGGTCC |
| Sequenced-based reagent | THOM_1192 BamHI R | This study | PCR primer ThMFS2-R | CACTTGGGAT CCTTATTTGT TCCTCTTTTT |
| Sequenced-based reagent | THOM_1681 NdeI F | This study | PCR primer ThMFS3-F | TGCACCCATA TGGATTGCCG GCTTTTGAGT |
| Sequenced-based reagent | THOM_1681 BamHI R | This study | PCR primer ThMFS3-R | CACTTGGGAT CCTCACTCAA TTTCCGCAGG |
| Sequenced-based reagent | THOM_3170 NdeI F | This study | PCR primer ThMFS4-F | TGCACCCATA TGCACAGAAA TTTTATACTC |
| Sequenced-based reagent | THOM_3170 BamHI R | This study | PCR primer ThMFS4-R | CACTTGGGAT CCTTATTTGT GTGCGGTCCA |
| Sequenced-based reagent | NupG XbaI F | This study | PCR primer NupG-F | TGCACCTCTA GAATGAATCTT AAGCTGCAG |
| Sequenced-based reagent | NupG HindIII R | This study | PCR primer NupG-R | CACTTGAAGC TTTTAGTGGCT AACCGTCTG |
| Cell line (Oryctolagus cuniculus) | Rabbit kidney cell line RK13 | LGC-Standards – ATCC | ATCC CCL-37 | Infected with the Bovine Viral Diarrhea Virus |
| Strain, strain background (E. coli) | E. coli GD1333 | Nørholm and Dandanell (2001) | Kindly provided by Prof. Gert Dandanell, University of Copenhagen | This strain does not express the two native nucleoside transporters NupG and NupC |
| Strain, strain background (E. coli) | E. coli Rosetta2(DE3) pLysS | Novagen | BL21 derivative designed to enhance the expression of eukaryotic proteins that contain codons rarely used in E. coli | |
| Recombinant DNA reagent | pET16b-ThMFS1 | This study | Native ORF, PCR cloned (JH993885.1) | |
| Recombinant DNA reagent | pET16b-ThMFS2 | This study | Native ORF, PCR cloned (MH824667) | |
| Recombinant DNA reagent | pET16b-ThMFS3 | This study | Native ORF, PCR cloned (MH824668) | |
| Recombinant DNA reagent | pET16b-ThMFS4 | This study | Native ORF, PCR cloned (JH994098.1) | |
| Recombinant DNA reagent | ptrc99a-ThMFS1 | This study | Synthetic ORF with codon optimised for E. coli (MH824663) XbaI – HindIII | |
| Sequenced-based reagent | ptrc99a-ThMFS2 | This study | Synthetic ORF codon optimised for E. coli (MH824664) XbaI – HindIII | |
| Sequenced-based reagent | ptrc99a-ThMFS3 | This study | Synthetic ORF with codon optimised for E. coli (MH824665) XbaI – HindIII | |
| Sequenced-based reagent | ptrc99a-ThMFS4 | This study | Synthetic ORF with codon optimised for E. coli (MH824666) XbaI – HindIII | |
| Sequenced-based reagent | ptrc99a-NupG | This study | Rosetta2(DE3) pLysS gDNA for PCR cloning | Native E. coli NupG ORF, PCR cloned |
| Sequenced-based reagent | pET16b-RozNTT | Dean et al. (2018) | Native Rozella allomycis NTT ORF, PCR cloned | |
| Sequenced-based reagent | pET16b-PamNTT5 | Haferkamp et al. (2006) | Kindly provided by Dr Ilka Haferkamp, University of Kaiserslautern | Native Protochlamydia amoebophila NTT5 ORF, PCR cloned |
| Antibody | anti-ThMFS1 peptides (affinity purified, rabbit polyclonal) | BioGenes GmbH (Germany). This study | Peptides: CIKSYDRAER SNADIES and CEDEGDNKPS NPKST | IFA: 1:50; WB: 1:1000 |
| Antibody | anti-ThMFS2 peptides (affinity purified, rabbit polyclonal) | BioGenes GmbH (Germany). This study | Peptides: CKTPKFKKDV KENLTREGR and CIDRDLKDPR TVNEDES | IFA: 1:2, 1:10, or 1:50; WB: 1:1000 |
| Antibody | anti-ThMFS3 peptides (affinity purified, rabbit polyclonal) | BioGenes GmbH (Germany). This study | Peptides: CNYLEHEGLD VRQSGR and CFSRRLRGEG TKNREN | IFA: 1:50; WB: 1:1000 |
| Antibody | anti-ThMFS4 peptides (affinity purified, rabbit polyclonal) | BioGenes GmbH (Germany). This study | Peptides: CVKRTNSSNR NVGTAK and CKPEAVLFKR KISLKD | IFA: 1:2, 1:10, or 1:50; WB: 1:1000 |
| Antibody | anti-ThmitHsp70 (rat, polyclonal) | Heinz et al. (2014); Dean et al. (2018) | IFA: 1:200 | |
| Antibody | Alexa Fluor 488 Goat Anti-Rat IgG (H+L) (polyclonal) | ThermoFisher Scientific | IFA: 1:500 | |
| Antibody | Alexa Fluor 594 Goat Anti-Rabbit IgG (H+L) (polyclonal) | ThermoFisher Scientific | IFA: 1:500 | |
| Antibody | Peroxidase (HRP) conjugated Goat Anti-Rabbit IgG Antibody (polyclonal) | Sigma | WB: 1:10000 |
Additional files
-
Transparent reporting form
- https://doi.org/10.7554/eLife.47037.030
Download links
A two-part list of links to download the article, or parts of the article, in various formats.
Downloads (link to download the article as PDF)
Open citations (links to open the citations from this article in various online reference manager services)
Cite this article (links to download the citations from this article in formats compatible with various reference manager tools)
A new family of cell surface located purine transporters in Microsporidia and related fungal endoparasites
eLife 8:e47037.
https://doi.org/10.7554/eLife.47037


