Epigenetic silencing of a multifunctional plant stress regulator
- Salk Institute for Biological Studies, United States
- Howard Hughes Medical Institute, Salk Institute for Biological Studies, United States
- University of Pennsylvania, United States
Abstract
The central regulator of the ethylene (ET) signaling pathway, which controls a plethora of developmental programs and responses to environmental cues in plants, is ETHYLENE-INSENSITIVE2 (EIN2). Here we identify a chromatin-dependent regulatory mechanism at EIN2 requiring two genes: ETHYLENE-INSENSITIVE6 (EIN6), which is a H3K27me3 demethylase also known as RELATIVE OF EARLY FLOWERING6 (REF6), and EIN6 ENHANCER (EEN), the Arabidopsis homolog of the yeast INO80 chromatin remodeling complex subunit IES6 (INO EIGHTY SUBUNIT). Strikingly, EIN6 (REF6) and the INO80 complex redundantly control the level and the localization of the repressive histone modification H3K27me3 and the histone variant H2A.Z at the 5’ untranslated region (5’UTR) intron of EIN2. Concomitant loss of EIN6 (REF6) and the INO80 complex shifts the chromatin landscape at EIN2 to a repressive state causing a dramatic reduction of EIN2 expression. These results uncover a unique type of chromatin regulation which safeguards the expression of an essential multifunctional plant stress regulator.
https://doi.org/10.7554/eLife.47835.001Introduction
The gaseous plant hormone ethylene regulates numerous biological processes ranging from development to responses to environmental stimuli (Johnson and Ecker, 1998). The ET signaling pathway evolved over 450 million years ago with EIN2 as its master regulator (Alonso et al., 1999; Ju et al., 2015). In the absence of ethylene, EIN2 is constitutively phosphorylated by the Raf-like protein kinase CONSTITUTIVE TRIPLE RESPONSE1 (CTR1). Upon ET perception, EIN2 is no longer phosphorylated by CTR1, resulting in the proteolytic cleavage of EIN2’s C-terminal CEND domain (EIN2C) (Ju et al., 2012; Qiao et al., 2012; Wen et al., 2012). This multifunctional EIN2C has multiple modes of action (Zheng and Zhu, 2016). In the cytoplasm, EIN2C functions to facilitate the translational repression of mRNAs for the EIN3/EIL1-degrading F-box proteins EIN3 BINDING F BOX1/2 (EBF1/EBF2) in cytoplasmic P-bodies (Merchante et al., 2015; Li et al., 2015). EIN2C also translocates to the nucleus where it stabilizes the ethylene response master regulatory transcription factors (TFs) EIN3 and EIL1 through a currently unknown mechanism (Ju et al., 2012; Qiao et al., 2012; Wen et al., 2012). In addition, nuclear-localized EIN2C also directly regulates histone acetylation through an association with EIN2 NUCLEAR-ASSOCIATED PROTEIN1 (ENAP1) at ET-responsive genes (Zhang et al., 2017). ET is crucial for the integration of biotic and abiotic stress responses into plant growth pathways (Dubois et al., 2018) which is underscored by the severe stress-related phenotypes displayed by ein2 loss-of-function alleles in Arabidopsis (Alonso et al., 1999) as well as in many other species including the legume Medicago truncatula and rice (Oryza sativa) (Penmetsa et al., 2008; Ma et al., 2013). Yet despite EIN2‘s importance for fitness under adverse growth conditions across land plants, its transcriptional regulation and underlying chromatin architecture are completely uncharacterized.
Here we combined genomics, genetics and biochemistry to explore the chromatin environment at EIN2. Through the molecular characterization of the ET-insensitive ein6-1 mutant, we discovered that the major Arabidopsis H3K27me3 demethylase RELATIVE OF EARLY FLOWERING6 (REF6) (Lu et al., 2011) and the INO80 chromatin remodeling complex cooperatively regulate H3K27me3 and H2A.Z occupancy in the 5’UTR intron of EIN2. Importantly, we also propose that in addition to their prominent functions (H3K27me3 demethylation and H2A.Z eviction), EIN6 (REF6) and the INO80 complex also antagonize SWR1-mediated H2A.Z incorporation and PRC2-mediated tri-methylation of H3K27, respectively. Altogether, our results uncover an epigenetic control mechanism that establishes a permissive chromatin state at a critical plant stress regulator.
Results
Mutations in two different genes are responsible for the ET-insensitivity of the ein6-1 mutant
The vast majority of key ET signaling components have been discovered through genetic screens exploiting the triple response phenotype of ET-treated dark-grown seedlings (Guzmán and Ecker, 1990). The ein6-1 mutant originates from a genetic screen of fast neutron-mutagenized A. thaliana Landsberg erecta (Ler) seeds (Roman et al., 1995). However, the causal mutation in the original, ET-insensitive, ein6-1 mutant has remained elusive for more than two decades. Surprisingly, SHOREmap (Schneeberger et al., 2009) and segregation analyses identified mutations in two different genes in the ein6-1 mutant (Figure 1A; Figure 1—figure supplement 1A). Interestingly, only one of the two single mutants displays an ET-hyposensitive root phenotype which we refer to as the ein6-1 single mutant (Figure 1A). The second gene mutation was named EIN6 ENHANCER (EEN) because while een-1 plants show no phenotype, ein6-1 een-1 double mutants show an ET-insensitive root phenotype (Figure 1A).
Figure 1 with 1 supplement see all
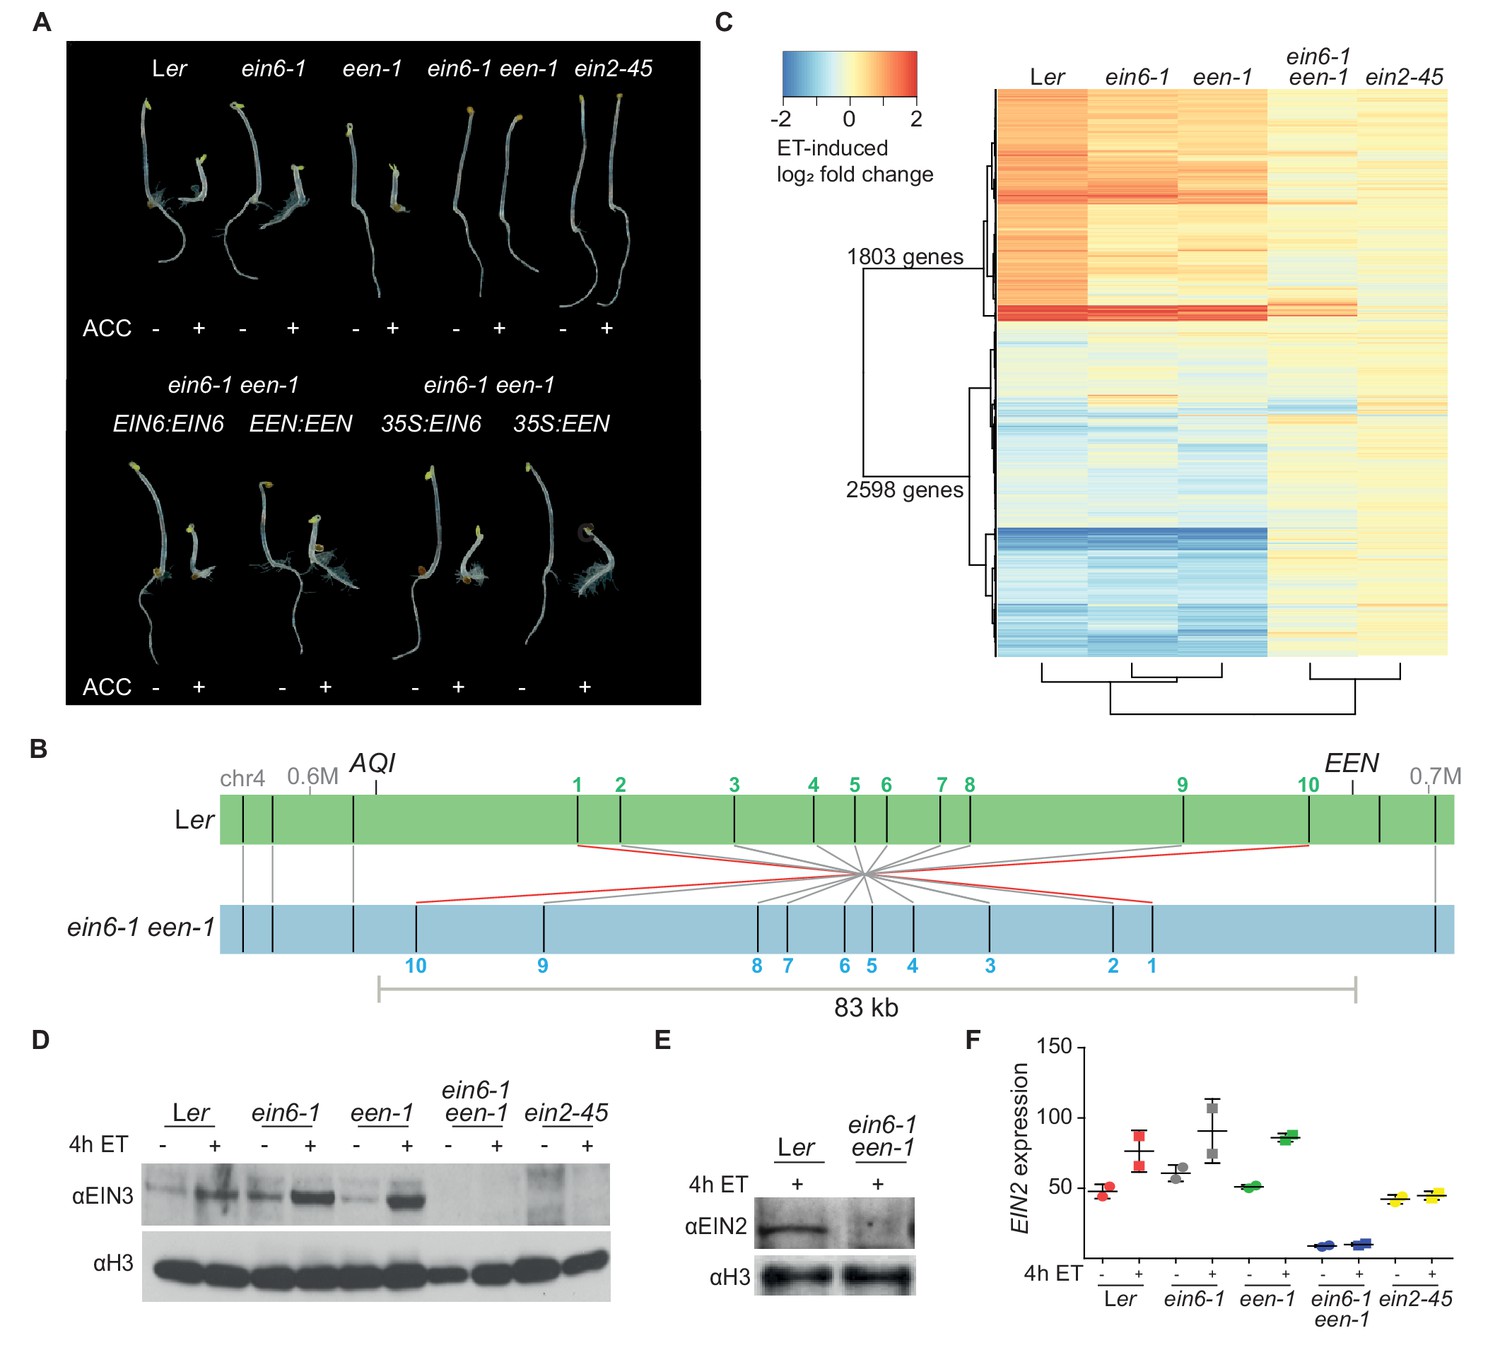
Mutations in two different genes are responsible for the ET-insensitivity in ein6-1 plants.
(A) Triple response phenotype of 3-day-old etiolated seedlings of Ler, ein6-1, een-1, ein6-1 een-1, ein2-45 (upper row) and of the indicated complementation lines, either driven by the respective native promoter or by the Cauliflower mosaic virus 35S promoter (35S) (lower row). Seedlings were grown on control LS media or LS media supplemented with 10 µM ACC. (B) Schematic illustration of a Bionano Genomics Irys optical map of the een-1 inversion region at the end of the fourth chromosome in ein6-1 een-1 (blue) aligned to an optical map of Ler (green). Original output is shown in Figure 1—figure supplement 1D. Nick sites are indicated as black lines within the respective optical map. Matching nick sites between the maps are indicated as gray lines. Numbered nick sites are used to better visualize the inversion event. The approximate position of EEN and AQI is indicated as well. (C) Heatmap visualizes the log2 fold change of expression in Ler, ein6-1, een-1, ein6-1 een-1 and ein2-45 seedlings in response to 4 hr of ethylene (ET) treatment detected by RNA-seq. Differentially expressed genes (DE genes) that are significantly induced (1803 genes) or repressed (2598 genes) after 4 hr of ET treatment in Ler seedlings are shown. Cluster dendogram below the heatmap indicate similarities between the tested genotypes. (D), (E), Western blot analysis of nuclear extracts of 3-day-old etiolated Ler, ein6-1, een-1, ein6-1 een-1 and ein2-45 seedlings that were either treated for 4 hr with hydrocarbon-free air (control) or ET gas. Antibodies against EIN3 and EIN2 were used to detect nuclear-localized EIN3 (D) and EIN2C (E), respectively. Amounts of histone H3 were detected with an anti-H3 antibody and served as a loading control. (F) EIN2 expression in response to 4 hr of ET treatment in the indicated genotypes using RNA-seq is shown. EIN2 transcripts can still be detected in ein2-45 mutants because they only harbor a point mutation in the C-terminus of EIN2 (Beaudoin et al., 2000). Expression is measured in TPM (Transcripts Per Kilobase Million) and results from two biological replicates are shown.
DNA sequencing revealed that the causal mutation at the ein6-1 allele is a seven base pair (bp) deletion in the fifth exon of the RELATIVE OF EARLY FLOWERING6 (REF6, At3g48430) gene, leading to a premature stop codon (Figure 1—figure supplement 1B). REF6 encodes the major H3K27me3 demethylase in Arabidopsis (Lu et al., 2011). The een-1 mutation was discovered by Thermal Asymmetric Interlaced (TAIL)-PCR and also directly visualized using optical mapping of ultra-long Ler and ein6-1 een-1 DNA molecules (Figure 1B; Figure 1—figure supplement 1C and D). een-1 arose from a genomic inversion event of a 83 kilobase pair (kb) region on chromosome four. As a result of two fast neutron bombardment-induced double-strand breaks, one in the 5’UTR of EEN (At4g38495) and the other in the fourth intron of the AQUAPORIN INTERACTOR (AQI, At4g38220) gene, the entire EEN gene was fused with four exons of the AQI gene (Figure 1—figure supplement 1C–G). Sequencing of the chimeric AQI-EEN genomic DNA and cDNA revealed that 14 bp of the EEN 5’UTR are now part of the AQI-EEN cDNA causing an open reading frame shift that results in a premature stop codon within the first exon of EEN (Figure 1—figure supplement 1E–G). Interestingly, EEN shares homology to yeast IES6, a crucial component of the yeast INO80 chromatin remodeling complex whose function is linked to eviction of the histone variant H2A.Z (Papamichos-Chronakis et al., 2011; Chen et al., 2013) (Figure 2—figure supplement 1A).
To explore the interplay between EIN6 (REF6) and EEN in regulating the ET pathway, we examined the transcriptional response to ET using RNA-seq (Supplementary file 1). While both single mutants show nearly wild-type transcriptional responses to ET, ein6-1 een-1 double mutants are similar to ein2-45 mutants, being largely deficient in activating ET-dependent transcription (Figure 1C). A hallmark of an activated ET signaling pathway is EIN2C-mediated stabilization of the transcription factors EIN3 and EIL1 (Guo and Ecker, 2003; Potuschak et al., 2003; Qiao et al., 2012; Wen et al., 2012; Ju et al., 2012). To confirm a previous report showing that the levels of stabilized EIN3 are drastically reduced in ein6-1 een-1 mutants (Guo and Ecker, 2003), immunoblots using an anti-EIN3 antibody were conducted. While wild-type and single mutants accumulate similar levels of EIN3, ein6-1 een-1 mutants accumulate no EIN3 protein in response to ET treatment (Figure 1D). Another prerequisite of the ET response is nuclear localization of the EIN2C domain (Qiao et al., 2012; Wen et al., 2012; Ju et al., 2012). However, nuclear-localized EIN2C protein is absent in ein6-1 een-1 mutants suggesting that the failure to accumulate EIN3 is due to the absence of EIN2C (Figure 1E). Results from RNA-seq indicate that this absence can be explained by the reduction of EIN2 mRNA expression in ein6-1 een-1 double mutants (Figure 1F).
A repressive chromatin environment at EIN2 down-regulates its expression
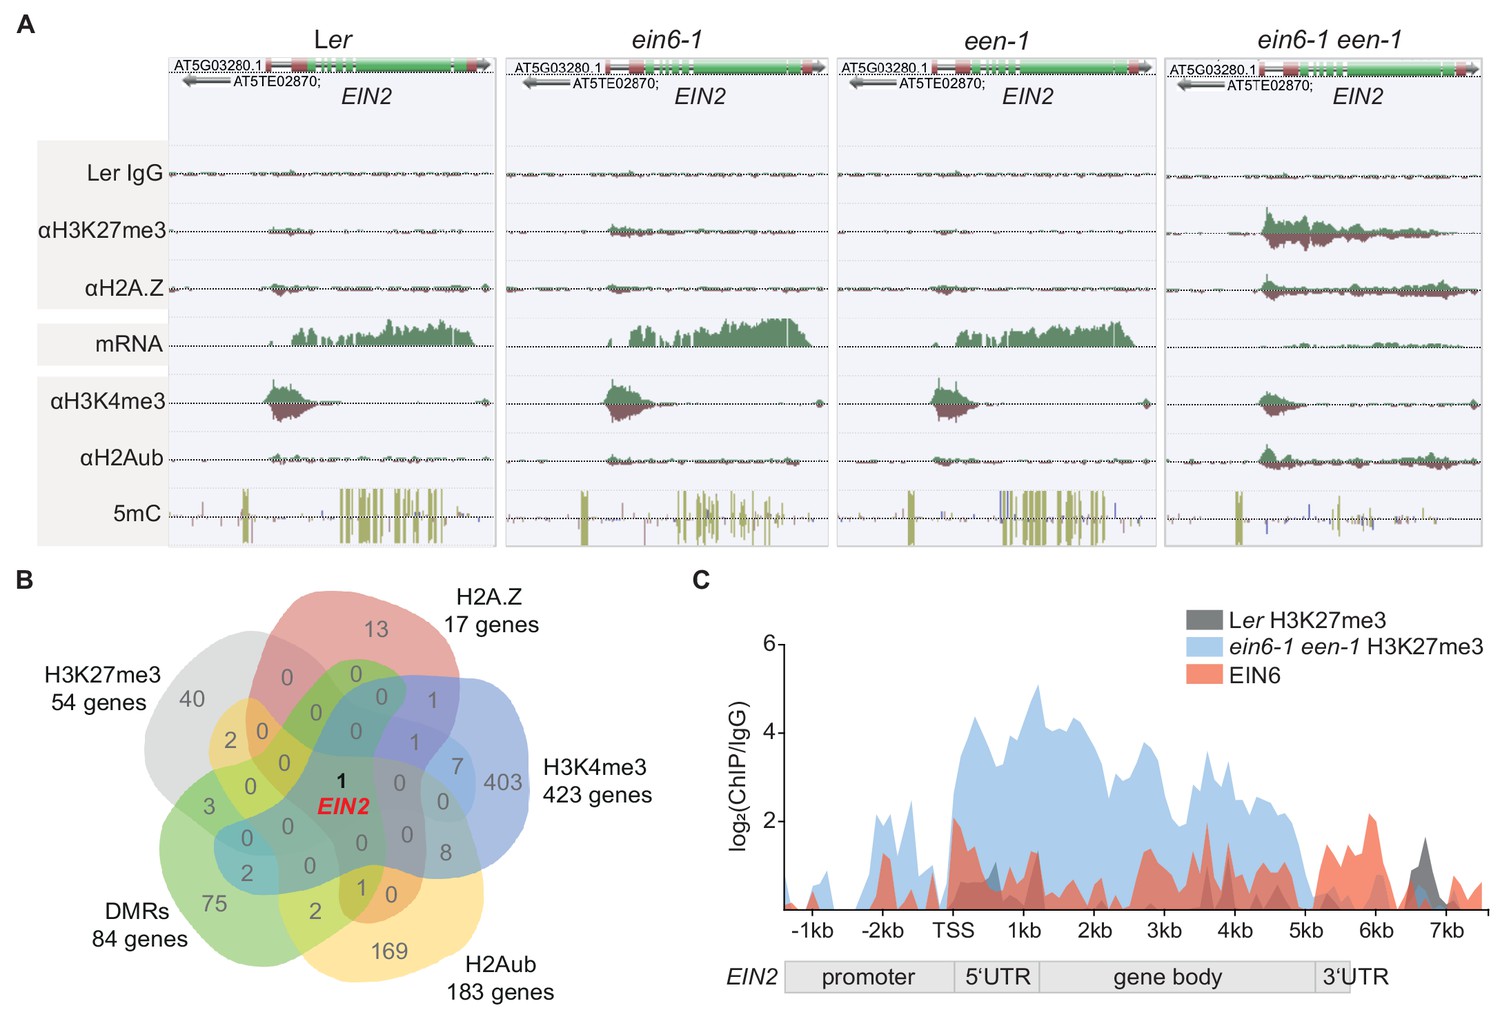
Based on the known H3K27me3 demethylase function of EIN6 (REF6) (Lu et al., 2011) and the potential role of EEN in chromatin remodeling, we hypothesized that the observed impaired EIN2 expression in ein6-1 een-1 mutants is manifested through a specific chromatin-related process. This hypothesis was tested by employing chromatin immunoprecipitation sequencing (ChIP-seq) and MethylC-seq to characterize histone modifications and cytosine DNA methylation, respectively (Supplementary file 2). We first analyzed the genome-wide occupancy of H3K27me3 and discovered a genome-wide ectopic gain of H3K27me3 in the ein6-1 mutant which was previously reported for ref6-3 mutants (Lu et al., 2011). There were 2369 genes (Group I) that gain H3K27me3 in ein6-1 single mutants (2-fold enrichment over Ler) as well as in ein6-1 een-1 double mutants (Figure 2—figure supplement 1B and C; Supplementary file 3). We also found 54 additional genes (Group II) with significantly higher H3K27me3 levels (2-fold enrichment over ein6-1) in the double mutant (Figure 2—figure supplement 1C and D; Supplementary file 3). Strikingly, EIN2 is in Group II and displays one of the strongest increases of H3K27me3 in ein6-1 een-1 mutants, with the mark spreading throughout the gene body (Figure 2A; Figure 2—figure supplement 1E; Supplementary file 3).
Figure 2 with 2 supplements see all
A repressive chromatin environment at EIN2 down-regulates its expression.
(A) Genome browser screenshot visualizes the levels of the depicted chromatin features at the EIN2 gene in untreated 3-day-old etiolated Ler, ein6-1, een-1 and ein6-1 een-1 seedlings. Occupancy of H3K27me3, H2A.Z, H3K4me3 and H2Aub was determined with ChIP-seq, mRNA expression was measured with RNA-seq and levels of methylated cytosines (CG in yellow, CHG in blue, CGG in pink) were determined with MethylC-seq. To ensure an accurate comparison of individual chromatin features between genotypes, the tracks were normalized to the respective sequencing depth. Normalization was separately done for each chromatin feature. Biological replicate 1 of the H3K27me3 and H2A.Z ChIP-seq datasets is shown. (B) Venn diagram illustrates the overlap between genes that show a significant increase of H3K27me3 (2-fold enrichment over ein6-1), H2AZ (2-fold enrichment over een-1) and H2Aub (2-fold enrichment over Ler) in ein6-1 een-1 mutants and also a significant decrease of H3K4me3 (1.5-fold enrichment in Ler over ein6-1 een-1). In addition, genes that contain differentially methylated regions (DMRs) with ten or more methylated cytosines in at least one genotype were included as well. (C) Graphical illustration of H3K27me3 and EIN6 occupancy at the EIN2 gene determined with ChIP-seq. Sequencing reads were merged between biological replicates for the H3K27me3 ChIP-seq using untreated 3-day-old etiolated Ler (gray) and ein6-1 een-1 (blue) seedlings (two replicates each) and the EIN6 ChIP-seq (red) using Ler 35S:EIN6-FLAG seedlings (three replicates). The occupancy was calculated as the ratio between the respective merged ChIP and the merged Ler IgG control in 100 bp bins from 2.4 kb upstream to 7.7 kb downstream of the transcriptional start site (TSS) of EIN2 and is shown as log2 fold change. Negative values which reflect lower occupancy in the ChIP sample compared to the IgG control sample were set to zero.
Given the role of the INO80 complex in H2A.Z eviction (Alatwi and Downs, 2015; Papamichos-Chronakis et al., 2011), we employed ChIP-seq to survey the genome-wide distribution of H2A.Z using a commercial H2A.Z antibody (Jupe et al., 2019). The Swi2/Snf2-related 1 (SWR1) complex subunit PHOTOPERIOD-INDEPENDENT EARLY FLOWERING1 (PIE1) is required for H2A.Z deposition (Noh and Amasino, 2003) and ChIP-seq of H2A.Z in pie1-1 mutants confirmed a lack of H2A.Z genome-wide (Figure 2—figure supplement 1G and H). To further validate our H2A.Z antibody, we performed ChIP-seq analyses with equal amounts of the same Col-0 HTA11:HTA11-GFP chromatin using either a commercial GFP or our commercial H2A.Z antibody. Both antibodies gave similar H2A.Z occupancy results (Figure 2—figure supplement 1F–H). In addition, a direct comparison of our antibody validation H2A.Z profiles (Col-0, pie1-1, Col-0 HTA11:HTA11-GFP (αH2A.Z) and Col-0 HTA11:HTA11-GFP (αGFP)) with three publicly available H2A.Z ChIP-seq datasets (Carter et al., 2018; Wollmann et al., 2017; Coleman-Derr and Zilberman, 2012) further confirmed the suitability of our H2A.Z antibody (Figure 2—figure supplement 1F–H). Only 17 genes showed an increase of H2A.Z in ein6-1 een-1 mutants (1.5-fold enrichment over een-1), and again, EIN2 was among genes having high levels of ectopically localized H2A.Z throughout its entire gene body (Figure 2A, Figure 2—figure supplement 1I; Supplementary file 4). H2A.Z and H3K27me3 are functionally linked and both repress transcription in Arabidopsis (Carter et al., 2018; Coleman-Derr and Zilberman, 2012). These findings imply that the strong accumulation of H3K27me3 and H2A.Z at EIN2 creates a highly repressive chromatin environment leading to strongly reduced EIN2 expression and ET-insensitivity in ein6-1 een-1 mutants (Figures 1F and 2A).
Concordant with its compromised expression, levels of H3K4me3, a histone mark that is typically enriched at transcriptionally active genes in Arabidopsis (Fromm and Avramova, 2014), were reduced at EIN2 in the double mutant (Figures 1F and 2A; Figure 2—figure supplement 2A; Supplementary file 4). In keeping with the accumulation of repressive marks, levels of mono-ubiquitinated H2A (H2Aub) are also clearly increased at EIN2 in ein6-1 een-1 mutants, demonstrating increased PRC1-mediated gene silencing (Figure 2A; Figure 2—figure supplement 2B; Supplementary file 4). Moreover, MethylC-seq analysis also discovered a complete loss of gene body cytosine DNA methylation at EIN2 in the double mutant (Figure 2A; Figure 2—figure supplement 2C; Supplementary file 4); the accumulation of gene body H2A.Z is mutually exclusive with DNA methylation (Coleman-Derr and Zilberman, 2012). These results reveal the highly specific nature of EIN6 (REF6)/EEN-mediated regulation since EIN2 is the only gene in the entire Arabidopsis genome displaying such a unique chromatin change in ein6-1 een-1 mutants (Figure 2B).
EIN6 (REF6) binds to the CTCTGYTY DNA motif at target genes through its C-terminal zinc fingers (Cui et al., 2016; Li et al., 2016). The 5’UTR intron region of EIN2 contains two of these DNA motifs (Figure 2—figure supplement 2D). Therefore, we tested for direct EIN6/EIN6-ZNF binding to EIN2 by conducting EIN6 ChIP-seq and EIN6 zinc finger (EIN6-ZNF) DAP-seq (O’Malley et al., 2016) assays. Both assays successfully identified the CTCTGYTY motif as the preferred binding motif (Figure 2—figure supplement 2E and F; Supplementary file 5). We observed direct EIN6/EIN6-ZNF binding within the 5’UTR intron and the gene body of EIN2 (Figure 2C; Figure 2—figure supplement 2G). The importance of the zinc fingers of EIN6 (REF6) for EIN2 regulation was further confirmed by the failure of a truncated EIN6 (REF6) construct without the zinc fingers (EIN6ΔZNF) to complement the ein6-1 een-1 triple response phenotype (Figure 2—figure supplement 2H).
EEN is a subunit of the Arabidopsis INO80 chromatin remodeling complex
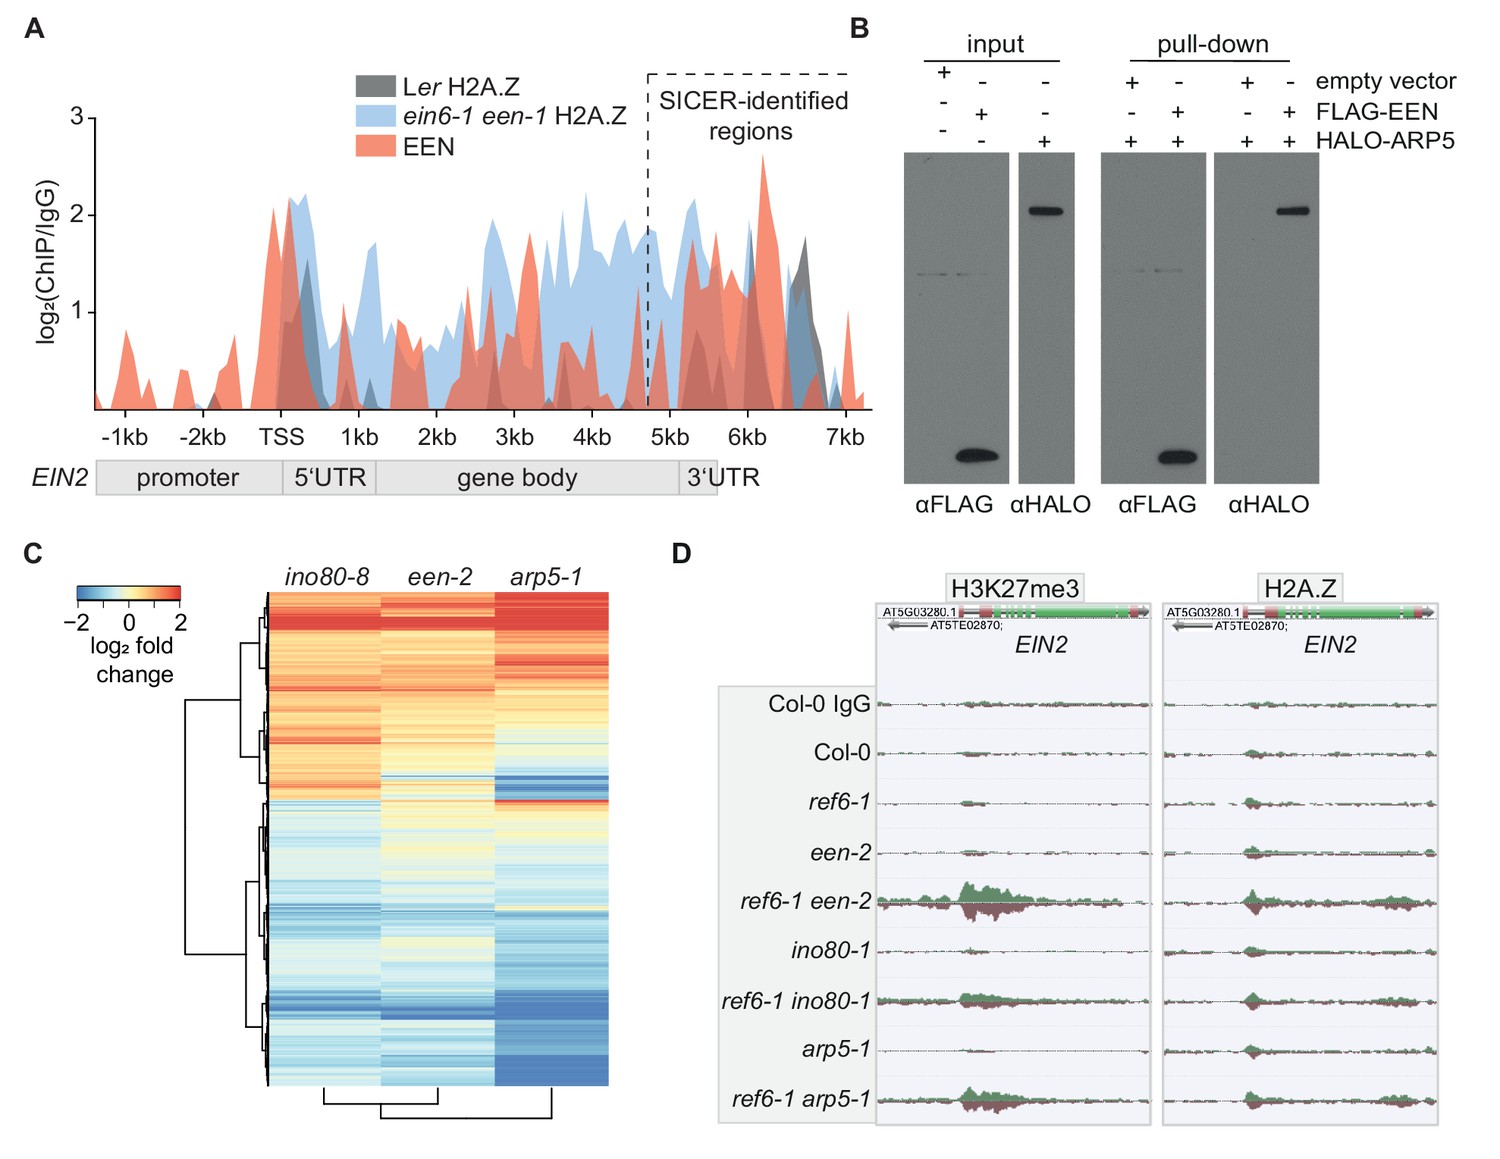
Next, we focused on the molecular characterization of EEN, an uncharacterized Arabidopsis gene. EEN is a small YL1 nuclear protein C-terminal (YL1-C) domain-containing 14 kilodalton (kDa) protein that is cytoplasm- and nuclear-localized and expressed throughout the entire Arabidopsis seedling (Figure 2—figure supplement 1A; Figure 3—figure supplement 1A and B). EEN also binds to EIN2, especially in the 3’UTR region (Figure 3A; Figure 3—figure supplement 1C). Its yeast homolog IES6 forms the nucleosome recognition module of the INO80 chromatin remodeling complex with ACTIN-RELATED PROTEIN5 (ARP5) (Eustermann et al., 2018). This module is crucial for remodeling activity of the INO80 complex (Tosi et al., 2013; Eustermann et al., 2018; Watanabe et al., 2015). In vitro pulldowns demonstrated an interaction between EEN and Arabidopsis ARP5 (Figure 3B). To investigate whether this interaction also occurs in planta, mass spectrometry (MS) analysis was conducted which identified ARP5 as a strong EEN interactor (Figure 3—figure supplement 1D; Supplementary file 6). Next, we validated the INO80 complex subunit function of EEN by analyzing the transcriptomes of newly identified ino80 and een T-DNA insertion mutants (ino80-8, een-2) (Figure 3—figure supplement 1E–H). Compared to wild-type plants, 1866 genes were differentially expressed in ino80-8 mutants (Figure 3C). These same genes were also differentially expressed in a remarkably similar manner in een-2 and arp5-1 mutants (Figure 3C; Supplementary file 7). Finally, we generated double mutants (ref6-1 een-2, ref6-1 ino80-1 and ref6-1 arp5-1) that each strikingly display increased levels of H3K27me3 and H2A.Z at EIN2 (Figure 3D, Figure 3—figure supplement 1I and J) highlighting that the ein6-1 een-1 molecular phenotype cannot be attributed to the unique combination of a fast-neutron bombardment-induced deletion (ein6-1) and inversion (een-1). These double mutants also exhibit a hypo-sensitive triple response phenotype, although not as severe as in ein6-1 een-1 mutants (Figure 3—figure supplement 1K). We speculate that differences between ecotypes (Ler versus Col-0) and/or differences between the ein6/ref6 alleles (7 bp deletion versus T-DNA insertion) might cause this phenotypic discrepancy. Interestingly, ref6-1 een-2 pie1-1 triple mutants that are also deficient in the ATPase subunit of the SWR1 chromatin remodeling complex display a wild-type triple response phenotype (Noh and Amasino, 2003). This result suggests that the loss of chromatinized H2A.Z in pie1-1 mutants can suppress the hypo-sensitive triple response phenotype of ref6-1 een-2 mutants (Figure 2—figure supplement 1G and H; Figure 3—figure supplement 1K). Taken together, our combined biochemical, genomic and genetic data identified EEN, complexed with ARP5, an integral part of the Arabidopsis INO80 chromatin remodeler along with EIN6 (REF6), directly controls the chromatin environment at EIN2.
Figure 3 with 1 supplement see all
EEN is a subunit of the INO80 chromatin remodeling complex.
(A) Graphical representation of H2A.Z and EEN occupancy at the EIN2 gene determined with ChIP-seq. Sequencing reads of two merged H2A.Z ChIP-seq’s (Ler (gray), ein6-1 een-1 (blue)) and one EEN ChIP-seq (Col-0 35S:EEN-FLAG (red)) using 3-day-old etiolated seedlings were used. The occupancy is displayed as log2 fold change and was calculated as the ratio between the respective ChIP and the respective IgG control in 100 bp bins from 2.4 kb upstream to 7.7 kb downstream of the transcriptional start site (TSS) of EIN2. Occupancies that were lower in the ChIP sample compared to the IgG sample were set to zero. The region with significant EEN enrichment determined with SICER is indicated as well. (B) FLAG-pull-down assays using FLAG-tagged EEN and Halo-tagged ARP5 that were in vitro translated in rabbit reticulocyte extract. Anti-FLAG and anti-Halo antibodies were used to confirm EEN/ARP5 expression, EEN immunoprecipitation and EEN-ARP5 interaction. (C) Heatmap illustrates the log2 fold change in mRNA expression of INO80-dependent genes in untreated 3-day-old etiolated ino80-8, een-2 and arp5-1 seedlings relative to their expression in Col-0 seedlings. INO80-dependent genes were selected as genes that show a significant differential expression in ino80-8 mutant seedlings compared to Col-0 seedlings (787 genes up, 1079 genes down). (D) Genome browser screenshot shows the occupancy of H3K27me3 (right) and H2A.Z (left) at the EIN2 gene in untreated 3-day-old etiolated Col-0, ref6-1, een-2, ref6-1 een-2, ino80-1, ref6-1 ino80-1, arp5-1 and ref6-1 arp5-1 seedlings. Genome-wide occupancy of H3K27me3 and H2A.Z was determined by ChIP-seq. To ensure an accurate comparison of individual chromatin features between genotypes, the tracks were normalized to the respective sequencing depth. Normalization was separately done for each chromatin feature.
INO80 controls ethylene-induced H2A.Z eviction dynamics
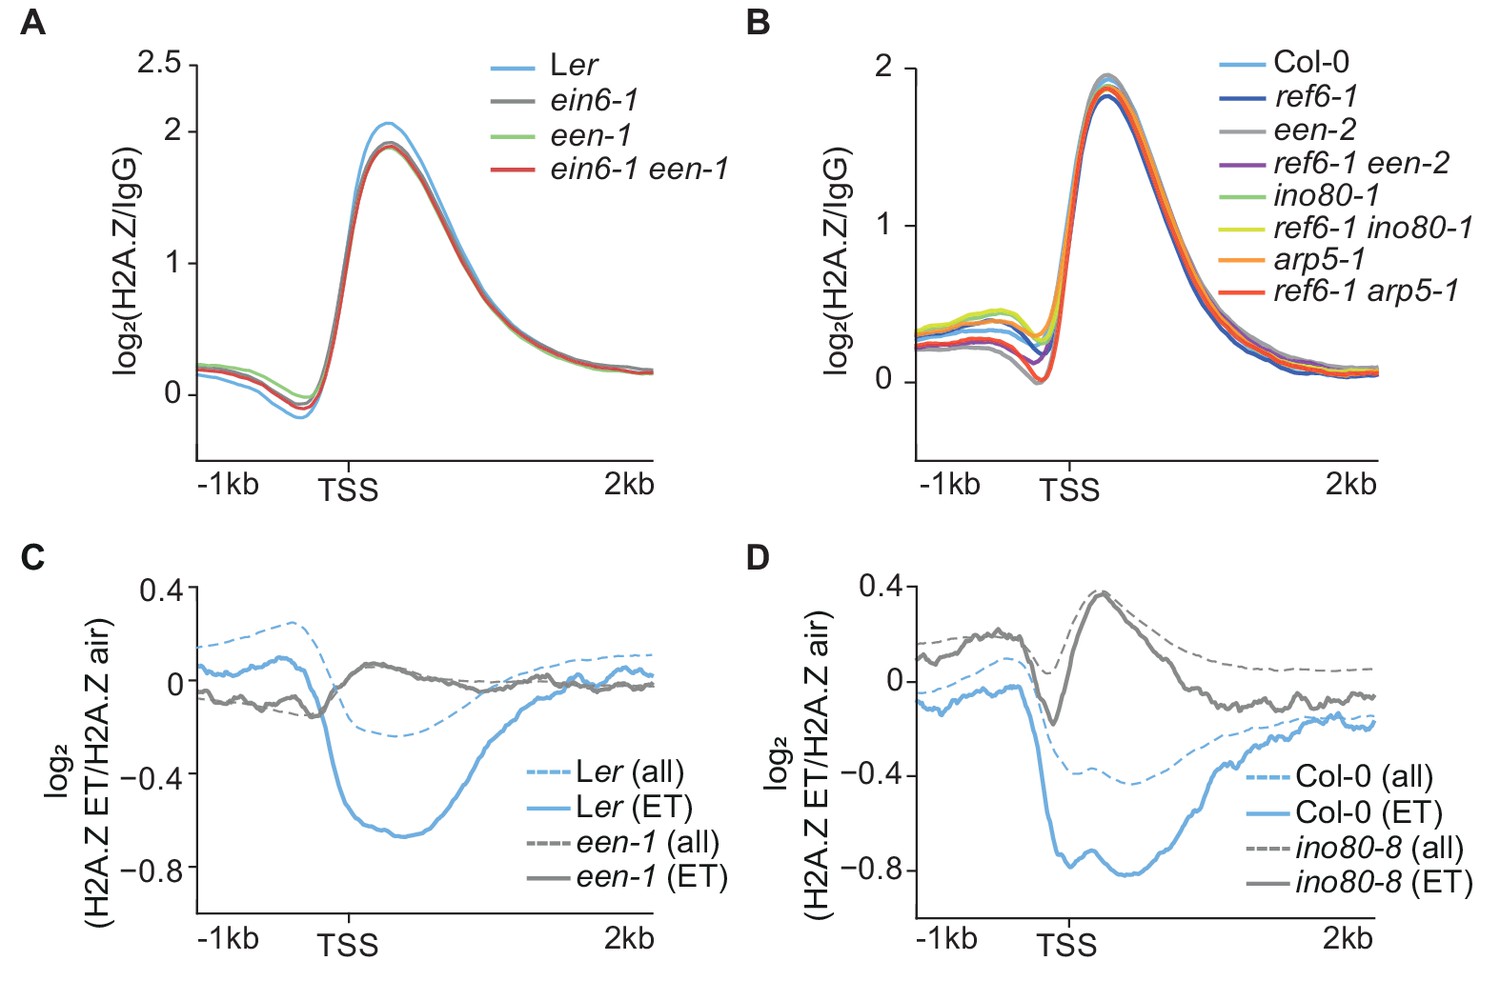
INO80 interacts with H2A.Z in Arabidopsis (Zhang et al., 2015) and high levels of H2A.Z at EIN2 in ein6-1 een-1 mutants suggest a role for the Arabidopsis INO80 complex in controlling H2A.Z dynamics as reported for other organisms (Figure 2A) (Papamichos-Chronakis et al., 2011; Alatwi and Downs, 2015). Surprisingly, a global defect of the H2A.Z landscape in ino80-1 mutants and mutants of INO80 complex subunits (een-1, een-2 and arp5-1) to wild-type was not observed (Figure 4A and B). Except for pie1-1 mutants, the global impact on the H2A.Z landscape was only marginally affected in all tested single and double mutants (Figure 4A and B; Figure 2—figure supplement 1G and H). Furthermore, the gain of H2A.Z only becomes evident in double mutants at a few loci including EIN2 (Figures 2A and 3D). Interestingly, ChIP-seq assays revealed that EEN predominantly binds to gene bodies of environmentally responsive genes that harbor gene body H2A.Z (Figure 4—figure supplement 1A–C; Supplementary file 5). Considering the role of H2A.Z in conferring gene responsiveness to environmental stimuli (Sura et al., 2017; Coleman-Derr and Zilberman, 2012), we speculated that the INO80 complex is potentially involved in the stimulus-induced eviction of H2A.Z. Thus, we examined the H2A.Z landscape in een-1 and ino80-8 mutants in ET-treated seedlings and found that robust hormone-induced H2A.Z eviction (≥1.3 fold, air vs 4 hr ET) occurs at 1076 genes (Supplementary file 8). These eviction dynamics were compromised in een-1 and ino80-8 mutants suggesting that the Arabidopsis INO80 complex is involved in the H2A.Z eviction process (Figure 4C and D; Figure 4—figure supplement 1D).
Figure 4 with 1 supplement see all
INO80 controls ethylene-induced H2A.Z eviction dynamics.
(A) (B) Aggregated H2A.Z profile of all Arabidopsis genes (TAIR10) in Ler, ein6-1, een-1, ein6-1 een-1 (A) and Col-0, ref6-1, een-2, ref6-1 een-2, ino80-1, ref6-1 ino80-1, arp5-1 and ref6-1 arp5-1 (B) seedlings from 1 kb upstream to 2 kb downstream of the TSS determined by ChIP-seq. (C) (D) ET-induced H2A.Z eviction dynamics are shown as aggregated H2A.Z profiles of 3-day-old etiolated Ler, een-1, Col-0 and ino80-8 seedlings treated for 4 hr with ET gas. Two biological H2A.Z ChIP-seq replicates for Ler and een-1 (C) and one for Col-0 and ino80-8 (D) were analyzed. Profiles visualize the log2 fold change between the respective air and ET-treated H2A.Z ChIP-seq samples from 1 kb upstream to 2 kb downstream of the TSS. 1076 genes that show a robust H2A.Z eviction in response to ET in all replicates (≥1.3 fold SICER comparison, air vs 4 hr ET) are shown as solid lines whereas all genes (TAIR10) are shown as dashed lines.
EIN6 (REF6)/INO80-mediated regulation occurs at the 5’UTR intron region of EIN2 during embryogenesis
EIN6 (REF6) can associate with INO80 in vivo (Smaczniak et al., 2012). To investigate when the EIN6 (REF6)/INO80-mediated regulation of EIN2 occurs, we used ChIP-seq to map the H3K27me3 landscape in various tissues representing different developmental stages of wild-type and ein6-1 een-1 (dry seeds, roots and shoots of etiolated seedlings, de-etiolated whole-seedlings, flowers and siliques) (Figure 5A). By using the broad H3K27me3 domain at EIN2 as a proxy for an aberrant chromatin signature in ein6-1 een-1 mutants, we discovered its presence in all tested ein6-1 een-1 tissues (Figure 5A). These results indicate that EIN6 (REF6)/INO80-mediated control of EIN2 expression already occurs by early embryogenesis in wildtype and that its failure rapidly establishes a repressive chromatin state at EIN2.
Figure 5 with 1 supplement see all
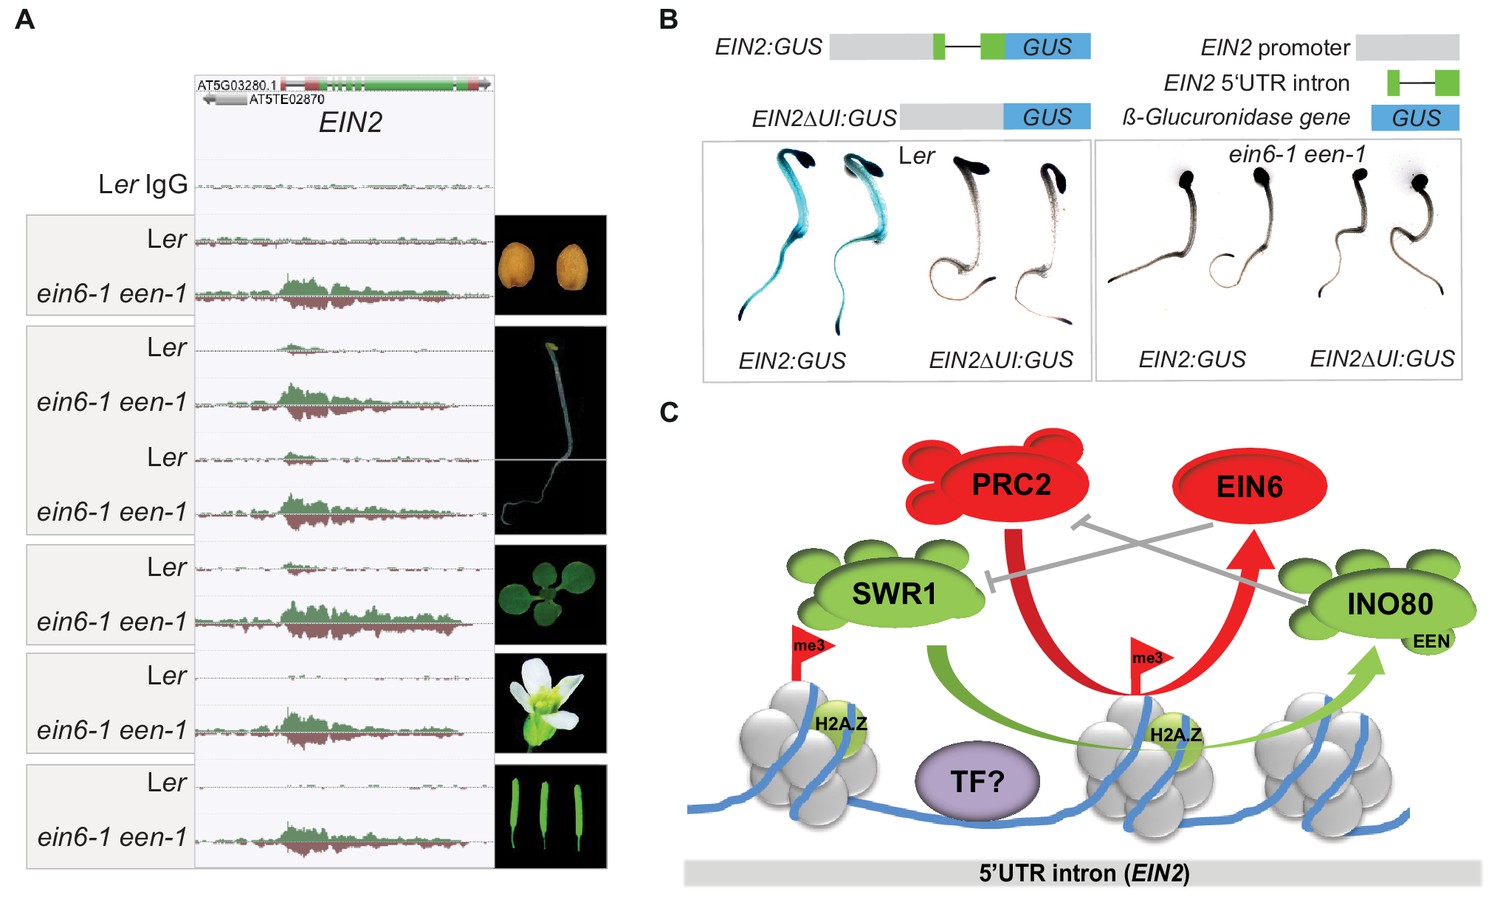
EIN6 (REF6)/INO80-mediated regulation occurs at the 5’UTR intron region of EIN2 during embryogenesis.
(A) Genome browser screenshot visualizes levels of H3K27me3 at the EIN2 gene in the indicated tissues of Ler and ein6-1 een-1 plants (dry seeds, roots and shoots of etiolated seedlings, de-etiolated whole-seedlings, flowers and siliques). H3K27me3 occupancy was identified with ChIP-seq. The tracks were normalized to the respective sequencing depth for each experiment to allow an accurate comparison between Ler and ein6-1 een-1 H3K27me3 profiles. Normalization was separately done for each chromatin feature. (B) Histochemical GUS staining of untreated three-day-old etiolated Ler and ein6-1 een-1 seedlings stably expressing either a EIN2 promoter GUS fusions with (EIN2:GUS) or without the 5’UTR intron (EIN2ΔI:GUS). Schematic illustration of the used EIN2:GUS constructs is shown as well. The gray box indicates the 2 kb promoter region of EIN2, the green boxes represent the 5’UTR and the black line indicates the 5’UTR intron. (C) Hypothetic model of the EIN6 (REF6)/INO80-mediated double safeguard mechanism at the 5’UTR intron of EIN2. Besides the demethylase function role of EIN6 (REF6) in antagonizing PRC2-mediated tri-methylation of H3K27, we speculate that EIN6 (REF6) also antagonizes SWR1-facillitated H2A.Z incorporation at EIN2. This scenario of a dual function holds true for the INO80 complex as well which counteracts SWR1 by removing H2A.Z, but also antagonizes H3K27 trimethylation through an unknown mechanism. The resulting low levels of H3K27me3 and H2A.Z possibly increase the accessibility of the enhancer element for binding of yet unknown transcription factors (TFs). When this EIN6 (REF6)/INO80-mediated regulation is functionally impaired, H3K27me3 and H2A.Z start to accumulate over the entire gene body of EIN2 mutually reinforcing their depositions.
A key feature of the broad H3K27me3 domain at EIN2 in ein6-1 een-1 mutants is its asymmetric distribution across the gene with the peak level occurring within a 5’UTR intron and a steady decrease towards the 3’UTR (Figures 2A and 5A). The 5’UTR intron is also the region of EIN2 where the majority of H3K27me3, H2A.Z, H2Aub and H3K4me3 can be detected in wild-type plants (Figure 2A). To interrogate the role of the EIN2 5’UTR intron in more detail, we generated EIN2 promoter GUS fusions with or without the 5’UTR intron (EIN2:GUS and EIN2ΔUI:GUS, respectively) and introduced these constructs into wild-type and ein6-1 een-1 plants. Histochemical GUS staining revealed detectable reporter activity from the EIN2:GUS construct in wild-type but only minimal activity was observed in ein6-1 een-1 seedlings (Figure 4B). This result recapitulates the differences observed in endogenous EIN2 mRNA expression between the two genotypes (Figures 1F and 2A). Deletion of the 5’UTR intron resulted in strongly reduced GUS reporter activity in wild-type and ein6-1 een-1 EIN2ΔUI:GUS seedlings (Figure 5B), indicating that, not only is the 5’UTR intron necessary for EIN2 promoter-driven reporter activity, but also that its loss phenocopies the ein6-1 een-1 mutant. We further investigated the 5’UTR intron using transient quantitative GUS reporter assays in Nicotiana benthamiana leaves driven by full-length and 3’-truncated intron 5’UTR constructs. We found that the full length EIN2 5’UTR intron construct (UI1161:GUS) as well as two moderately 3’-truncated constructs (UI703:GUS and UI404:GUS) were able to drive GUS reporter activity to comparable levels (Figure 5—figure supplement 1A). However, the most heavily 3’-truncated intron construct (UI170:GUS) had greater than six-fold higher GUS activity relative to the longer constructs, indicating the presence of an enhancer element in that region whose activity may be modulated by one or multiple regulatory elements further downstream in the 5’UTR intron region (Figure 5—figure supplement 1A). Similar GUS activities of UI1161:GUS, UI703:GUS and UI404:GUS suggest that these regulatory elements are located within the +170 bp to +404 bp region and provide a landing platform for various, but yet unknown, transcriptional regulators. By interrogating the Plant Cistrome Database (O’Malley et al., 2016), we identified bHLH122 and SQUAMOSA PROMOTER BINDING PROTEIN-LIKE 5 (SPL5) as potential candidate transcription factors (Figure 5—figure supplement 1B). It is known from SPL15 that it associates with the MADS-box protein SOC1 which in turn recruits EIN6 (REF6) to remodel the chromatin environment at SPL15/SOC1 target genes (Hyun et al., 2016).
Discussion
Here we unravel a novel regulatory mechanism at EIN2, a multifunctional component of a critical stress regulatory pathway in plants. We discovered that the ein6-1 mutants carry mutations in two genes that encode the H3K27me3 demethylase REF6 (EIN6) as well as a crucial subunit of the INO80 chromatin remodeling complex (EEN). Remarkably only the presence of both mutations led to the ectopic accumulation of H3K27me3 and H2A.Z at EIN2. The resulting repressive chromatin state compromises EIN2 mRNA expression leading to a strongly reduced ET-induced accumulation of EIN3 protein and ultimately to a failure of the transcriptional response.
H3K27me3 and H2A.Z strongly co-associate in Arabidopsis which is not surprising since the majority of Arabidopsis genes are marked with H2A.Z (Dong et al., 2012; Carter et al., 2018; Gómez-Zambrano et al., 2019). Interestingly, they mutually reinforce their deposition through the concerted action of the methyltransferase CURLY LEAF (CLF) and the ATP-dependent chromatin remodeler PIE1 and PICKLE (PKL) (Carter et al., 2018). PIE1-dependent H2A.Z incorporation promotes the deposition of H3K27me3 which is retained after DNA replication by PKL (Carter et al., 2018). This scenario of a mutual reinforcement can explain the accumulation of H3K27me3 and H2A.Z in the ein6-1 een-1 double mutant background. It’s possible that non-evicted H2A.Z at EIN2 initially leads to increased deposition of H3K27me3. Since H3K27me3 demethylation and H2A.Z eviction are both functionally impaired in ein6-1 een-1 mutants, H3K27me3 and H2A.Z can continuously reinforce their deposition, which ultimately leads to the observed gene body-wide spreading of both marks at EIN2. Another interesting aspect arose from a recent study showing that monoubiquitination of H2A.Z confers H2A.Z-mediated transcriptional repression (Gómez-Zambrano et al., 2019). Although our anti-H2Aub antibody cannot distinguish between monoubiquitinated H2A and monoubiquitinated H2A.Z, we speculate that the observed increase of H2Aub at the gene body of EIN2 in ein6-1 een-1 mutants is predominantly monoubiquitinated H2A.Z. These findings suggest a scenario of mutually reinforced H3K27me3/H2A.Z deposition potentially combined with the monoubiquitination of H2A.Z that ultimately represses EIN2 expression.
However, it’s unclear why the increased mutually enforced deposition of H3K27me3 and H2A.Z can only be observed in the double mutant background. Although the functional loss of EIN6 (REF6) as the major Arabidopsis H3K27me3 demethylase has a profound impact on the H3K27me3 landscape in Arabidopsis (Lu et al., 2011), EIN2 is only marginally affected. A molecular hallmark of ein6 (ref6) mutants is the ectopic accumulation of H3K27me3 at thousands of genes (2369 Group I genes) (Lu et al., 2011). Our in-depth investigation of the ein6-1 een-1 epigenome revealed a new class of genes (Group II genes), such as EIN2, that ectopically accumulates H3K27me3 in the ein6-1 (ref6-1) mutant background but only when INO80 is simultaneously lost (ref6-1 ino80-1) or the INO80 complex activity is simultaneously impaired (ein6-1 een-1, ref6-1 een-2, ref6-1 arp5-1). These findings indicate an EIN6 (REF6)-independent INO80-mediated mechanism that specifically prevents H3K27me3 hyper-accumulation at EIN2 in the absence of EIN6.
The precise mechanism behind the observed functional redundancy of EIN6 (REF6) and the INO80 complex in regulating H3K27me3 occupancy at EIN2 remains unclear. Regulatory interactions between H3K27me3 demethylases and SWI/SNF-type chromatin remodelers are described in various organisms (Li et al., 2016; Miller et al., 2010). The mouse H3K27me3 demethylases Jmjd3 and UTX interact with T-box transcription factors and a Brg1-containing SWI/SNF remodeling complex to activate gene expression in a H3K27me3 demethylase-independent manner (Miller et al., 2010). In Arabidopsis, EIN6 (REF6) physically interacts with BRAHMA (BRM) and is crucially involved in recruiting BRM to its target genes (Li et al., 2016). However, in contrast to ein6-1 een-1 double mutants, brm-1 ref6-1 double mutants show no additional ectopic H3K27me3 domains (Li et al., 2016).
The most prominent function of the INO80 chromatin remodeling complex is the eviction of the histone variant H2A.Z (Papamichos-Chronakis et al., 2011; Alatwi and Downs, 2015). This is corroborated by our findings of impaired ET-induced H2A.Z eviction dynamics in een-1 and ino80-8 mutants, as well as the H2A.Z accumulation at EIN2 in ein6-1 een-1 double mutants. However, in the absence of a stimulus or an ein6 (ref6) background mutation, single mutants of the Arabidopsis INO80 complex (een-1, een-2, arp5-1, ino80-1, ino80-8) have no impact on global H2A.Z occupancy which in line with a recent report in yeast (Jeronimo et al., 2015). This strongly suggests that, like in mammals, there is an INO80-independent H2A.Z removal mechanism in Arabidopsis (Obri et al., 2014). The INO80 complex is crucial for pluripotency of embryonic stem cells (ESCs) (Wang et al., 2014). Silencing of INO80 leads to a breakdown of the ESC-specific chromatin structure that is accompanied by the accumulation of H3K27me3 at INO80 target sites (Wang et al., 2014). Based on this and our findings, it is conceivable that the INO80 complex can prevent H3K27me3 accumulation by antagonizing PRC2-mediated H3K27me3 deposition through direct or indirect blocking of the access of PRC2 to chromatin.
Loss of EIN6 (REF6) also has no effect on the global H2A.Z distribution, but leads to an ectopic H2A.Z accumulation at EIN2 in the een mutant. This suggests that EIN6 can not only control chromatin structure through H3K27me3 demethylation, but also through the regulation of H2A.Z occupancy, although in a very specific genomic context. This is supported by our finding that the hypo-sensitive triple response phenotype of ref6-1 een-2 mutants can be suppressed by the loss of SWR1-deposited H2A.Z in ref6-1 een-2 pie1-1 triple mutants. Similar to the INO80-mediated restriction of PRC2 chromatin access, EIN6 (REF6) might control H2A.Z occupancy through blocking SWR1-mediated deposition of H2A.Z. We speculate that the observed functional duality of EIN6 (REF6) and the INO80 complex in antagonizing SWR1-mediated H2A.Z incorporation and PRC2-mediated H3K27 tri-methylation represents a double safeguard mechanism that ensures a permissive chromatin structure at EIN2 to ultimately safeguard its expression (Figure 5C).
The question of why a gene like EIN2 is controlled by this pivotal chromatin modifier equilibrium is not fully answered. Since EIN2 is not the only gene that is directly targeted by EIN6 and EEN, other specificity determinants must exist. The majority of chromatin regulation at EIN2 takes place in the 5’UTR intron region and our functional analysis of this region indicates the presence of multiple regulatory elements. Thus, we believe there is likely a yet unknown transcription factor that is required to establish the EIN6/INO80-dependent double safeguard mechanism at EIN2 (Figure 4C). Besides safeguarding EIN2 expression, it’s also plausible that the EIN6/INO80-mediated double safeguard is actively turned off to allow stable repression of EIN2 in a specific cell type and/or at a specific developmental stage. Histone signatures are mitotically stable and potentially echo prior or missing regulatory steps (Wang and Higgins, 2013). In addition, with our finding that dry ein6-1 een-1 seeds already display the aberrant chromatin signature at EIN2, it can be envisioned that the EIN6/INO80-mediated regulation already takes place during embryogenesis. This might also provide an explanation for the relatively weak binding of EIN6 and EEN to EIN2. Since we were able to capture strong EIN6 and EEN binding at numerous loci, technical reasons for weak binding such as insufficient crosslinking to the DNA are less likely. It is also plausible that the number of cells with EIN6/EEN-binding at EIN2 is rather small or that DNA residency times and chromatin remodeler compositions may vary between genes, thus potentially affecting the outcome of our ChIP-seq experiments. Given EIN2’s multifunctional role in controlling many agronomically important processes (Johnson and Ecker, 1998), we propose that this newly discovered mode of regulation at EIN2, not only fine-tunes its expression, but may also provide an efficient switch to repress gene expression.
Materials and methods
Key resources table
| Reagent type (species) or resource | Designation | Source or reference | Identifiers | Additional information |
|---|---|---|---|---|
| Strain, strain background (A. thaliana) | ein6-1 een-1 | Roman et al. (1995) | ||
| Strain, strain background (A. thaliana) | ein6-1 | This study | Materials and methods subsection: Plant material and growth conditions | |
| Strain, strain background (A. thaliana) | een-1 | This study | Materials and methods subsection: Plant material and growth conditions | |
| Strain, strain background (A.thaliana) | ein2-45 | Beaudoin et al. (2000) | ||
| Strain, strain background (A. thaliana) | ein2-5 | Alonso et al. (1999) | ||
| Strain, strain background (A. thaliana) | ref6-1 | Noh et al. (2004) | ||
| Strain, strain background (A. thaliana) | een-2 | This study | SALKseq_129237 | Materials and methods subsection: Plant material and growth conditions |
| Strain, strain background (A. thaliana) | arp5-1 | Kandasamy et al. (2009) | ||
| Strain, strain background (A. thaliana) | ino80-1 | Fritsch et al. (2004) | ||
| Strain, strain background (A. thaliana) | ino80-8 | This study | SALKseq_041809 | Materials and methods subsection: Plant material and growth conditions |
| Strain, strain background (A. thaliana) | pie1-1 | Noh and Amasino (2003) | ||
| Strain, strainbackground (A.thaliana) | ref6-1 een-2 | This study | Materials and methods subsection: Plant material and growth conditions | |
| Strain, strain background (A. thaliana) | ref6-1 arp5-1 | This study | Materials and methods subsection: Plant material and growth conditions | |
| Strain, strain background (A. thaliana) | ref6-1 ino80-1 | This study | Materials and methods subsection: Plant material and growth conditions | |
| Strain, strain background (A. thaliana) | pie1-1 ref6-1 een-2 | This study | Materials and methods subsection: Plant material and growth conditions | |
| Strain, strain background (A. thaliana) | Col-0 HTA11:HTA11:GFP | Kumar and Wigge (2010) | ||
| Strain, strain background (A. thaliana) | Ler 35S:EIN6-FLAG | This study | Materials and methods subsection: Vectors construction and plant transformation conditions | |
| Strain, strain background (A. thaliana) | Col-0 35S:FLAG-EEN | This study | Materials and methods subsection: Vectors construction and plant transformation conditions | |
| Strain, strain background (A. thaliana) | Col-0 35S:GFP-EEN | This study | Materials and methods subsection: Vectors construction and plant transformation conditions | |
| Strain, strain background (A. thaliana) | ein6-1 een-1 EIN6:EIN6 | This study | Materials and methods subsection: Vectors construction and plant transformation conditions | |
| Strain, strain background (A. thaliana) | ein6-1 een-1 EEN:EEN | This study | Materials and methods subsection: Vectors construction and plant transformation conditions | |
| Antibody | Rabbit polyclonal anti-histone H3K27me3 | Active Motif | Cat# 39156, RRID:AB_2636821 | 5 µl Materials and methods subsection: ChIP-seq |
| Antibody | Rabbit polyclonal anti - Htz1/Histone H2A.Z | Active Motif | Cat# 39647 RRID:AB_2793289 | 10 µl Materials and methods subsection: ChIP-seq |
| Antibody | Rabbit monoclonal anti trimethyl-Histone H3 (Lys4) | Millipore Sigma | Cat#: 04–745 RRID:AB_1163444 | 4 µl Materials and methods subsection: ChIP-seq |
| Antibody | Rabbit monoclonal anti-ubiquityl-Histone H2A (Lys119) | Cell Signaling Technology | Cat#: 8240 RRID:AB_10891618 | 10 µl Materials and methods subsection: ChIP-seq |
| Antibody | Mouse monoclonal anti-FLAG M2 | Millipore Sigma | Cat#: F1804 RRID:AB_262044 | 5 µl Materials and methods subsection: ChIP-seq |
| Antibody | Mouse monoclonal anti-GFP | Millipore Sigma | Cat#:11814460001 RRID:AB_390913) | 5 µl Materials and methods subsection: ChIP-seq |
| Antibody | ChromPure Mouse IgG, whole molecule | Jackson ImmunoResearch | Cat#:015-000-003 RRID:AB_2337188 | 2 µl Materials and methods subsection: ChIP-seq |
| Antibody | Mouse monoclonal anti-HaloTag | Promega | Cat#: G9211 | 1:1000 Materials and methods subsection: Immunoblot analysis and in vitro pull-down assays |
| Antibody | Rabbit polyclonal anti-Histone H3 | Abcam | Cat#: ab1791 RRID:AB_302613) | 1:1000 Materials and methods subsection: Immunoblot analysis and in vitro pull-down assays |
| Antibody | Rabbit polyclonal anti-EIN3 | Chang et al. (2013) | 1:500 Materials and methods subsection: Immunoblot analysis and in vitro pull-down assays | |
| Antibody | Mouse polyclonal anti-EIN2 | Qiao et al. (2012) | 1:500 Materials and methods subsection: Immunoblot analysis and in vitro pull-down assays | |
| Chemical compound, drug | Protein G Dynabeads | Thermo Fisher Scientific | Cat. #: 10004D | 50 µl Materials and methods subsection: ChIP-seq |
Plant material and growth conditions
Request a detailed protocolThe ein6-1 een-1 mutant resulted from a genetic screen using fast neutron-mutagenized Ler seeds as previously described (Roman et al., 1995). Both an ein2 mutant allele in the Ler background (ein2-45) and in the Col-0 background (ein2-5) were used in this study (Beaudoin et al., 2000; Alonso et al., 1999). The ref6, ino80 and arp5 mutants used in this study were ref6-1, ino80-1 and arp5-1 (Noh et al., 2004; Fritsch et al., 2004; Kandasamy et al., 2009). In addition, we isolated a new ino80 allele (SALKseq_041809) which now refers to ino80-8. The newly isolated een-2 T-DNA mutant (SALKseq_129237) as well as the ino80-8 mutant was obtained from the Arabidopsis Biological Resource Center (ABRC). The pie1 mutant that was used in this study is FRIGIDA (FRI) pie1-1 (Noh and Amasino, 2003). Transgenic Col-0 HTA11:GFP plants express a previously described functional HTA11:GFP cassette (Kumar and Wigge, 2010). Seedlings were grown on Linsmaier and Skoog (LS) medium containing 0.8% agar and 1% sucrose. For the triple response assay, surface-sterilized wild-type (Col-0, Ler) and mutant seeds were grown on agar plates containing LS medium supplemented with or without 10 µM 1-aminocyclopropane-1-carboxylic acid (ACC) for three days in the dark. For the induction with ET, seedlings were grown for three days in the dark in the presence of hydrocarbon free air and subsequently treated with ethylene gas for 4 hr. Flower tissue for mass spectrometry analyses was collected from 4 to 6 weeks old plants that were grown under controlled environmental conditions (21/19°C, 16-h-light/8-h-dark cycle). ref6-1 een-2, ref6-1 ino80-1 and ref6-1 arp5-1 double mutants were generated by crossing of ref6-1 single mutant pollen into the respective mutants. The ref6-1 een-2 pie1-1 triple mutant originates from a cross of the ref6-1 een-2 double mutant with pollen of pie1-1 mutants. The F1-progeny was allowed to self-fertilize and the resulting F2 generation was screened for homozygosity using PCR (for primer sequences see Supplementary file 9).
Mutant mapping and characterization of mutations
Request a detailed protocolAn ein6-1 een-1 mutant was crossed into the Col-0 background and pooled DNA of approximately 350 ET-insensitive F2 seedlings was used for SHOREmap analysis (Schneeberger et al., 2009). ET-insensitivity was determined with the triple response assay and genomic DNA was extracted with the DNeasy Plant Mini Kit (69104, Qiagen). The 7 bp deletion in the EIN6 (REF6) gene was discovered through PCR amplification of the EIN6 (REF6) gene from ein6-1 mutants and subsequent Sanger sequencing of the amplicon. The inversion event that led to the fusion of the EEN gene with the AQI gene was initially detected with Thermal Asymmetric Interlaced (TAIL)-PCR (Singer and Burke, 2003). Three primers (TAIL1-3) that specifically anneal to the 5’UTR region of EEN and six degenerated primers (AD1-6) were used (Supplementary file 9). Two amplicons that show the expected size difference were extracted using the QIAquick Gel Extraction Kit (28704, Qiagen). The DNA sequences of the purified amplicons were determined by Sanger sequencing. The EEN-AQI fusion event was further characterized by the amplification and subsequent sequencing of the chimeric region using genomic DNA and cDNA as a template (for primer sequences see Supplementary file 9). Visualization of the inversion region was achieved with optical mapping of ultra-long DNA molecules of Ler and ein6-1 een-1 seedlings using the Bionano Genomics Irys instrument. For the optical mapping, genomic DNA was extracted from nuclei and processed as previously described (Kaufmann et al., 2010; Kawakatsu et al., 2016).
Vectors construction and plant transformation
Request a detailed protocolGateway cloning and TOPO cloning (Thermo Fisher Scientific) was used to generate the majority of vectors in this study. For complementation analyses, genomic fragments of EIN6 (REF6, At3g48430) and EEN (At4g38495) including a 2 kb promoter region but without the stop codon were amplified using genomic DNA from Ler plants as a template. Amplified fragments were inserted into pENTR/D-TOPO via TOPO cloning and subsequently cloned via LR reaction into the binary vector pEarlyGate302 (https://www.arabidopsis.org/abrc/catalog/vector_1.html). For the generation of transgenic Cauliflower mosaic virus 35S promoter-driven EEN (35S:EEN) plants, the coding sequences of EIN6 (REF6) and EEN were first amplified from Ler cDNA, introduced into pENTR/D-TOPO and subsequently cloned via LR reaction into the binary vector pEarleyGate202 (https://www.arabidopsis.org/abrc/catalog/vector_1.html). The binary vector pMDC163 (https://www.arabidopsis.org/abrc/catalog/vector_1.html) containing a gusA gene as a reporter was used for the EEN expression analysis, as well as for the stable and transient EIN2 promoter/5’UTR intron analyses. An approximately 2 kb promoter fragment of EEN and the respective EIN2 promoter/5’UTR fragments were amplified from genomic Ler DNA, cloned into pENTR/D-TOPO and inserted by LR reaction into pMDC163. For the identification of the subcellular localization of GFP-tagged EEN, pENTR/D-TOPO-EEN was used to introduce the cDNA of EEN via LR reaction into pGWB6 (http://shimane-u.org/nakagawa/gbv.html). For in vitro pulldown experiments, pENTR/D-TOPO-EEN was used to introduce the cDNA of EEN via LR reaction into a modified version of the pTNT plasmid (L5610, Promega) containing a N-terminal FLAG-tag (Nito et al., 2013). The ARP5 cDNA was cloned into pDONR221 (12536017, Thermo Fisher Scientific) via BP reaction and subsequently introduced into pIX-HALO (https://www.arabidopsis.org/servlet/TairObject?id=1001200298&type=vector) via LR reaction. For DAP-seq assays, the C-terminus of EIN6 (156aa) were cloned into pENTR/D-TOPO and subsequently introduced via LR reaction into pIX-HALO. For the overexpression of N-terminal FLAG-tagged full-length and truncated EIN6 (35S:EIN6, 35S:EIN6ΔZNF), the respective coding sequences without a stop codon were amplified from Ler cDNA. Restriction sites for KpnI and SalI as well as a FLAG-tag with stop codon were added through amplification. KpnI/SalI-digested amplicons were subsequently ligated into the binary vector pCHF3. Binary plasmids were electroporated into Agrobacterium tumefaciens strain GV3101 and subsequently transformed into the respective Arabidopsis plants using the floral dip method (Clough and Bent, 1998). Primers used to generate all described constructs are listed in Supplementary file 9.
ChIP-seq
Request a detailed protocolChIP-seq experiments using three-day-old etiolated seedlings were performed as previously described (Kaufmann et al., 2010) with minor modifications. ChIP-seq assays were conducted with antibodies against H3K27me3 (39156, Active Motif), H2A.Z (39647, Active Motif), H3K4me3 (04–745, Millipore Sigma), H2Aub (8240, Cell Signaling Technology), FLAG (F1804, Millipore Sigma) and GFP (11814460001, Millipore Sigma). Mouse IgG (015-000-003, Jackson ImmunoResearch) served as the negative control. Protein G Dynabeads (50 µl, 10004D, Thermo Fisher Scientific) were coupled for 4–6 hr with the respective antibodies or IgG and subsequently incubated overnight with equal amounts of sonicated chromatin. Beads were washed successively with high salt buffer (50 mM Tris HCl pH 7.4, 150 mM NaCl, 2 mM EDTA, 0.5% Triton X-100), low salt (50 mM Tris HCl pH 7.4, 500 mM NaCl, 2 mM EDTA, 0.5% Triton X-100) and wash buffer (50 mM Tris HCl pH 7.4, 50 mM NaCl, 2 mM EDTA) before de-crosslinking, proteinase K digestion and DNA precipitation. Libraries were sequenced on the Illumina HiSeq 2500 and HiSeq 4000 Sequencing system. Sequencing reads were aligned to the TAIR10 genome assembly using Bowtie2 (Langmead, 2010).
DAP-seq
Request a detailed protocolDAP-seq assays were carried as previously described (O’Malley et al., 2016) using the recombinantly expressed C-terminus of EIN6 (REF6) and genomic Col-0 DNA.
RNA-seq
Request a detailed protocolThree-day-old etiolated seedlings were used for expression analyses. Total RNA was extracted with the RNeasy Plant Mini Kit (74903, Qiagen). cDNA library preparation and subsequent single read sequencing was carried as previously described (Song et al., 2016). Sequencing reads were aligned to the TAIR10 genome assembly using the STAR software (version STAR_2.6.0 c) (Dobin et al., 2013).
MethylC-seq
Request a detailed protocolMethylC-seq assays were conducted as previously described (Lister et al., 2011). Differentially methylated regions (DMRs) in Ler, ein6-1, een-1 and ein6-1 een-1 seedlings were identified with the methylpy software (Schultz et al., 2015).
Data analysis
Request a detailed protocolSignificant enrichments of histone modifications, histone variants, EIN6 and EEN were identified with the SICER software (Zang et al., 2009) using the TAIR10 genome assembly. The Intersect tool from BEDtools (Quinlan and Hall, 2010) was used to identify the genes in the ChIP-seq datasets that are most proximal to the discovered binding sites. The Genome wide Event finding and Motif discovery (GEM) tool (Guo et al., 2012) was used to identify the peak summit regions in ChIP/DAP-seq data-derived binding sites of EIN6. The MEME-ChIP analysis tool (Machanick and Bailey, 2011) was then used to identify binding motifs within the top 1000 summit regions of three merged EIN6 ChIP-seq experiments and one DAP-seq experiment. Gene ontology (GO) enrichment analysis was carried out with DAVID (Dennis et al., 2003). For the analysis of genomic distributions within EEN ChIP-seq data, all binding sites were first identified with SICER (version 1.1) and then subjected to the cis-regulatory element annotation system (CEAS) tool (Shin et al., 2009). To generate aggregated profiles, heatmaps and correlation analyses of ChIP-seq data, Deeptools (Ramírez et al., 2014) was employed. For the validation of our H2A.Z antibody, three published H2A.Z ChIP-seq datasets were downloaded (Carter et al., 2018) (GSE103361; sample GSM2769481), Wollmann et al., 2017 (GSE96834; sample GSM2544791), Coleman-Derr and Zilberman, 2012 (GSE39045; sample GSM954614)). multiBamSummary and plotCorrelation from Deeptools was used to generated the Spearman’s correlation plot. A total of 59814 2 kb bins were found. For the quantification of occupancy of the various histone modifications or of H2A.Z at the EIN2 gene, the bigWigAverageOverBed tool executable from the UCSC genome browser was used (Kent et al., 2002). Quantification was done for the 5’UTR intron region (chr5, 787428–788588), gene body region (chr5, 788589–793066) and 3’UTR intron region (chr5, 793067–793356). SAMtools (Li et al., 2009) was used to merge biological ChIP-seq replicates. For overlap analysis (http://bioinformatics.psb.ugent.be/webtools/Venn/), pairwise comparisons of ChIP-seq samples (ein6-1 een-1 >ein6-1 (H3K27me3, 2-fold), ein6-1 een-1 >een-1 (H2A.Z, 1,5-fold), ein6-1 een-1 >Ler (H2Aub, 2-fold), Ler >ein6-1 een-1 (H3K4me3, 1.5-fold)), using SICER were conducted to discover genes with differential enrichment of the respective modification or of H2A.Z in ein6-1 een-1 mutants. DMRs with ten or more methylated cytosines in at least one genotype were included into the overlap analysis as well. For the identification of genes that show a robust ET-induced eviction of H2A.Z, we first employed SICER (≥1.3 fold SICER comparison, air vs 4 hr ET) to identify all genes that show a significant eviction of H2A.Z after ET-treatment in Ler (two replicates) and Col-0 (one replicate). 1076 genes were identified in all replicates and were used to visualize ET-induced H2A.Z eviction dynamics in een-1 and ino80-8 mutants.
The RSEM software package (version 1.3.0) was used to quantify transcripts in the RNA-seq experiments (Li and Dewey, 2011). To identify differentially expressed genes in the RNA-seq datasets, the edgeR package (Robinson et al., 2010) was used. For the visualization of the transcriptional ET response in Ler, ein6-1, een-1, ein6-1 een-1 and ein2-45 seedlings via a heatmap, all genes with a significant log2 fold expression change in Ler seedlings in response to 4 hr of ET treatment (1803 induced, 2598 repressed) were selected. To display the transcriptomic similarities between ino80-8, een-2 and arp5-1 mutants, INO80-dependent genes were first identified by a direct comparison of the Col-0 with the ino80-8 transcriptome (787 genes up, 1079 genes down) and their expression relative to Col-0 was then visualized with a heatmap. All sequencing data were visualized with the AnnoJ genome browser (Lister et al., 2008). ClustalW2 (Larkin et al., 2007) was used for multiple amino acid sequence alignment of EEN (Accession AEE86934.1), IES6 (Accession P32617.1) and human IES6 (hIES6) (Accession AAH39404.1). For the interrogation of TFs that can bind to the 5’UTR region of EIN2, the Plant Cistrome Database (O’Malley et al., 2016) (http://neomorph.salk.edu/dap_web/pages/index.php) was used.
Immunoblot analysis and in vitro pull-down assays
Request a detailed protocolNuclear proteins of untreated and ET-treated Arabidopsis seedling tissue were extracted as previously described (Kaufmann et al., 2010). For immunoblots analysis, nuclear extracts were boiled in 1X LDS sample buffer (NP0008, Thermo Fisher Scientific) and extracted proteins were subsequently separated by SDS-PAGE. The TnT Quick Coupled Transcription/Translation System (L1170, Promega) was used for in vitro pull-down assays. in vitro translated FLAG-tagged EEN was incubated with Anti-FLAG M2 Magnetic Beads (M8823, Millipore Sigma) for 1 hr and subsequently washed with WP buffer (50 mM Tris HCl pH 7.5, 100 mM NaCl, 1 mM EDTA, 1% DMSO, 2 mM TCEP pH 7.5, 0.1 % NP-40). After washing, the beads were incubated with in vitro translated Halo-tagged ARP5 for additional 2 hr. After three washes with WP buffer, beads were boiled in 1X LDS sample buffer and the supernatant was subjected to immunoblot analysis. Specificities of the used antibodies against EIN2 and EIN3 were previously tested (Qiao et al., 2012; Chang et al., 2013; Kandasamy et al., 2009). Antibodies against FLAG, HA, GFP (F1804, 11867423001, 11814460001, Millipore Sigma) and Halo (G9211, Promega) were used for the respective immunoblot analysis. An anti-histone H3 antibody (ab1791, Abcam) was used to control for equal loading.
Fluorescence microscopy, histochemical GUS staining, and quantitative GUS assays
Request a detailed protocolFluorescence microscopy was performed with 10-day-old Col-0 35S:GFP-EEN seedlings to identify the subcellular localization of EEN. Images were taken with a Zeiss LSM 710 Confocal Microscope. GUS staining was carried out as described before (Willige et al., 2011). Transgenic Arabidopsis seedlings either harboring an EEN:GUS, EIN2:GUS or EIN2ΔUI:GUS cassette were incubated in the GUS staining solution for 12 hr. For quantitative GUS assays, Nicotiana benthamiana leafs were infiltrated with the Agrobacterium tumefaciens strain GV3101 harboring the respective binary plasmids with an incubation time of 48 hr as previously reported (Bürger et al., 2017). Fluorometric quantification of GUS reporter activity was carried out as previously described (Zander et al., 2014).
Mass spectrometry analysis
Request a detailed protocolNuclei were extracted from flowers of Col-0 35S:EEN-FLAG as previously described (Kaufmann et al., 2010). Nuclear extracts of non-transgenic Col-0 served as a control. Anti-FLAG M2 Magnetic Beads (M8823, Millipore Sigma) were washed three times with Sonic buffer before they were incubated for 2 hr with equal amounts of nuclear protein. After three additional washes with Sonic buffer, beads were boiled in 1X LDS sample buffer and the supernatants were subjected to mass spectrometry analysis. Samples were precipitated by methanol/chloroform first and the dried pellets were dissolved in 8 M urea/100 mM TEAB, pH 8.5. Proteins were reduced with 5 mM Tris (2-carboxyethyl) phosphine hydrochloride (TCEP) and alkylated with 10 mM chloroacetamide. Proteins were digested overnight at 37 o C in 2 M urea/100 mM TEAB, pH 8.5, with trypsin. Digestion was quenched with formic acid (5% final concentration). The digested samples were analyzed on a Fusion Orbitrap Tribrid mass spectrometer (IQLAAEGAAPFADBMBCX, Thermo Fisher Scientific). The digest was injected directly onto a 30 cm, 75 um ID column packed with BEH 1.7 um C18 resin (186002350, Waters). Samples were separated at a flow rate of 300 nl/min on a nLC 1000 liquid chromatograph (LC120, Thermo Fisher Scientific). Buffer A and B were 0.1% formic acid in water and 0.1% formic acid in 90% acetonitrile, respectively. A gradient of 1–25% B over 90 min, an increase to 40% B over 30 min, an increase to 90% B over 10 min and held at 90% B for a final 10 min of washing was used for 140 min total run time. The column was re-equilibrated with 20 ul of buffer A prior to the injection of samples. Peptides were eluted directly from the tip of the column and nanosprayed directly into the mass spectrometer by application of 2.5 kV voltage at the back of the column. The Orbitrap Fusion was operated in a data-dependent mode. Full MS scans were collected in the Orbitrap at 120K resolution with a mass range of 400 to 1600 m/z and an AGC target of 5e5. The cycle time was set to 3 s, and within this 3 s the most abundant ions per scan were selected for CID MS/MS in the ion trap with an AGC target of 1e4 and minimum intensity of 5000. Maximum fill times were set to 50 ms and 100 ms for MS and MS/MS scans respectively. Quadrupole isolation at 1.6 m/z was used, monoisotopic precursor selection was enabled and dynamic exclusion was used with exclusion duration of 5 s. Protein and peptide identification were done with Integrated Proteomics Pipeline – IP2 (Integrated Proteomics Applications). Tandem mass spectra were extracted from raw files using RawConverter (He et al., 2015) and searched with ProLuCID (Xu et al., 2015; Peng et al., 2003) against the TAIR database with reversed sequences. The search space included all fully-tryptic and half-tryptic peptide candidates. Carbamidomethylation on cysteine was considered as a static modification. Data was searched with 50 ppm precursor ion tolerance and 600 ppm fragment ion tolerance. Identified proteins were filtered to using DTASelect (Tabb et al., 2002) and utilizing a target-decoy database search strategy to control the false discovery rate to 1% at the protein level (Peng et al., 2003).
cDNA synthesis and RT-PCR
Request a detailed protocolTotal RNA from Ler and een-1 seedlings was extracted using the RNeasy Plant Mini Kit (74903, Qiagen) to investigate the EEN-AQI fusion event. Extracted RNA was reverse transcribed into cDNA using the High-Capacity cDNA Reverse Transcription Kit (4368814, Thermo Fisher Scientific). RT-PCR analysis of the chimeric EEN-AQI cDNA was carried with the Phusion High-Fidelity DNA Polymerase (M0530S, New England Biolabs). Primers used to amplify and quantify the respective cDNA levels are indicated in Supplementary file 9.
Accession numbers
Request a detailed protocolSequence data can be downloaded from GEO (accession GSE122314). Visualized sequencing data can be found under http://neomorph.salk.edu/ein6een.php.
Data availability
Sequence data have been deposited in GEO under accession GSE122314. An overview of all sequenced data is given in Supplementary file 2. Visualized sequencing data can be found under http://neomorph.salk.edu/ein6een.php.
-
NCBI Gene Expression OmnibusID GSE122314. Epigenetic Control of a Multifunctional Stress Regulator.
References
-
Interactions between abscisic acid and ethylene signaling cascadesThe Plant Cell 12:1103–1115.https://doi.org/10.1105/tpc.12.7.1103
-
DAVID: database for annotation, visualization, and integrated discoveryGenome Biology 4:P3.
-
STAR: ultrafast universal RNA-seq alignerBioinformatics 29:15–21.https://doi.org/10.1093/bioinformatics/bts635
-
The pivotal role of ethylene in plant growthTrends in Plant Science 23:311–323.https://doi.org/10.1016/j.tplants.2018.01.003
-
ATX1/AtCOMPASS and the H3K4me3 marks: how do they activate Arabidopsis genes?Current Opinion in Plant Biology 21:75–82.https://doi.org/10.1016/j.pbi.2014.07.004
-
Extracting accurate precursor information for tandem mass spectra by RawConverterAnalytical Chemistry 87:11361–11367.https://doi.org/10.1021/acs.analchem.5b02721
-
The ethylene gas signal transduction pathway: a molecular perspectiveAnnual Review of Genetics 32:227–254.https://doi.org/10.1146/annurev.genet.32.1.227
-
Aligning short sequencing reads with bowtieCurrent Protocols in Bioinformatics 11:7.https://doi.org/10.1002/0471250953.bi1107s32
-
Clustal W and clustal X version 2.0Bioinformatics 23:2947–2948.https://doi.org/10.1093/bioinformatics/btm404
-
The sequence alignment/Map format and SAMtoolsBioinformatics 25:2078–2079.https://doi.org/10.1093/bioinformatics/btp352
-
Arabidopsis REF6 is a histone H3 lysine 27 demethylaseNature Genetics 43:715–719.https://doi.org/10.1038/ng.854
-
MEME-ChIP: motif analysis of large DNA datasetsBioinformatics 27:1696–1697.https://doi.org/10.1093/bioinformatics/btr189
-
deepTools: a flexible platform for exploring deep-sequencing dataNucleic Acids Research 42:W187–W191.https://doi.org/10.1093/nar/gku365
-
Genetic analysis of ethylene signal transduction in Arabidopsis thaliana: five novel mutant loci integrated into a stress response pathwayGenetics 139:1393–1409.
-
CEAS: cis-regulatory element annotation systemBioinformatics 25:2605–2606.https://doi.org/10.1093/bioinformatics/btp479
-
High-throughput TAIL-PCR as a tool to identify DNA flanking insertionsMethods in Molecular Biology 236:241–272.https://doi.org/10.1385/1-59259-413-1:241
-
DTASelect and Contrast: Tools for Assembling and Comparing Protein Identifications from Shotgun ProteomicsJournal of Proteome Research 1:21–26.https://doi.org/10.1021/pr015504q
-
Histone modifications and mitosis: countermarks, landmarks, and bookmarksTrends in Cell Biology 23:175–184.https://doi.org/10.1016/j.tcb.2012.11.005
-
Structural analyses of the chromatin remodelling enzymes INO80-C and SWR-CNature Communications 6:e7108.https://doi.org/10.1038/ncomms8108
-
Relaying the ethylene signal: new roles for EIN2Trends in Plant Science 21:2–4.https://doi.org/10.1016/j.tplants.2015.11.013
Article and author information
Author details
Funding
National Science Foundation (MCB-1024999)
- Joseph R Ecker
Gordon and Betty Moore Foundation (GBMF3034)
- Joseph R Ecker
Howard Hughes Medical Institute
- Joseph R Ecker
Deutsche Forschungsgemeinschaft (Za-730/1-1)
- Joanne Chory
- Joseph R Ecker
Salk Pioneer Postdoctoral Endowment Fund
- Mark Zander
Human Frontier Science Program (LT000222/2013-L)
- Mark Zander
EU 7th Framework Programme (EU Marie Curie FP7 International Outgoing Fellowship: 252475)
- Björn C Willige
National Institutes of Health (5R35 GM122604)
- Mathew G. Lewsey
U.S. Department of Energy (DOE FG02 04ER15517)
- Joanne Chory
The funders had no role in study design, data collection and interpretation, or the decision to submit the work for publication.
Acknowledgements
We thank Shao-shan Carol Huang for providing computational assistance, Tsegaye Dabi for technical assistance, and James Moresco and Jolene Diedrich for technical support. We also thank Adam Seluzicki for useful comments on the manuscript and Hong Qiao for sharing the EIN2 antibody. Susan M Gasser, Richard Meagher and Philip A Wigge for kindly providing ino80-1, arp5-1 and Col-0 HTA11:GFP seeds, respectively. This work was supported by the Mass Spectrometry Core of the Salk Institute with funding from NIH-NCI CCSG (P30 014195) and the Helmsley Center for Genomic Medicine. MZ was supported by the Salk Pioneer Postdoctoral Endowment Fund as well as by a Deutsche Forschungsgemeinschaft (DFG) research fellowship (Za-730/1–1). BCW was supported by the Salk Pioneer Postdoctoral Endowment Fund and the Human Frontier Science Program (LT000222/2013 L). MGL was supported by by an EU Marie Curie FP7 International Outgoing Fellowship (252475). This work was supported by grants from the National Science Foundation (NSF) (MCB-1024999), the Division of Chemical Sciences, Geosciences, and Biosciences, Office of Basic Energy Sciences of the US Department of Energy (DE-FG02-04ER15517), the Gordon and Betty Moore Foundation (GBMF3034) and National Institute of Health (NIH) grant 5R35 GM122604 (to JC). JC and JRE are Investigators of the Howard Hughes Medical Institute.
Copyright
© 2019, Zander et al.
This article is distributed under the terms of the Creative Commons Attribution License, which permits unrestricted use and redistribution provided that the original author and source are credited.
Metrics
-
- 4,891
- views
-
- 1,020
- downloads
-
- 54
- citations
Views, downloads and citations are aggregated across all versions of this paper published by eLife.
Citations by DOI
-
- 54
- citations for umbrella DOI https://doi.org/10.7554/eLife.47835
Download links
A two-part list of links to download the article, or parts of the article, in various formats.
Downloads (link to download the article as PDF)
Open citations (links to open the citations from this article in various online reference manager services)
Cite this article (links to download the citations from this article in formats compatible with various reference manager tools)
Epigenetic silencing of a multifunctional plant stress regulator
eLife 8:e47835.
https://doi.org/10.7554/eLife.47835


