Structural state recognition facilitates tip tracking of EB1 at growing microtubule ends
- University of Minnesota, United States
- Vanderbilt University, United States
Figures
Figure 1 with 1 supplement
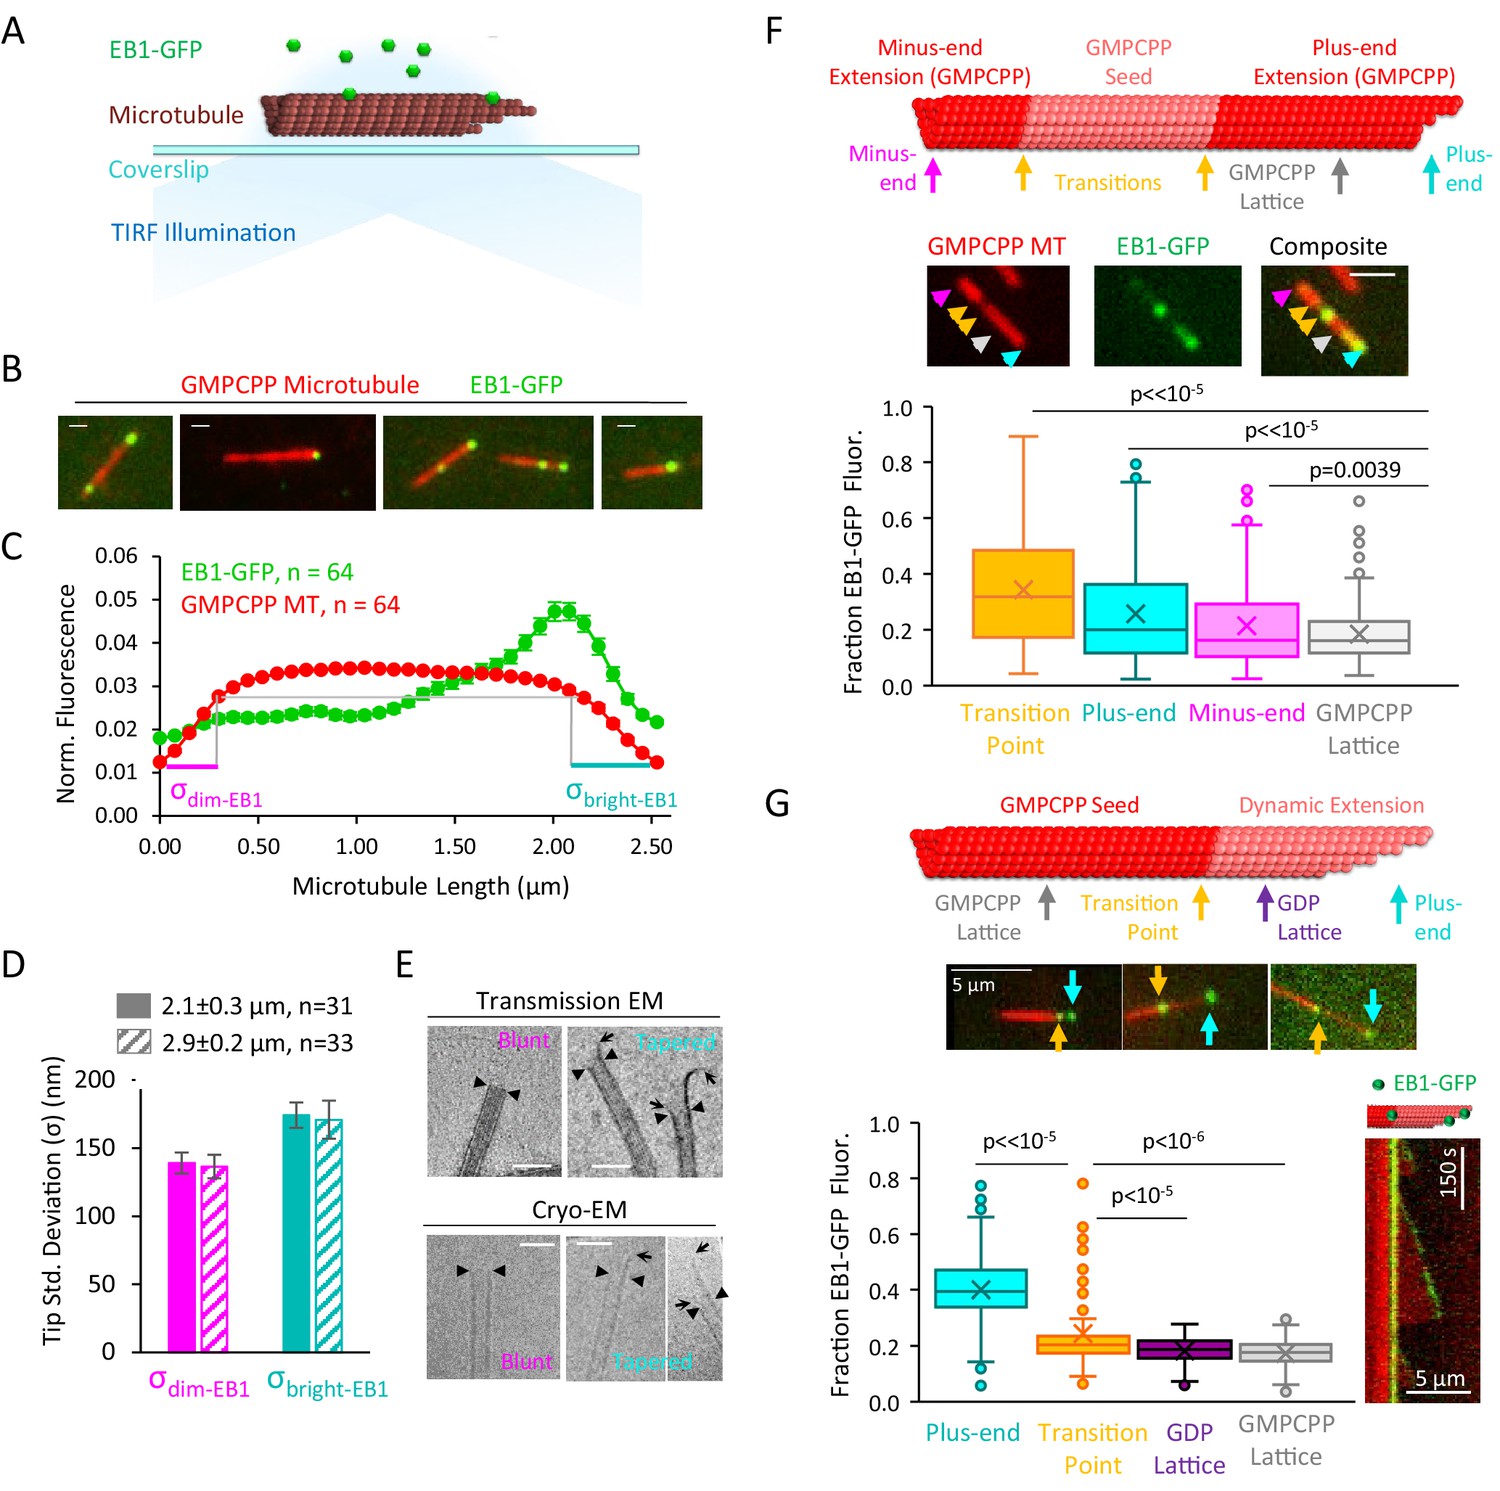
EB1-GFP recognizes structural disruptions and tapered ends on GMPCPP microtubules.
(A) Schematic of EB1-GFP TIRF experiment. (B) Representative images of EB1-GFP (green) on rhodamine-labeled GMPCPP microtubules (red), showing preferential end localization. Scale bars: 0.4 μm. (C) Super-averaged intensity profile of 64 microtubules of length 2.5 ± 0.48 μm (mean ± SD) with EB1-GFP. Individual microtubules within the averaged line scan were aligned with brighter EB1-GFP fluorescence on the right. Error bars show standard error at each point. (D) Bar graph with fitted tip standard deviations for microtubules of length 2.1 ± 0.3 μm (solid bars) and 2.9 ± 0.2 μm (hashed bars) (curve fits shown in Figure 1—figure supplement 1A). Low tip standard deviation corresponds to blunt microtubule ends (left), high tip standard deviation correspond to ends with more variable protofilament lengths (right). Error bars: SE calculated from 95% confidence intervals. (E) Electron microscopy images of blunt and tapered GMPCPP microtubules ends. Closed triangles indicate the most distal portion of the microtubule with a complete tubular lattice. Open arrows indicate the extrema of protruding protofilaments. Scale bars: 50 nm. (F) Top: Schematic of polarity-marked GMPCPP microtubule layout and reference positions for analysis. Center: Representative TIRF images of EB1-GFP on GMPCPP microtubules, colored arrows indicate the corresponding points used for analysis. Scale bars: 3 μm. Bottom: Box and whisker plot of the fraction of total EB1 fluorescence located at each position. The two transition points were averaged to provide a single value. Plus-ends, minus-ends, and transition points all showed significant differences as compared to lattice binding region (n = 309 microtubules). (G) Top: Schematic of bright GMPCPP seed with dim dynamic microtubule extension, with reference positions for analysis. Center: Representative TIRF images of EB1-GFP on GMPCPP microtubules, colored arrows indicate the corresponding points used for analysis. Scale bars: 5 μm. Bottom-left: Box and whisker plot of the fraction of total EB1 fluorescence located at each position. Plus-ends and transition points both showed significant differences as compared to lattice binding region (n = 134 microtubules). Bottom-right: Representative kymograph of EB1-GFP at transition point and plus-end during dynamic microtubule growth.
Figure 1—figure supplement 1
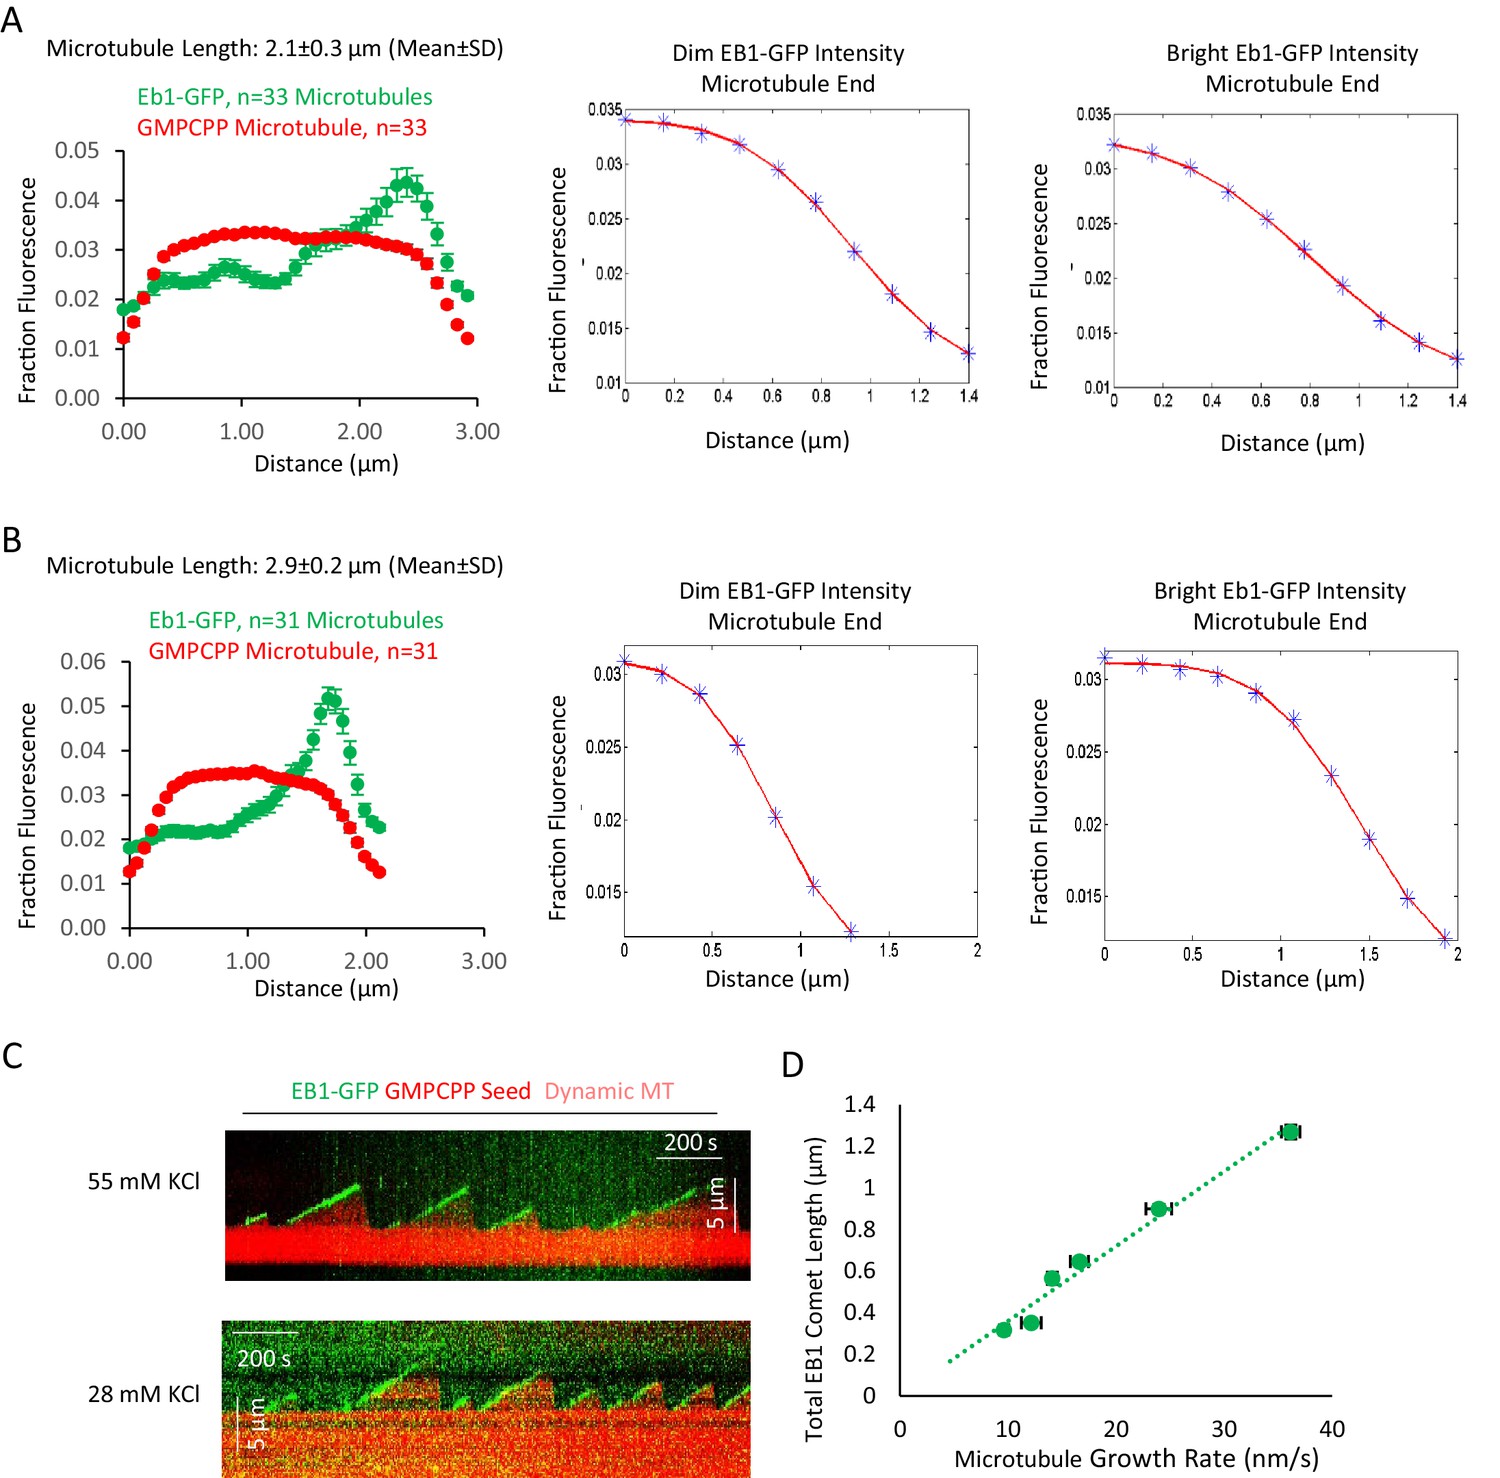
Additional data to support Figure 1.
(A and B) Averaged fluorescence line scan data for EB1-GFP and rhodamine-labeled GMPCPP microtubules of length 2.1 ± 0.3 μm (A) and 2.9 ± 0.2 μm (B). The microtubule end with brighter green fluorescence intensity was aligned on the right side of the graph, with the dimmer green intensity on the left. Center: Ensemble-averaged microtubule intensity data (blue points), and fitted curve (red line) for the dimmer EB1-GFP microtubule end. Right: Ensemble-averaged microtubule intensity data (blue points), and fitted curve (red line) for the brighter EB1-GFP microtubule end. Note that the end with brighter EB1-GFP binding had a slower (more lengthy) transition from full intensity to background intensity in the red (microtubule) channel, indicating a more extended transition from full lattice to extended protofilaments, as compared to the dimmer EB1-GFP end. Fits were determined using MATLAB and were fitted to an error function. (C) Example kymographs demonstrating EB1-GFP tip tracking of dynamic microtubules, both at 55 mM KCl, and at 28 mM KCl. (D) Plot of total EB1-GFP comet length vs growth rate of dynamic microtubules.
Figure 2
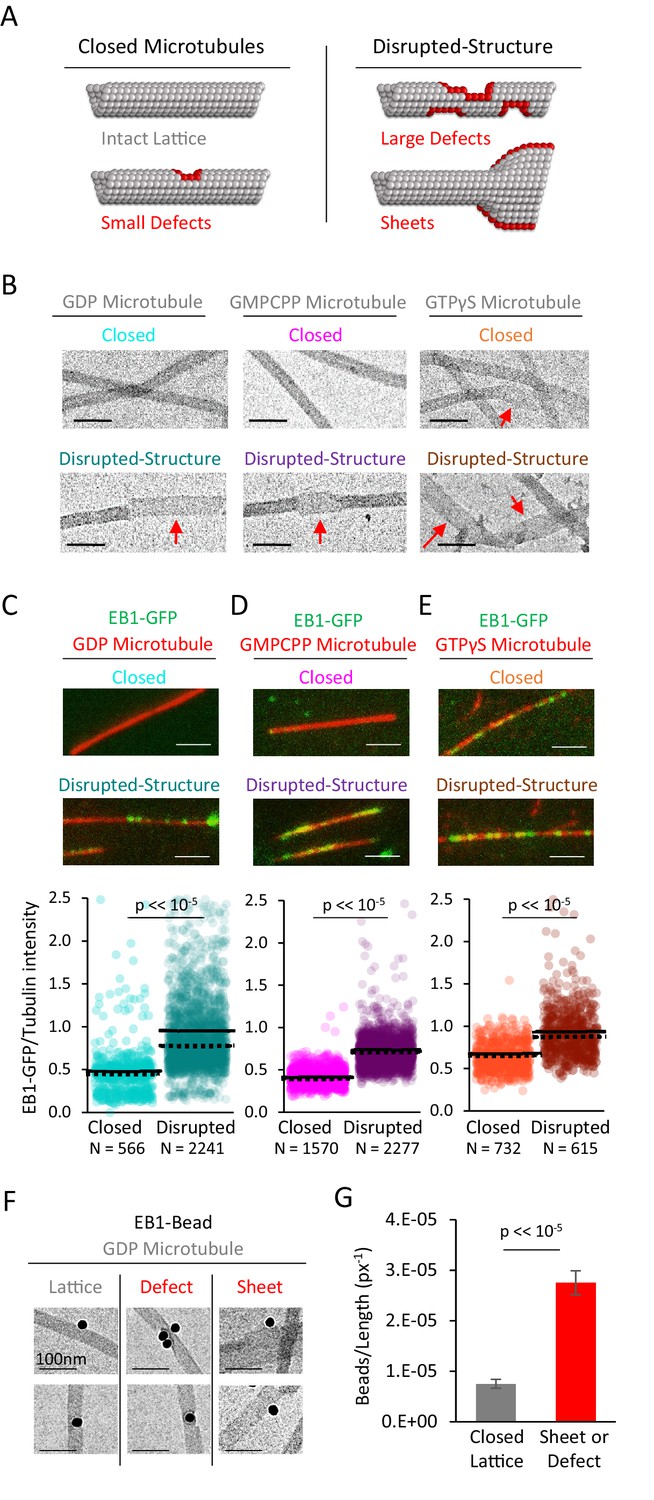
EB1-GFP shows preferential binding to disrupted-structure microtubules, regardless of nucleotide state.
(A) Illustration of the two categories of microtubules used in this analysis. Left: ‘Closed’ microtubules with predominantly intact, closed lattice structures. Right: ‘Disrupted-structure’ microtubules have larger and more frequent gaps, defects, and sheet-like regions. Stylized red tubulin used to highlight defects. (B) Electron microscopy images of closed and disrupted-structure microtubules for GDP microtubules (left), GMPCPP microtubules (center), and GTPγS microtubules (right). Red arrows indicate structural disruptions, scale bars 50 nm. (C–E) Top: EB1-GFP (green) on microtubules (red) for closed and disrupted-structure conditions (scale bars 2 μm). Bottom: Cloud plots of EB1-GFP/Tubulin intensity ratio for individual microtubules. Each semi-transparent circle is the data point from a single microtubule. Solid lines are the average EB1-GFP/Tubulin binding ratio for each population, dotted lines are the median EB1-GFP/Tubulin binding ratio for each population. (F) Electron microscopy of EB1 conjugated to gold beads on GDP microtubules. Example images of EB1-beads bound on the microtubule lattice (left), at a lattice defect (center), and on a sheet (right). (G) Frequency of EB1-beads bound to the microtubule lattice compared to EB1-beads bound at either a defect or on a sheet, normalized to observed microtubule length in each category. Non-normalized values yield a ~ 1.7 fold increase in binding to defects and edges relative to a closed lattice (n = 74 on lattice, n = 128 on defect or sheet). Error bars SEM.
Figure 3 with 1 supplement
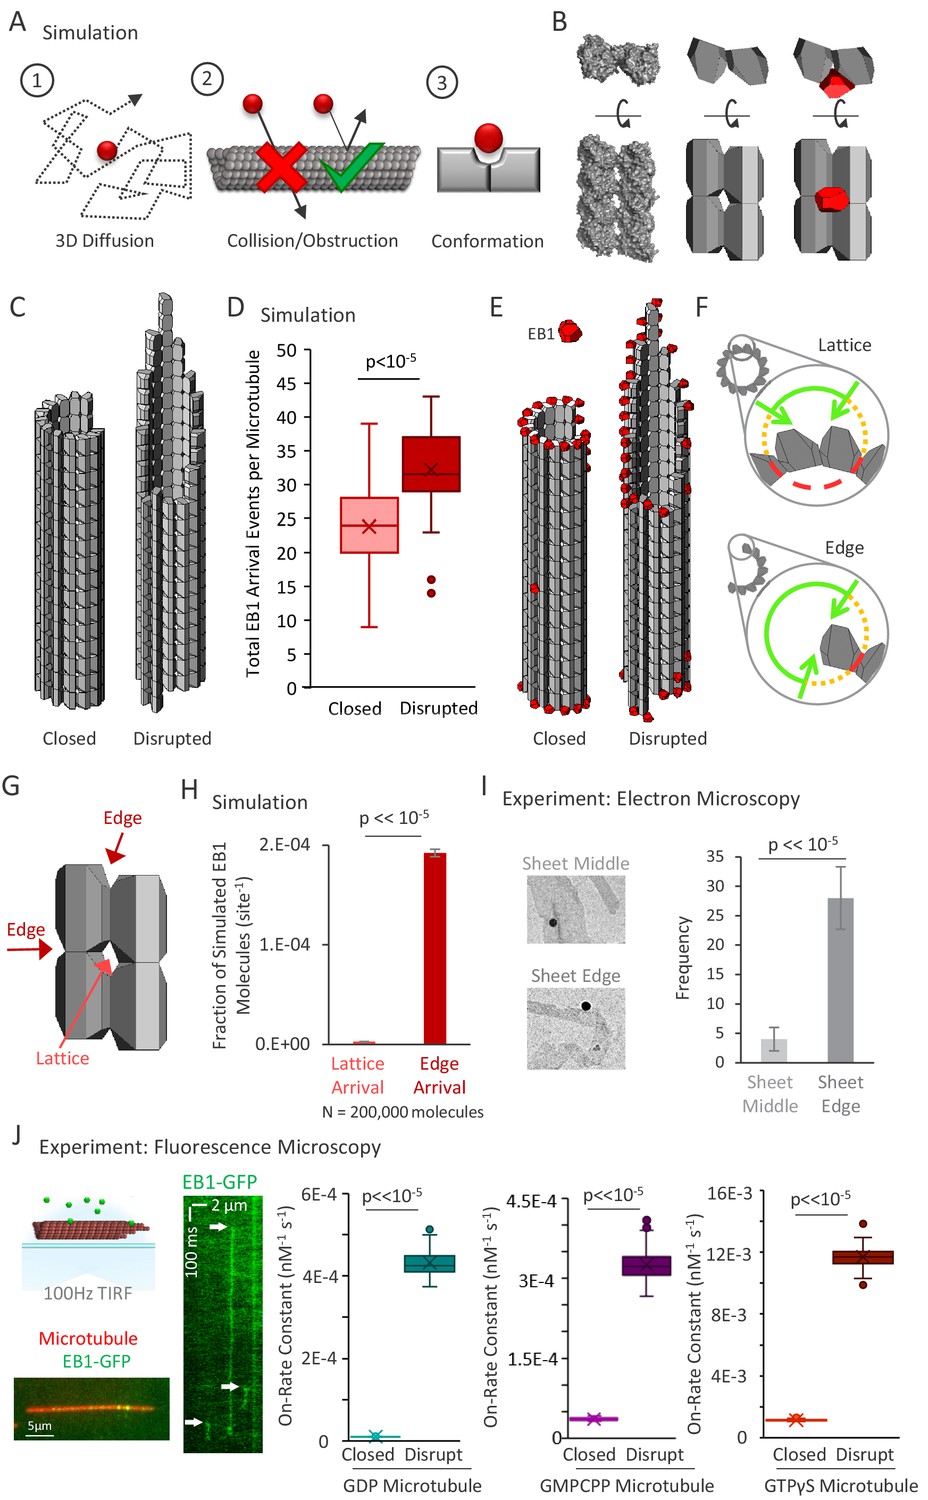
3D diffusion-based simulations of EB1 predict an increased arrival rate at protofilament edge sites relative to closed, full lattice sites.
(A) Simulation rules and parameters: (1) EB1 diffuses in three dimensions, (2) EB1 is obstructed by tubulin dimers and cannot pass through microtubules, (3) EB1 and tubulin dimer three-dimensional shapes reproduce EB1-tubulin binding interface. (B) Development of simulation shapes for EB1 and tubulin: Left: Cryo-EM reconstruction data (from PDB ID 3JAR) of tubulin dimers in a lattice: Left-top: Top-down view, with the lower portion being the outside of the microtubule. Left-bottom; Side view of four tubulin dimers, viewing the portion on the outside surface of the microtubule; Middle: Approximation of tubulin dimers for use in the simulation, derived from the cryo structure; Right: EB1 (red) also modeled as an approximation of cryo-structure data (not shown), with the binding interface correctly positioned at the pocket located between four adjacent tubulin dimers. (C) Two microtubule conditions used in the simulation analysis. Left: A closed, blunt-ended microtubule. Right: A ‘disrupted-structure’ microtubule with a tapered tip. Both the ‘closed’ and ‘disrupted structure’ configurations contain the same total number of tubulin dimers. (D) Results of 50 simulations of 4000 EB1 molecules each for each microtubule condition. Each data point in the box and whisker plot represents the total number of EB1 arrival events per microtubule for 4000 different simulated EB1 molecules. (E) Visualization of EB1 arrival events (red) on closed and ‘disrupted-structure’ microtubules from N = 10,000 simulated EB1 in each condition. (F) Illustration of the hypothesis that EB1’s pocket-located binding site leads to a high local steric hindrance for EB1 binding to a lattice conformation (top), and a lower steric hindrance for EB1 binding to an edge conformation (bottom). Green lines: portion of the local volume with high accessibility to binding site. Yellow dotted lines: reduced accessibility volume. Red dashed lines: volume with no direct accessibility. In an edge conformation (bottom), the high accessibility region (green) is much larger than in the lattice conformation (top). (G) Dark Red arrows: Binding sites with two adjacent tubulin dimers, such as at the ends of protofilaments, or at exposed edges of protofilaments with no neighbor, are termed ‘Edge’ sites. Light red arrow: Sites with four adjacent tubulin dimers are termed ‘Lattice’ sites. Sites with only one tubulin dimer and with three adjacent tubulin dimers were not included in this analysis. (H) Fraction of simulated EB1 molecules that arrived at lattice sites (light red) or at edge sites (dark red). Data used was from the closed microtubule arrangement (panel C,E, left)). Values were determined by dividing the total number of EB1 bound at any lattice or edge site by the total number of available lattice or edge sites, respectively. EB1 was ~70 fold more likely to bind a given edge site as compared to a given lattice site. (I) Left: example electron microscopy images of EB1 conjugated to gold beads on GDP microtubules. This image shows EB1-gold bound at a sheet edge, and one bound at a sheet middle (beads at ambiguous locations were conservatively classified as ‘middle’). Right: Count of total number of sheet bound beads observed over all images, divided into ‘Middle’ of sheet and ‘Edge’ of sheet. (J) Far Left Top; Experimental setup, rhodamine-labeled microtubules are affixed to a coverslip (red), EB1-GFP is introduced in solution (green), and the sample imaged at 100 frames per second using total internal reflection fluorescence (TIRF) microscopy. Far Left Bottom; Sample image of EB1-GFP on the microtubule. Left: Kymograph of EB1-GFP with length along the x-axis and time down the y-axis. White arrows indicate EB1-GFP binding events, which appear as vertical streaks. Example shows atypically long EB1 association events, for clarity. The lower limit of the vertical streaks are the dissociation event of EB1-GFP from the microtubule. Right: EB1-GFP on-rate constant for closed and disrupted-structure microtubules in each nucleotide population.
Figure 3—figure supplement 1
Additional Data to Support Figure 3.
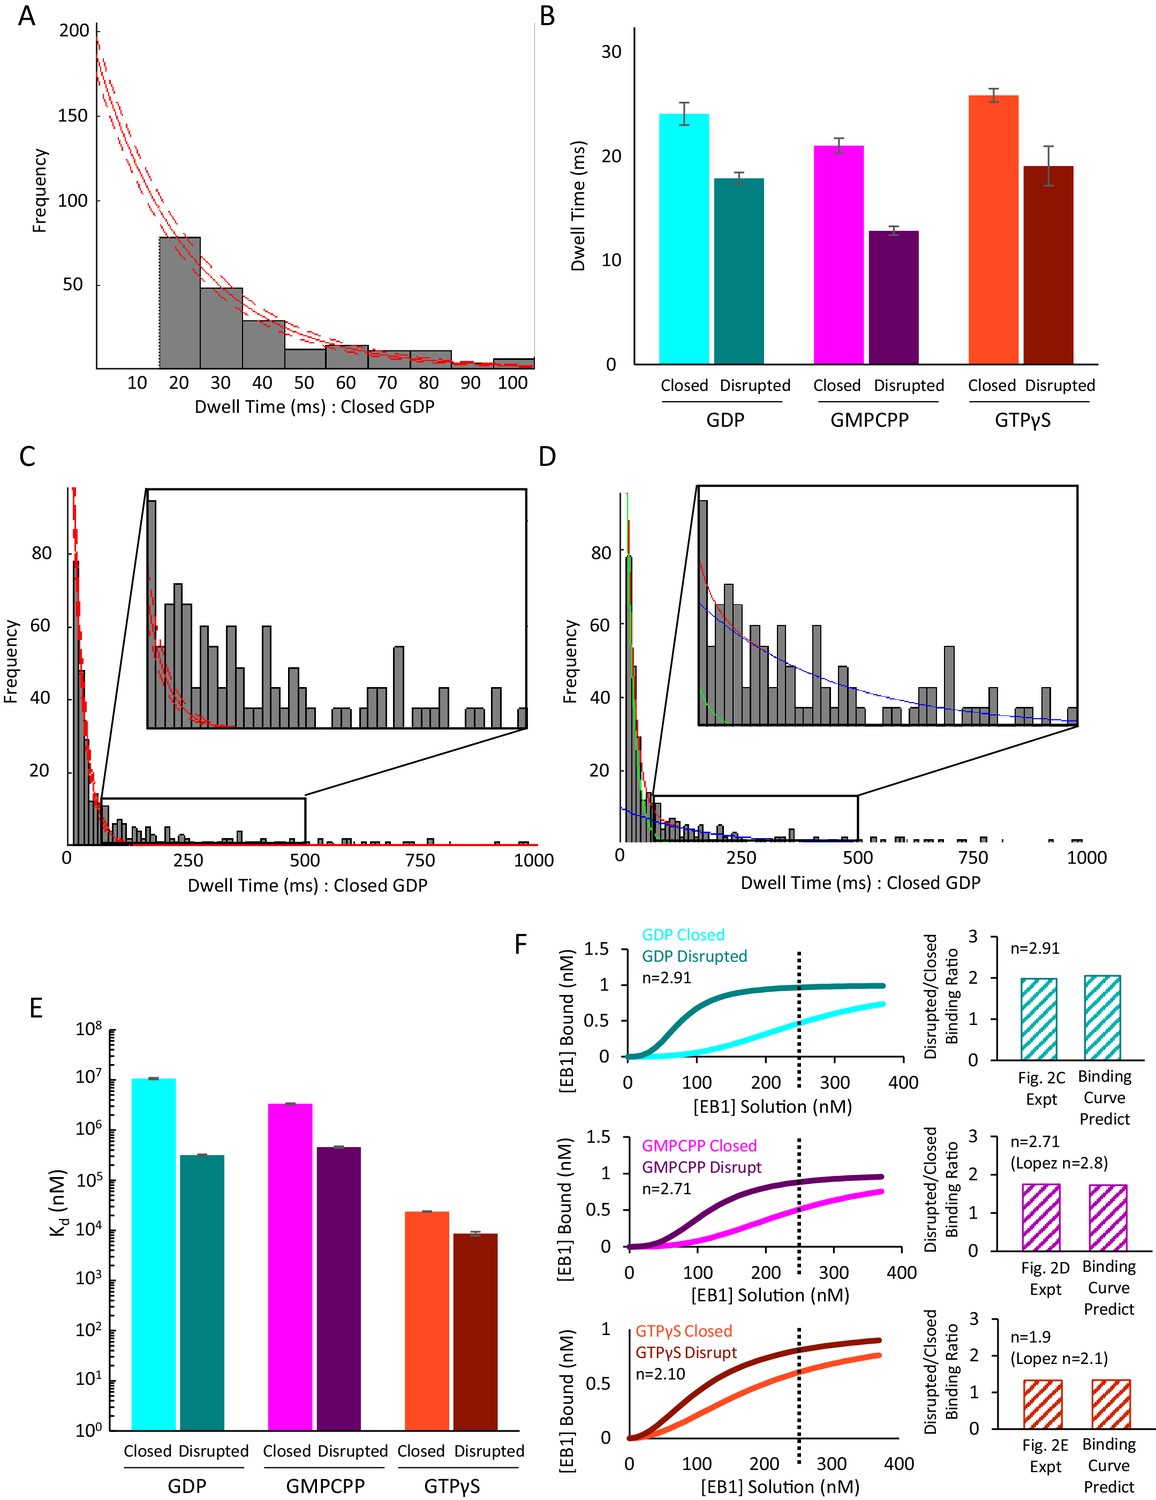
(A) Clipped histogram of EB1-GFP dwell times on control GDP microtubules (longer dwell time bins clipped off). EB1-GFP was observed with a frame-rate of 10 ms. Single-frame binding events (dwell time ≤10 ms) were not included in fitting due to higher likelihood of missed events and false positives (unfilled bar at t = 10 ms). A single exponential fit (solid red line) and associated 95% confidence intervals (dashed red lines) were used to account for the uncounted, short binding events. Histograms for other nucleotides and structural conditions were fit in the same way (not shown). (B) Characteristic EB1-GFP dwell times as determined from the exponential fit, shown for control and disrupted pools in GDP (cyan, teal), GMPCPP (magenta, purple) and GTPγS (orange, brown) microtubules. Error-bars show the 95% confidence interval for the dwell-time fit parameter. In all cases, the disrupted-structure microtubules had a slight but significant decrease in the dwell-times for EB1-GFP as compared to the control microtubules, as would be expected with an increase in the proportion of binding sites with fewer than the full complement of four tubulin binding partners at edges. All microtubule types had characteristic dwell times on the order of a 10–25 ms, which is in agreement with previous findings that EB1 has a very short dwell time at microtubule ends. (C) Full histogram of control GDP microtubules as shown in panel A, but including the longer-dwell time bins. Inset shows dwell time histogram from 80 ms to 500 ms. At this scale, it becomes apparent that the single exponential fit (the fitting of which did include the longer dwell time data points) does not reproduce to frequency of dwell times > 100 ms. (D) Same histogram as in panel C, but fitted with the sum of two exponential curves. The first curve (green line) maintains a characteristic dwell time that is the approximately the same as the initial fitting from panel A,~15 ms. The second curve (blue line) has a much longer characteristic dwell time (~150 ms) and a much smaller Y intercept. The sum of these two curves (red line) very closely matches the observed distribution and does reproduce the subpopulation of longer dwell-time binding events. This finding matches well with our hypothesis and model that EB1’s low dwell time is due largely to binding events at microtubule edges, which have fewer binding partners and are thus more likely to rapidly dissociate, whereas binding events at full lattice sites are proportionally less common, but would be more stably bound when they do occur. (E) Calculated dissociation constant (Kd) values for the six pools of microtubules. Despite the very similar dwell times for all six pools, the differences in on-rate leads to Kd values that decrease from GDP to GMPCPP to GTPγS microtubules, and with each disrupted pool having a lower Kd than in the control pool. (F) Left: Predicted binding curves based on the calculated Kd values in panel E. As previously described, the data was fit to a Hill Equation for cooperative binding of EB1 onto microtubules (Lopez and Valentine, 2016; Zhu et al., 2009). The experimental EB1-GFP concentrations used in Figure 2C–E are shown as a dotted line on each graph. Right: predicted ratio of EB1 binding to Disrupted vs Closed microtubules at 250 nM EB1-GFP, and comparison to experimental values in Figure 2C–E.
Figure 4
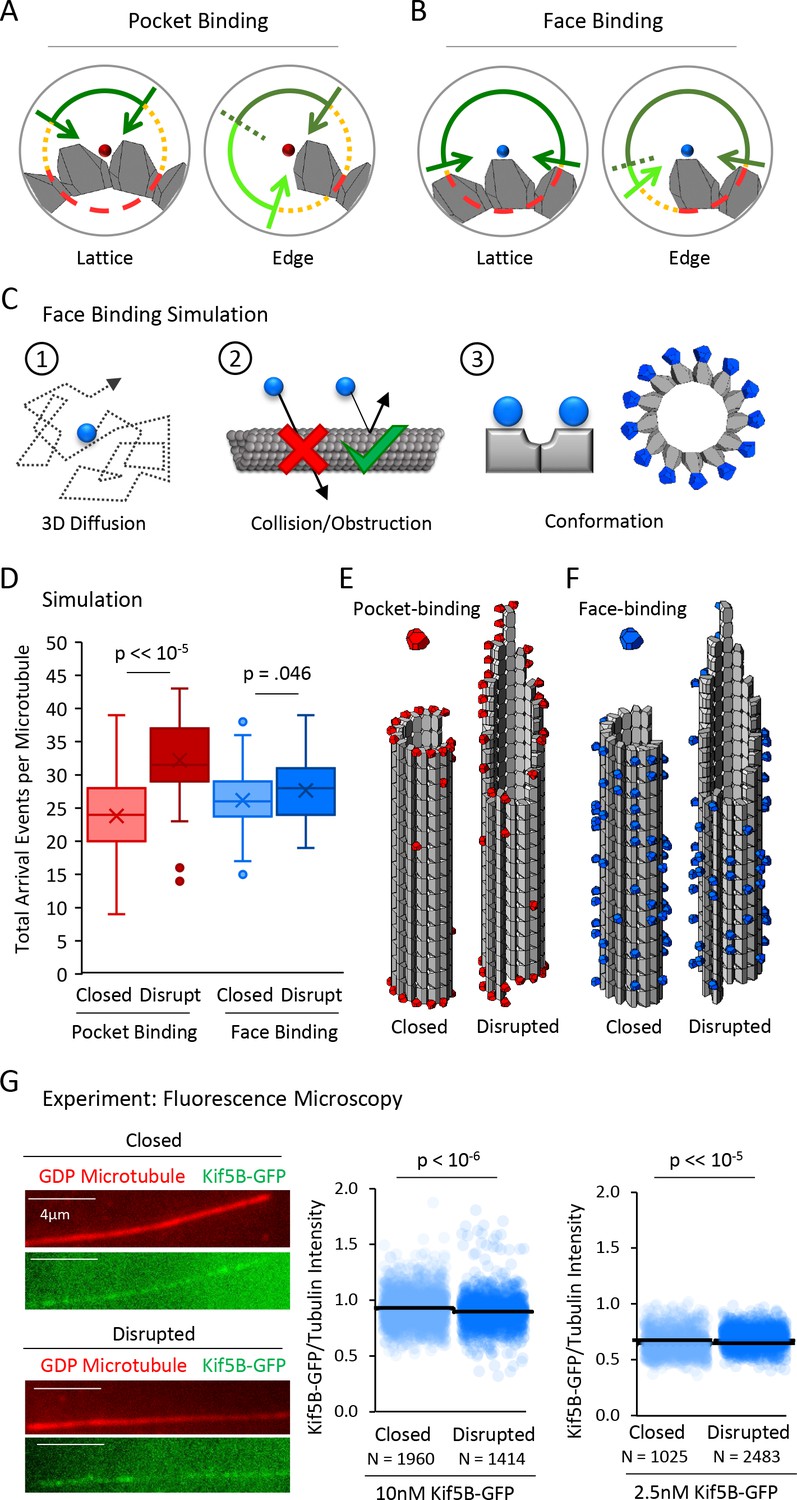
A tubulin face binding protein does not demonstrate microtubule structure recognition in experiment and simulation.
(A) Hypothesis schematic showing large increase in direct access to a pocket binding site (dark green + light green) upon change from lattice conformation (left) to an edge conformation (right) for a pocket-binding protein. (B) Face binding hypothesis model predicts only a small change in direct access to a face binding site upon change from lattice conformation (left) to an edge conformation (right). (C) Simulation rules and parameters for face binding are identical to a pocket binding simulation with respect to (1) 3D diffusion, and (2) obstruction of the binding molecule by tubulin molecules. (3) The only change in the simulation was in the location of the binding site (left), with the arrangement of simulated face-binding protein on a microtubule at right. (D) Total arrival events per microtubule for a simulated pocket binding protein (EB1, red) and face binding protein (blue), showing molecular arrival events on closed (light red/light blue) and ‘disrupted-structure’ (dark red/dark blue) microtubule conformations. Results of 50 simulations of 4,000 EB1 molecules each for each microtubule condition. Each data point in the box and whisker plots represents the total number of EB1 arrival events per microtubule for 4000 different simulated EB1 molecules. (E) Representative visualizations of arrival event location distribution of pocket binding protein such as EB1 (red) on closed and disrupted-structure microtubules. (F) Representative visualizations of arrival event location distribution of face binding protein (blue) on closed and disrupted-structure microtubules, illustrating the loss of preference for edge-located binding sites. (G) Left: Representative images of Kif5B-GFP (green), which is a tubulin face binding protein, on GDP microtubules (red) (scale bar 4 µm). Right: Cloud plots of Kif5B-GFP/Tubulin intensity ratio for individual microtubules. Each semi-transparent circle is the data point from a single microtubule. Solid lines are the average Kif5B-GFP/Tubulin intensity ratio for each population.
Figure 5 with 1 supplement
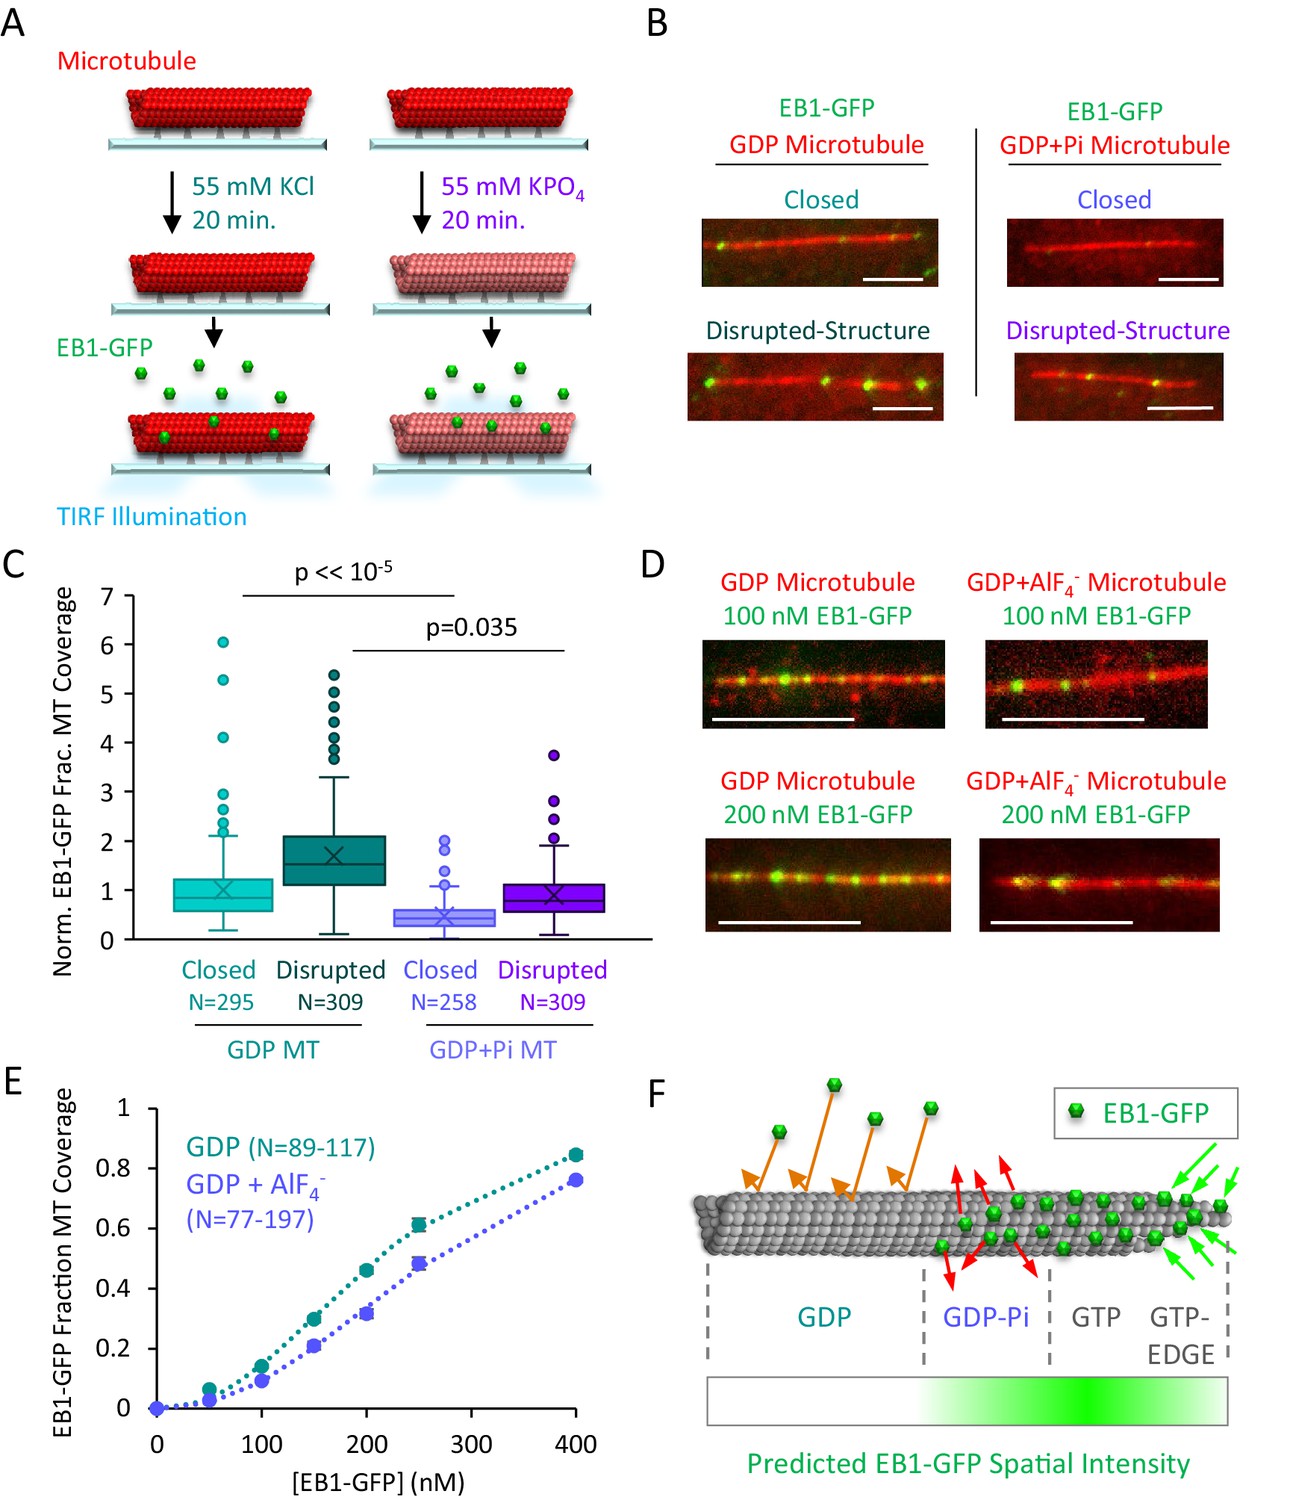
EB1-GFP binding is suppressed on GDP-Pi microtubules.
(A) Experiment to compare EB1-GFP binding to GDP and GDP+Pi microtubules (see Materials and methods). (B) Representative images of EB1-GFP binding to GDP and GDP+Pi microtubules (scale bar 5 µm). (C) Quantitative binding comparison, based on EB1-GFP fractional coverage area of microtubules. All values normalized to the average fractional coverage area in the closed GDP microtubule population. Sample sizes represent number of independent images analyzed. (D) Representative images of EB1-GDP binding to closed microtubules in the presence and absence of the phosphate analog AlF4- (Antonny and Chabre, 1992; Carlier et al., 1988; Petsko, 2000) (scale bar 5 μm). (E) Quantitative analysis of EB1-GFP binding under conditions of increasing EB1 concentrations. As previously described, the EB1 binding data was best fit using a cooperative binding curve (Lopez and Valentine, 2016; Zhu et al., 2009), which demonstrated a ~ 2 fold lower affinity of EB1 for the GDP-Pi-Analog relative to the GDP microtubules. (F) Implementation of structural recognition into a two-state model for EB1 binding and microtubule tip structure maturation.
Figure 5—figure supplement 1
Additional Data to Support Figure 5.
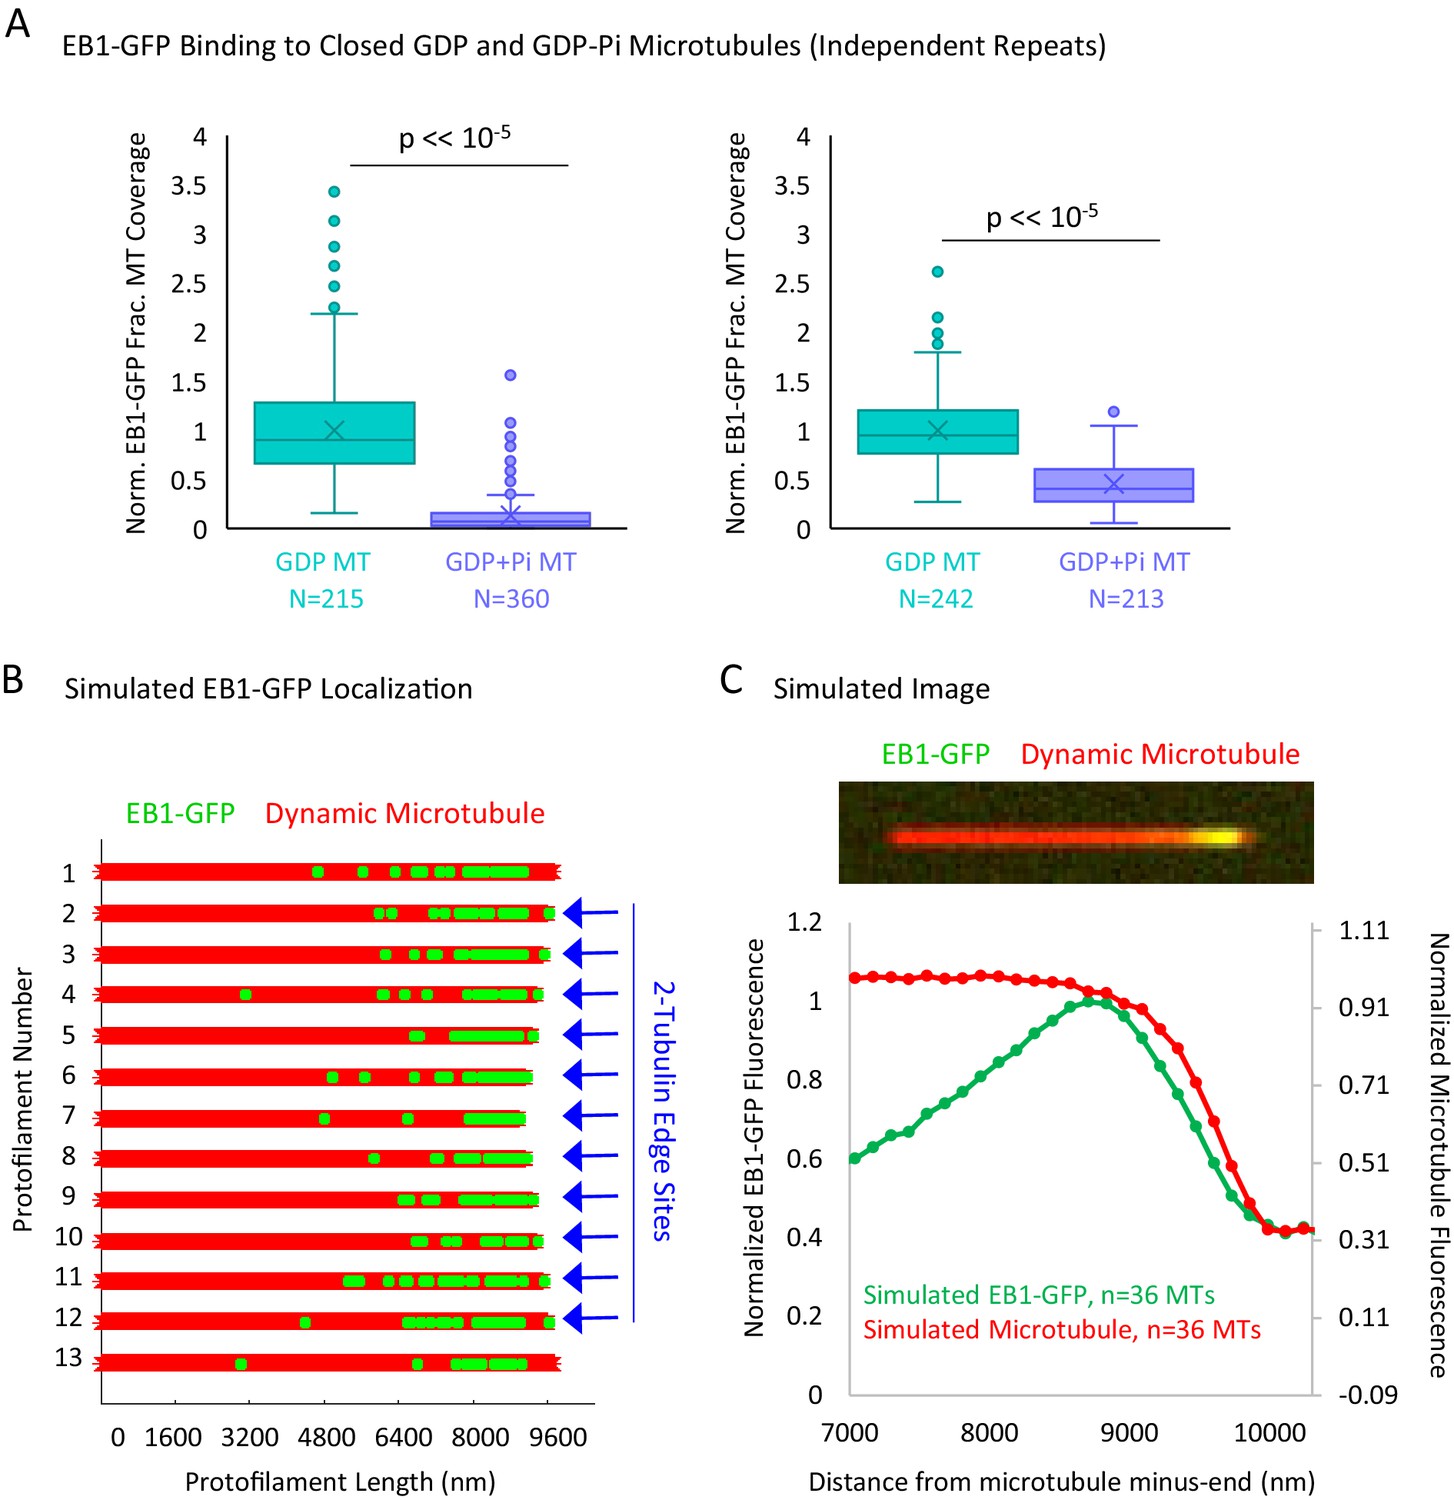
(A) Experimental repeats to evaluate the binding of EB1 to closed GDP and GDP+Pi microtubules. Each plot represents a different experimental day. (B) Graphical representation of a flattened microtubule, showing microtubule protofilaments (red) with EB1-GFP at the microtubule plus-end (green). The microtubule shown has moderate taper at its plus-end (at the right of schematic). EB1-GFP is localized at the microtubule plus-end via two rules: (1) the EB1-GFP is distribution decreases exponentially away from the tip, starting at the first complete layer of tubulin subunits, and (2) the 2-tubulin ‘protofilament edge’ sites are fully occupied by EB1-GFP. Locations with 2-tubulin edge sites are noted with blue arrows. The longest two protofilaments (1 and 13) are not assigned edge sites to account for a closed tube. (C) Top: Simulated image of a microtubule (red) with EB1-GFP at its end (green). Bottom: Super-averaged line scan data from 36 simulated microtubules with varying degrees of tip taper. Similar to previous reports (Maurer et al., 2014), the peak in EB1-GFP appears to be slightly penultimate to the microtubule end, suggesting that binding to protofilament edges may not significantly bias the observed EB1-GFP fluorescence distribution at the microtubule plus-end.
Figure 6 with 1 supplement
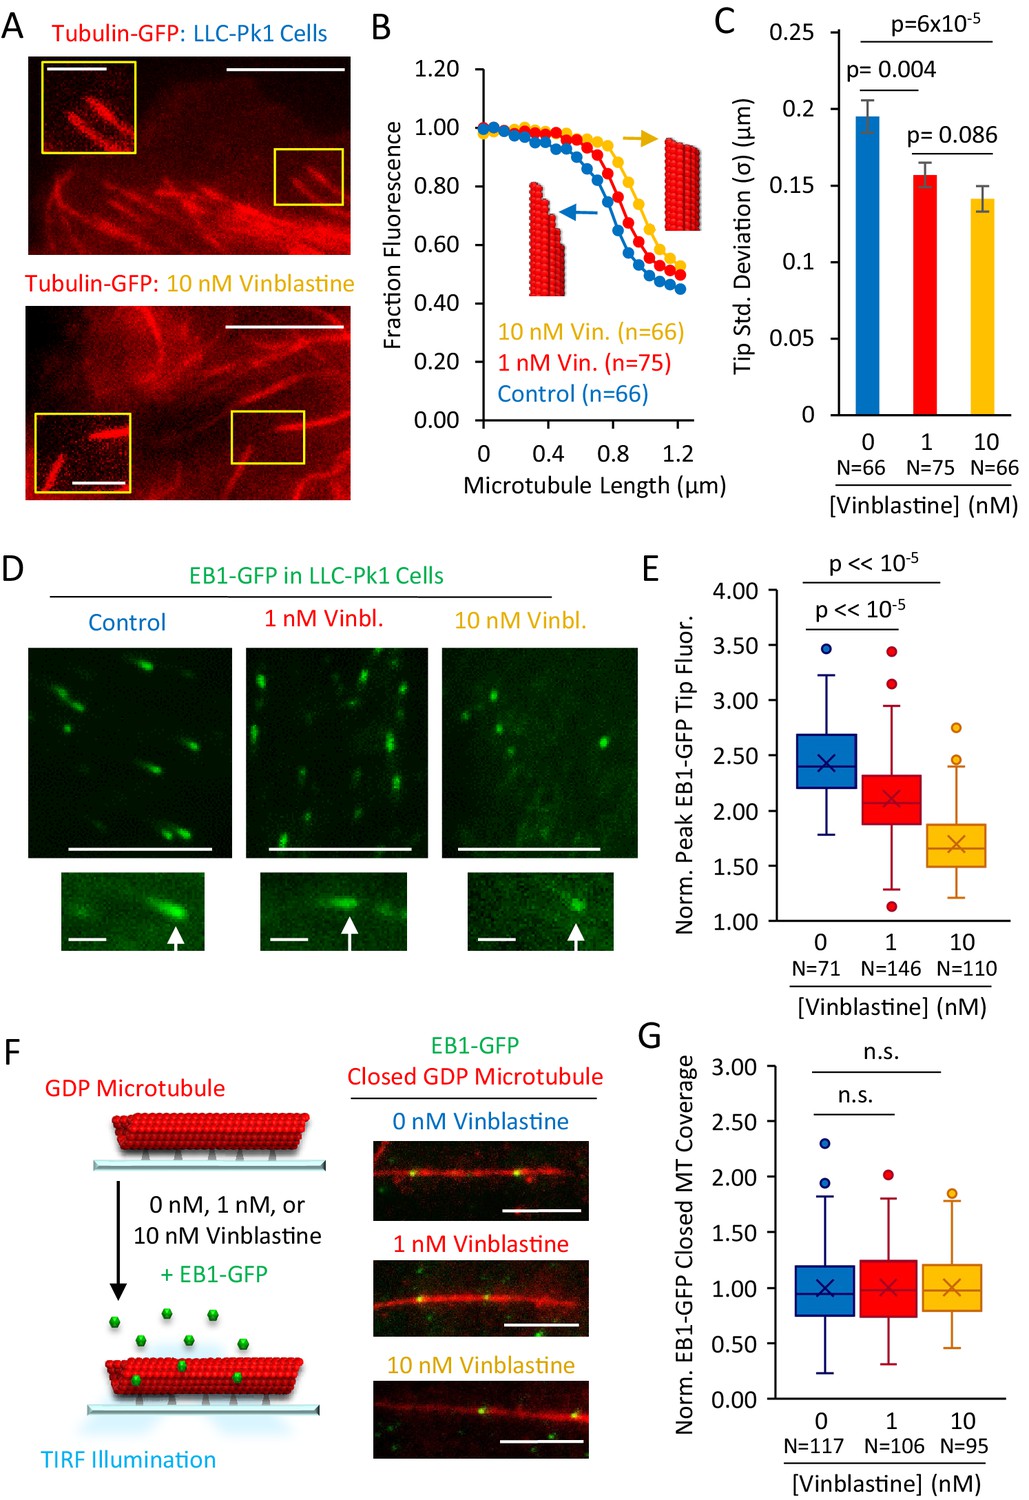
Structural recognition facilitates EB1 tip tracking at growing microtubule plus-ends in cells.
(A) Representative images of Tubulin-GFP expressed in LLC-Pk1 cells with inset detail of growing microtubule tips (control cells, top, 10 nM Vinblastine treated, bottom; see Materials and methods) (scale bar 5 µm, insets 2 µm). (B) Average linescans that show the dropoff in intensity of tubulin at the tips of microtubules in control and Vinblastine treated cells. A sharper drop-off (yellow) is suggestive of a blunt microtubule end, and a slower dropoff (blue), is suggestive of a more tapered microtubule end, as shown by the red microtubule cartoons. (C) Tip standard deviations as estimated by fitting to the graphs in panel F. (D) Representative images of EB1-GFP expressed in LLC-Pk1 cells (top) with inset EB1-GFP comets at growing microtubule tips (bottom) (control cells, left; 1 nM Vinblastine treated, center; 10 nM Vinblastine treated, right; see Materials and methods) (scale bar 5 µm, comet detail scale bar 1 µm). (E) Peak EB1-GFP fluorescence normalized to lattice EB1-GFP fluorescence. (F) Experiment (left) and representative images (right) of in-vitro experiment to quantify binding of EB1-GFP to closed GDP microtubules in the presence of increasing concentrations of Vinblastine (scale bar, 5 µm). (G) Quantitative binding of EB1-GFP to closed GDP microtubules, based on EB1-GFP binding area on microtubules. All values normalized to the average binding area in the 0 nM Vinblastine population. Sample sizes represent number of independent images analyzed (p=0.91, t-test 0 nM vs 1 nM Vin.; p=0.88, t-test 0 nM vs 10 nM Vin.).
Figure 6—figure supplement 1
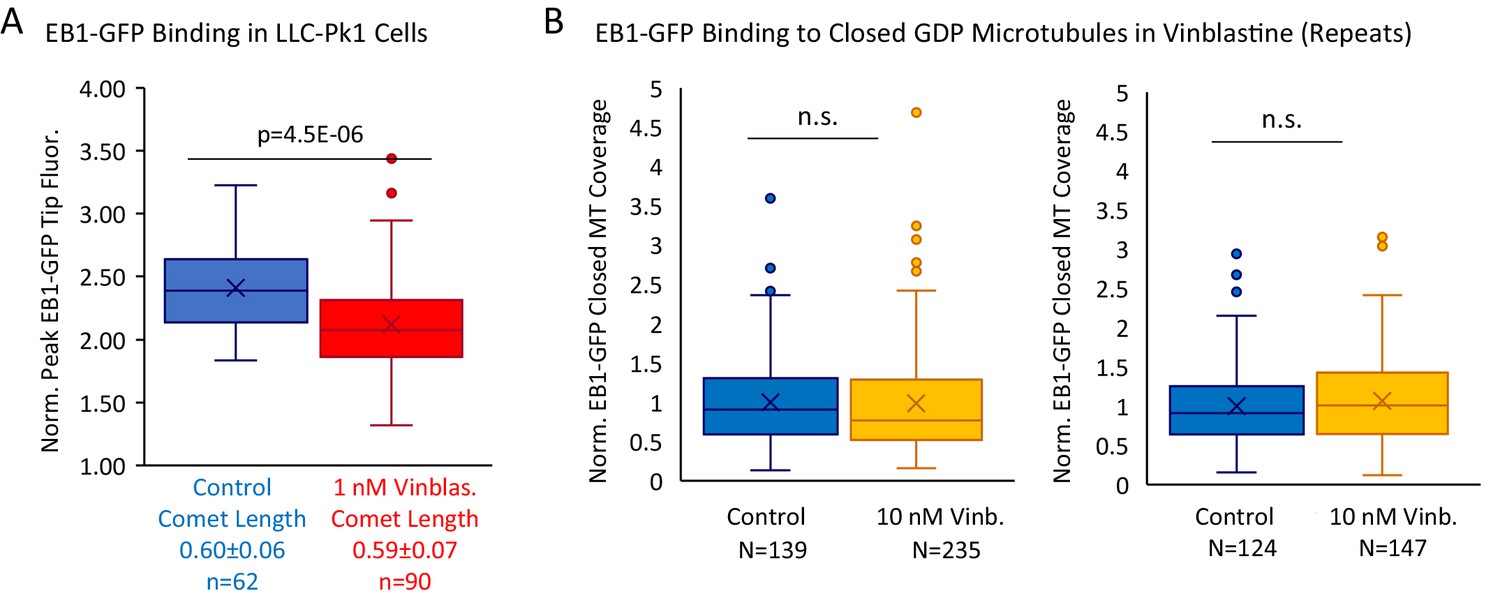
Supplemental Data to support Figure 6.
(A) Peak EB1-GFP fluorescence normalized to lattice EB1-GFP fluorescence for a subselection of EB1-GFP comets in LLC-Pk1 cells with similar lengths, in control and 1 nM Vinblastine. (B) Experimental repeats to evaluate the binding of EB1 to closed GDP microtubules in the presence of 0 nM (control) and 10 nM Vinblastine. Each plot represents a different experimental day.
Tables
Key resources table
| Reagent type (species) or resource | Designation | Source or reference | Identifiers | Additional information |
|---|---|---|---|---|
| Cell line (porcine, kidney) | LLC-Pk1 Express Tubulin-GFP | (Rusan et al., 2001) | RRID:CVCL_0391 | Gift from Dr. Pat Wadsworth |
| Cell line (porcine, kidney) | LLC-Pk1 Express EB1-GFP | (Piehl and Cassimeris, 2003) | RRID:CVCL_0391 | Gift from Dr. Lynne Cassimeris |
| Recombinant DNA reagent | pETEMM1-HIS6x-tev-EB1-GFP (plasmid) | (Zanic et al., 2009) | ||
| Recombinant DNA reagent | RP hk339-GFP (monomeric Kif5B-GFP-HIS6x plasmid) | (Tomishige and Vale, 2000) | Addgene plasmid #24431 | Gift from Dr. Ron Vale |
Additional files
-
Transparent reporting form
- https://doi.org/10.7554/eLife.48117.012
Download links
A two-part list of links to download the article, or parts of the article, in various formats.
Downloads (link to download the article as PDF)
Open citations (links to open the citations from this article in various online reference manager services)
Cite this article (links to download the citations from this article in formats compatible with various reference manager tools)
Structural state recognition facilitates tip tracking of EB1 at growing microtubule ends
eLife 8:e48117.
https://doi.org/10.7554/eLife.48117


