A tissue-like platform for studying engineered quiescent human T-cells’ interactions with dendritic cells
- University of Oxford, United Kingdom
- New York University School of Medicine, United States
Figures
Figure 1
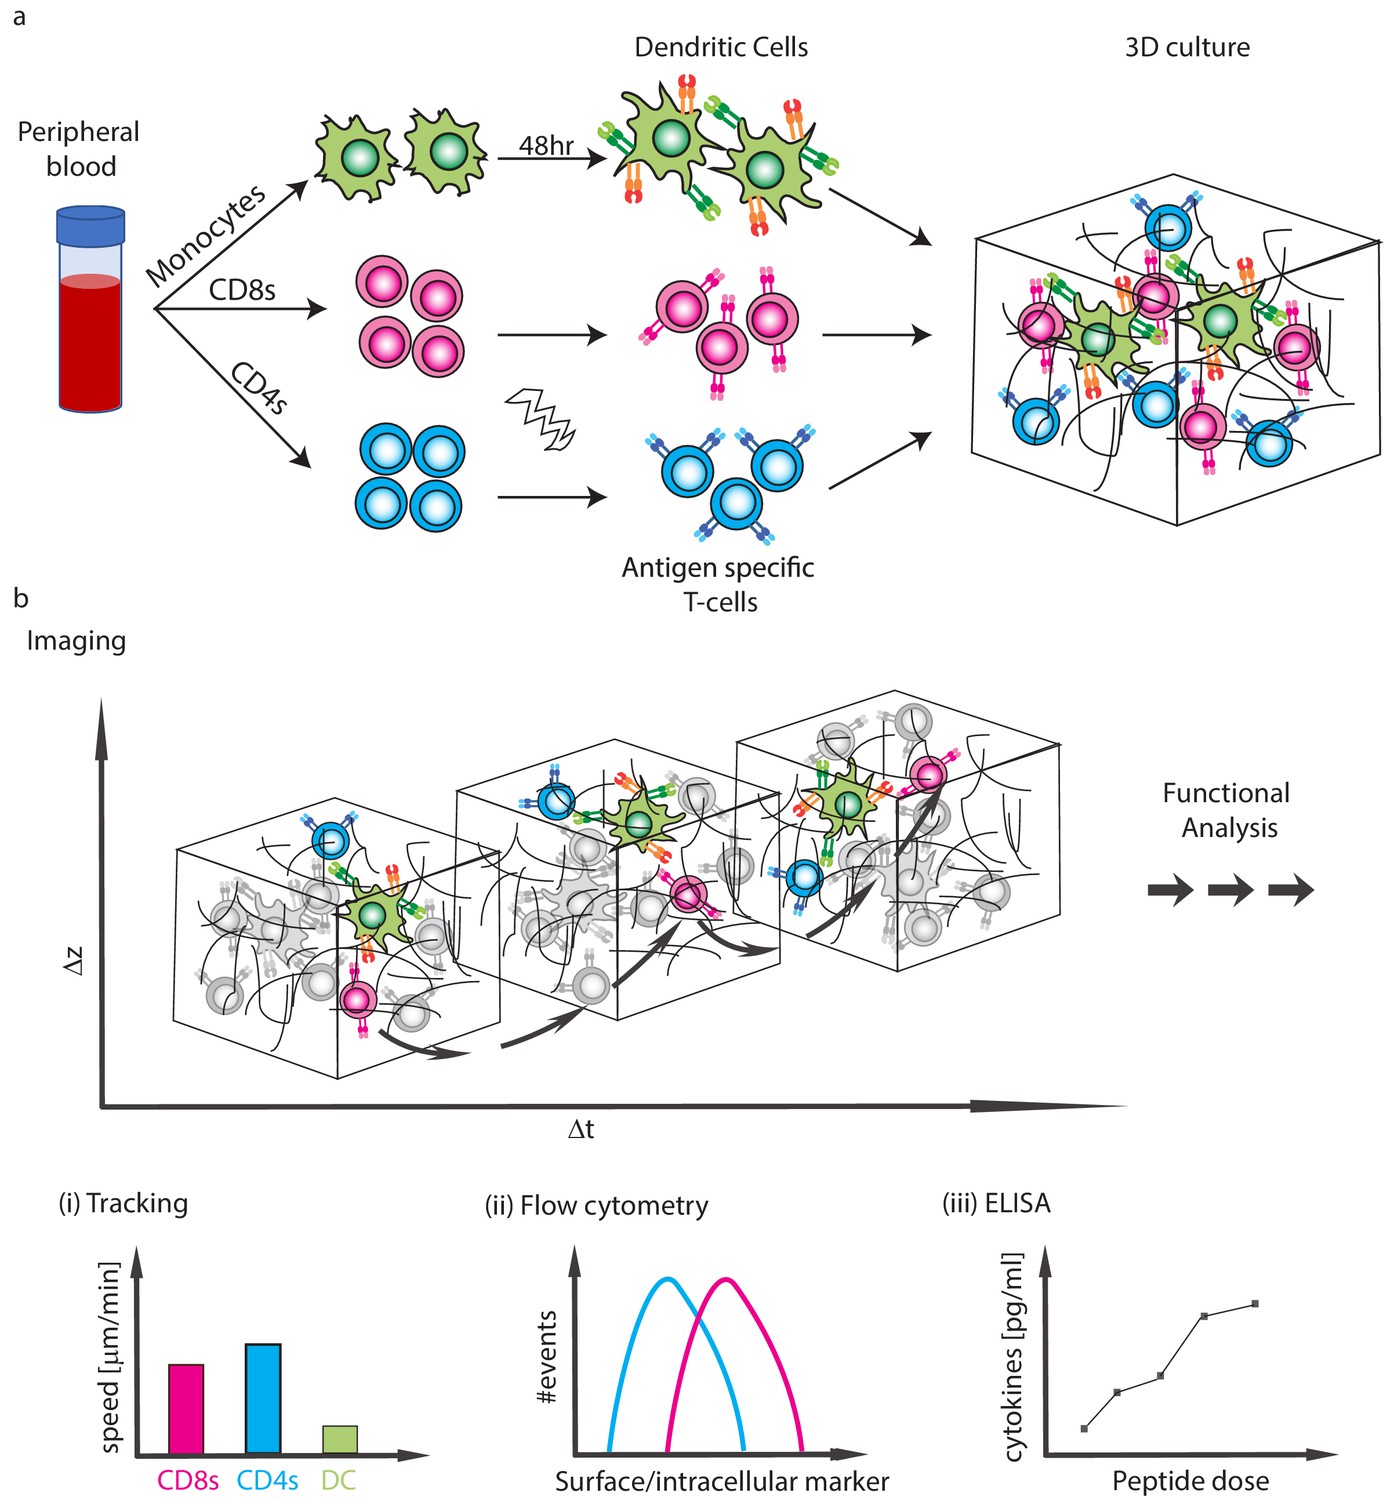
Schematics of the experimental system.
(a) Isolation of CD4 T-cells, CD8 T-cells and monocytes from peripheral blood. Subpopulations of T-cells can be further purified and TCR expression is induced by mRNA electroporation. Monocytes are differentiated into DCs and are activated with a 48 hr express protocol. The cells are then moved into collagen gel-based 3D culture. (b) Cells can be taken for imaging or downstream functional analyses. (i) The imaging can be used to analyse interaction dynamics such as speed or conjugate formation, (ii) Cells can be extracted for flow cytometry, (iii) Cytokine secretion into the culture can be measured.
Figure 2 with 5 supplements
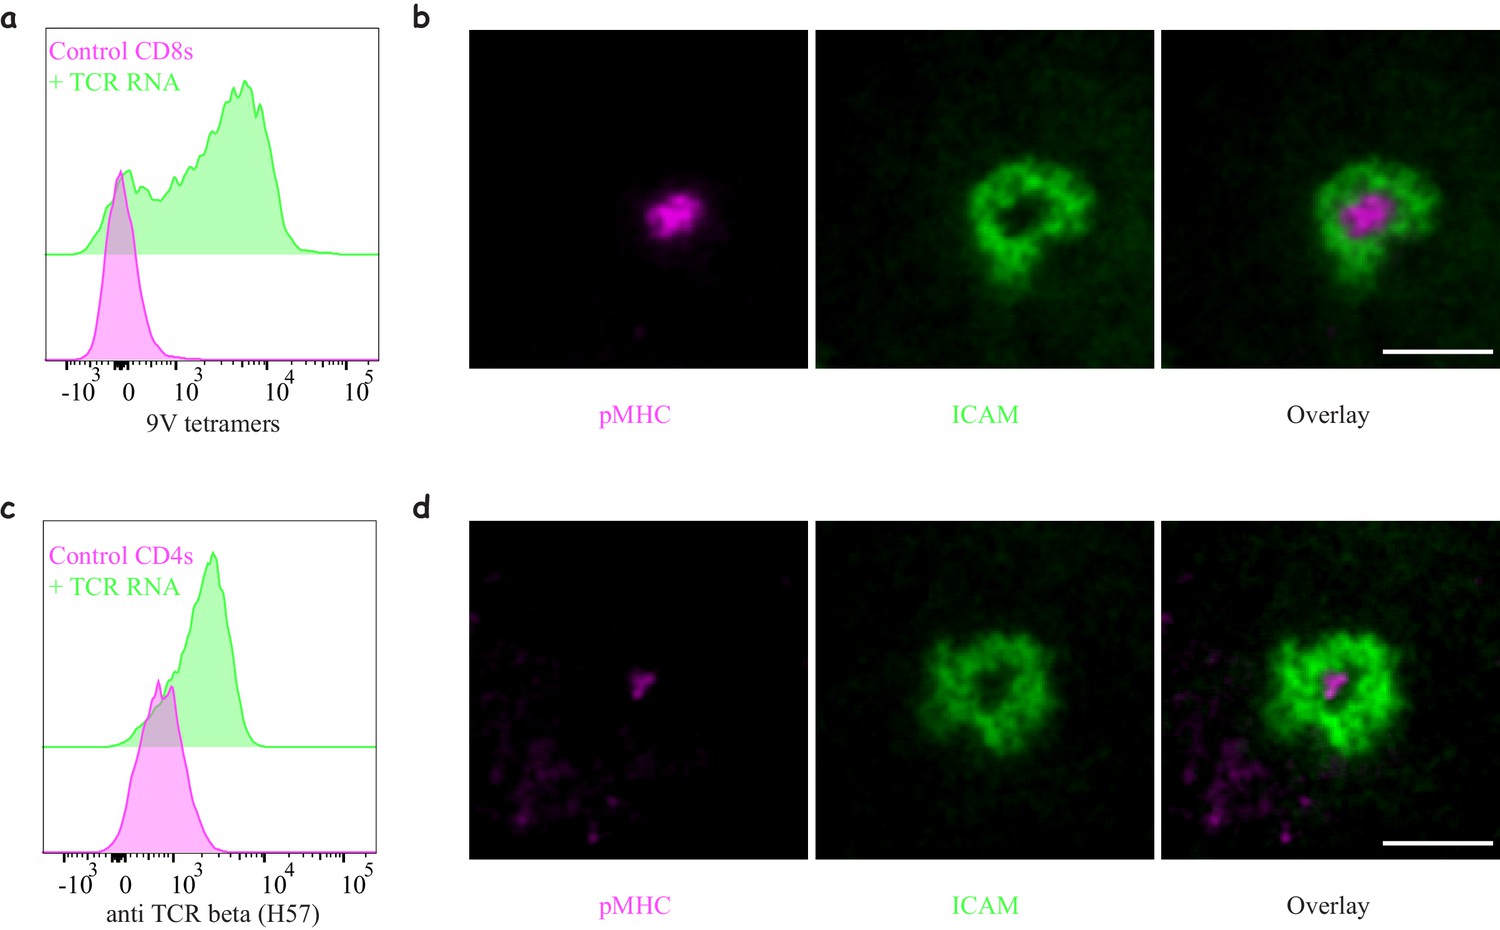
Engineering antigen-specific T-cells.
(a) Expression of 1G4 TCR in naïve CD8 T-cells upon mRNA electroporation detected using NY-ESO-9V/HLA-A2 tetramer,~80% positive (Representative of N = 13). (b) Formation of an immunological synapse by 1G4-expressing naïve CD8 T-cells on supported lipid bilayers (SLBs) with cSMAC enriched with NY-ESO-9V/A2 pMHC (magenta) surrounded by an LFA1/ICAM1 ring (green). Representative of >3 independent repeats. (c) Expression of 6F9 TCR in naïve CD4 T-cells detected using an antibody against the constant region of mouse TCRβ,~67% positive (Representative of N = 15). (d) Formation of an immunological synapse by 6F9-expressing naïve CD4 T-cells on SLB containing MAGE/DP4 pMHC (magenta). Representative of >3 independent repeats. Scale bars = 5 μm.
-
Figure 2—source data 1
TCR expression following mRNA electroporation.
- https://cdn.elifesciences.org/articles/48221/elife-48221-fig2-data1-v2.xlsx
Figure 2—figure supplement 1
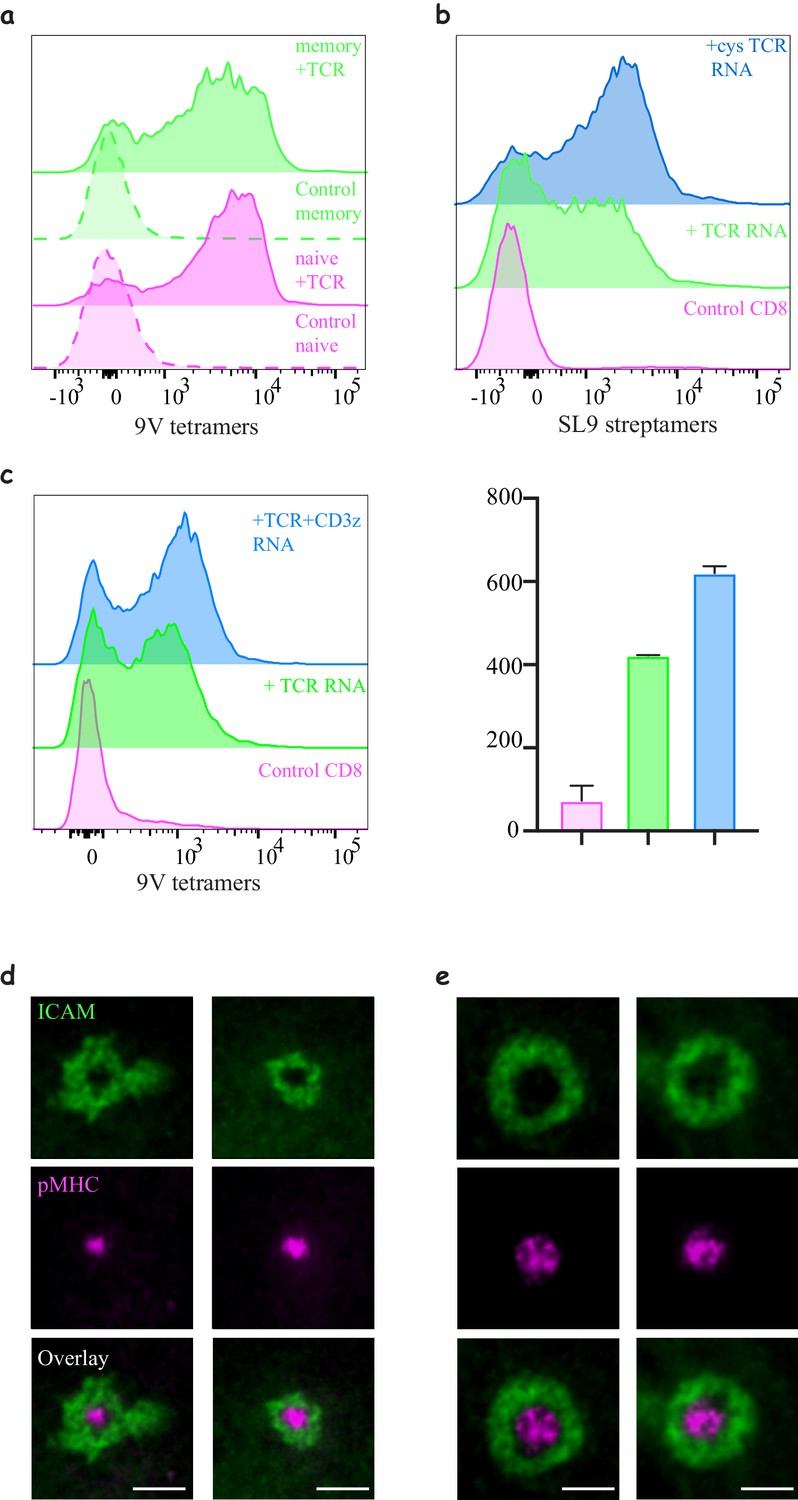
Engineering CD8 T-cells with different TCR constructs.
(a) Expression of 1G4 in naïve and memory CD8 T-cells. Expression was comparable, although we noticed a slightly lower expression levels in memory T- cells. (b) Expression of 868 TCR using mRNA electroporation. Also note the improved efficiency after introducing the cysteine modification. Data shown are representative of at least three independent donors for the 868 without and with the cystine modification. Similar results were achieved for 1G4. (c) Histograms of TCR expression following mRNA electroporating of the alpha and beta chains with or without the addition of CD3ζ (right) and quantification of the mean fluorescent intensity (left). Note the increase in efficiency (Representative of N > 3). (d–e) Formation of an immunological synapse by 1G4-expressing naïve (d) and activated (e) CD8 T-cells on supported lipid bilayers (SLBs) with cSMAC enriched with NY-ESO-9V/A2 pMHC (magenta) surrounded by LFA/ICAM1 ring (green).
Figure 2—figure supplement 2
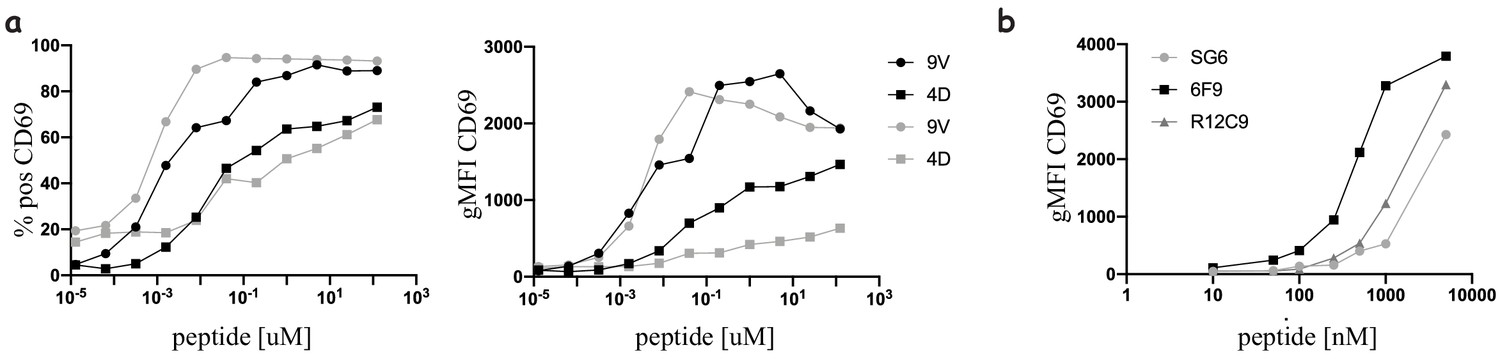
Functional response of mRNA electroporated T-cells.
(a) Dose response curve of percent positive (left) and geometric mean (right) of 1G4-expressing naïve (black) or memory (grey) CD8 T-cell upregulating CD69 upon stimulation with peptide loaded acDC, both with low (NY-ESO-4D) and high (NY-ESO-9V) affinity peptides. (b) Dose response curve of naïve CD4s expressing MHC-II restricted TCRs upon stimulation with peptide loaded acDC with either MAGE-A3243-258 (for 6F9 and R12C9) or NY-ESO157-180 (for SG6). T-cells and DCs are at 1:1 ratio.
Figure 2—figure supplement 3
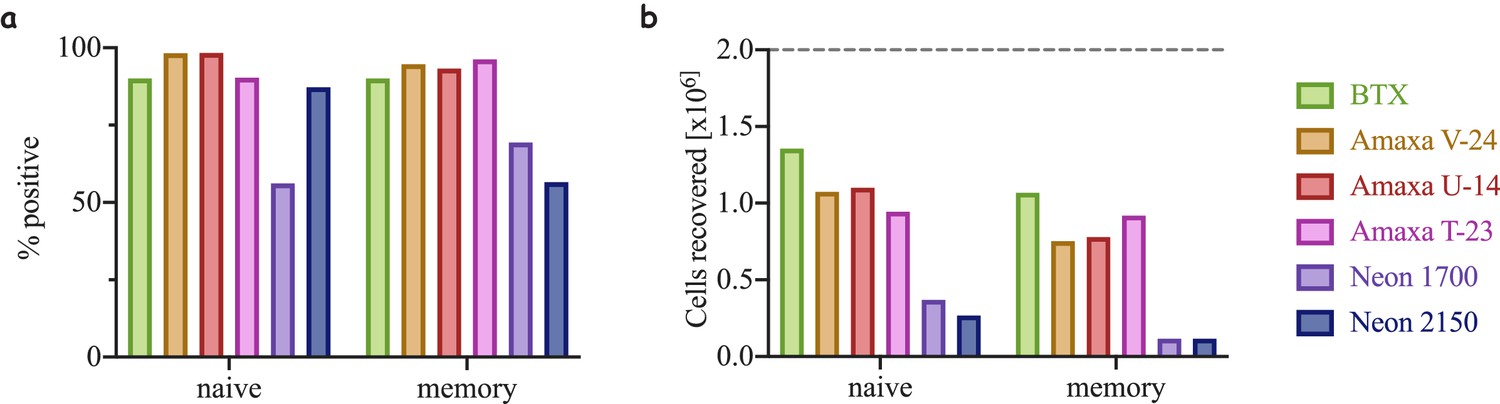
Efficiency of electroporation and cell recovery using different methods.
Naïve T-cells electroporated with an mRNA for the fluorescent protein Ruby. (a) Percentage of Ruby positive cells following electroporation using three different commercially available electroporators: BTX, Amaxa from Lonza and Neon from ThermoFisher. U-14, V-23 and T-23 are electroporation setting on the Amaxa machine. 1700 and 2150 are the voltages used on the Neon (see Materials and methods for more details). (b) Number of cell recovered following electroporation- a product of cell viability and cell count compared to starting condition (dashed grey line).
Figure 2—figure supplement 4
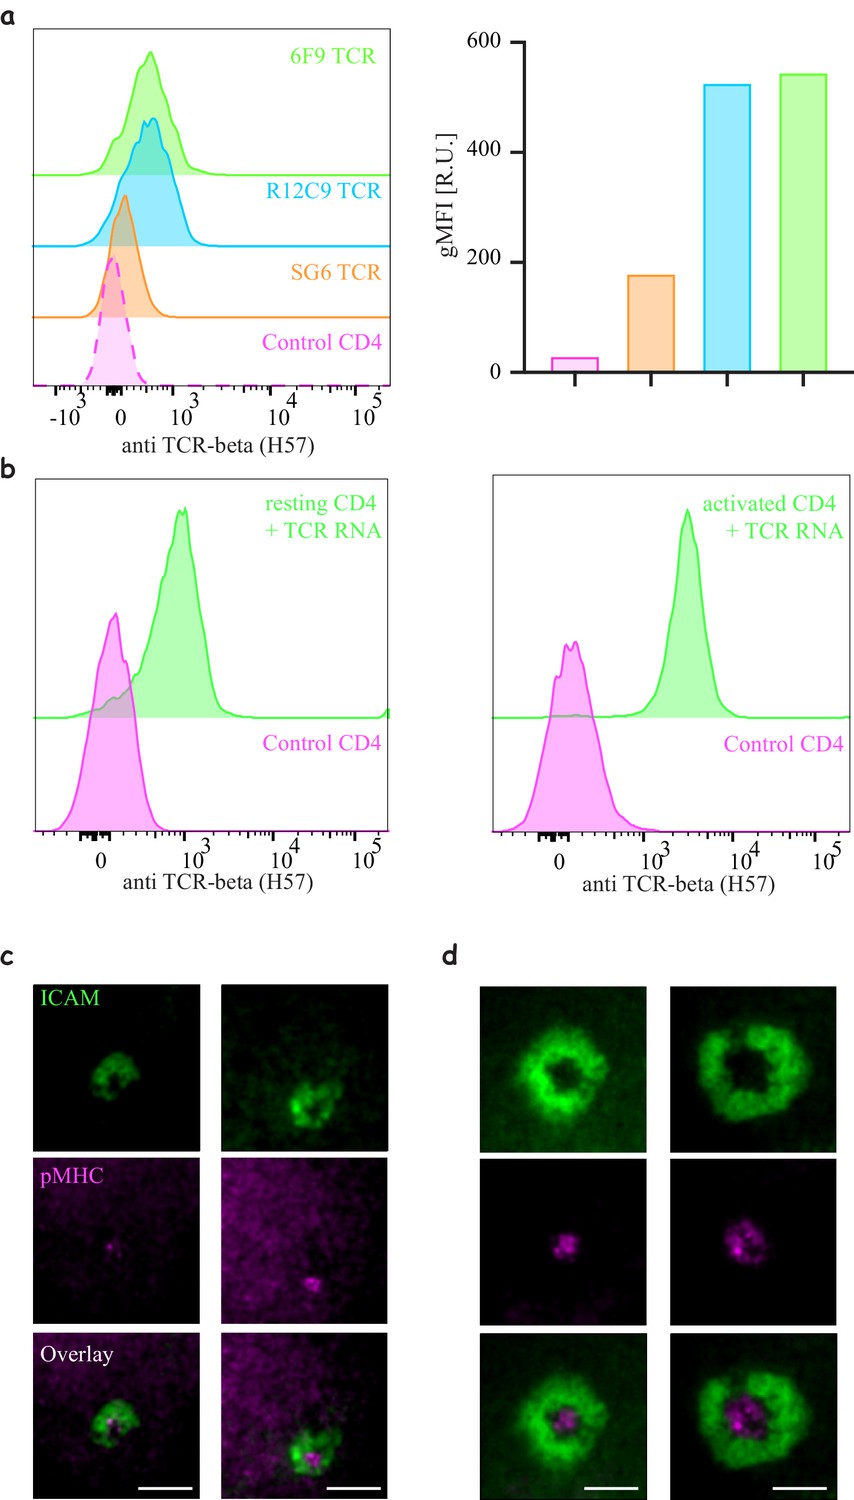
Engineering CD4 T-cells with different TCR constructs.
(a) Histograms of TCR expression of three MHC-II restricted TCRs (6F9, R12C9 and SG6) (right) and mean quantification of the mean fluorescent intensity (left). Note similar efficiency for 6F9 and R12C9 compared to significantly lower efficiency of SG6) (Representative of N > 3). (b) Expression of 6F9 TCR by electroporation of naïve (left) or expanded (right) CD4 T-cells (similar results are obtained for R12C9 and SG6). (c–d) Formation of an immunological synapse by 6F9 expressing naïve (d) and activated (d) CD8 T-cells on supported lipid bilayers (SLBs) with cSMAC enriched with 9V/A2 pMHC (magenta) surrounded by LFA/ICAM1 ring (green).
Figure 2—figure supplement 5

Interactions of 1G4-expressing naïve CD8 T-cells with pMHC presented on spatially segregated stimulatory spots.
(a) The average speed of naïve CD8 T-cells moving on the micropatterned surfaces that have not yet attached to a stimulatory spot (Video 1). This is essentially indistinguishable from the speed of untouched naïve CD8 T-cells in an analogous setting (Mayya et al., 2015) (b) The number of cells arresting on spots as a function of time. Gradual accumulation of arrested cells is an indication of efficient search by the T-cells and induction of arrest due to TCR-pMHC interactions. The attachment profile is comparable to that of untouched cells engaging with anti-CD3 stimulatory spots (Mayya et al., 2019). (c) The number of remaining attached cells on stimulatory spots as a function of time after the first 40 min of imaging. The linear fit allows the extraction of the life-time of the interactions. Half-life of 4.6 hr compares well with that of untouched cells engaging with anti-CD3 spots (Mayya et al., 2018).
Figure 3 with 1 supplement
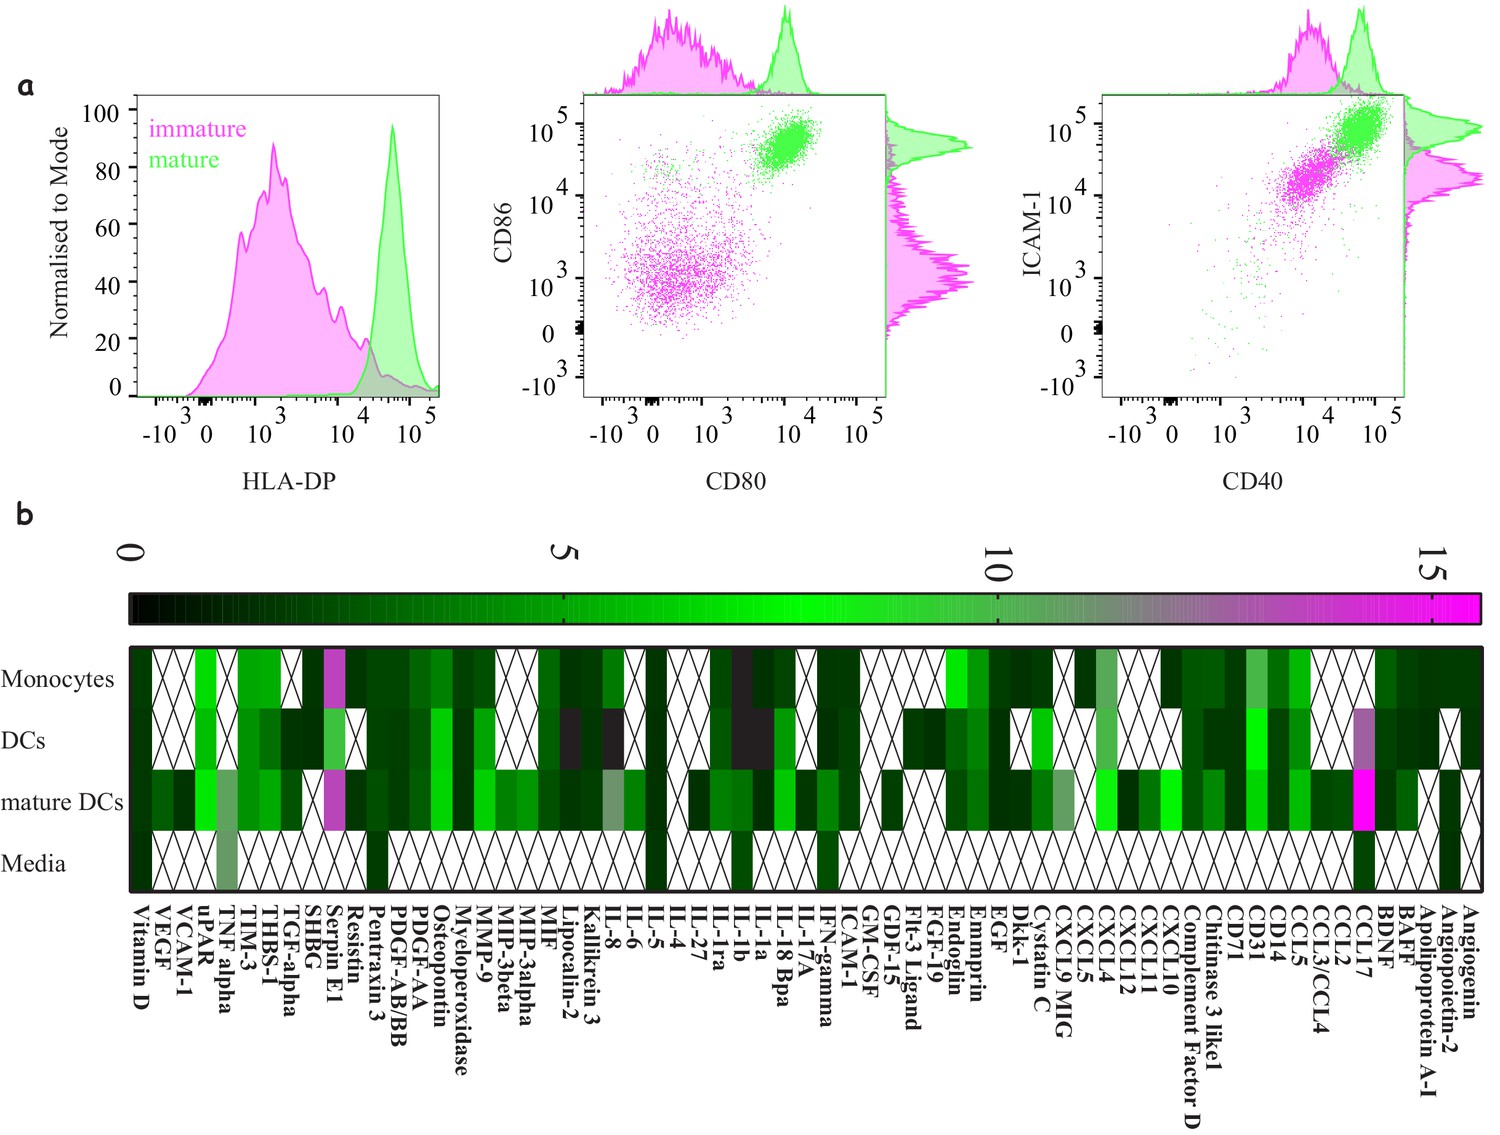
Characterising ‘express’ dendritic cells as a model antigen presenting cell.
(a) Activation and differentiation profile of ‘express’ monocyte-derived dendritic cells: mature cells (green) upregulate their antigen presentation and costimulatory molecules compared to immature cells (magenta). Representative of >3 independent repeats. (b) Cytokine and chemokine secretion profile from monocytes, dendritic cells and mature dendritic cells using the 48 hr express protocol. Average values for three donors where signals bellow 1.5-fold above background were not included.
-
Figure 3—source data 1
Cytokine production by classical DC.
- https://cdn.elifesciences.org/articles/48221/elife-48221-fig3-data1-v2.xlsx
Figure 3—figure supplement 1
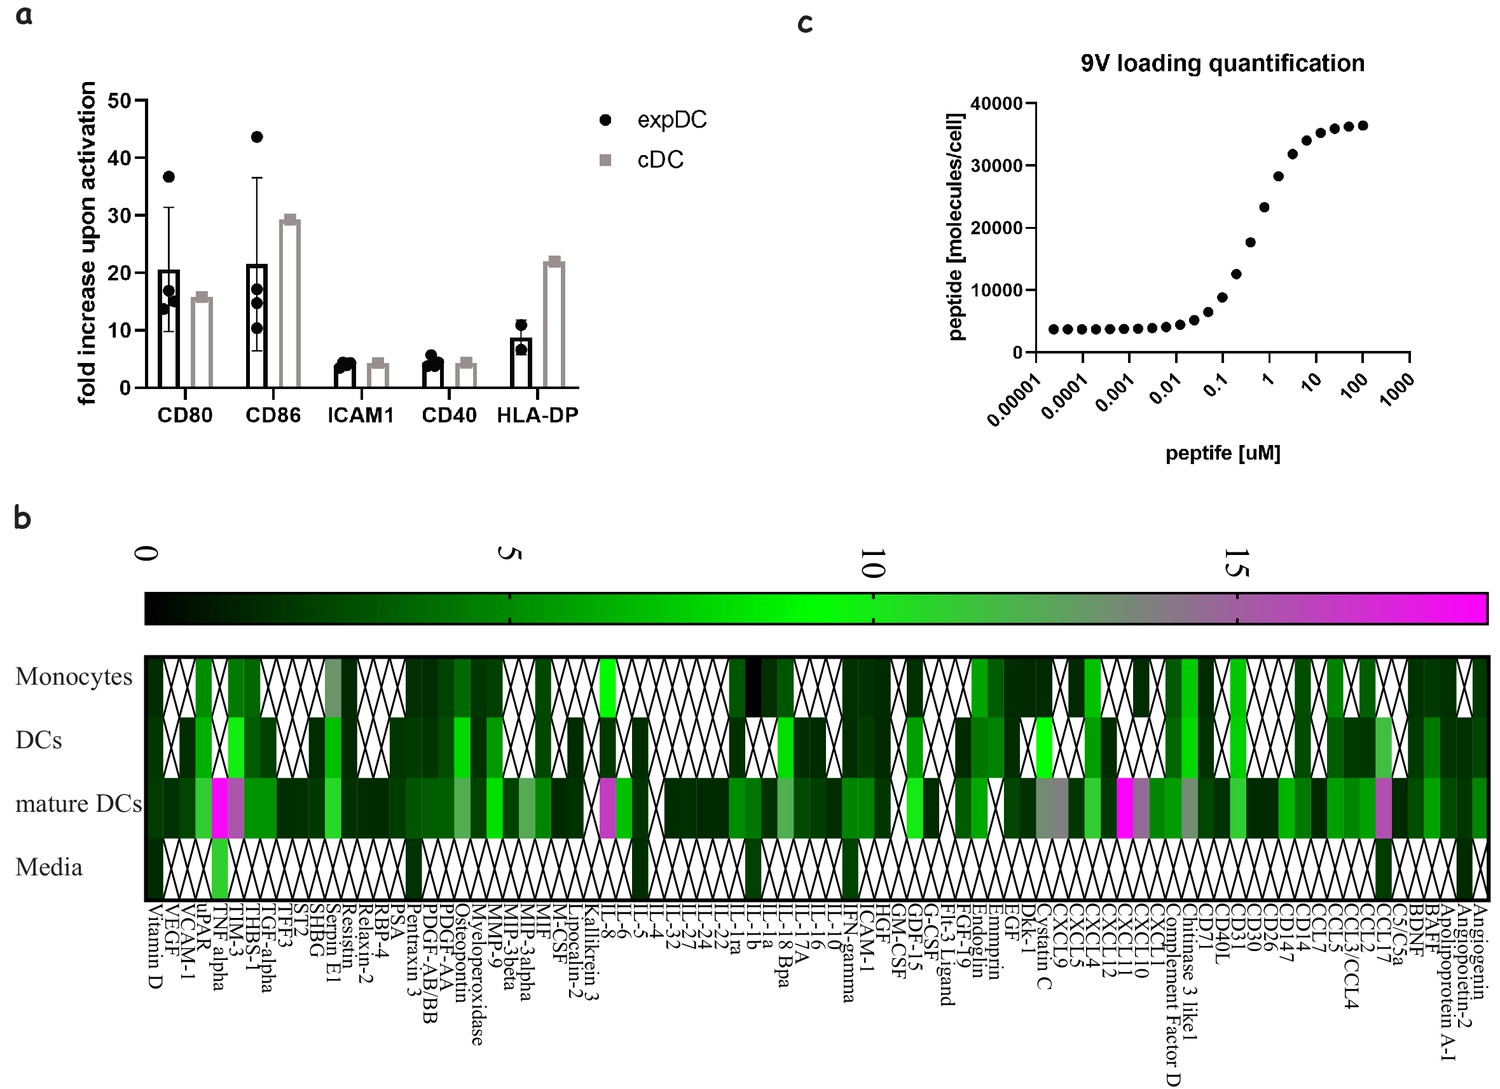
Comparing ‘express’ and ‘classical’ monocyte-derived dendritic cells.
(a) The degree of costimulatory molecule upregulation upon maturation for classical and express DCs. (b) Analysis of fold production of cytokines and chemokines released from classical DCs generated in 7 day differentiation and maturation protocols at different stages: monocytes, differentiated DCs and matured/activated DCs. An average of three donors where signals bellow 1.5-fold above background were not included. (c) Quantification of the number of NY-ESO-9V peptides loaded on DCs using soluble high affinity TCR (c113) and MSEF calibration beads.
Figure 4 with 2 supplements
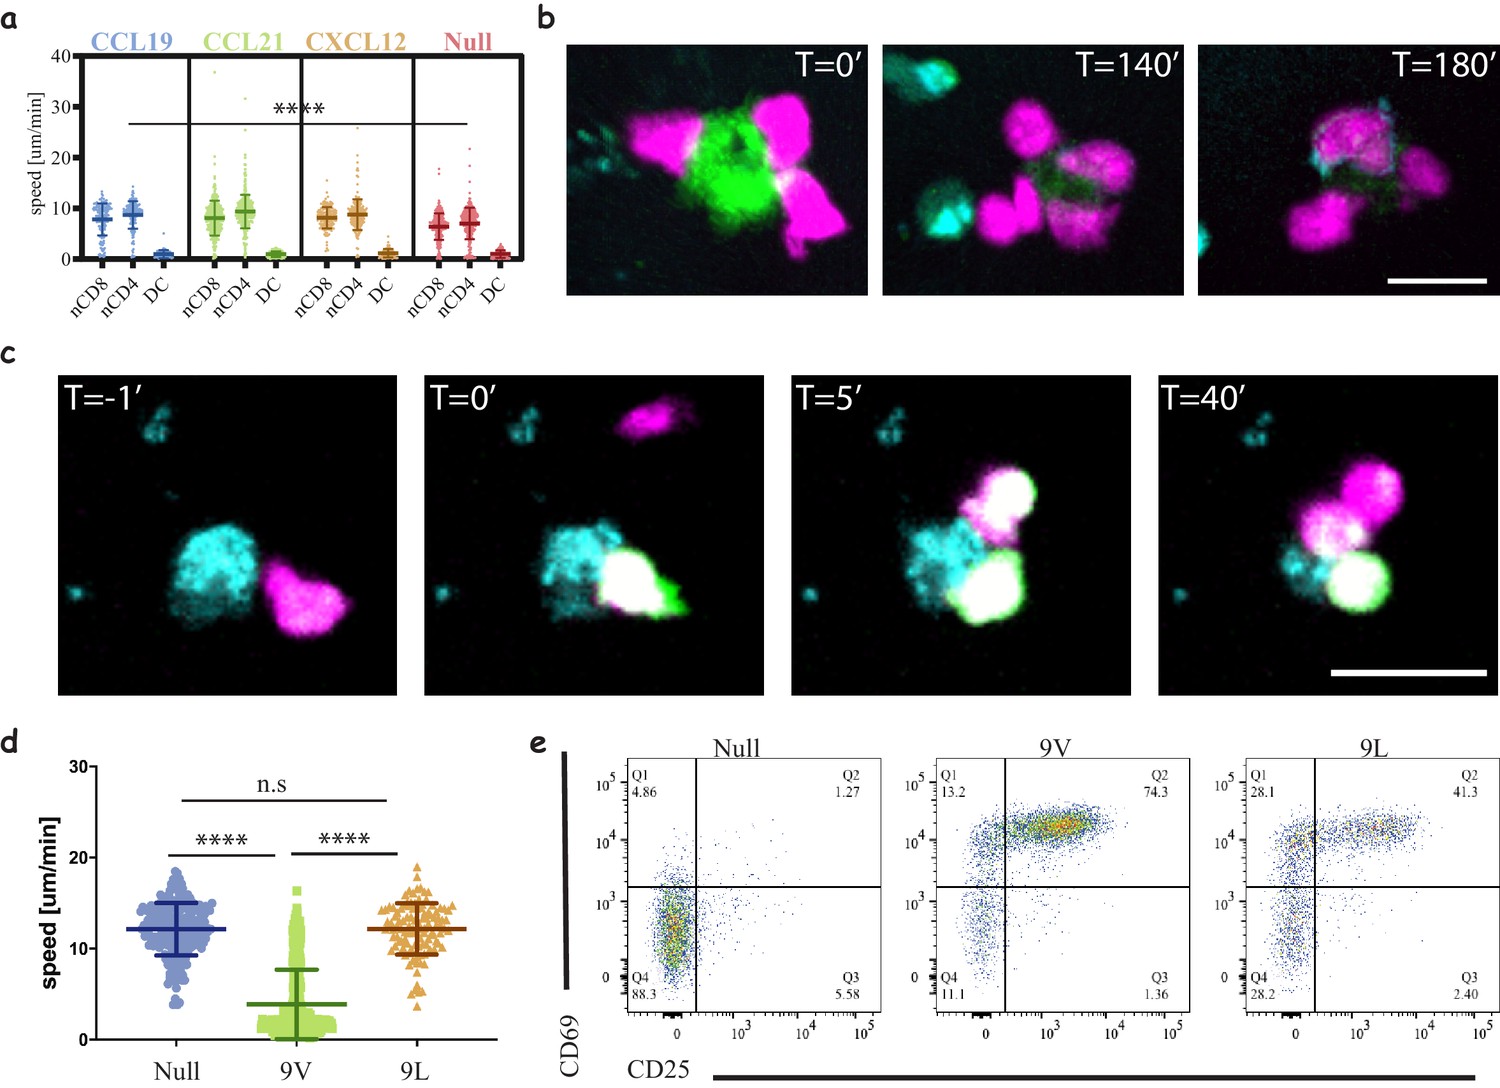
Three-dimensional culture system to study immune cell interactions.
(a) Motility speeds of naïve CD4 and CD8 T-cells and acDCs in collagen gels with different chemokines. Note the faster motility of T-cells compared to acDCs and similar motility using homeostatic chemokines (CCL19, CCL21 and CXCL12). Representative of 2 independent repeats (Video 2, Table 3). (b) Snapshots from a time-lapse movie (Video 3) following the interactions of 1G4-expressing naïve CD8 T-cells (magenta) with antigen-loaded acDCs (green) in a collagen gel containing CXCL12, and the upregulation of CD69 is visible at T = 140 min following the accumulation of an anti-CD69 antibody on the surface of the cells (cyan, also in cyan are irrelevant CD4 T-cells). Representative of 3 independent repeats. (c) Snapshots from a time-lapse movie (Video 4) showing three different 1G4-expressing CD8 T-cells (magenta), loaded with calcium dye Fluo4-AM (green), interacting with an antigen loaded acDC (100 nM NY-ESO-9V, cyan) in 3D collagen and fluxing calcium (green) upon binding. Note the lower flux in the second and third contacts suggesting lower antigen availability, being sequestered by the primary synapse. (d) Speed of 1G4-expressing naïve CD8 T-cells upon culture in collagen gels containing CXCL12, with acDC either loaded with high affinity (100 nM NY-ESO-9V) or low affinity (100 nM NY-ESO-9L) peptide or unloaded (null). Note the deceleration of the cells upon engaging with high affinity peptide (3 μm/min compared to 12 μm/min for both null and 9L). Representative of 2 independent repeats. (Videos 7–9). (e) The cells from (c) extracted from the collagen gel and run on a flow cytometr to look at CD69 and CD25 as activation markers. Note the good activation despite the absence of T-cell arrest with low affinity peptide (NY-ESO-9L). Representative of >3 independent repeats. Scale bars = 10 μm. (****, p<0.0001, ANOVA).
-
Figure 4—source data 1
Cell speed in 3D matrices.
- https://cdn.elifesciences.org/articles/48221/elife-48221-fig4-data1-v2.xlsx
Figure 4—figure supplement 1
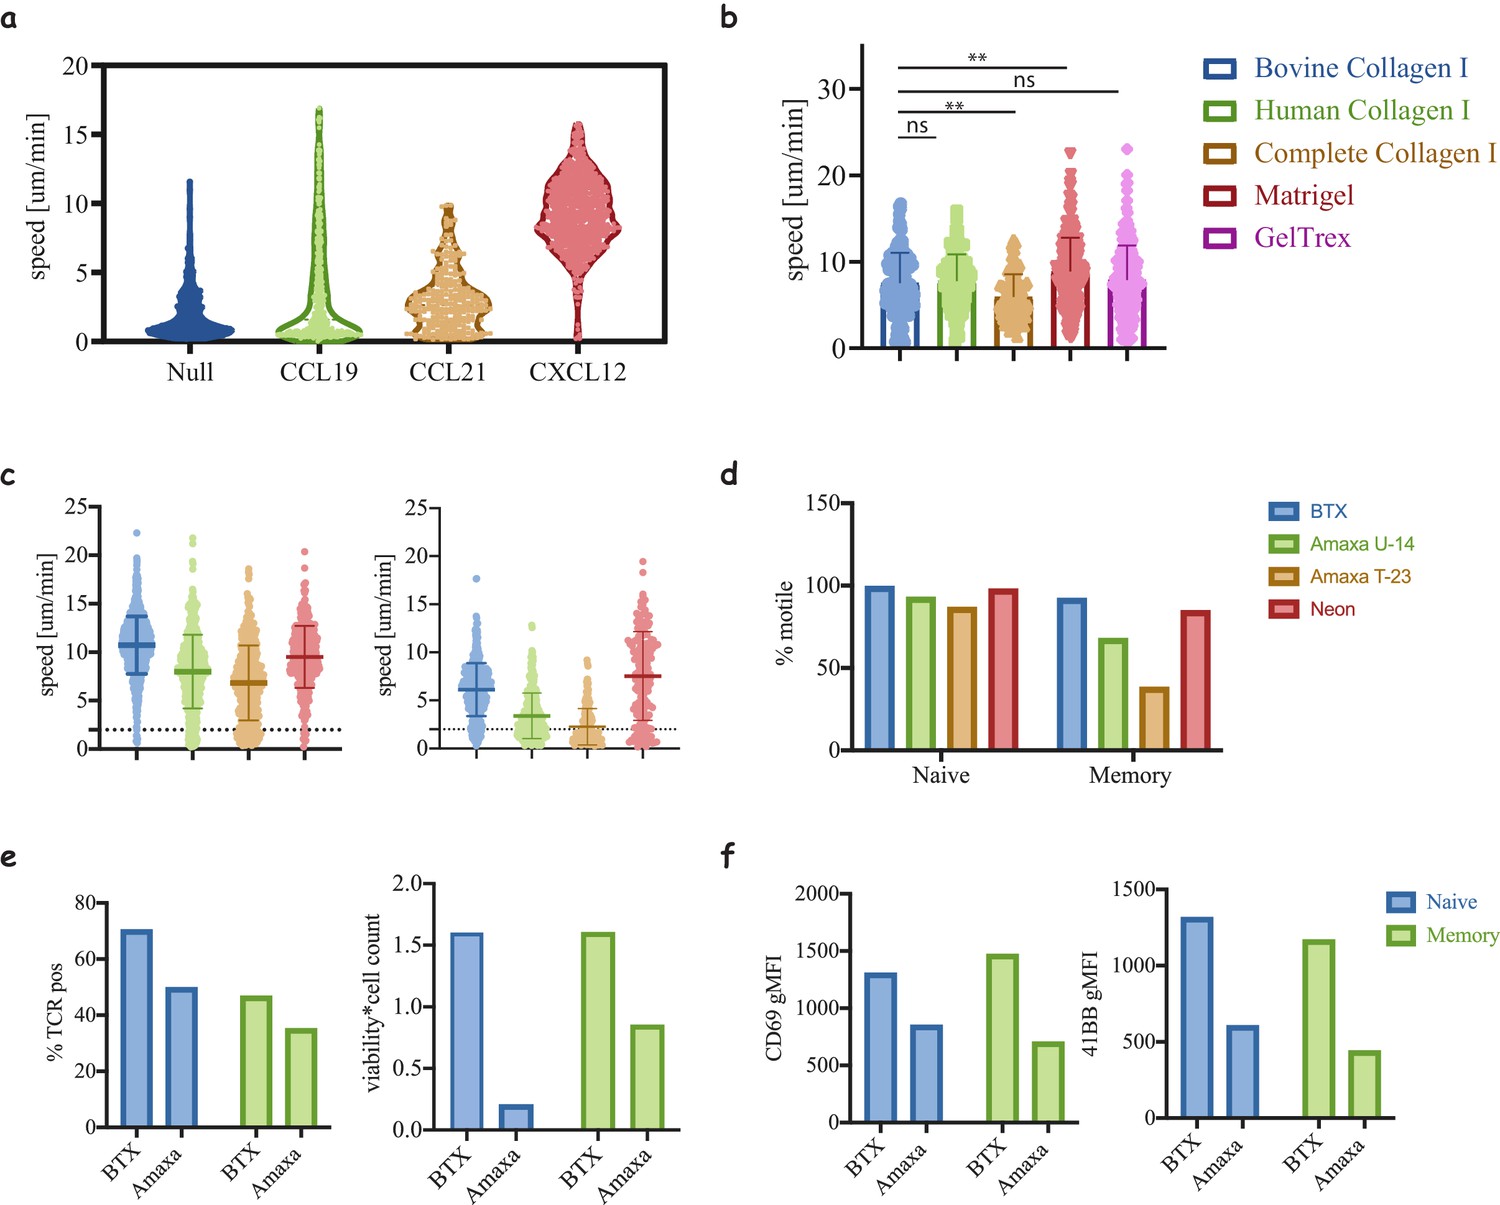
Motility of T-cells in 3D matrices.
(a) Motility of naïve CD8 T-cells cultured in media containing FBS in the presence of different chemokines. Note that in the absence of human serum only the addition of CXCL12 supports cell motility (compared to Figure 2a). (b) Motility of naïve CD8 T-cells in different matrices, collagen of different origins: human, bovine and non-tryptic bovine, and complex ECM: Matrigel and GelTrex (**, p<0.01, ANOVA). (c) Motility speed of naïve (left) and memory (right) cells electroporated with different electroporation protocols (****, p<0.0001, ANOVA, compared to BTX condition). (d) The percentage of motile cells was extracted from (c) to clarify the sensitivity of the cells to the electroporation method. (e) Comparing Amax and BTX electroporation for TCR expression (left) and cell recovery (left). (f) Measuring the activation of the cells from (e) after co-culture with peptide loaded acDCs (100 nM NY-ESO-9V) in collagen gels at a ratio of 5:1 T-cells:DC. Data shown are representative of three repeats.
Figure 4—figure supplement 2
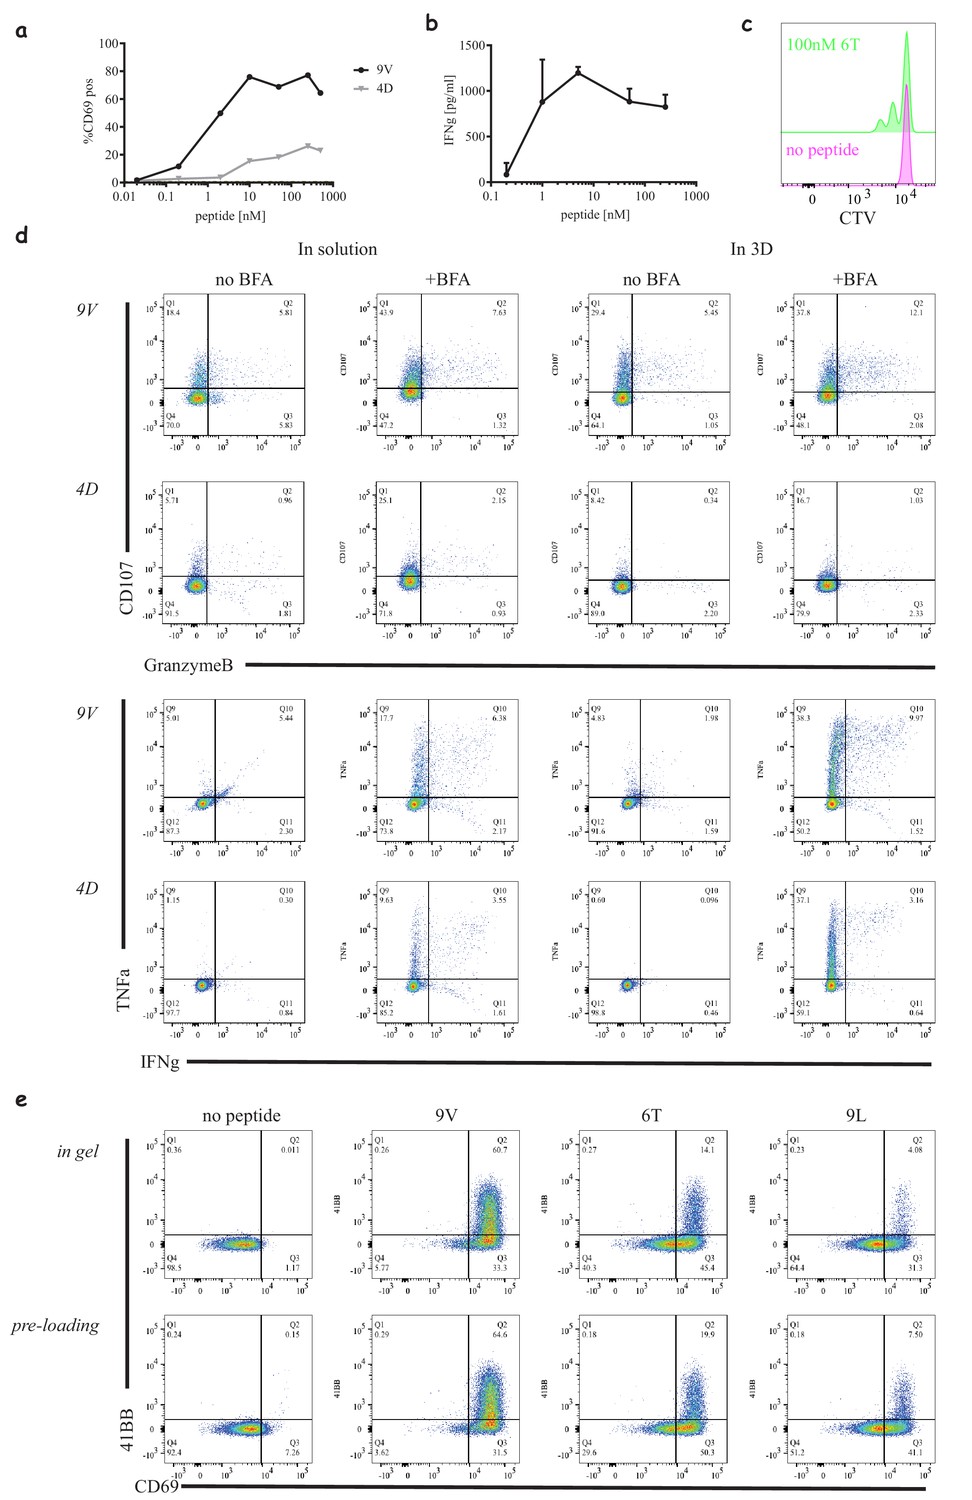
Different readouts in 3D.
(a) Percentage of activated 1G4-expressing CD8 T-cells as a function of peptide dose similar to Supplementary Figure 2b, in collagen gels with 5:1 T-cells to acDCs. (b) Production of interferon gamma from a 24 hr co-cultures of 1G4-expressing CD8 T-cells and peptide loaded acDC with the indicated concentrations of NY-ESO-9V in collagen gels. (c) Proliferation of 1G4-expressing naïve CD8 T-cells cultured with 100 nM NY-ESO-6T loaded acDC in collagen gels after 72 hr, measured by cell trace violet (CTV) dilution. (d) Intracellular staining of activated 1G4-expressing naïve CD8 T-cells stimulated with high affinity (50 nM, NY-ESO-9V) and low affinity (200 nM, NY-ESO-4D) loaded acDCs at 5:1 ratio, in solution and in collagen gels for comparison. The following markers were tested in the presence and absence of brefeldin A (BFA): Granzyme B, LAMP-1 (CD107), IFNγ and TNFα. (e) Activation of 1G4-expressing naïve CD8 T-cells cultured in collagen gels with either pre-loaded acDCs or acDCs loaded inside the gel (Video 10 and 11 respectively).
Figure 5 with 1 supplement
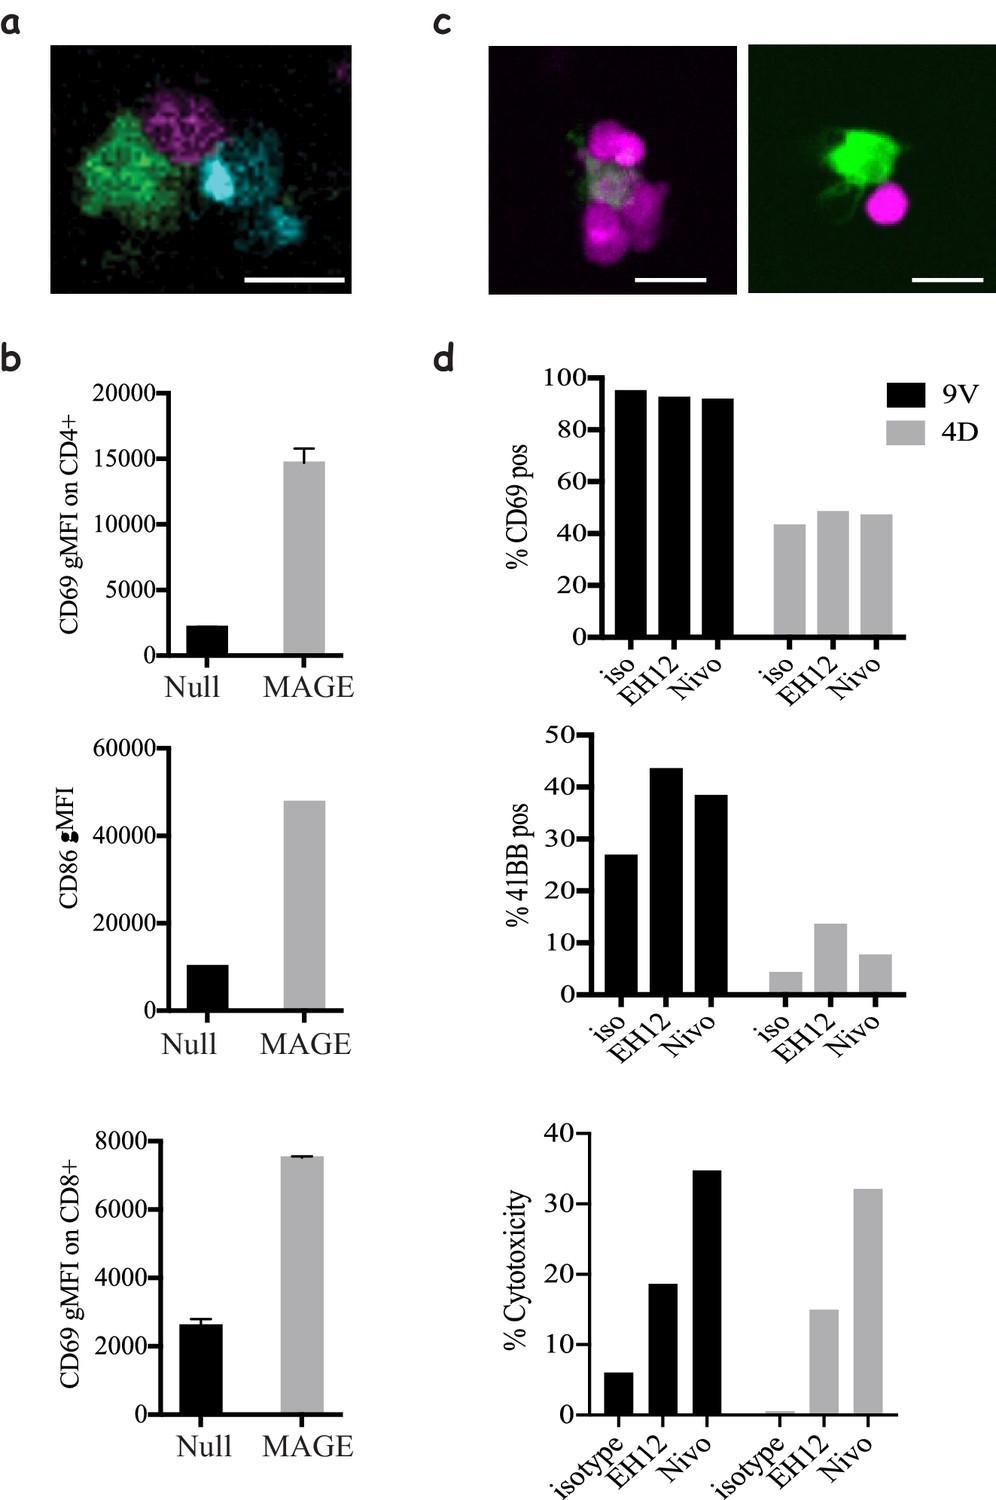
Modelling CD4 T-cells' help and immune checkpoint in 3D cultures.
(a) Co-culture of 1G4-expressing naïve CD8 T-cells (magenta), 6F9-expressing naïve CD4 T-cells (cyan) and acDCs loaded with 100 nM NY-ESO-6T and 10 μM MAGE-A3243-258 peptides (green), (Video 12), in collagen gels containing CXCL12. (b) Upregulation of CD69 by CD4 (top) and CD8 T-cells (bottom), and the upregulation of the costimulatory molecule CD86 on acDCs (middle) in the co-culture system from (a) in the presence and absence of MAGE as a stimulus for CD4 T-cells. Representative of >3 independent repeats. In all experiments, the cell ratio was 5:5:1 (CD4: CD8: acDC). (c) 1G4-expressing memory CD8 T-cells (magenta) co-cultured with acDCs loaded with 100 nM NY-ESO-9V (green). Cells form clusters around acDC in the presence of anti PD-1 blocking antibody Nivolumab (left) compared to less tight contacts in the isotype control (right). (d) The activation of the CD8 T-cells by upregulation of CD69, 41BB as well as cytotoxicity measured as the release of LDH following the killing of the target. In all experiments, the cell ratio was 10:1 (CD8: acDC). Scale bars = 10 μm.
Figure 5—figure supplement 1

PD1 blockade effects on cell motility and regulation.
(a) Motility speed of 1G4-expressing memory CD8 T-cells in co-culture with peptide loaded acDCs (100 nM NY-ESO-9V) in the presence and absence of Nivolumab. (b) Expression of PD1 (left) and PDL1 (right) after stimulation with peptide loaded acDCs using high (100 nM NY-ESO-9V) and low (100 nM NY-ESO-4D) affinity peptides.
Videos
Video 1
A time-lapse movie showing a gradual increase in the number of arrested cells on stimulatory spots presenting pMHC after some transient interaction events.
The image series is a composite overlay of DIC, Interference reflection (IRM) and fluorescence images of the cells and microcontact-printed biotinylated-FcIg (green) where cells form an IRM signal indicating spreading and durable interaction with the pMHC presented on stimulatory spots. Scale = Each circular spot is 10 μm in diameter.
Video 2
3D reconstruction of naïve CD8 (magenta), naïve CD4 (cyan) T-cells, and dendritic cells (green) moving in a 3D collagen gel with RPMI containing human serum and exogenous human CXCL12.
Video 3
3D reconstruction of 1G4-expressing naïve CD8 T-cells (magenta), interacting with antigen loaded acDCs (100 nM NY-ESO-9V, green) in 3D collagen in the presence of CCL19.
Note the transition of cells between different DCs.
Video 4
3D reconstruction of 1G4-expressing naïve CD8 T-cells (magenta), interacting with antigen-loaded acDCs (100 nM NY-ESO-9V, green) in a 3D collagen in the presence of CXCL12.
Note the intermittent contacts and disengagement of T-cells before re-engaging with a different DC.
Video 5
3D reconstruction of 1G4-expressing naïve CD8 T-cells (magenta) interacting with 100 nM NY-ESO-9V loaded acDC (green) in the presence of irrelevant CD4 T-cells (cyan) and a soluble anti-CD69 (cyan).
Following conjugate formation, upregulation of CD69 is observed by an accumulation of the antibody (cyan ring) around the CD8 T-cells (magenta).
Video 6
Maximum projection of 3D time-lapse of 1G4-expressing naïve CD8 T-cells (magenta), loaded with calcium dye Fluo4-AM (green), interacting with antigen loaded acDCs (100 nM NY-ESO-9V, cyan) in a 3D collagen and fluxing calcium (green) upon TCR/pMHC engagement.
Video 7
Maximum projection of 3D time-lapse of 1G4-expressing naïve CD8 T-cells (magenta), interacting with acDCs (100 nM NY-ESO-9V, green).
Video 8
Maximum projection of 3D time-lapse of 1G4-expressing naïve CD8 T-cells (magenta), interacting with antigen loaded acDC (100 nM NY-ESO-9L, green).
Video 9
Maximum projection of 3D time-lapse of 1G4-expressing naïve CD8 T-cells (magenta), interacting with unloaded acDC.
Video 10
3D reconstruction of 1G4-expressing naïve CD8 T-cells (magenta), interacting with antigen-loaded acDCs (100 nM NY-ESO-6T, green).
Video 11
3D reconstruction of 1G4-expressing naïve CD8 T-cells (magenta), interacting with initially unloaded acDCs (green), where the peptide was later added after collagen polymerisation to a final concentration of 100 nM NY-ESO-6T.
Video 12
3D reconstruction of 1G4-expressing naïve CD8 T-cells (magenta), 6F9-expressing naïve CD4 T-cells (cyan) interacting with antigen loaded DCs (100 nM NY-ESO-6T and 10 μM MAGE-A3243-258, green).
Tables
Table 1
Sequence modification of MHC-I restricted TCRs.
| TCR chain | Original sequence | Modified sequence |
|---|---|---|
| Alpha | DKVL | DKVL |
| Beta | GVTD | GVTD |
Table 2
Sequence alignment of human and mouse constant region used to modify MHC-II restricted TCRs
| TCR chain | Sequence alignment | ||
|---|---|---|---|
| Alpha | Human | QNYQSSSSTSQTNSQSSYTDTSSNS | 60 |
| Mouse | QNYQQSTTSQNTSTTTSSN | 60 | |
| ****:******:*.:*.*.::********* **.:: :*..:*********::** ***. | |||
| Human | SNSNNNSTSSSSTTNNQNS | 120 | |
| Mouse | SNQTSTQ----TNTYSSTTSTNNQNS | 116 | |
| *:****::.*:* : *: :: :**.: .**..*.******* *********:*:* | |||
| Human | NTSS | 140 | |
| Mouse | NTSS | 136 | |
| ******************** | |||
| Beta | Human | NSSHTQTTHSNHSSTQ | 60 |
| Mouse | NTSSNQTHSNHSSTQ | 60 | |
| **.:* **:*::****:***::.********* *************************** | |||
| Human | QNSYSSSTQNNHQQYSNTQTQ | 120 | |
| Mouse | Y----SNYSYSSSTHNNHQQHSSTQN | 116 | |
| . ** .: **************:************:****:*:*.:. .***** : | |||
| Human | STSSYQQSTYTYS | 176 | |
| Mouse | STSSYQQSTYTYSTNS | 172 | |
| ***********:**.****************************:**:*******: | |||
| Polar Transmembrane segments are underlined. The alignments were generated using ClustalW | |||
Table 3
Average speeds for the plots in the figures.
| Figure | Condition | Avg. speed [μm/min] ± S.D |
|---|---|---|
| Figure 4A | nCD8 no chemokine | 6.41 ± 2.63 |
| nCD4 no chemokine | 7.02 ± 3.08 | |
| DC no chemokine | 1.01 ± 0.75 | |
| nCD8 CCL19 | 7.83 ± 3.17 | |
| nCD4 CCL19 | 8.7 ± 2.70 | |
| DC CCL19 | 0.99 ± 0.80 | |
| nCD8 CCL21 | 8.07 ± 3.44 | |
| nCD4 CCL21 | 9.38 ± 3.29 | |
| DC CCL21 | 0.97 ± 0.55 | |
| nCD8 CXCL12 | 8.15 ± 2.11 | |
| nCD4 CXCL12 | 8.77 ± 3.02 | |
| DC CXCL12 | 1.16 ± 0.82 | |
| Figure 4D | null | 12.13 ± 2.88 |
| 9V | 3.88 ± 3.82 | |
| 9L | 12.16 ± 2.81 | |
| Figure 2—figure supplement 5A | Spots | 6.45 ± 1.50 |
| Figure 4—figure supplement 1A | No chemokine | 1.94 ± 1.80 |
| CCL19 | 3.466 ± 3.82 | |
| CCL21 | 4.01 ± 2.14 | |
| CXCL12 | 9.27 ± 2.48 | |
| Figure 4—figure supplement 1B | Bovine Collagen I | 7.55 ± 3.48 |
| Human Collagen I | 7.76 ± 3.10 | |
| Complete Collagen I | 5.94 ± 3.63 | |
| Matrigel | 8.89 ± 3.90 | |
| GelTrex | 7.88 ± 4.00 | |
| Figure 4—figure supplement 1C | Naïve BTX | 10.73 ± 2.96 |
| Naïve Amaxa U-14 | 8.00 ± 3.80 | |
| Naïve Amaxa T-23 | 6.83 ± 3.85 | |
| Naïve Neon | 9.52 ± 2.20 | |
| Memory BTX | 6.177 ± 2.76 | |
| Memory Amaxa U-14 | 3.391 ± 2.36 | |
| Memory Amaxa T-23 | 2.25 ± 1.89 | |
| Memory Neon | 7.53 ± 4.61 |
Additional files
Download links
A two-part list of links to download the article, or parts of the article, in various formats.
Downloads (link to download the article as PDF)
Open citations (links to open the citations from this article in various online reference manager services)
Cite this article (links to download the citations from this article in formats compatible with various reference manager tools)
A tissue-like platform for studying engineered quiescent human T-cells’ interactions with dendritic cells
eLife 8:e48221.
https://doi.org/10.7554/eLife.48221


