Lmx1b is required at multiple stages to build expansive serotonergic axon architectures
- School of Medicine, Case Western Reserve University, United States
Figures
Figure 1 with 2 supplements
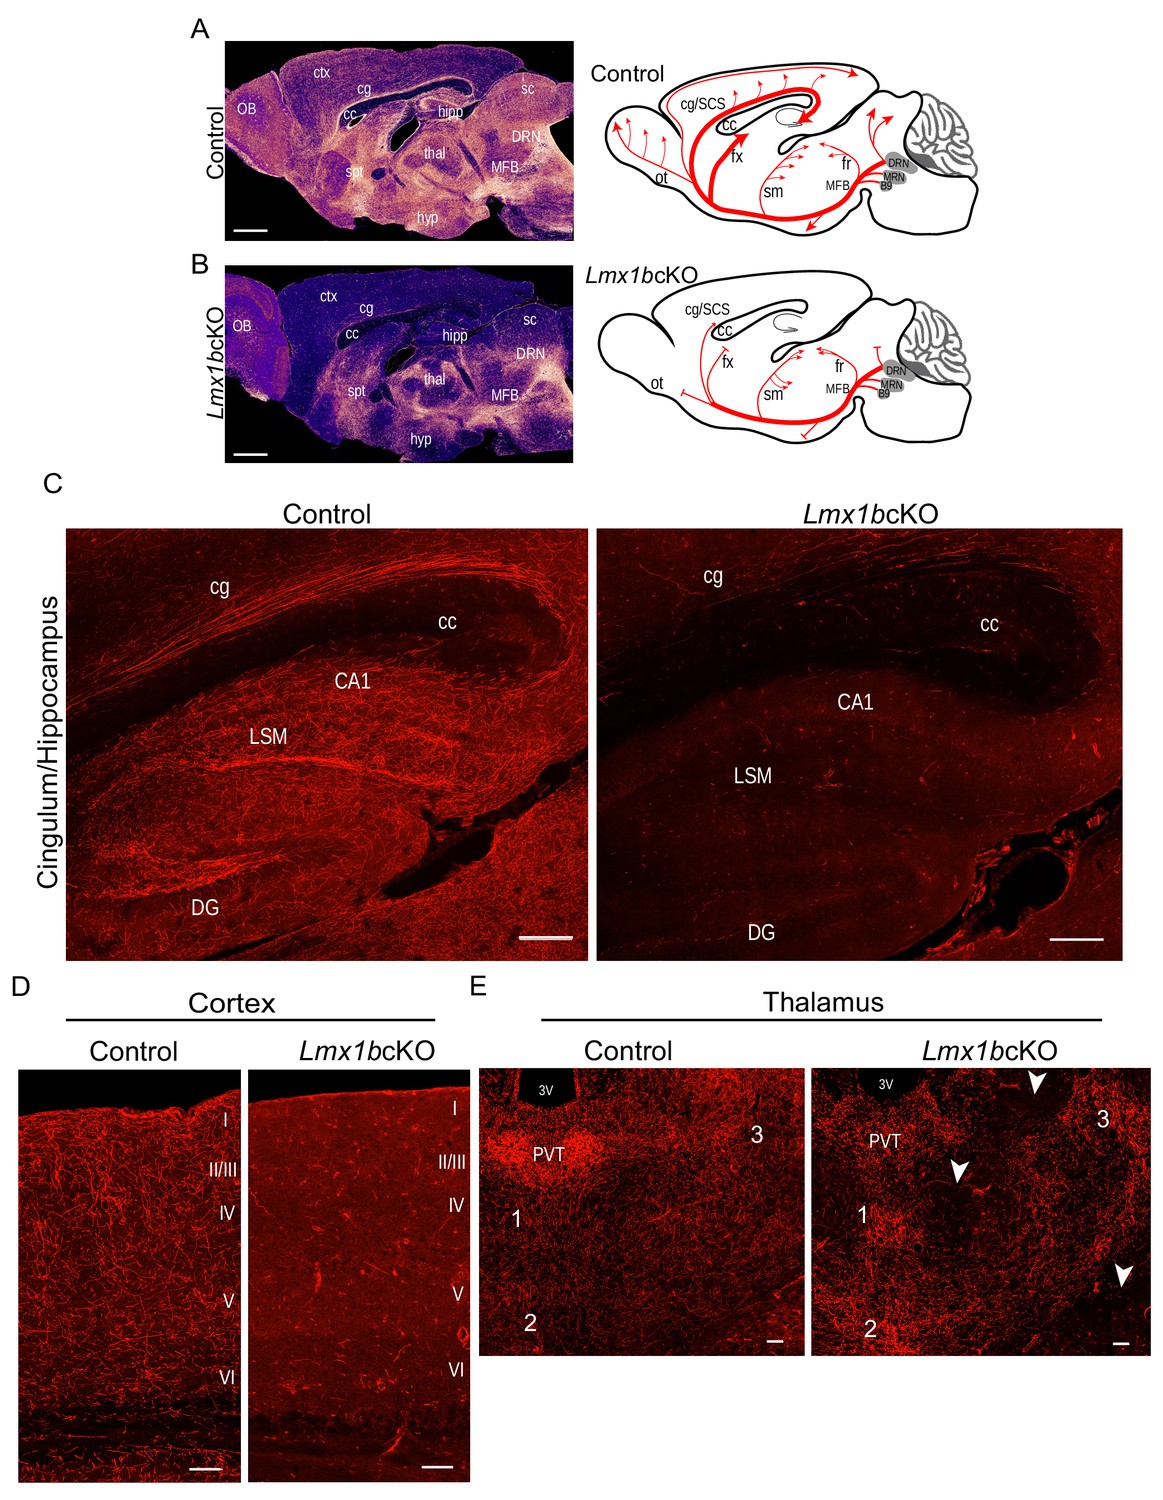
Lmx1b is required for the formation of ascending 5-HT axon projection pathways.
(A, B) Ascending 5-HT axonal projection system immunolabeled using an anti-RFP antibody to TdTomato in whole sagittal forebrain sections of 3 month old mice displayed by heatmap. Lmx1bcKO TdTomato+ axons were nearly absent in numerous brain regions (B) compared to controls (A) (n = 6, controls; n = 7, Lmx1bcKO adult mice). Right, schematics depicting 5-HT axon trajectories in Lmx1bcKO vs. control brains. Scale bars, 1000 µm. OB, olfactory bulb; ctx, cortex; cg, cingulum; cc, corpus callosum; hipp, hippocampus; spt, septum; hyp, hypothalamus; thal, thalamus; sc, superior colliculus; MFB, medial forebrain bundle; DRN, dorsal raphe nucleus. Schematic (right): ot, olfactory tract; cg/SCS, cingulum/supracallosal stria; fx, fornix; sm, stria medularis; fr, fasciculus retroflexus. (C) Confocal images of TdTomato+ axons in sagittal sections. Lmx1bcKO axons failed to fill cingulum bundles or innervate the hippocampus. Scale bars, 200 µm. cg, cingulum; cc, corpus callosum; LSM, lacunosum moleculare; DG, dentate gyrus; CA1 of hippocampus. (D) Coronal sections of cortex show near complete lack of Lmx1bcKO TdTomato+ axons Scale bars, 50 µm. (E) Coronal view of altered patterns of TdTomato+ axons in Lmx1bcKO thalamus. Arrowheads indicate areas devoid of axons in Lmx1bcKO thalamus. Numbers correspond to areas of axon clumping in Lmx1bcKO thalamus. See Figure 1—figure supplement 2 for high magnification images. Scale bars, 100 µm. PVT, paraventricular nucleus of the thalamus; 3V, third ventricle.
Figure 1—figure supplement 1
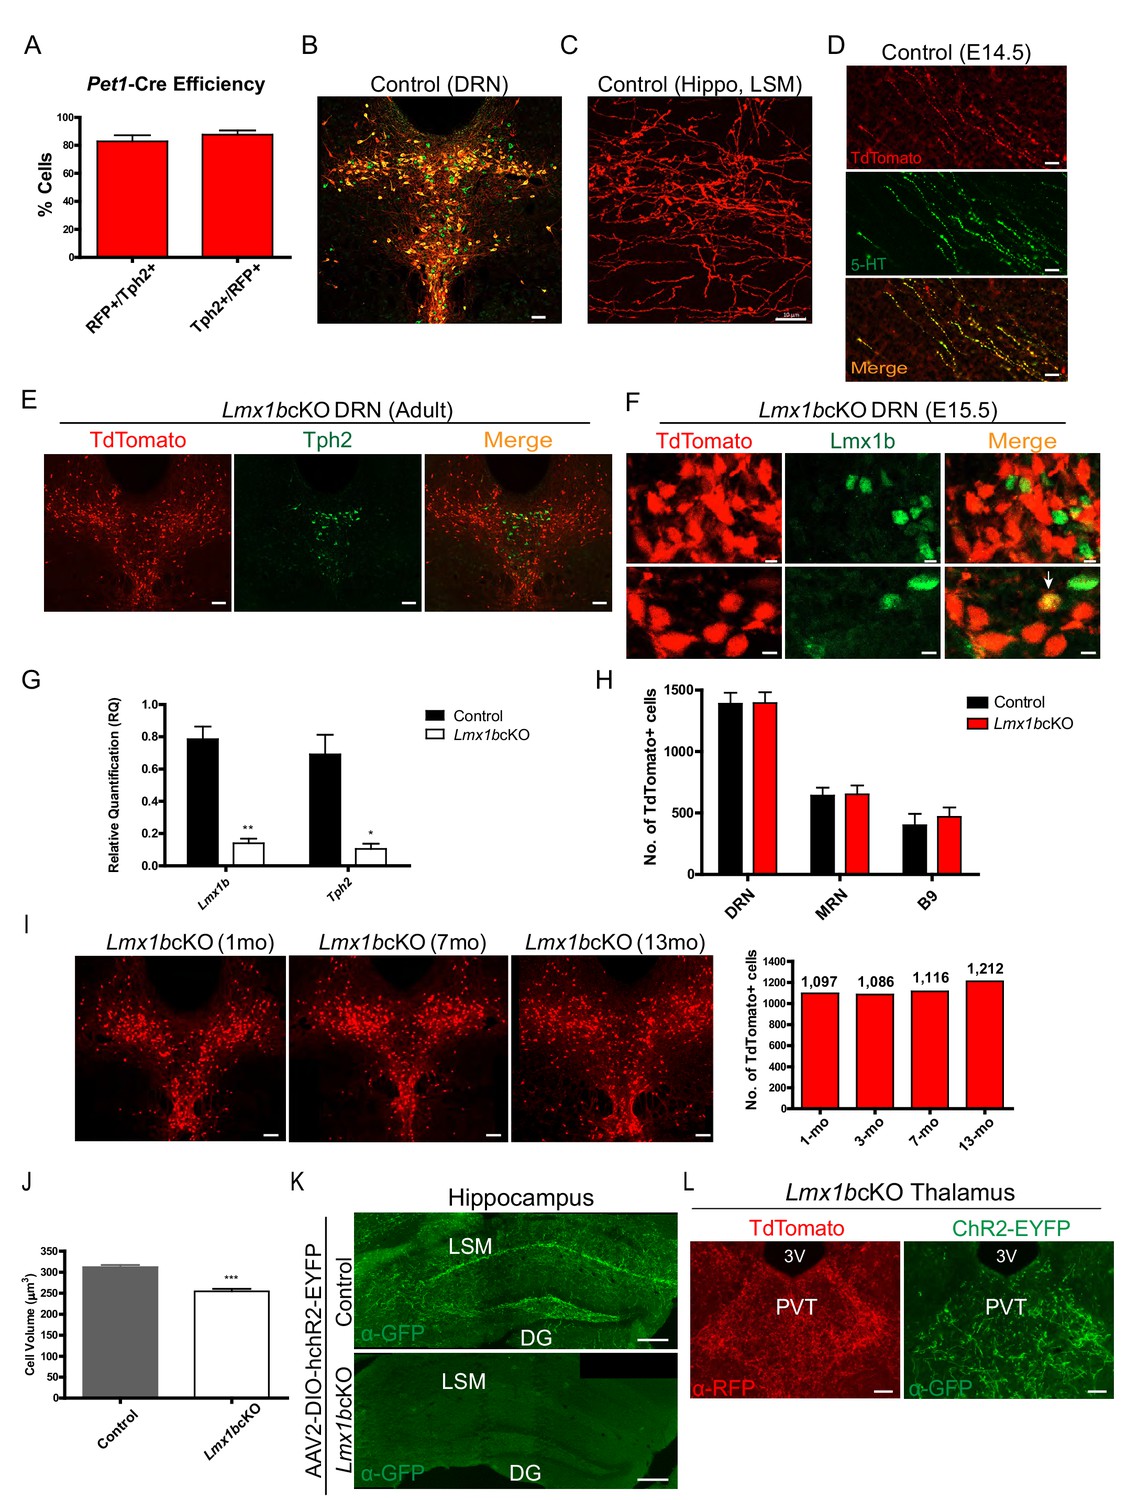
Surrogate marking of 5-HT cell bodies and axons and Lmx1b conditional targeting.
(A) Pet1-Cre efficiency: 82% Tph2+ cells expressed TdTomato+ (RFP+/Tph2+) and 88% of TdTomato+ cells expressed Tph2 (Tph2+/RFP+) (n = 2 control mice). Data are represented as mean ± SEM. (B) TdTomato+ cells co-labeled with serotonergic marker Tph2 in the DRN. Immunofluorescence of Tph2 (green) and TdTomato (red). Scale bars, 100 µm. (C) TdTomato+ axons were found throughout the adult brain. Lacunosum moleculare layer (LSM) of hippocampus shown here. Scale bars, 10 µm. (D) Co-immunolabeled axons at embryonic day (E) 14 with anti-5-HT and anti-RFP antibodies. Scale bars, 20 µm. (E) A majority of TdTomato+ Lmx1bcKO mutant cells did not co-localize with Tph2 (n = 6, control; n = 7, Lmx1bcKO; 2.5–3.5 month old mice). Scale bars, 100 µm. (F) A majority of TdTomato+ Lmx1bcKO mutant cells did not co-localize with Lmx1b protein (E15.5 shown). A small number of cells were TdTomato+ and Lmx1b+ (bottom row, arrow). Scale bars, 5 µm. (G) RT-qPCR of Lmx1b and Tph2 in flow sorted YFP+ cells from control and Lmx1bcKO E17.5 embryos (n = 4, control; n = 4, Lmx1bcKO embryos). Unpaired t-test with Welch's correction, *p<0.05, **p<0.001, and ***p<0.0001. Data are represented as mean ± SEM. (H) Counts of TdTomato+ cells in Lmx1bcKO mice did not differ from controls. Every 4th section counted throughout DRN/MRN/B9 raphe nuclei (n = 3 mice/genotype). Data are represented as mean ± SEM. (I) Lmx1bcKO cell bodies survive at least up to 13 months. Counts of TdTomato+ neurons in 6 matched sections for each animal (right) (n=1 animal per time point; 1mo, 3mo, 7mo, 13mo). Scale bars, 100µm. (I) Lmx1bcKO cell bodies survive at least up to 13 months. Counts of TdTomato+ neurons in 6 matched sections for each animal (right) (n=1 animal per time point; 1mo, 3mo, 7mo, 13mo). Scale bars, 100µm. (J) Volume of Lmx1bcKO cell bodies were significantly smaller than controls (n = 587 control cells; n = 442 Lmx1bcKO cells). Unpaired t-test with Welch's correction, *p<0.05, **p<0.001, and ***p<0.0001. Data are represented as mean ± SEM. (K, L) Expression of a YFP tagged channel rhodopsin by AAV2 viral injection to DRN/MRN of Lmx1bcKO and control mice. No YFP expression was found in Lmx1bcKO hippocampus (K) while YFP-labeled axons co-localized with TdTomato in the Lmx1bcKO thalamus (L). Scale bars, 200 µm (K), 50 µm (L).
Figure 1—figure supplement 2
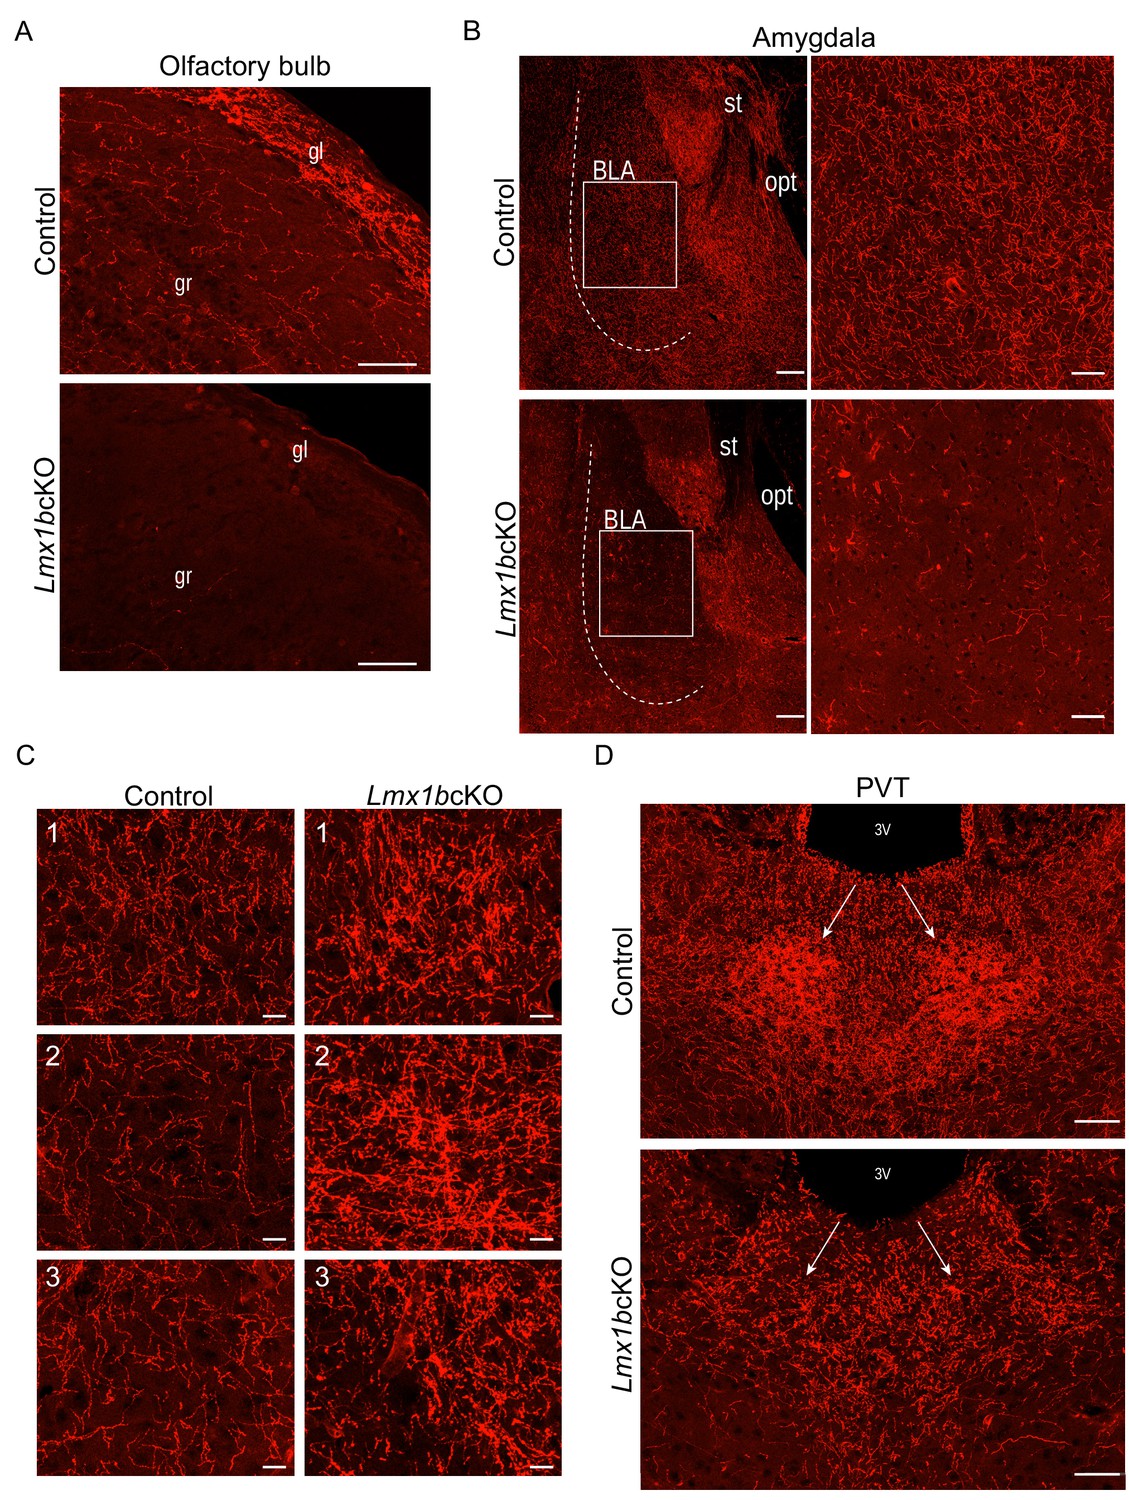
Lmx1b deficiency disrupts 5-HT axon patterns in the forebrain.
(A) Sagittal sections of olfactory bulb show near complete lack of Lmx1bcKO TdTomato+ axons. Scale bars, 50 µm. gl, glomerular layer; gr, granule layer. (B) TdTomato+ axons severely reduced throughout Lmx1bcKO amygdala compared to controls (BLA, shown right). Scale bars, 100 µm. BLA, basolateral amygdala; st, stria terminalis; opt, optic tract. (C) High magnification showing areas of clumping (correlate to numbers in Figure 1E) found in Lmx1bcKO thalamus compared to controls. Scale bars, 20 µm. (D) Lack of TdTomato+ axons in the PVT of Lmx1bcKO mice. Scale bars, 50 µm. 3V, third ventricle; PVT, paraventricular nucleus of the thalamus.
Figure 2 with 2 supplements
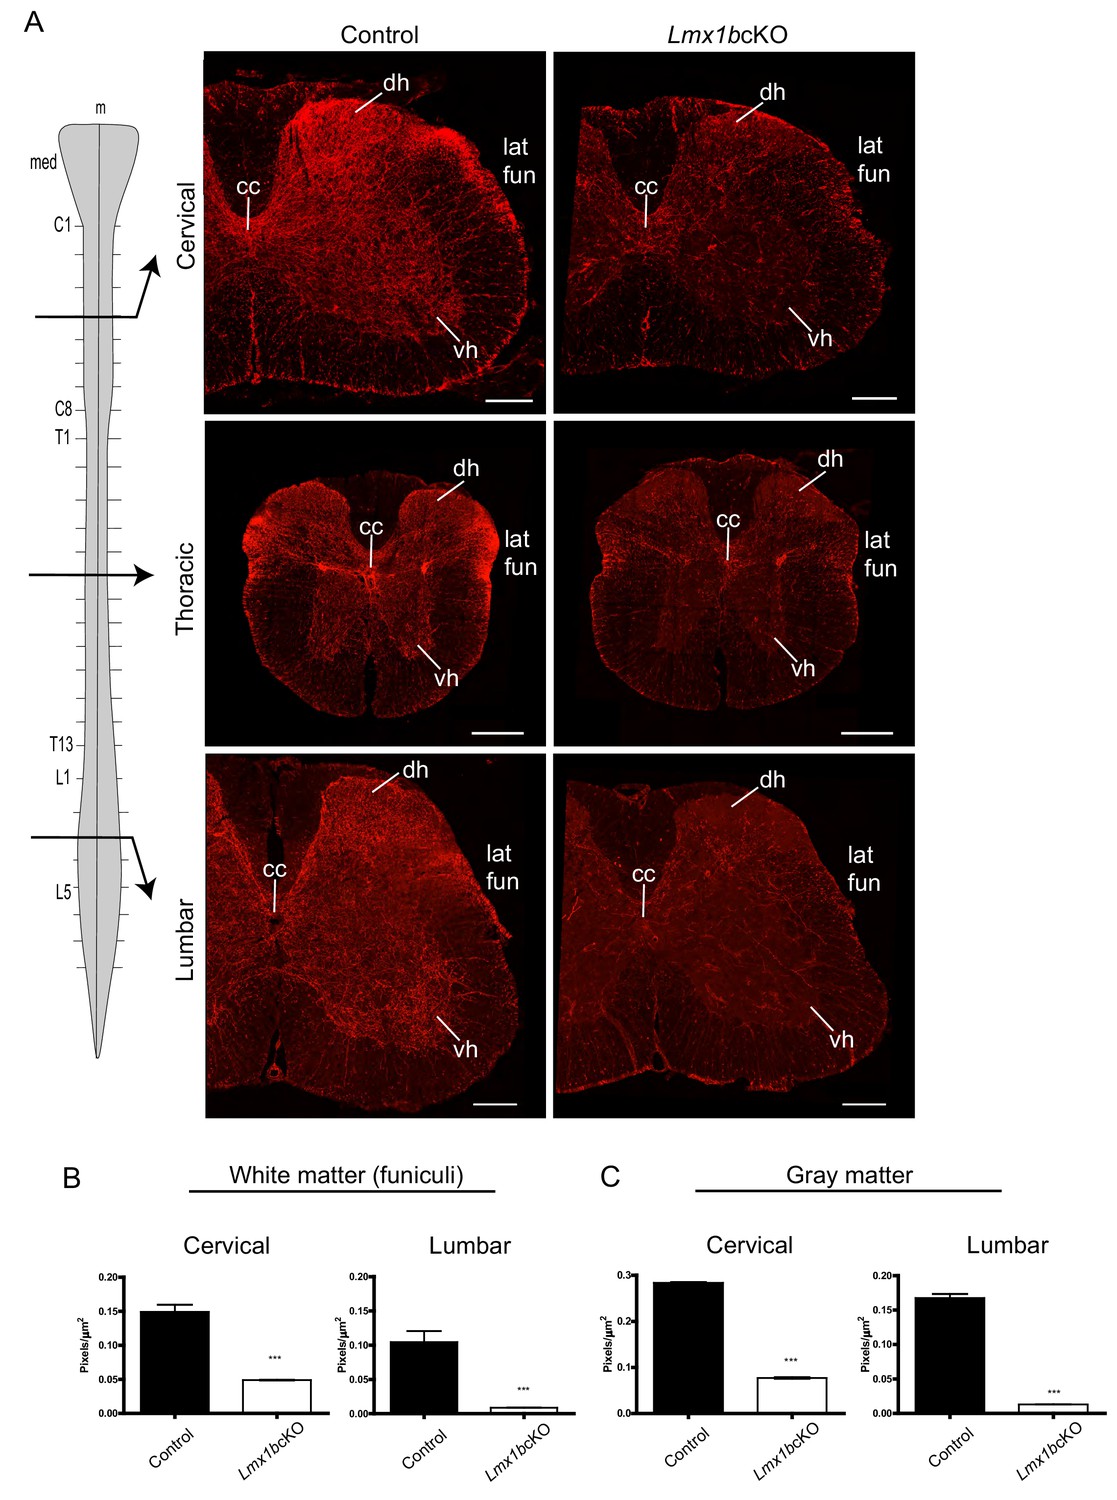
Lmx1b is required for the formation of descending 5-HT axon projection pathways.
(A) Coronal sections taken at cervical (C4), thoracic (T6), and lumbar (L3) levels of the spinal cord (diagram, left). Immunolabeling for TdTomato shows Lmx1bcKO axons were severely reduced at every level of the cord in both gray and white matter compared to controls. Scale bars, 200 µm. m, midline; med, medulla; cc, central canal; dh, dorsal horn; vh, ventral horn; lat fun, lateral funiculi. (B, C) Quantification of total TdTomato+ axons (pixels/µm2) in white (B) and gray (C) matter at cervical and lumbar levels (n = 3, control; n = 3 Lmx1bcKO mice). Two-way ANOVA with Welch’s correction, *p<0.05, **p<0.001, and ***p<0.0001. Data are represented as mean ± SEM.
Figure 2—figure supplement 1
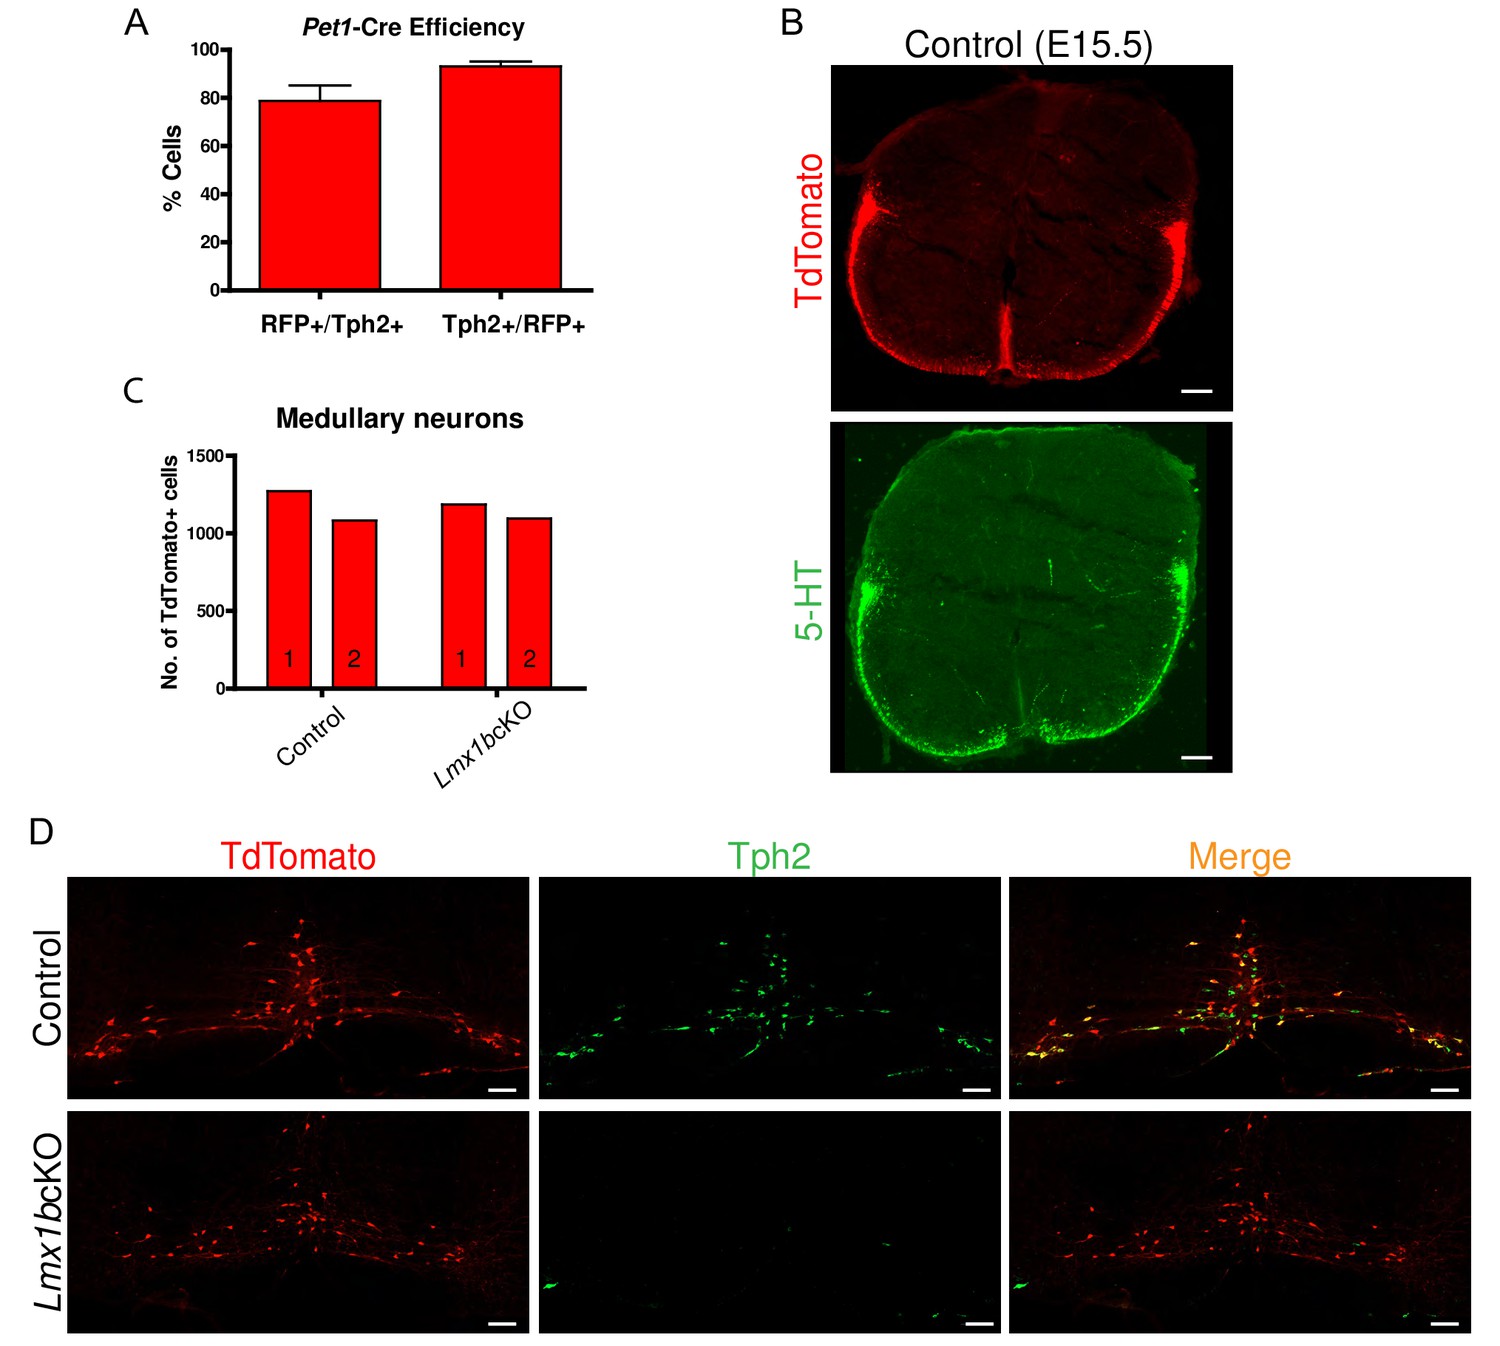
Conditional targeting of Lmx1b in the descending 5-HT projection pathway.
(A) Pet1-Cre efficiency: 80% of Tph2+ cells expressed TdTomato+ (RFP+/Tph2+); 92% of TdTomato+ cells expressed Tph2 (Tph2+/RFP+) in medullary nuclei (n = 2 control mice). Data are represented as mean ± SEM. (B) TdTomato+ axon patterns in funiculi of the developing spinal cord aligned with 5- HT labeled axon patterns at E15.5 in controls (coronal view). Scale bars, 100 µm. (C) Comparable numbers of TdTomato+ medullary cells in Lmx1bcKO and control mice (n = 2 mice/genotype). (D) Few Lmx1bcKO TdTomato+ cell bodies expressed Tph2, a downstream target of Lmx1b. Scale bars, 100 µm.
Figure 2—figure supplement 2
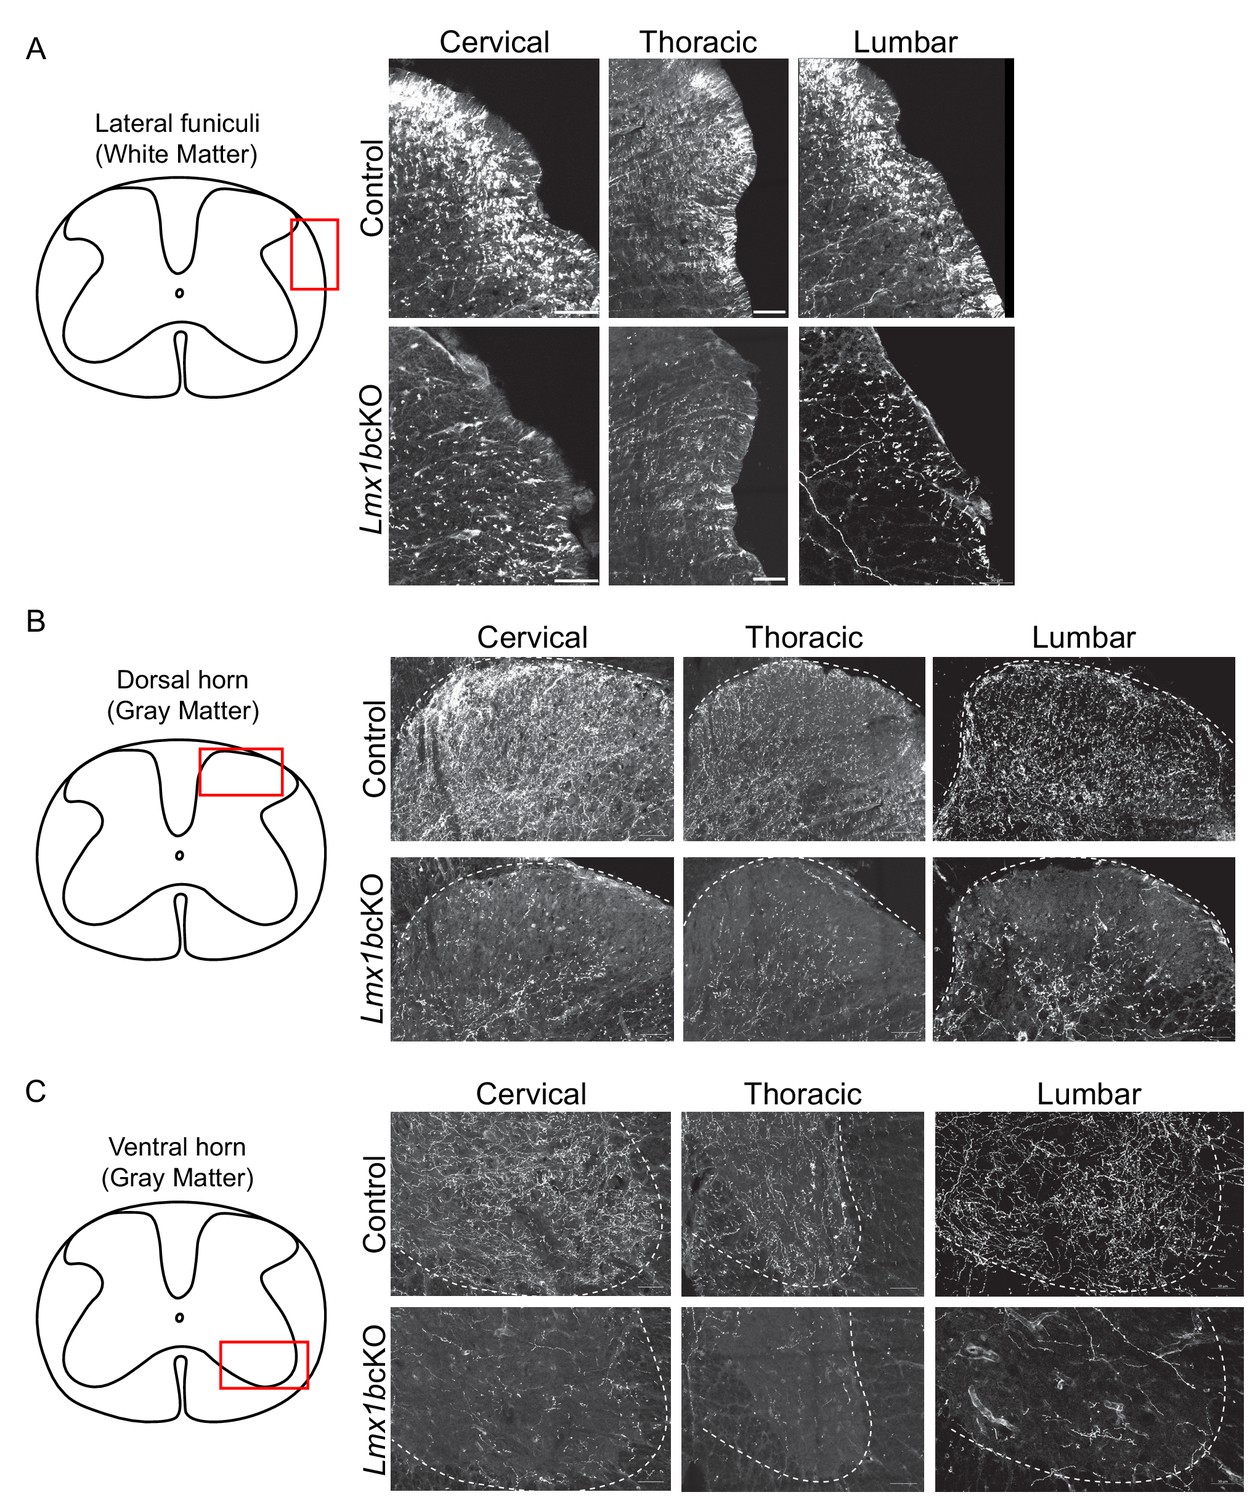
Progressive deficits of 5-HT axon fibers in Lmx1b deficient spinal cord white and gray matter.
(A-C) Coronal sections immunolabeled using an anti-RFP antibody to TdTomato. Lmx1bcKO TdTomato+ axon deficits in spinal cord white matter funiculi (A), gray matter dorsal (B), and ventral (C) horns. Red box in diagram outlines area imaged (right). (n = 3, control; n = 3 Lmx1bcKO mice). Scale bars, 50 µm.
Figure 3
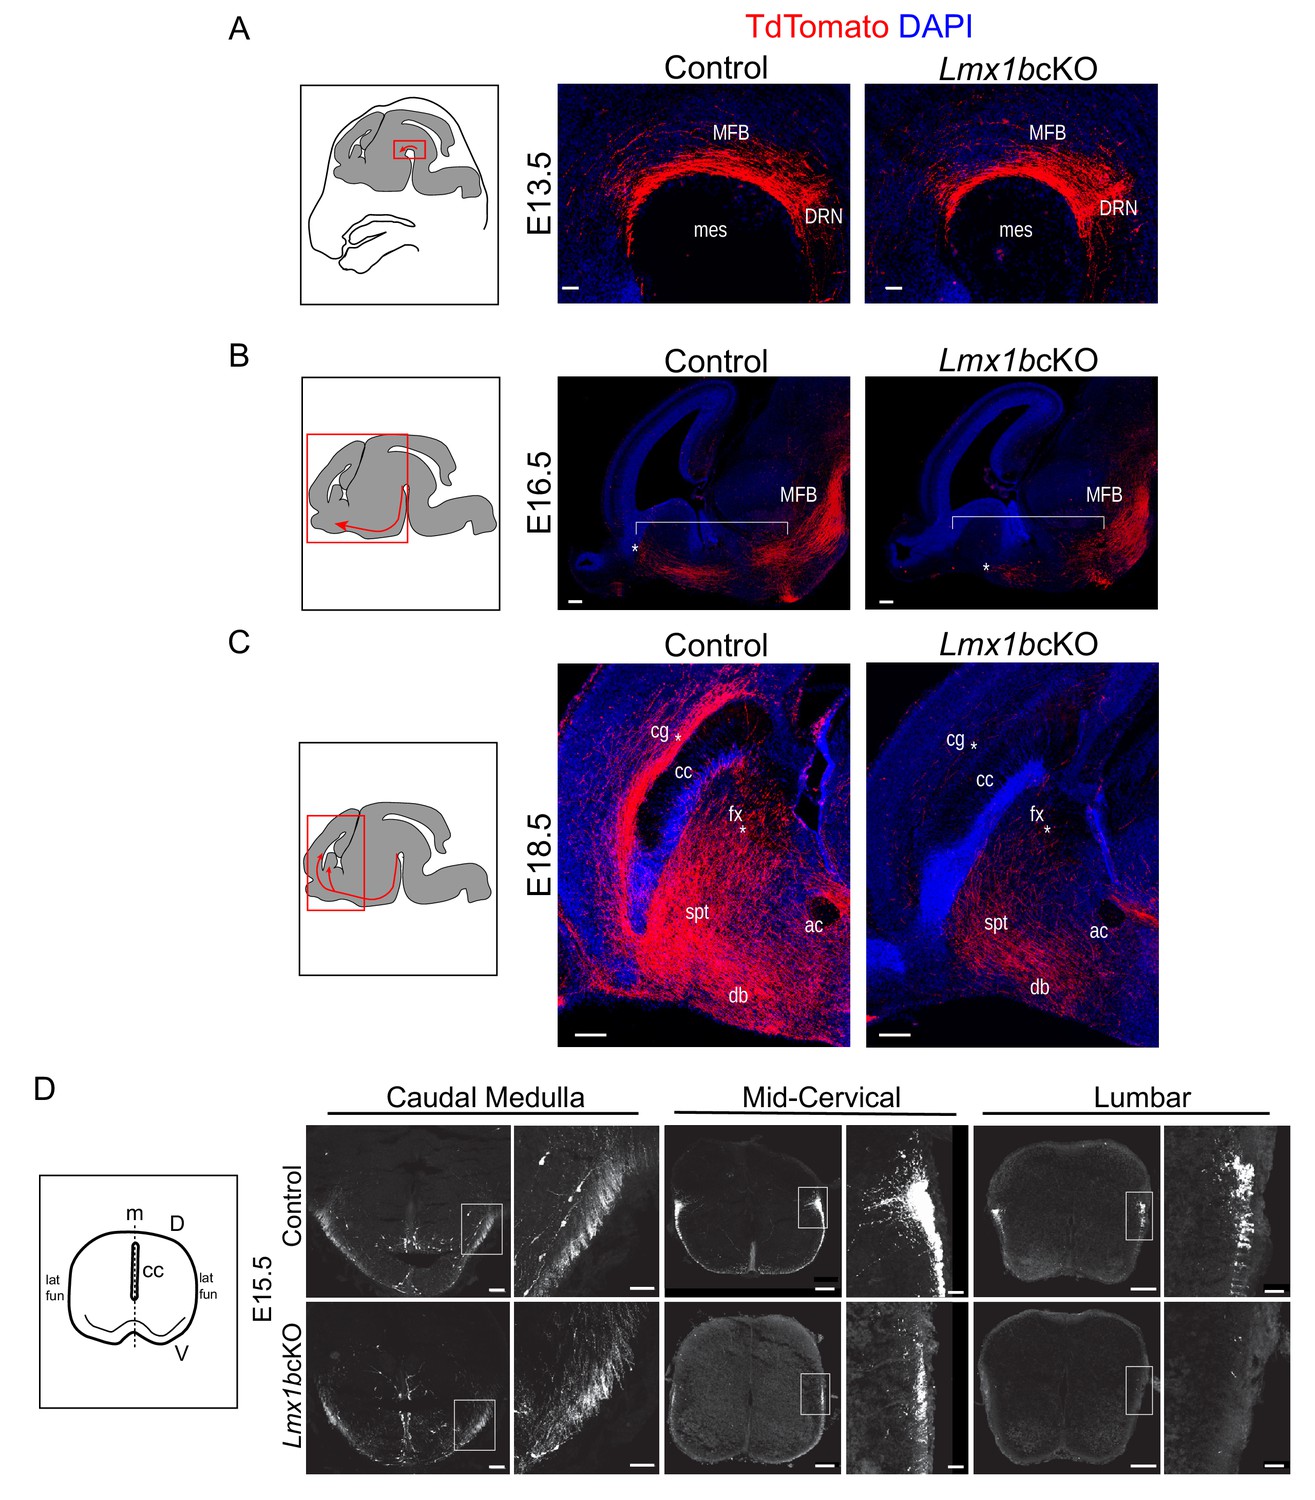
Initial axon outgrowth is delayed and selective pathway routing fails in Lmx1b deficient 5-HT neurons.
(A–C) Immunolabeled TdTomato+ ascending axons in sagittal slices at different embryonic stages. Diagrams (left) show area of image (red box) presented for each time point. Arrows indicate direction of growing axons. E13.5 Lmx1bcKO axons exhibited similar ascending trajectories and densities as controls (A). E16.5 Lmx1bcKO axons did not extend as far (asterisk) and were less abundant (under bracket) compared to control axons (B). E18.5 Lmx1bcKO axons failed to fill multiple axon tracts (cg, fx; asterisks) compared to controls (C). Scale bars, 50 µm (A), 200 µm (B,C). DRN, dorsal raphe nucleus; MFB, medial forebrain bundle; mes, mesencephalic flexure; cg, cingulum bundle; fx, fornix; ac, anterior commissure; spt, septum; db, diagonal band; cc, corpus callosum. (D) Diagram (left) depicting coronal section of an embryonic spinal cord. TdTomato+ descending axons at E15.5 in control vs Lmx1bcKO embryos. Lmx1bcKO axons exit caudal medulla similar to controls but were severely reduced in funiculi at lower levels of the cord (mid-cervical and lumbar). Boxed region of lateral funiculi enlarged to the right of each image. Scale bars, 100 µm (low magnification), 50 µm (high magnification-medulla), 20 µm (high magnification- cervical/lumbar insets). Lat fun, lateral funiculi; cc, central canal; m, midline; D, dorsal; V, ventral.
Figure 4 with 1 supplement
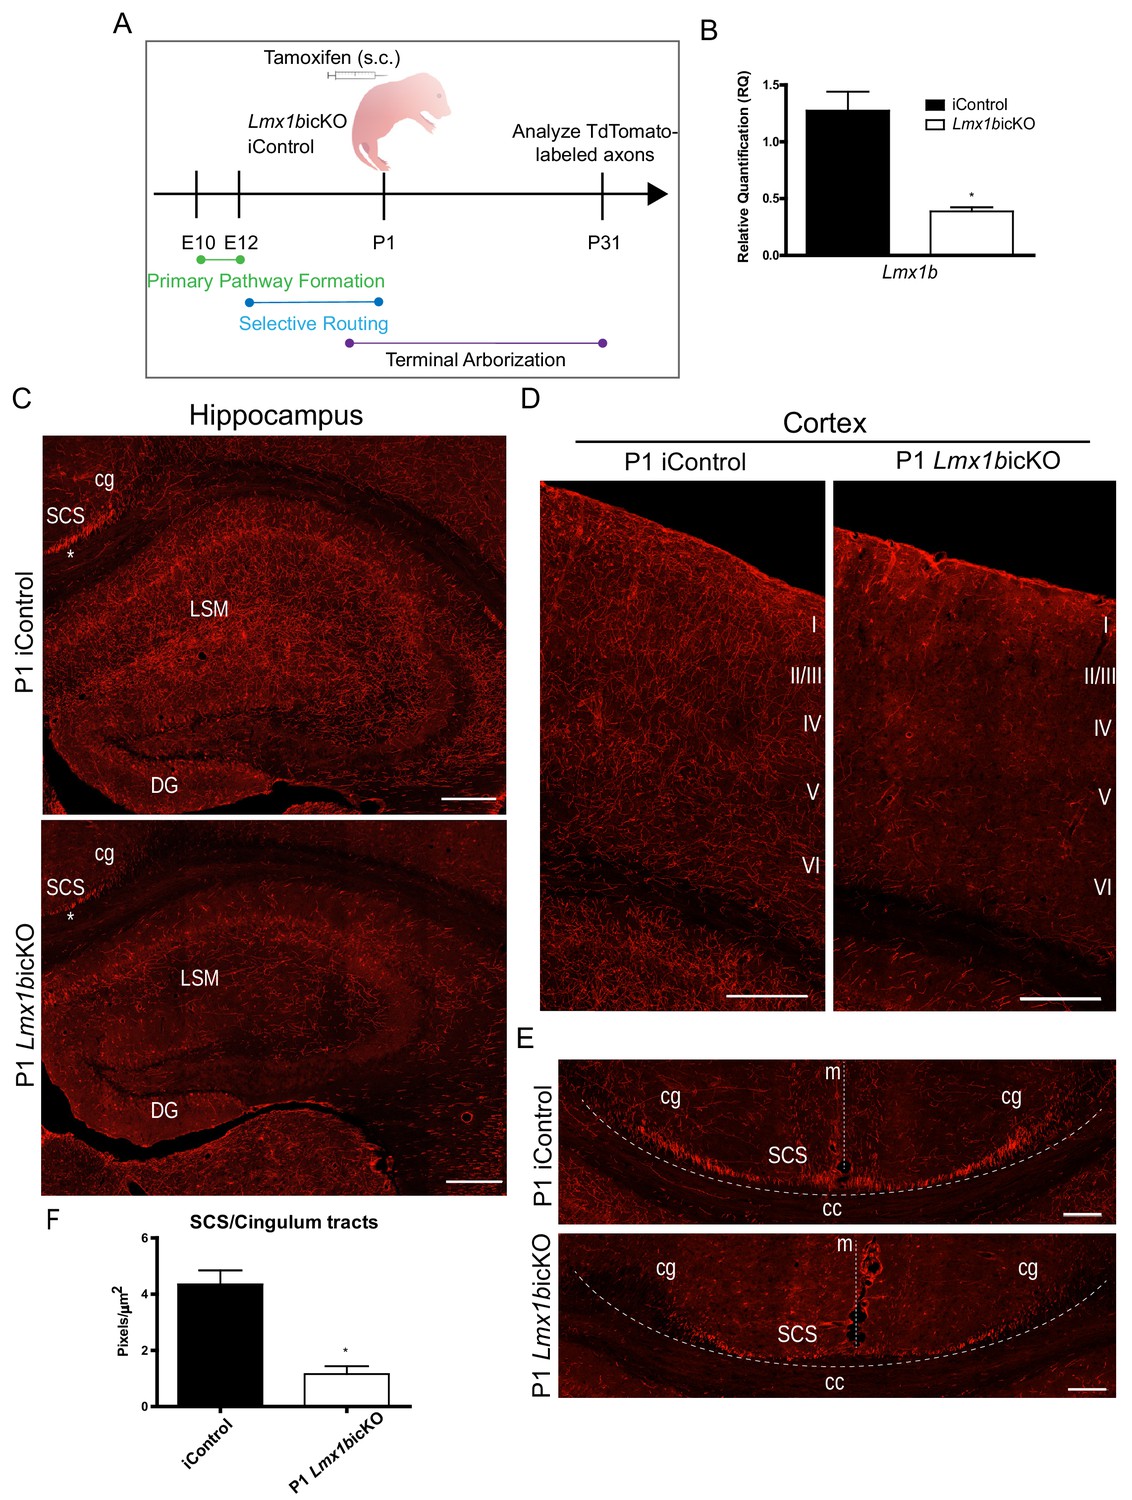
Lmx1b is temporally required for 5-HT projection pathway formation.
(A) Schematic of tamoxifen-inducible approach to target Lmx1b at postnatal day (P)1. (B) RT-qPCR of flow sorted TdTomato+ neurons from postnatal targeted mice (n = 3, iControl; n = 4, Lmx1bicKO mice). Unpaired t-test with Welch's correction, *p<0.05. Data are represented as mean ± SEM. (C) Coronal sections of P1 targeted Lmx1bicKO hippocampus compared to iControls analyzed at P31. *, incomplete formation of SCS and cingulum in P1 targeted Lmx1bicKO brain. Scale bars, 200 µm. (D) Coronal sections of P1 targeted Lmx1bicKO cortex compared to iControls analyzed at P31. Scale bars, 200 µm. (E) Coronal sections at level of corpus callosum showing incomplete formation of major 5-HT axon routes, SCS and cingulum, in P1 targeted Lmx1bicKO forebrain compared to iControls (above dotted line). Scale bars, 100 µm. cg, cingulum; SCS, supracallosal stria; cc, corpus callosum; m, midline. (F) Quantification of axons within SCS and cingulum tracts (n = 3, iControl; n = 3, Lmx1bicKO mice). Unpaired t-test with Welch's correction, p=0.0112. Data are represented as mean ± SEM.
Figure 4—figure supplement 1
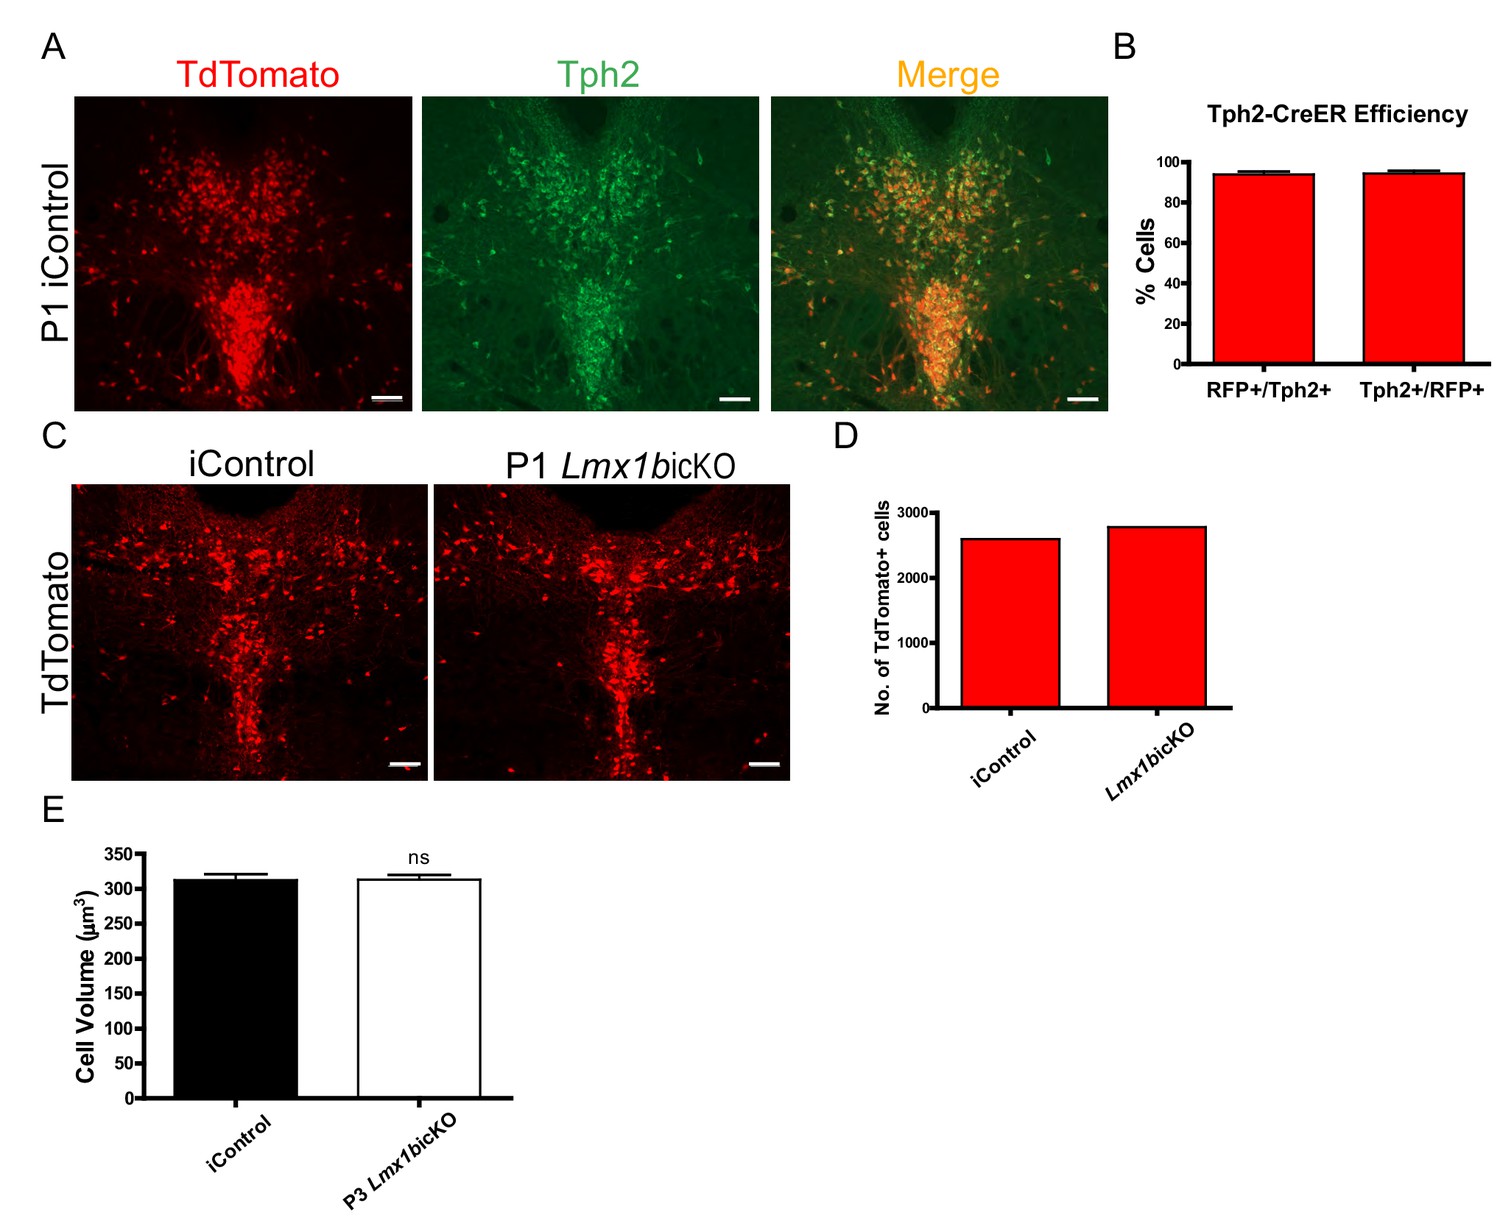
Efficiency of postnatal tamoxifen inducible targeting of Lmx1b.
(A) TdTomato+ cells co- localized with serotonergic marker Tph2 in the DRN of iControl mice. Scale bars, 100 µm. (B) Tph2-CreER efficiency: 94% of TdTomato+ cells expressed Tph2 (Tph2+/RFP+) and 94% of Tph2+ cells expressed TdTomato+ (RFP+/Tph2+) in DRN/MRN/B9 nuclei (n = 4, iControl mice). Data are represented as mean ± SEM. (C) DRN of P1 targeted Lmx1bicKO and iControl mice. Scale bars, 100 µm. (D) Cell counts confirmed comparable numbers of TdTomato+ cells in Lmx1bicKO and iControl mice. (E) Normal cell body volume in postnatal targeted Lmx1bicKO mice (n = 464, control cells; n = 651, P3 Lmx1bicKO cells; p=0.9353). Unpaired t-test with Welch's correction. Data are represented as mean ± SEM.
Figure 5 with 1 supplement
Lmx1b temporally controls postnatal 5-HT terminal arborization.
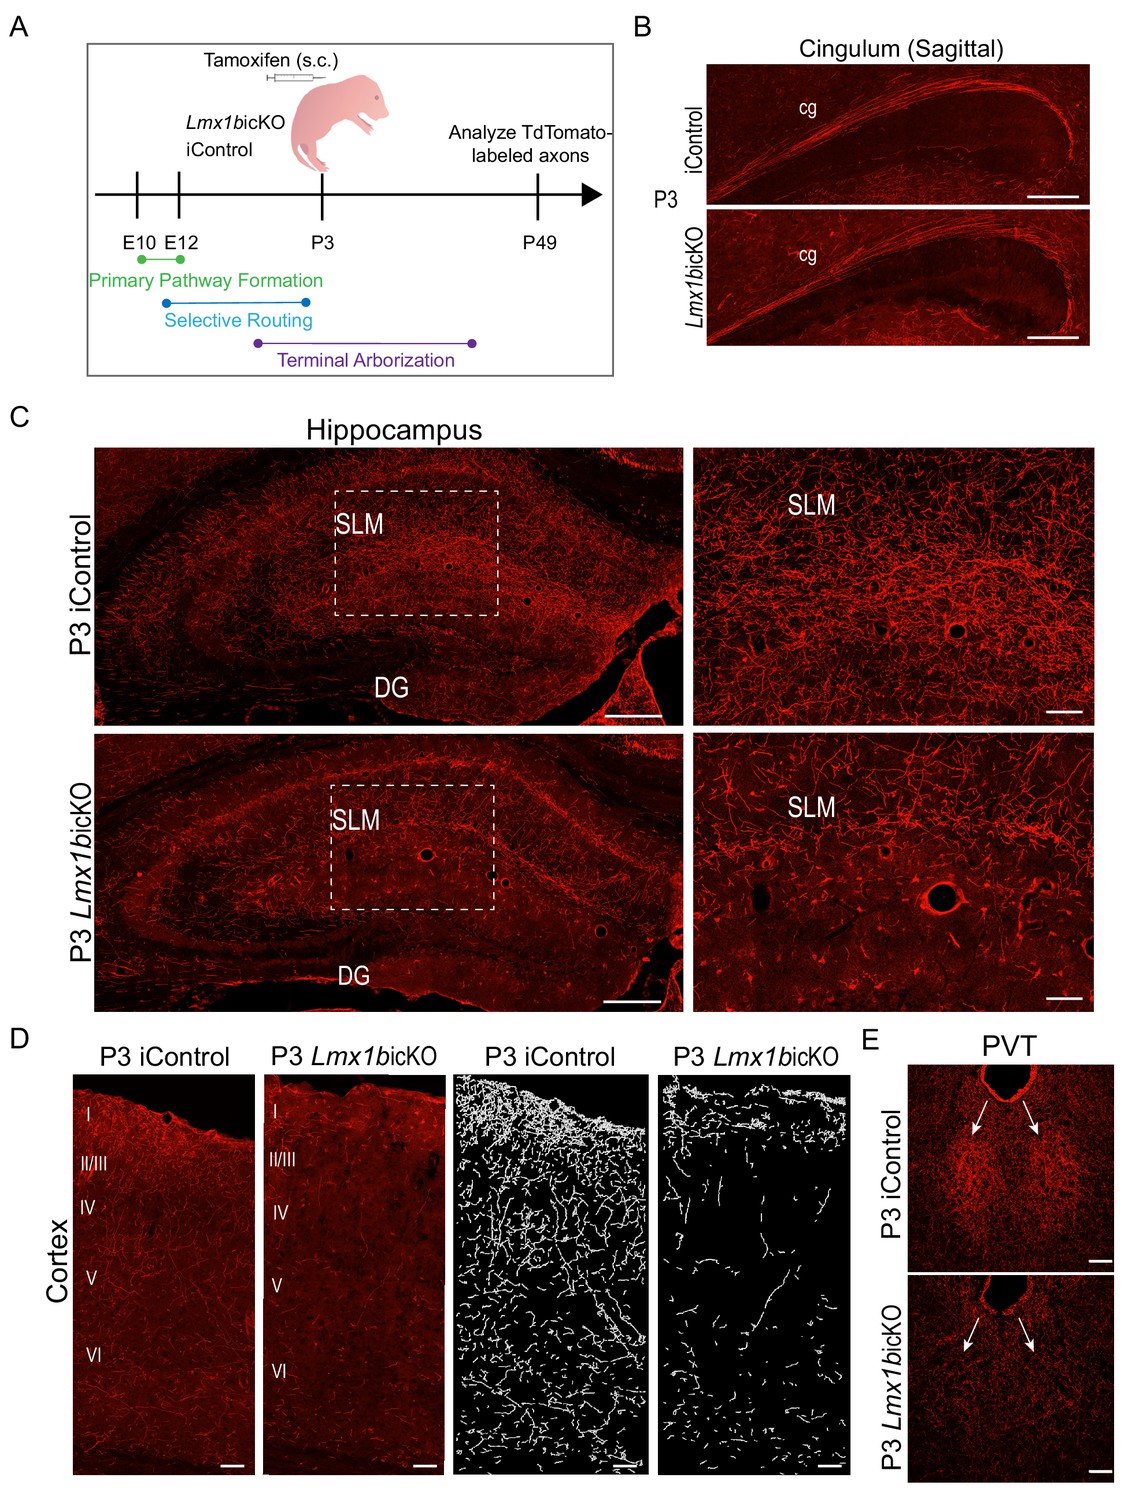
(A) Schematic of tamoxifen inducible targeting of Lmx1b at postnatal day (P)3. (B) Sagittal view of cingulum shows fully formed long-range axon routes in P3 targeted Lmx1bicKO mice compared to iControls. Scale bars, 200 µm. (C) Coronal sections of hippocampus in P3 targeted Lmx1bicKO mice compared to iControls. Dashed boxed region: higher magnification image at right highlighting reduced TdTomato+ axons in Lmx1bicKO SLM. Scale bars, 200 µm (low magnification), 50 µm (high magnification). SLM, stratum lacunosum moleculare; DG, dentate gyrus. (D) Coronal sections of cortex of P3 targeted Lmx1bicKO mice compared to iControls. Imaris tracing; right panels. Scale bars, 100 µm. (E) Decreased TdTomato+ arbors detected in P3 targeted Lmx1bicKO PVT compared to iControls (arrows). Scale bars, 50 µm.
Figure 5—figure supplement 1
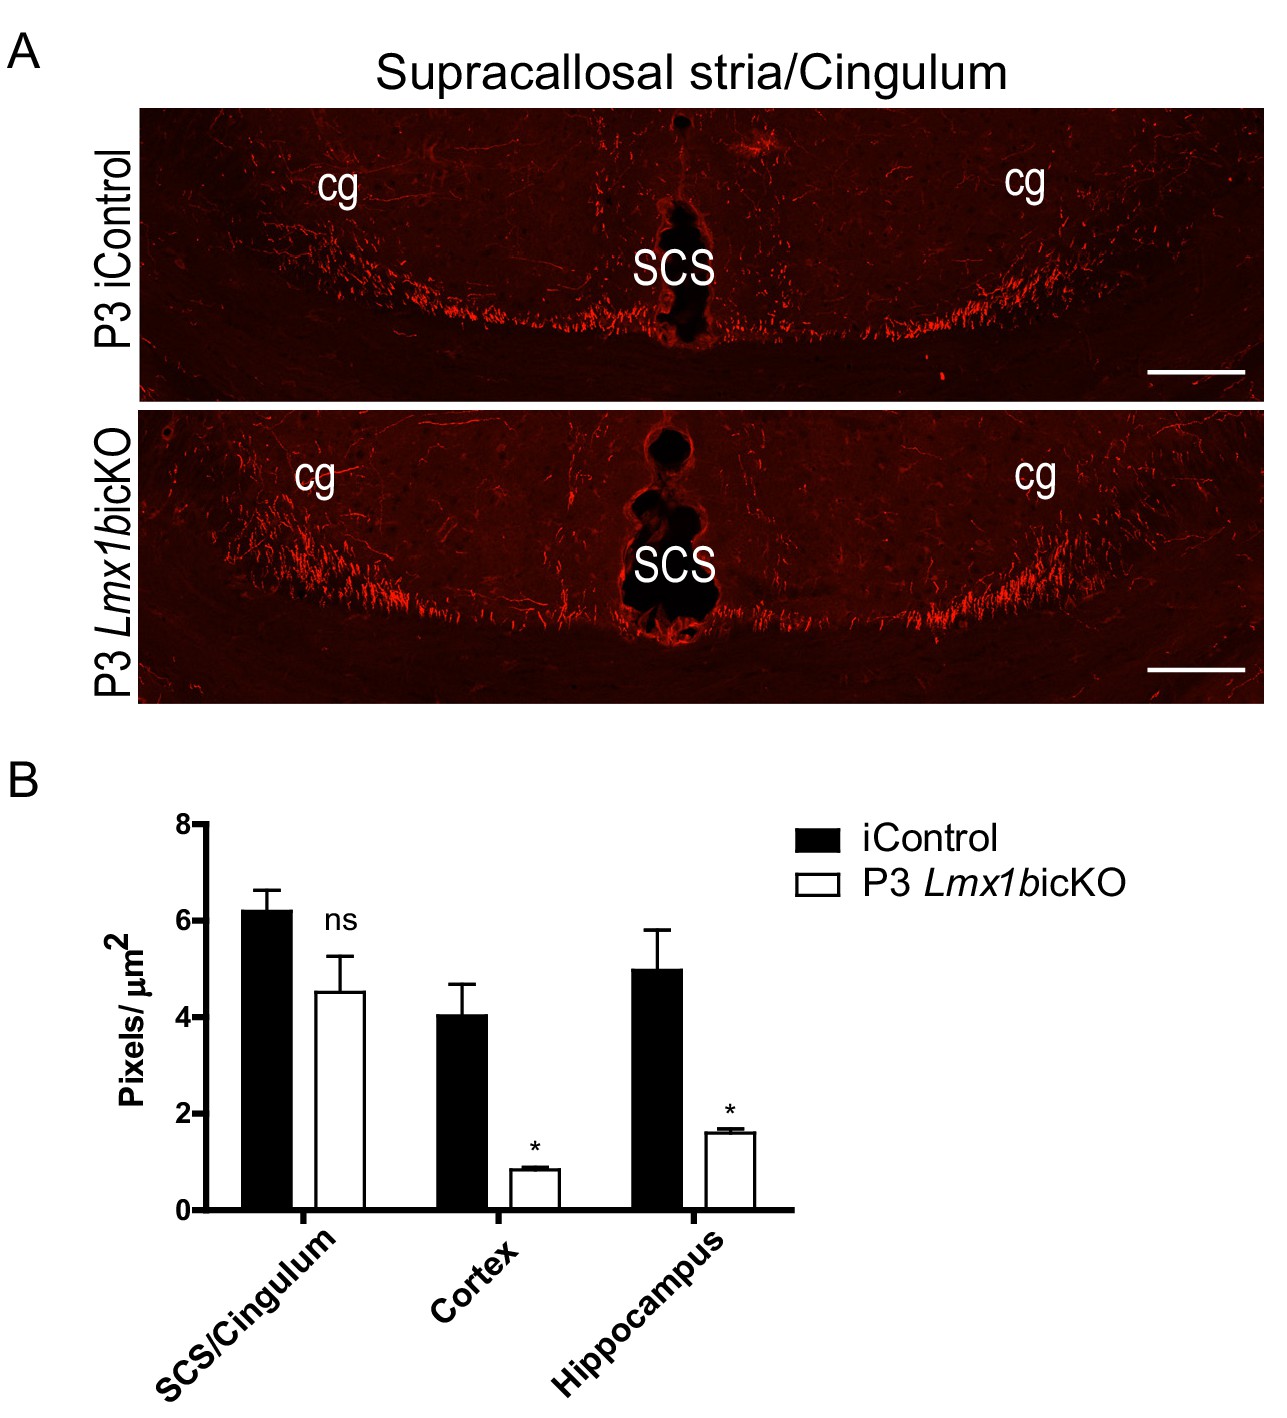
P3 targeted Lmx1bicKO mice display normal 5-HT axon routing but decreased 5-HT terminal arbors.
(A) Coronal view of SCS and cingulum demonstrating complete formation of long-range axon routes in P3 targeted Lmx1bicKO mice compared to iControls. Scale bars, 100 µm. (B) Quantification of axons within SCS and cingulum tracts, cortex, and hippocampus of postnatal targeted P3 iControls and P3 Lmx1bicKO mice (n = 3, iControl; n = 3, Lmx1bicKO mice). Unpaired t-test with Welch's correction; axon tracts, p=0.1474; cortex, p=0.04; hippocampus, p=0.0277. Data are represented as mean ± SEM.
Figure 6
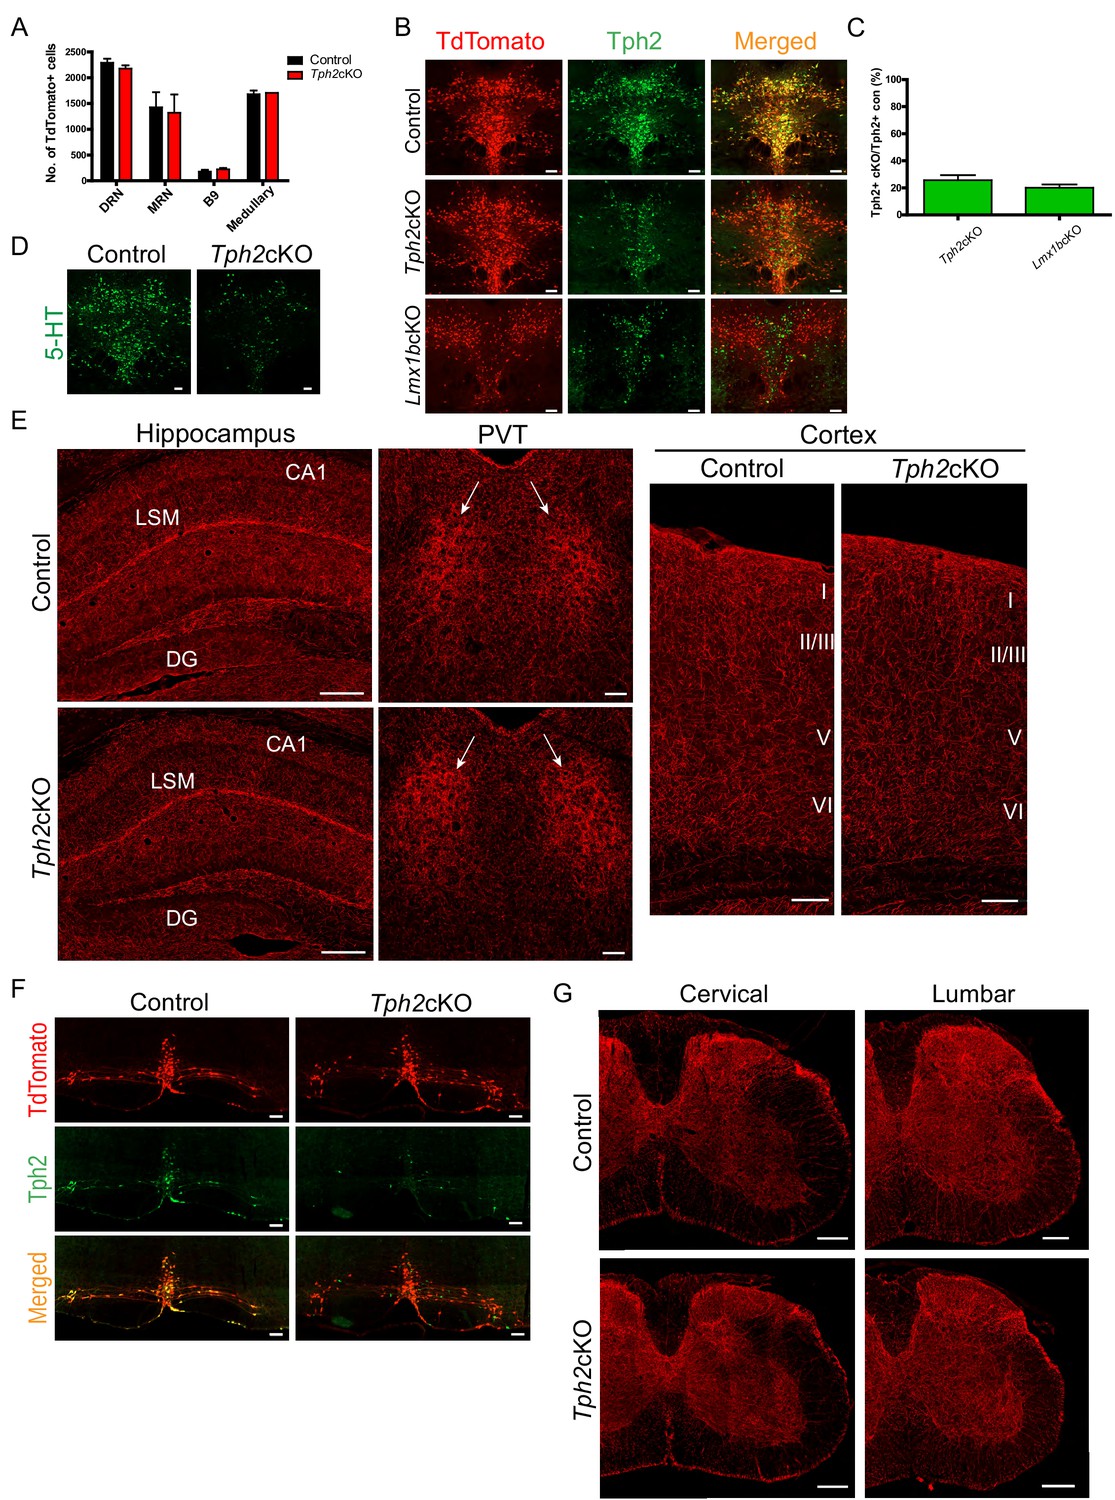
Specific targeting of 5-HT synthesis does not alter 5-HT arborization patterns.
(A) Counts of TdTomato+ cells in each raphe nucleus of Tph2cKO mice did not differ from controls (n = 2 mice/genotype). Data are represented as mean ± SEM. (B) Comparable Tph2 knock-down in Tph2cKO and Lmx1bcKO mice. Scale bars, 100 µm. (C) Cell counts of residual Tph2+ neurons in Tph2cKO and Lmx1bcKO mice expressed as a percentage (n = 2 mice/genotype). Data are represented as mean ± SEM. (D) Immunolabeling shows 5-HT was severely reduced in Tph2cKO mice. Scale bars, 100 µm. (E) Coronal forebrain sections showing no deficits of TdTomato+ axon densities in Tph2cKO hippocampus, PVT, and cortex (n = 3 mice/genotype). LSM, lacunosum moleculare; DG, dentate gyrus; CA1 of hippocampus. Scale bars, 100 µm (PVT, cortex); 200 µm (hippocampus). (F) Co-immunolabeling for Tph2 and TdTomato in medullary neurons. Tph2 expression was severely reduced in medullary neurons of Tph2cKO mice. Scale bars, 50 µm. (G) No deficits of TdTomato+ axons were present throughout the Tph2cKO spinal cord (n = 3 mice/genotype). Scale bars, 200 µm.
Figure 7
Ascending and descending Lmx1b regulated transcriptomes.
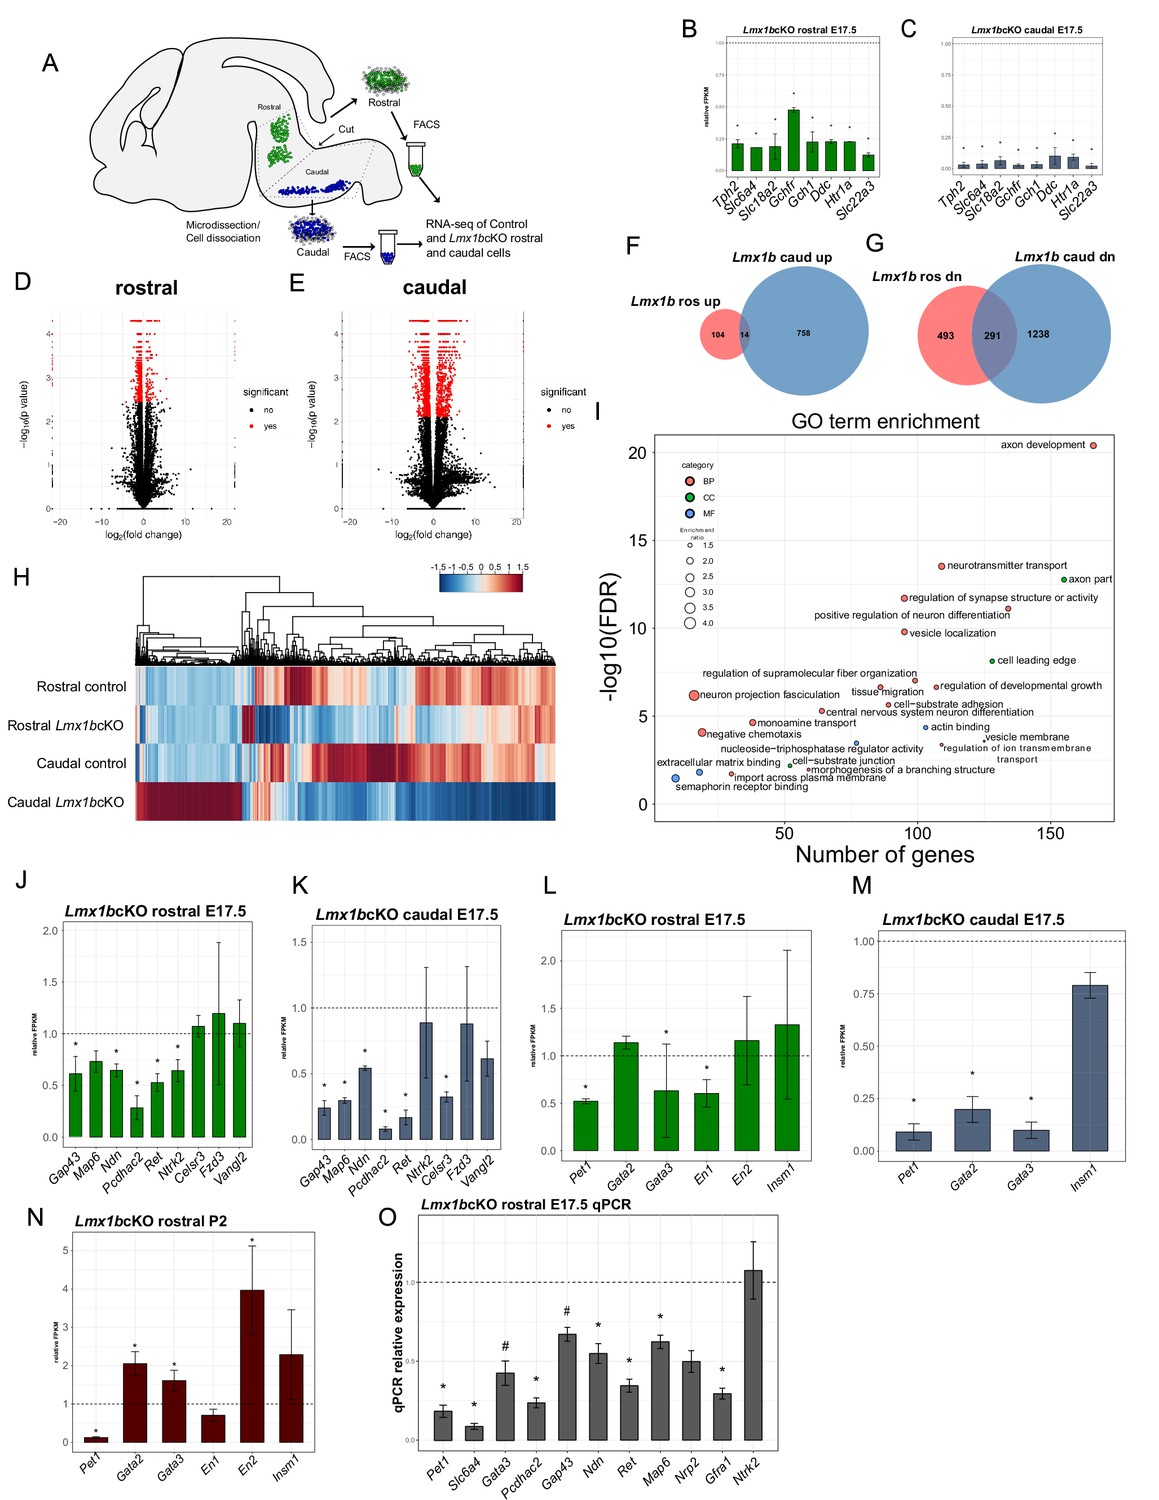
(A) Schematic for dissection of E17.5 brain to isolate rostral and caudal 5-HT neurons genetically labeled by Pet1-EYFP. After dissection, EYFP+ neurons were flow-sorted separately and prepared for RNA-sequencing (n = 3, controls; n = 2 Lmx1bcKO embryos). (B) Relative expression level of 5-HT pathway genes in rostral control versus Lmx1bcKO 5-HT neurons. Control gene expression levels were normalized to one. * indicates FDR ≤ 0.05. Data are represented as mean ± SEM. (C) Relative expression level of 5-HT pathway genes in caudal control versus Lmx1bcKO 5-HT neurons. Control gene expression levels were normalized to one. * indicates FDR ≤ 0.05. Data are represented as mean ± SEM. (D) Volcano plot for rostral control versus Lmx1bcKO differential expression. Significantly altered genes are in red with ≥log2(1.5X) and FDR ≤ 0.05. (E) Volcano plot for caudal control versus Lmx1bcKO differential expression. Significantly altered genes are in red with ≥log2(1.5X) and FDR ≤ 0.05. (F) Venn diagram of genes upregulated in rostral and caudal Lmx1bcKO 5-HT neurons. (G) Venn diagram of genes downregulated in rostral and caudal Lmx1bcKO 5-HT neurons. (H) Heatmap of differentially-expressed genes in rostral and caudal Lmx1bcKO 5-HT neurons. (I) GO term enrichment of Lmx1b regulated genes. BP = biological process, CC = cellular component, MF = molecular function. GO terms were enriched with FDR ≤ 0.05. (J) Relative expression (FPKMs) of known 5-HT neuron axon-related genes in rostral Lmx1bcKO 5-HT neurons. Data are represented as mean ± SEM. (K) Relative expression (FPKMs) of known 5-HT neuron axon-related genes in caudal Lmx1bcKO 5-HT neurons. Data are represented as mean ± SEM. (L) Relative expression (FPKMs) of 5-HT GRN transcription factors in rostral Lmx1bcKO 5-HT neurons. Data are represented as mean ± SEM. (M) Relative expression (FPKMs) of 5-HT GRN transcription factors in caudal Lmx1bcKO 5-HT neurons. Data are represented as mean ± SEM. (N) Relative expression (FPKMs) of 5-HT GRN transcription factors in flow sorted TdTomato+ rostral Lmx1bcKO 5-HT neurons at postnatal day 2 (n = 3, controls; n = 4, Lmx1bcKO mice). Data are represented as mean ± SEM. (O) RT-qPCR verification of 5-HT GRN transcription factors and known axon-related genes from flow sorted rostral YFP+ Lmx1bcKO 5-HT neurons relative to control levels (n = 4 mice/genotype). * indicates p-value≤0.05, # indicates p<0.1, t-test with Welch’s correction. Data are represented as mean ± SEM.
Figure 8 with 2 supplements
Distinct transcription factor requirements in the formation of ascending and descending 5-HT projection pathways.
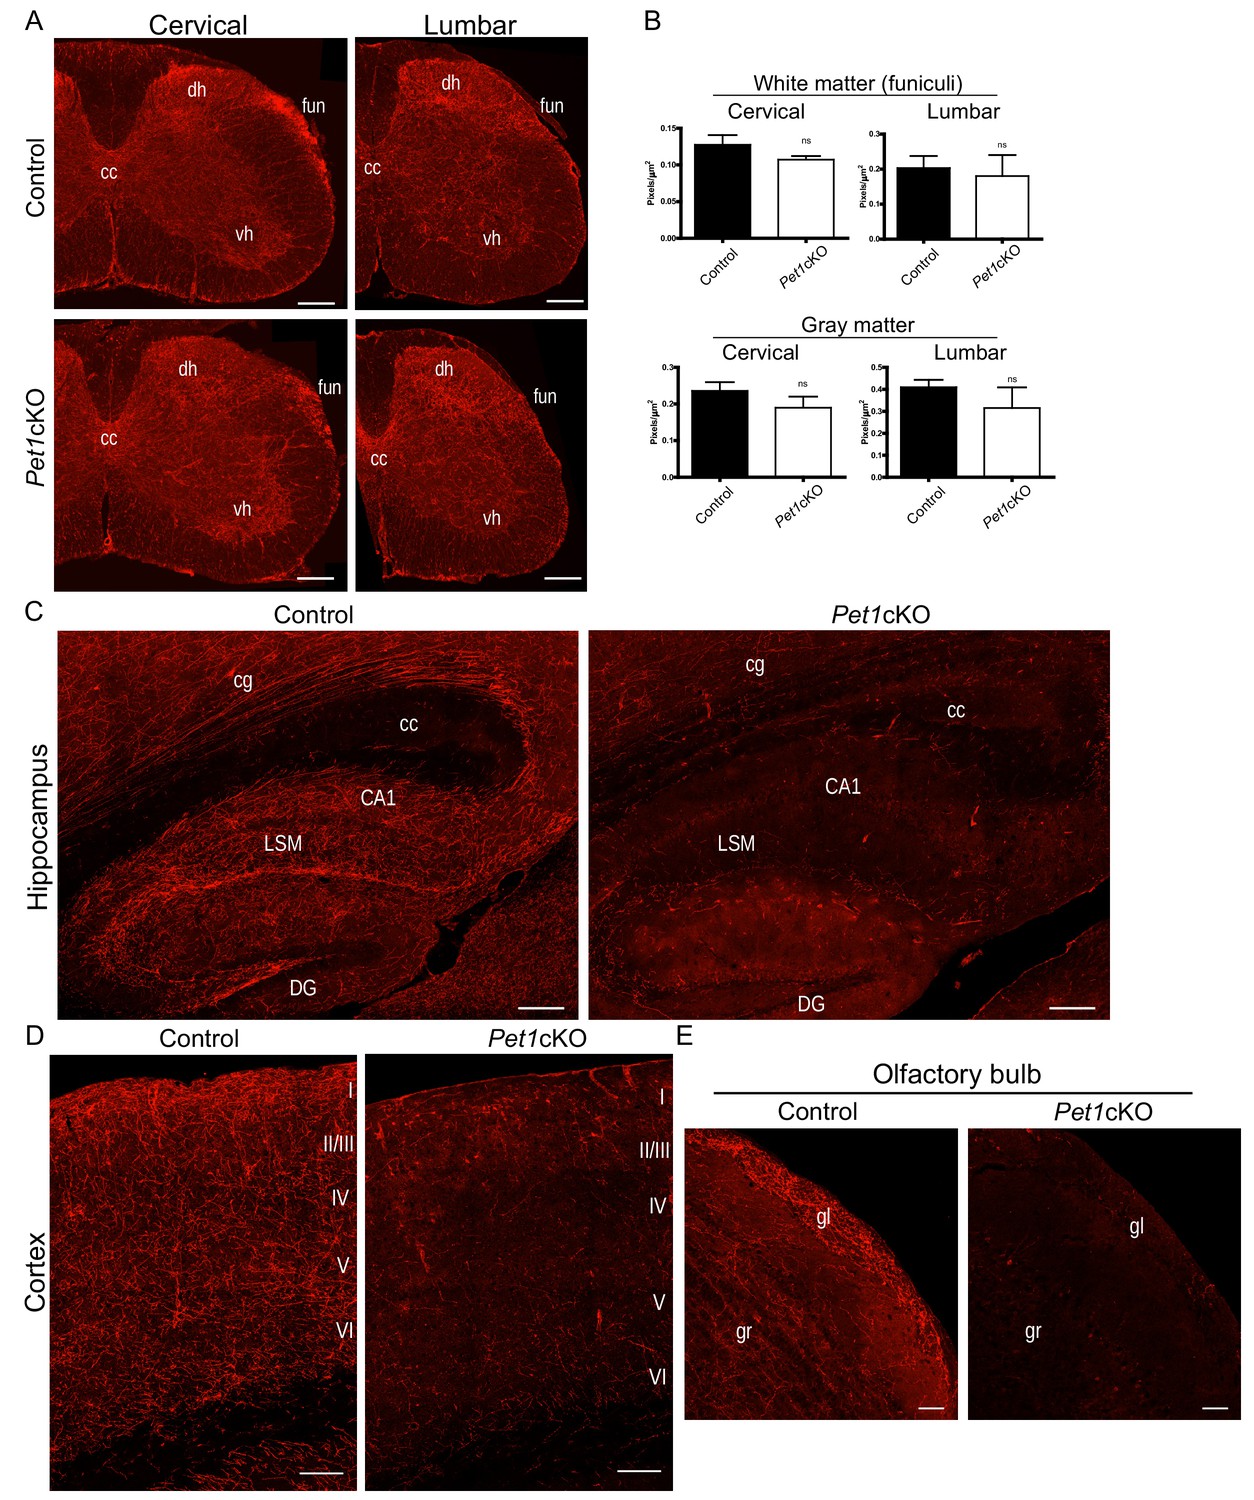
(A) TdTomato+ axon innervation in Pet1cKO vs control spinal cords in 3 month old mice. Coronal semi-section views of cervical and lumbar levels. Scale bars, 200 µm. cc, central canal; dh, dorsal horn; vh, ventral horn; fun, funiculi. (B) Quantification of TdTomato+ axons (pixels/µm2) in cervical and lumbar spinal cords (n = 3, controls; n = 3, Pet1cKO animals; Two-way ANOVA; white matter: cervical p=0.1372; lumbar p=0.6764; gray matter: cervical p=0.4440; lumbar p=0.1995). Data are represented as mean ± SEM. (C) Decreased TdTomato+ arbors detected in Pet1cKO hippocampus compared to controls at 3 months of age. Scale bars, 200 µm, sagittal view. (D) Decreased TdTomato+ arbors detected in Pet1cKO cortex compared to controls at 3 months of age. Scale bars, 100 µm, coronal view. (E) Decreased TdTomato+ arbors detected in Pet1cKO olfactory bulb compared to controls at 3 months of age. Scale bars, 50 µm, sagittal view. cg, cingulum; cc, corpus callosum; LSM, lacunosum moleculare; DG, dentate gyrus; CA1 of hippocampus; gr, granule layer; gl, glomerular layer.
Figure 8—figure supplement 1
Pet1cKO and Lmx1bcKO mice exhibit distinct axon defects in thalamus.
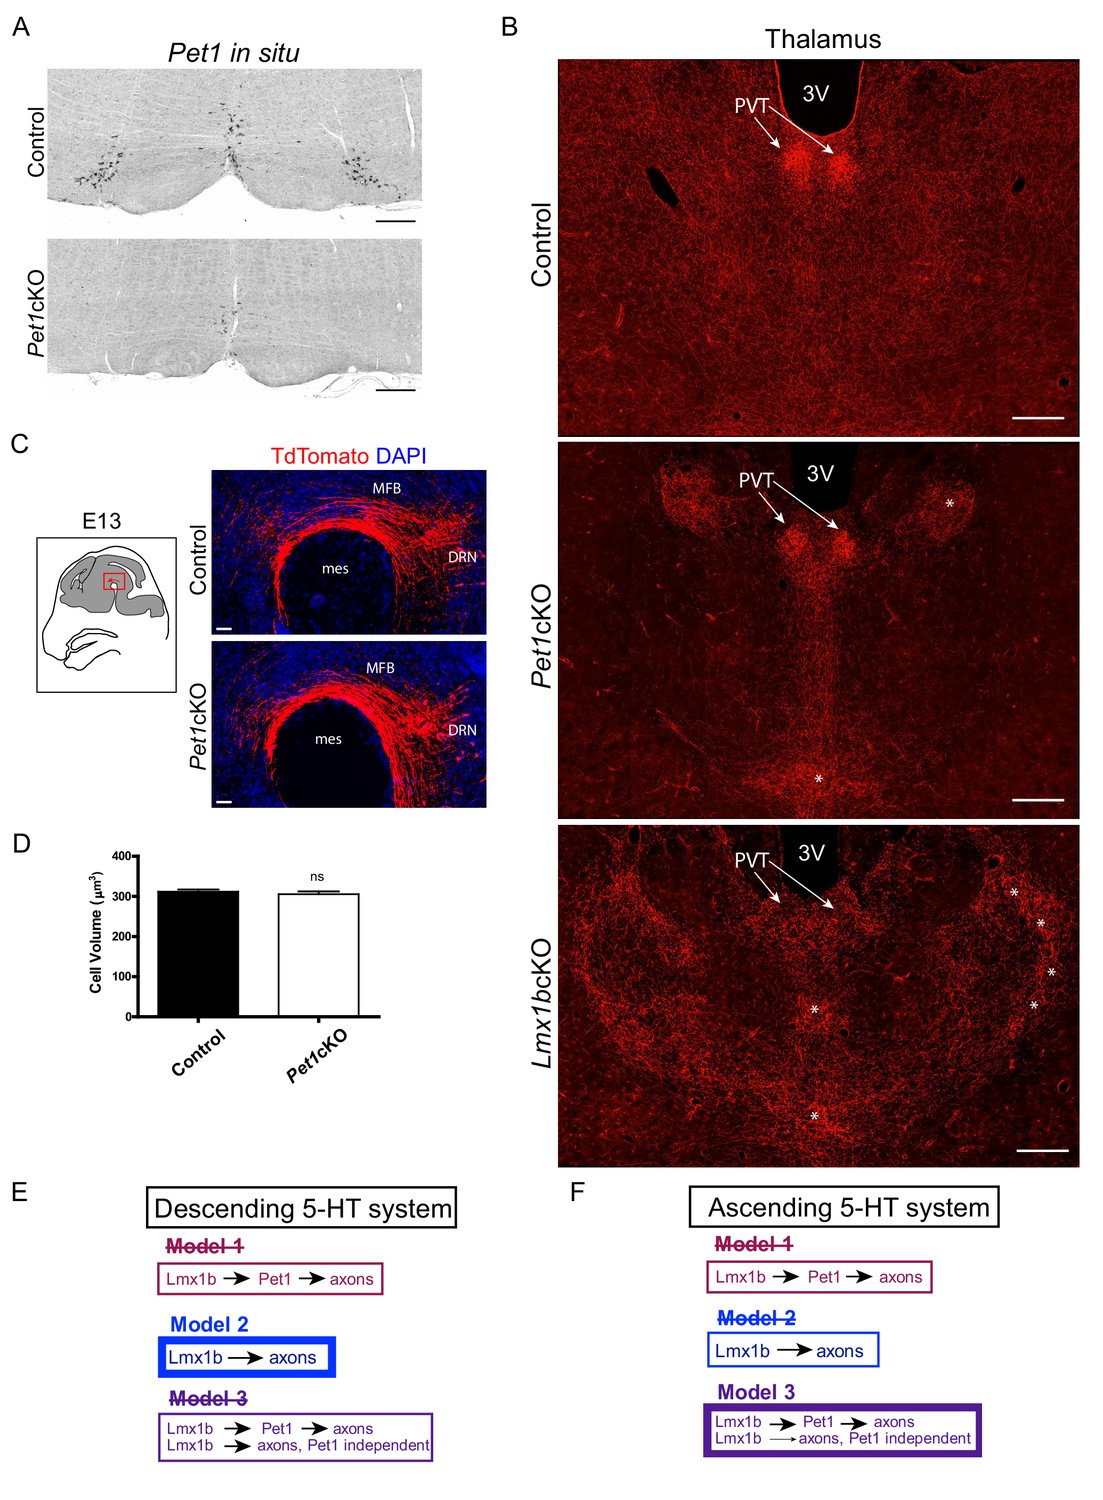
(A) Pet1 ISH shows Pet1 was targeted in medullary neurons of Pet1cKO mice. Scale bars, 200 µm. (B) Distinctly different clumping pattern in Pet1cKO thalamus (asterisks) compared to Lmx1bcKO thalamus. Patterning in the PVT was normal in Pet1cKO mice (arrows). Scale bars, 200 µm. (C) No differences in early embryonic (E13.5) primary growth through the MFB in Pet1cKO embryos. Scale bars, 50 µm. (D) Cell volume analysis in Pet1cKO DRN revealed no significant difference in cell body size (n = 587 control cells; n = 549 Pet1cKO cells, p=0.4745). Compare to Lmx1bcKO cell volume, see Figure 1—figure supplement 1J. Unpaired t-test with Welch's correction. Data are represented as mean ± SEM. (E) Scheme illustrating evidence-supported model for control of descending 5-HT axon development (Model 2). (F) Scheme illustrating evidence-supported model for control of ascending 5-HT axon development (Model 3).
Figure 8—figure supplement 2
DKO and Pet1-/- analyses.
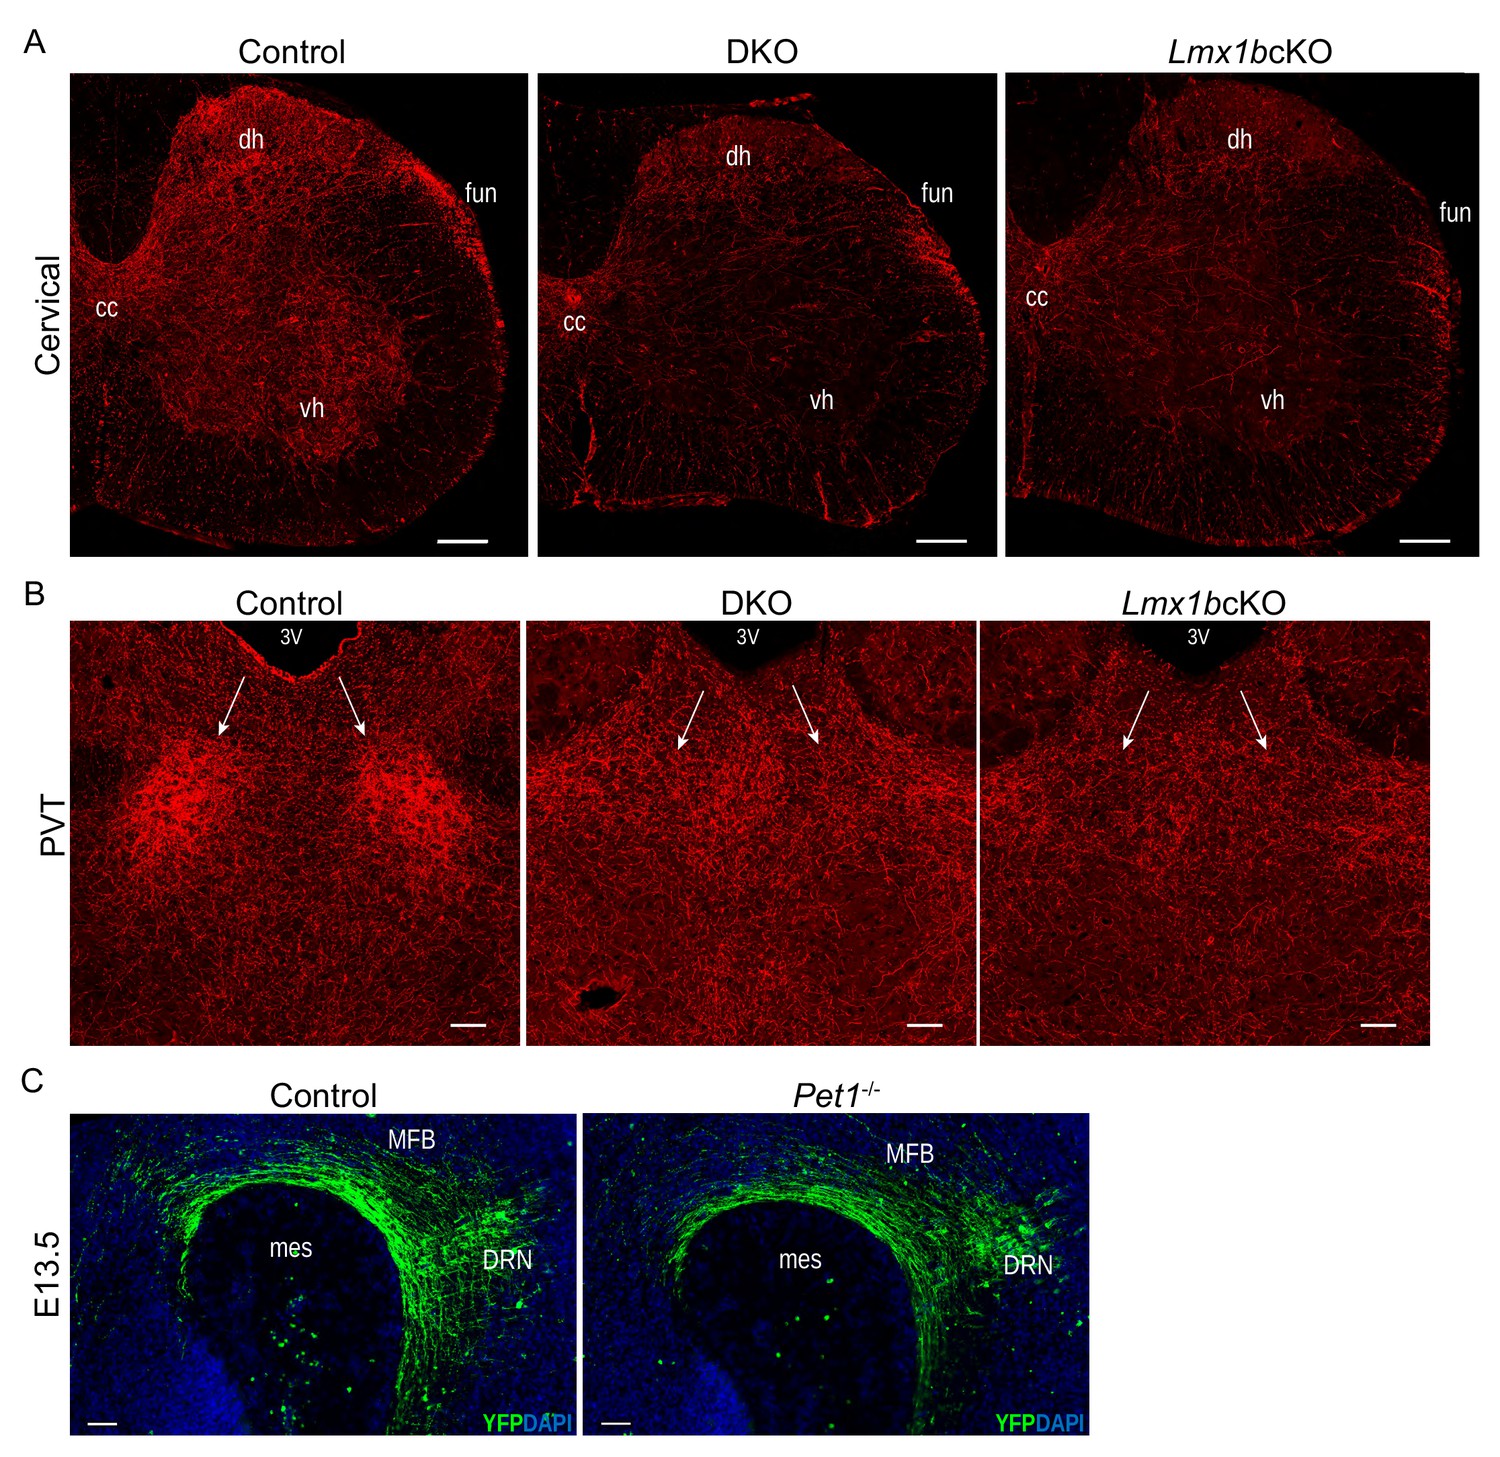
(A) Similar 5-HT axons defects in spinal cord of DKO and Lmx1bcKO mice (n = 3 mice/genotype). Scale bars, 200 µm. cc, central canal; dh, dorsal horn; vh, ventral horn; fun, funiculi. (B) DKO PVT was unarborized similar to Lmx1bcKO PVT (n = 3 mice/genotype). Scale bars, 100 µm. PVT, paraventricular nucleus of the thalamus; 3V, third ventricle. (C) Immunolabeled YFP+ axons in Pet1-/- embryos at E13.5 showed no deficit in primary ascending axon growth through the MFB (n = 2 mice/genotype). Scale bars, 50 µm. MFB, medial forebrain bundle; mes, mesencephalic flexure.
Figure 9 with 1 supplement

An ascending specific Lmx1b→Pet1 cascade controls stage specific 5-HT gene expression and postnatal terminal arborization.
(A) RT-qPCR analysis of Pet1 expression in flow sorted TdTomato+ neurons 4 weeks post P3 tamoxifen treatment (n = 3, iControl; n = 4, P3 Lmx1bicKO mice). Unpaired t-test with Welch's correction, *p<0.05. Data are represented as mean ± SEM. (B) Pet1 in situ hybridization in P3 targeted Lmx1bicKO mice. Scale bars, 100 µm. (C) Venn diagram showing overlap of rostral Lmx1b and Pet1 regulated genes and the axon-related gene dataset. Lmx1b rostral: genes controlled by Lmx1b in rostral 5-HT neurons; Pet1 rostral: genes controlled by Pet1 in rostral 5-HT neurons; Axon genes: Lmx1b regulated rostral and caudal axon-related genes. (D) Relative expression of the unique Pcdhac2 exon in rostral Lmx1bcKO and Pet1cKO 5-HT neurons. * indicates FDR ≤ 0.05. Data are represented as mean ± SEM. (E) Developmental expression profile of Pcdhac2 in 5-HT neurons from E11.5 to early postnatal (PN). * indicates FDR ≤ 0.05. Data are represented as mean ± SEM. (F) Pcdhac2 in situ hybridization at postnatal day 14 in P3 targeted Lmx1bicKO mice. Representative image from n = 3 mice/genotype. Scale bars, 100 µm. (G) Pcdhac2 in situ hybridization at postnatal day 14 in P3 targeted Pet1icKO mice. ISH experiments done in parallel, iControl section is the same section in (F) and (G) to compare icKOs at the same tissue level. Representative image from n = 3 Pet1icKO mice. Scale bars, 100 µm. (H) Visualization of the Pcdhac2 gene locus showing mycPet1 ChIP peaks at the TSS and 3rd intron (shaded) and matches to the known Pet1 motif. Zoomed regions of the significant mycPet1 binding sites are shown at the bottom. (I) The mycPet1 binding region located within the 3rd Pcdhac2 intron DNAse I hypersensitivity site (HS7) contains a significant match to the known Pet1 position-weight matrix. TOMTOM q-value = 4.75×10−04. (J) Decreased TdTomato+ arbors detected in P3 targeted Pet1icKO hippocampus compared to iControl mice. Scale bars, 200 µm. (K) Decreased TdTomato+ arbors detected in all layers of P3 targeted Pet1icKO cortex (Imaris tracing; right panels) compared to iControl mice. Scale bars, 50 µm. (L) Decreased TdTomato+ arbors in striatum of P5 targeted Pet1icKO mice. Scale bars, 20 µm. See also Figure 9—figure supplement 1F.
Figure 9—figure supplement 1
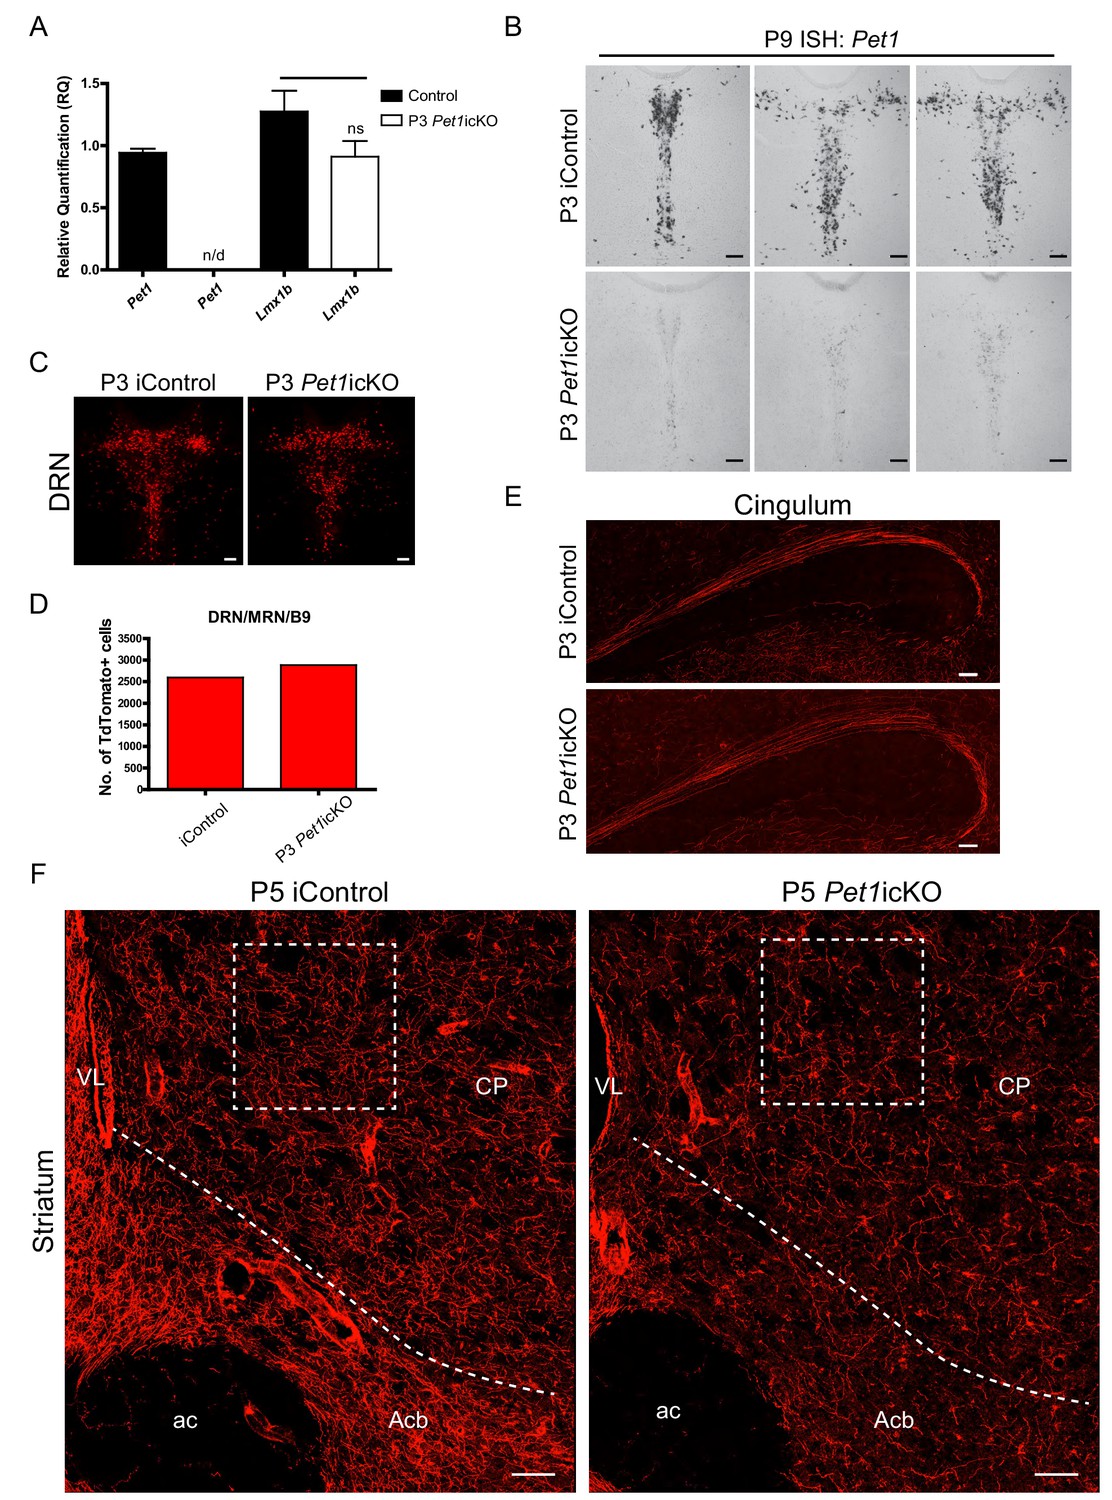
Lmx1b→Pet1 cascade acts postnatally to control 5-HT terminal arborization.
(A) RT-qPCR of flow sorted TdTomato+ cells in P3 targeted Pet1icKO mice at 4 weeks of age. Pet1 was not detected by qPCR in flow sorted cells. Lmx1b was not significantly regulated by Pet1 (p=0.1791) (n = 3, iControl; n = 3, Pet1icKO mice). Unpaired t-test with Welch's correction, *p<0.05. Data are represented as mean ± SEM. (B) Pet1 ISH confirmed Pet1 targeting in the DRN. Scale bars, 100 µm. (C, D) Similar numbers of TdTomato+ cells were counted in P3 Pet1icKO and P3 iControl mice. Scale bars, 100 µm. (E) Long-range cingulum route was fully formed in P3 targeted Pet1icKO mice. Scale bars, 100 µm. (F) Analysis of TdTomato+ arbors in P5 targeted Pet1icKO mice revealed continuing requirement for Pet1 late-stage arborization in the striatum. Boxed regions presented in Figure 8L. Scale bars, 50 µm. CP, caudate putamen; Acb, nucleus accumbens; ac, anterior commissure; VL, lateral ventricle.
Tables
Key resources table
| Reagent type (species) or resource | Designation | Source or reference | Identifiers | Additional information |
|---|---|---|---|---|
| Gene (Mus musculus) | Lmx1b | NA | MGI:1100513 | |
| Gene (M. musculus) | Pet1 | NA | MGI:2449712 | |
| Gene (M. musculus) | Tph2 | NA | MGI:2651811 | |
| Genetic reagent (M. musculus) | Pet1-Cre | PMID:16251278 | RRID:MGI:4837211 | Evan Deneris (Case Western Reserve University) |
| Genetic reagent (M. musculus) | RosaTom | Jackson Laboratory | Stock #: 007909; RRID:MGI:4436851 | Hongkui Zeng (Allen Institute for Brain Science) |
| Genetic reagent (M. musculus) | Tph2-CreERT2 | Jackson Laboratory | Stock #: 016584; RRID:IMSR_JAX:016584 | Bernd Gloss (NIEHS) |
| Genetic reagent (M. musculus) | Lmx1bflox | PMID:17151281 | RRID:MGI:3810753 | Zhou-Feng Chen (Washington University) |
| Genetic reagent (M. musculus) | Pet1flox | PMID:20818386 | RRID:MGI:4837213 | Evan Deneris (Case Western Reserve University) |
| Genetic reagent (M. musculus) | Tph2flox | PMID:24972638 | RRID:IMSR_JAX:027590 | Zhou-Feng Chen (Washington University) |
| Genetic reagent (M. musculus) | Pet1-/- | PMID:12546819 | MGI:2449922 | Evan Deneris (Case Western Reserve University) |
| Genetic reagent (M. musculus) | Pet1-YFP | PMID:16251278 | n/a | Evan Deneris (Case Western Reserve University) |
| Antibody | anti-RFP (rabbit polyclonal) | Rockland | Rockland: p/n 600-401-379; RRID:AB_2209751 | (1:200) |
| Antibody | anti-GFP (rabbit polyclonal) | Invitrogen | Invitrogen: A6455; RRID:AB_221570 | (1:200) |
| Antibody | anti-5-HT (rabbit polyclonal) | Immunostar | Immunostar: 20080; RRID:AB_1624670 | (1:200) |
| Antibody | anti-Tph2 (rabbit polyclonal) | Millipore | Millipore: ABN60; RRID:AB_10806898 | (1:500) |
| Antibody | anti-Lmx1b (rabbit polyclonal) | Suleiman et al., 2007-gift | n/a | (1:200) |
| Antibody | anti-RFP (mouse monoclonal) | Abcam | Abcam: ab65856; RRID:AB_1141717 | (1:200) |
| Antibody | anti-RFP (mouse monoclonal) | Rockland | Rockland: p/n 200-301-379; RRID:AB_2611063 | (1:200) |
| Antibody | Alexa 488- or 594- secondaries | Invitrogen | (1:500) | |
| Genetic reagent (Virus) | rAAv2/Ef1a-DIO-hchR2 (H134R)-EYFP | UNC GTC Vector Core | Lot# AV4378K | |
| Sequence-based reagent | Pcdhac2 in situ primer: F: 5’ AGCCACCTCTATCAGCTACCG 3’ | this paper | ||
| Sequence-based reagent | Pcdhac2 in situ primer: R: 5’ AGAATTAACCCTCACTAAAGGGCTCATTTTGAGAGCCAGCATCA 3’ | this paper | ||
| Sequence-based reagent | Pet1 in situ primers: F:5’CCAGTGACCAATCCCATCCTC3’ | PMID:26843655 | ||
| Commercial assay or kit | Transcriptor First Strand cDNA Synthesis Kit | Roche | REF 4896866001 | |
| Commercial assay or kit | PerfeCTa PreAmp SuperMix | QuantoBio | Cat. No. 95146–040 | |
| Commercial assay or kit | PerfeCTa FastMix II ROX mastermix | QuantaBio | Cat. No. 95119–012 | |
| Commercial assay or kit | RNA Clean and ConcentratorTM-5 kit | Zymo Research | Catalog Nos. R1015 and R1016 | |
| Chemical compound, drug | Tamoxifen | Sigma-Aldrich | CAS Number: 10540-29-1 | 10 mg/mL stock in corn oil |
| Other | 35 μm filter | BD biosciences | Cat. No. 352235 | |
| Other | Fetal bovine serum (FBS) | Gibco | Cat. No. 16000044 | |
| Other | DNase I | Invitrogen | Cat. No. 18047019 | |
| Other | Trizol LS | Invitrogen | Cat. No. 10296010 | |
| Other | TrypLE | Invitrogen | Cat. No. 12605010 | |
| Other | Leibovitz’s L15 medium | Invitrogen | Cat. No. 11415114 | |
| Commercial assay or kit | Quantifluor RNA system | Promega | Cat. No. E3310 | |
| Commercial assay or kit | Nugen TRIO RNA-seq | Nugen | Cat. No. 0507–08 | |
| Commercial assay or kit | Zymo RNA clean and concentrator | Zymo Research | Cat. No. R1013 | |
| Other | FACS Aria I | Becton Dickinson | ||
| Other | iCyt cell sorter | Sony | ||
| Other | Fragment analyzer | Advanced Analytics | ||
| Other | Nextseq 550 | Illumina | RRID:SCR_016381 | |
| Software, algorithm | FASTQC | https://www.bioinformatics.babraham.ac.uk/projects/fastqc/ | RRID:SCR_014583 | |
| Software, algorithm | Trimmomatic | Bolger et al., 2014 | RRID:SCR_011848 | |
| Software, algorithm | Cufflinks (v2.2.2) | Trapnell et al., 2010 | RRID:SCR_014597 | |
| Software, algorithm | R (v. 3.5) | http://www.r-project.org | RRID:SCR_001905 | |
| Software, algorithm | Webgestalt | http://www.webgestalt.org | RRID:SCR_006786 | |
| Software, algorithm | Biovenn | http://www.biovenn.nl | ||
| Software, algorithm | DEXSeq | Anders et al., 2012 | RRID:SCR_012823 | |
| Software, algorithm | Tophat2 (v2.1.1) | Kim et al., 2013 | RRID:SCR_013035 | |
| Other | Mus musculus genome | Ensembl, v. 96 | RRID:SCR_002344 | |
| Other | Mus musculus genome | UCSC, mm10 | RRID:SCR_005780 | |
| Software, algorithm | featureCounts | Rsubread | RRID:SCR_012919 | |
| Software, algorithm | ENCODE Transcription Factor ChIP-seq analysis pipeline | https://github.com/ENCODE-DCC/chip-seq-pipeline | RRID:SCR_015482 | |
| Software, algorithm | Burroughs-Wheeler aligner (BWA) | http://bio-bwa.sourceforge.net/ | RRID:SCR_010910 | |
| Software, algorithm | MACS2 | Zhang et al., 2008 | RRID:SCR_013291 | |
| Software, algorithm | Imaris 7.4.2 | Bitplane, Zurich, Switzerland | Surfaces or Filament Tracer tool |
Additional files
-
Supplementary file 1
Legend Lmx1b-regulated axon-related genes in rostral and caudal 5-HT neurons at E17.5.
Axon genes that are also regulated by Pet1 in rostral 5-HT neurons at E17.5 are in bold.
- https://doi.org/10.7554/eLife.48788.020
-
Transparent reporting form
- https://doi.org/10.7554/eLife.48788.021
Download links
A two-part list of links to download the article, or parts of the article, in various formats.
Downloads (link to download the article as PDF)
Open citations (links to open the citations from this article in various online reference manager services)
Cite this article (links to download the citations from this article in formats compatible with various reference manager tools)
Lmx1b is required at multiple stages to build expansive serotonergic axon architectures
eLife 8:e48788.
https://doi.org/10.7554/eLife.48788


