Modulating FOXO3 transcriptional activity by small, DBD-binding molecules
- Medical University Innsbruck, Austria
- The Czech Academy of Sciences, Czech Republic
- University of Innsbruck, Austria
- Tyrolean Cancer Research Institute, Austria
- Charles University, Czech Republic
- Paracelsus Medical University Salzburg, Austria
- Biocenter, Medical University Innsbruck, Austria
- Independent Data Lab UG, Germany
Figures
Figure 1 with 2 supplements
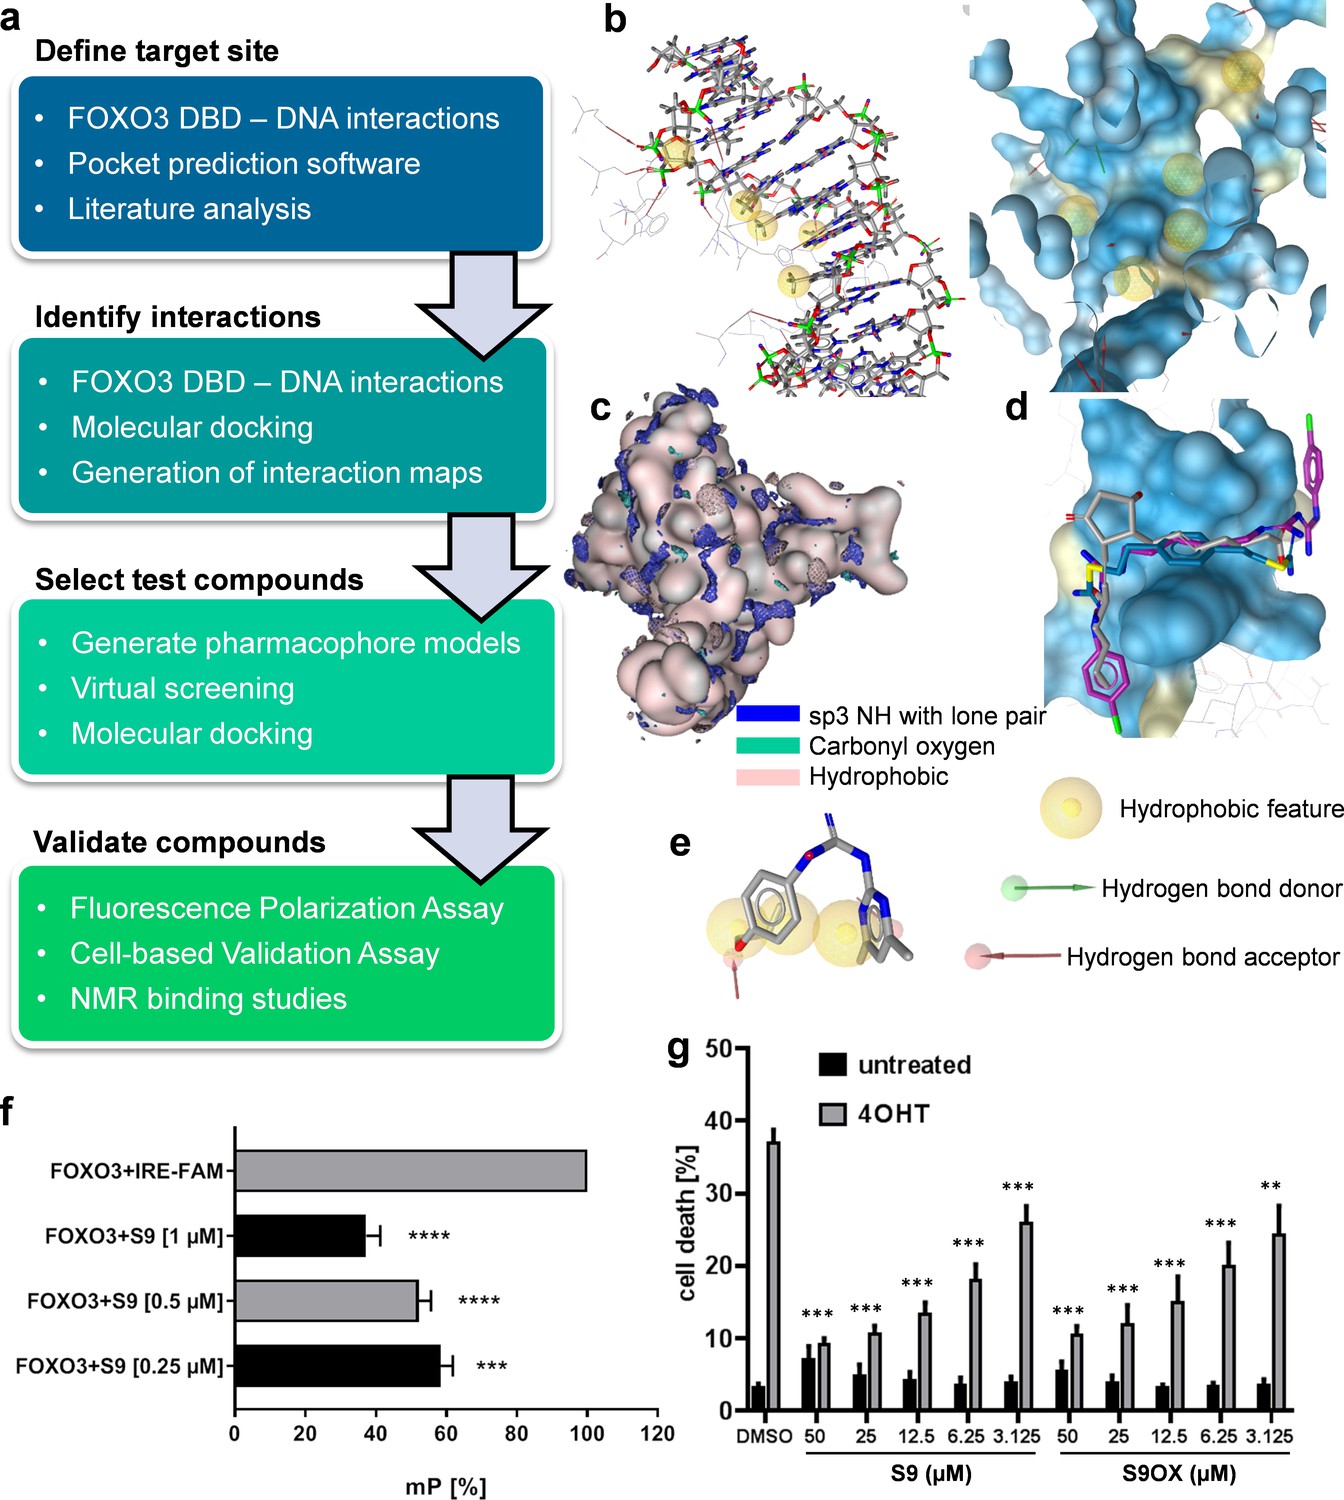
Strategy to identify small molecule compounds that interact with FOXO3-DBD.
(a) Overview of the workflow employed to identify FOXO3 inhibitors. (b) Interactions between FOXO3-DBD and the 13 bp DNA strand were represented as pharmacophore features. DNA is shown as sticks and FOXO3 DBD residues as lines (left) and the pharmacophore features were mapped onto the FOXO3 DBD protein surface (blue, right). (c) Interaction maps highlight areas on the FOXO3 DBD surface (depicted in rose) where the defined probes can interact with the protein. (d) Docking poses of DB00878 (magenta), DB02056 (gray), and DB02141 (blue) were used to generate different pharmacophore models. (e) Compound S9 maps to one of the pharmacophore models. (f) FPA of recombinant FOXO3-DBD (125 nM) and FAM-labeled IRE-oligonucleotide (25 nM). S9 dose-dependent increase of freely rotating oligonucleotide is demonstrated. Shown is the mean of three independent experiments + SD (****p<0.0001, ***p<0.001). (g) PI-staining of nuclei and flow cytometric analyses of SH-EP/FOXO3 cells treated with 50 nM 4OHT alone or in combination with varying concentrations of S9 or S9OX for 48 hr. Shown is the mean + SD of four independent experiments. Statistical differences between 4OHT and S9+4OHT or 4OHT and S9OX+4OHT were assessed by students t-test (***p<0.001, **p<0.01, two-tailed).
Figure 1—figure supplement 1
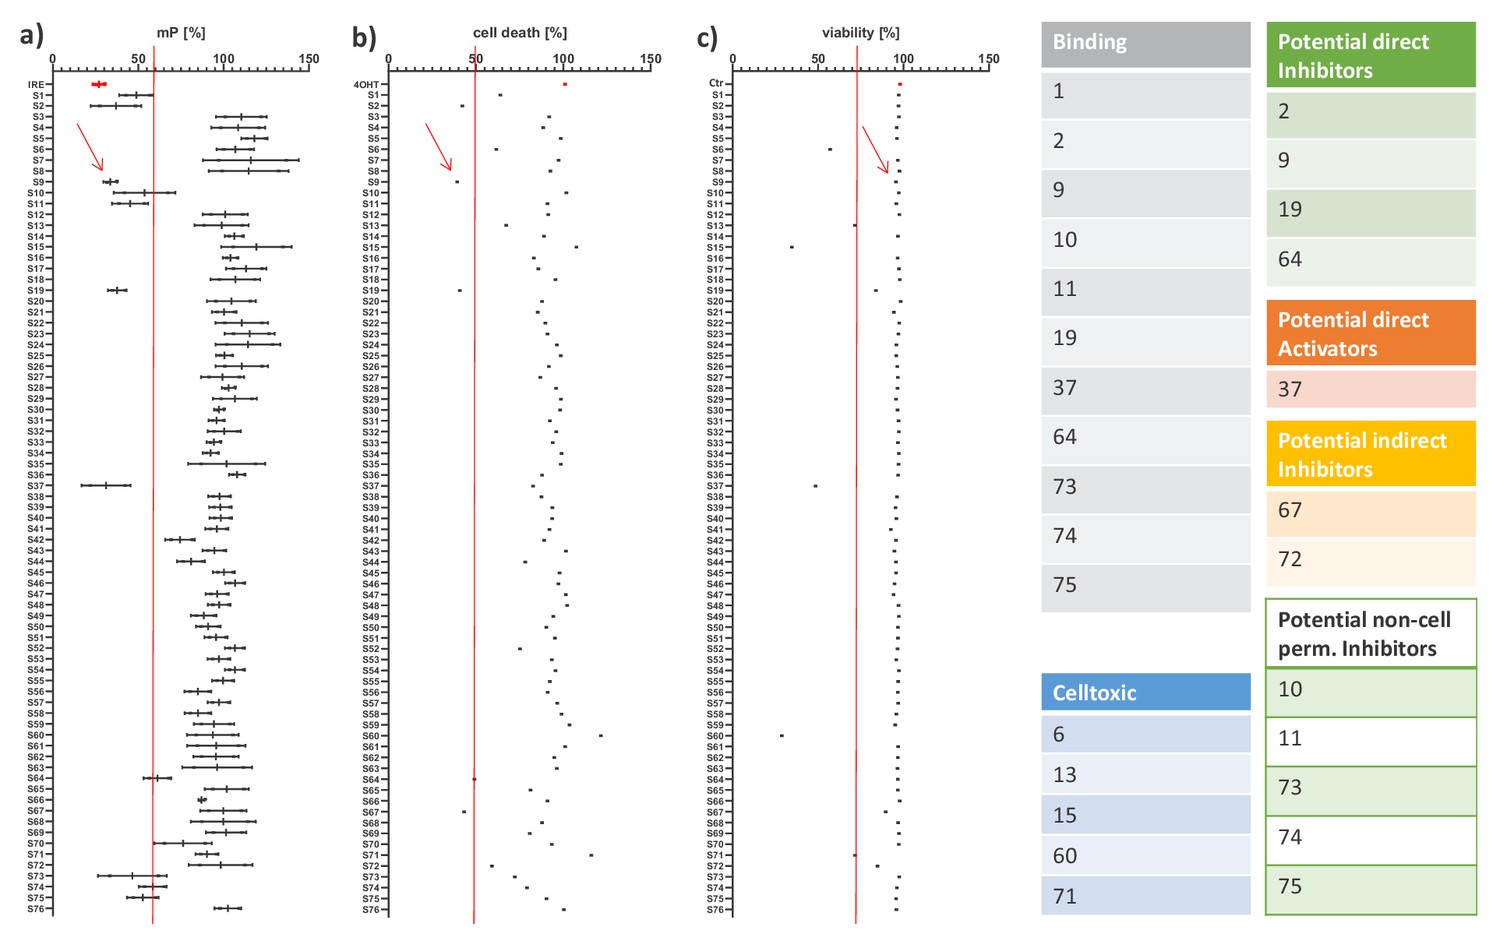
Overview of combined fluorescence polarization assay (FPA)- and live/dead flow cytometry-based validation of candidate compounds.
FPAs were performed with 125 nM FOXO3-DBD and 25 nM FAM-labeled IRE-oligonucleotide as described in Materials and methods. Compound concentration was 1 μM. mP value of freely rotating IRE-FAM oligonucleotide was subtracted. Threshold for FPA was set to 60% mP value reduction (a). For flow cytometry, SH-EP/FOXO3 cells were treated with 20 nM 4OHT and 20 μM of each compound for 48 hours. Apoptotic cells were detected using propidium-iodide staining of fragmented nuclei. Threshold for cell death inhibition was set to 50% of FOXO3-induced cell death (b), threshold for viability/toxicity was set to 75% of DMSO- treated controls (c). From those compounds that reduced mP in the FPA, S2, S9, S19, and S64 demonstrated a clear death-inhibitory effect in the conditional FOXO3 system suggesting that these are 'Potential direct inhibitors' of FOXO3, S37 induced cell death and triggered FOXO subcellular shuttling (data not shown) suggesting that this compound triggers FOXO3 activation ('Direct activator'). Compounds not affecting cellular FOXO3 effects (S10, S11, S73, S74, S75) despite mP reduction in the FPA apparently do not transit the cytoplasm membrane. Compounds S67 and S72 did not demonstrate significant effects in the FPA, but inhibited cell death induction by ectopic FOXO3, suggesting that these compounds rather inhibit FOXO3-induced cell death indirectly in this system ('Indirect inhibitors').
Figure 1—figure supplement 2
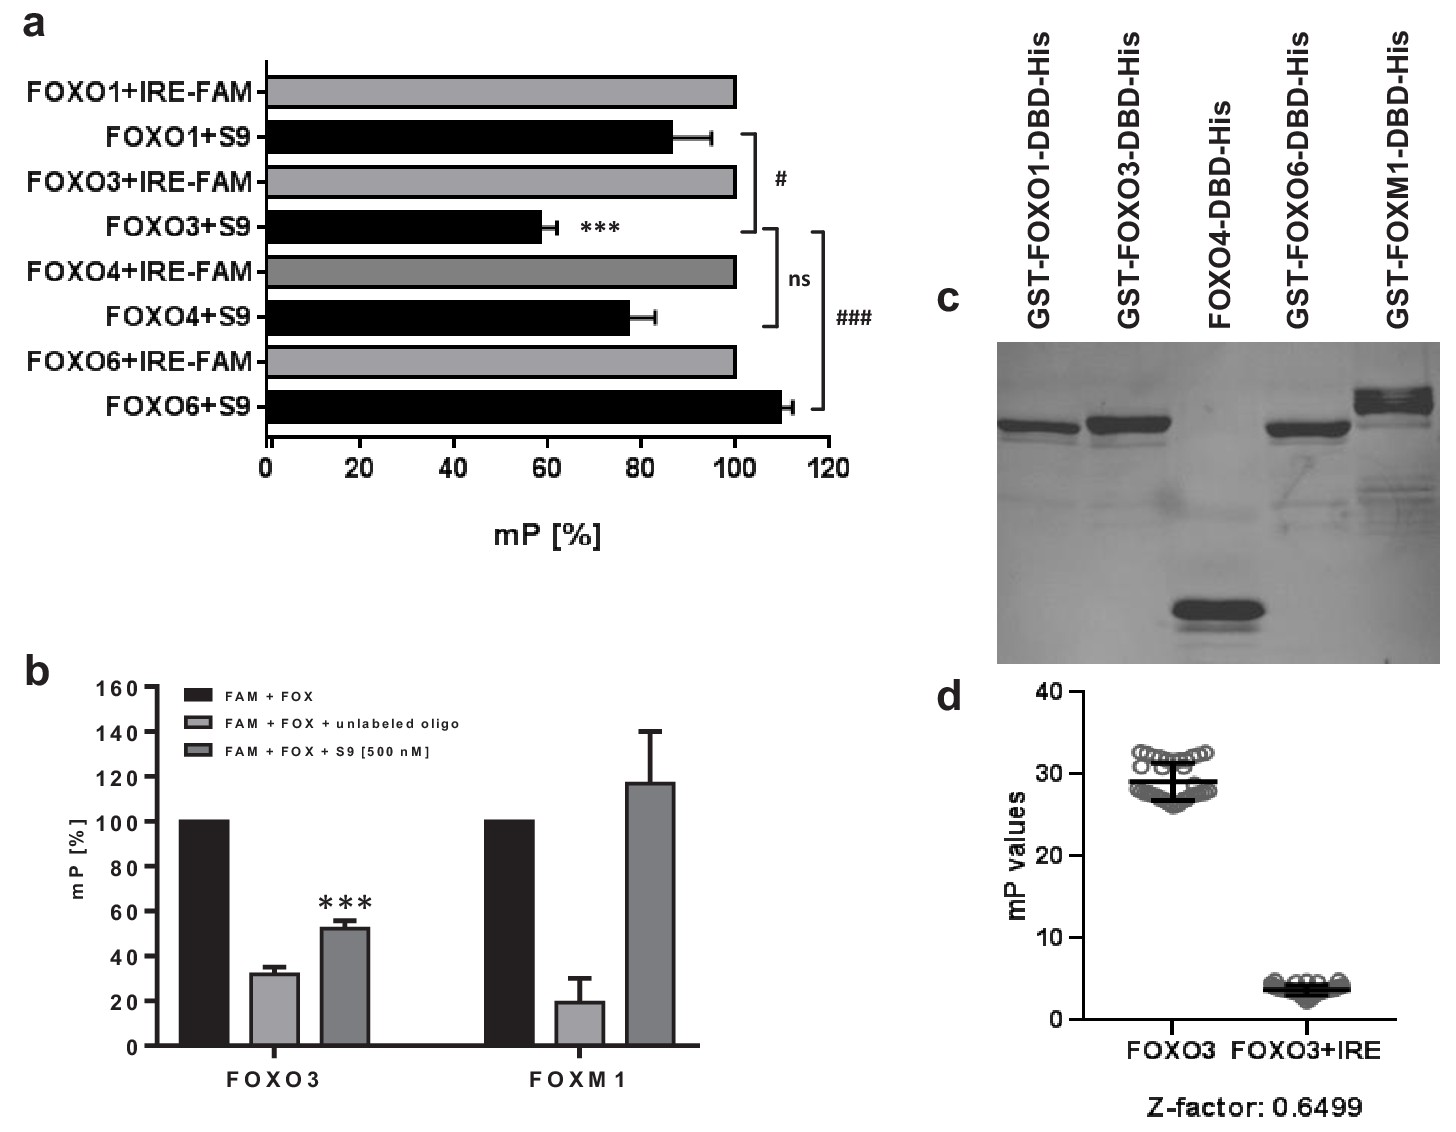
Effect of S9 on protein-DNA interaction of different FOX family members.
Recombinant FOXO1-DBD (159 - 272) FOXO4-DBD (82-207) and FOXO6-DBD (87 - 200) were prepared as described for FOXO3-DBD in Materials and methods. FPAs to measure binding of FAM-labeled IRE oligonucleotide (25 nM) to recombinant FOXO1-DBD, FOXO3-DBD, FOXO4-DBD and FOXO6-DBD (each 125 nM) were performed as described. A final concentration of 250 nM of S9 was used for all FOXO proteins. mP value of freely rotating IRE-FAM oligonucleotide was subtracted and the mP-value of FOXO-protein + IRE-FAM oligonucleotide complex was calculated as 100%. Shown is the mean + SEM of three independent experiments, statistical differences between FOXO3 +/- S9 or between FOXO1+S9 versus FOXO3+S9 or FOXO3+S9 versus FOXO6+S9 were assessed with unpaired student’s t-test. FOXO3 +/- S9: ***p<0.001, FOXO1+S9 versus FOXO3+S9: # p<0.05, two-tailed, FOXO6+S9 versus FOXO3+S9: ### p<0.001, two-tailed, (a). An FPA using recombinant FOXM1-DBD (222-360) with the FAM-labeled oligonucleotide TTT GTT TAT TTG TTT GTT TAT TTG was established to test efficacy of S9 on the DBD of this non-FOXO family protein. FPAs of FOXO3 (with IRE-FAM oligonucleotide) and FOXM1 were performed in parallel with a concentration of 500 nM S9 (b) controls were 100fold excess of unlabeled oligonucleotide. Whereas S9 inhibitory effect on FOXO3-DBD FPA was clearly visible, no effect was observed on FOXM1-DBD FPA suggesting that S9 does not interfere with FOXM1-DBD – DNA interaction. Shown is the mean of three independent experiments (student`s t test, ***p<0.001). Recombinant FOXO1-DBD, FOXO3-DBD, FOXO4-DBD, FOXO6-DBD and FOXM1-DBD were separated on PAGE and Coomassie-stained (c). 36 FOXO3-DBD FPAs were performed with FOXO3-DBD (125 nM) and FAM-IRE-oligonucleotide (25 nM) in presence or absence of a 100fold excess of unlabeled IRE-oligonucleotide and Z ́factor was calculated using the formula Z ́=1-(3 σ + + 3 σ - )/(μ + -μ - ). μ + , σ + and μ − , σ − are mean values and standard deviations for the high and low controls (+ unlabeled IRE oligonucleotide), respectively. The analysis provided a Z ́factor of 0.6499 which proves that the FPA is reliable for high-throughput screening (Z ́> 0.5).
Figure 2 with 2 supplements
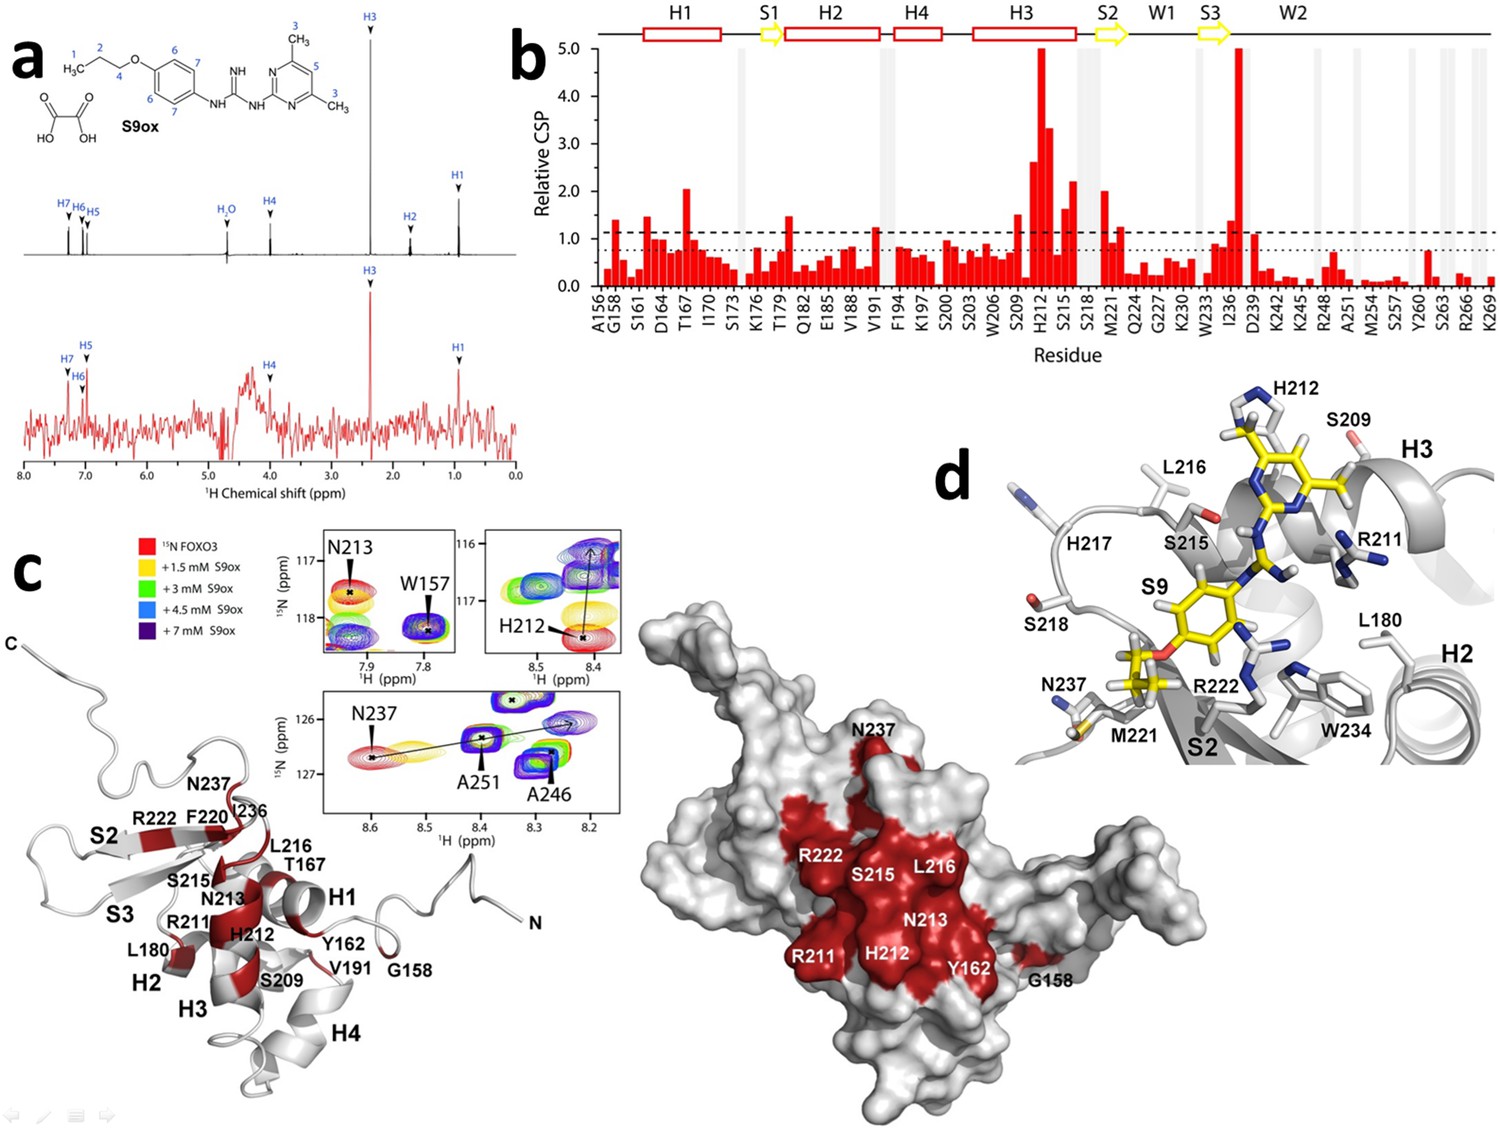
Compounds S9/S9OX block the DNA binding surface of FOXO3-DBD.
(a) 1D 1H STD-NMR experiments for S9OX compound in the presence of the 15 µM FOXO3-DBD. The reference spectrum of S9OX is shown in black, the corresponding STD-NMR spectrum is shown in red. Hydrogens in S9 are numbered from 1 to 7. (b) The summary of quantified chemical shift perturbations (CSPs) obtained for the FOXO3-DBD in the presence of 1.5 mM S9OX. The changes in chemical shift resonances were calculated using weighted combination of chemical shifts given by: , where ΔδH and ΔδN are differences in chemical shifts of 1H and 15N, respectively, in the free and bound states (Williamson, 2013). The relative CSPs were obtained by dividing absolute CSP values by a standard deviation of the whole set of CSPs. The regions of the protein backbone that could not be unambiguously assigned are highlighted in gray. The secondary structure of FOXO3-DBD is indicated on top. The dotted and dashed lines indicate changes greater than the mean and the mean + 1σ0corr, respectively. (c) Observed CSPs mapped onto the solution structure of FOXO3-DBD (Wang et al., 2008). Ribbon and surface representations are shown at right and left, respectively. Thirteen residues whose 1H-15N resonances were significantly perturbed (1σ0corr above the mean) are shown in red. Selected signals from the 1H-15N HSQC spectra of 250 μM FOXO3-DBD in the presence of various concentrations of S9OX are shown in inset. (d) Structural model of FOXO3-DBD with bound S9. The best flexible docking solution consistent with data from 1H-15N HSQC and STD measurements is shown.
Figure 2—figure supplement 1
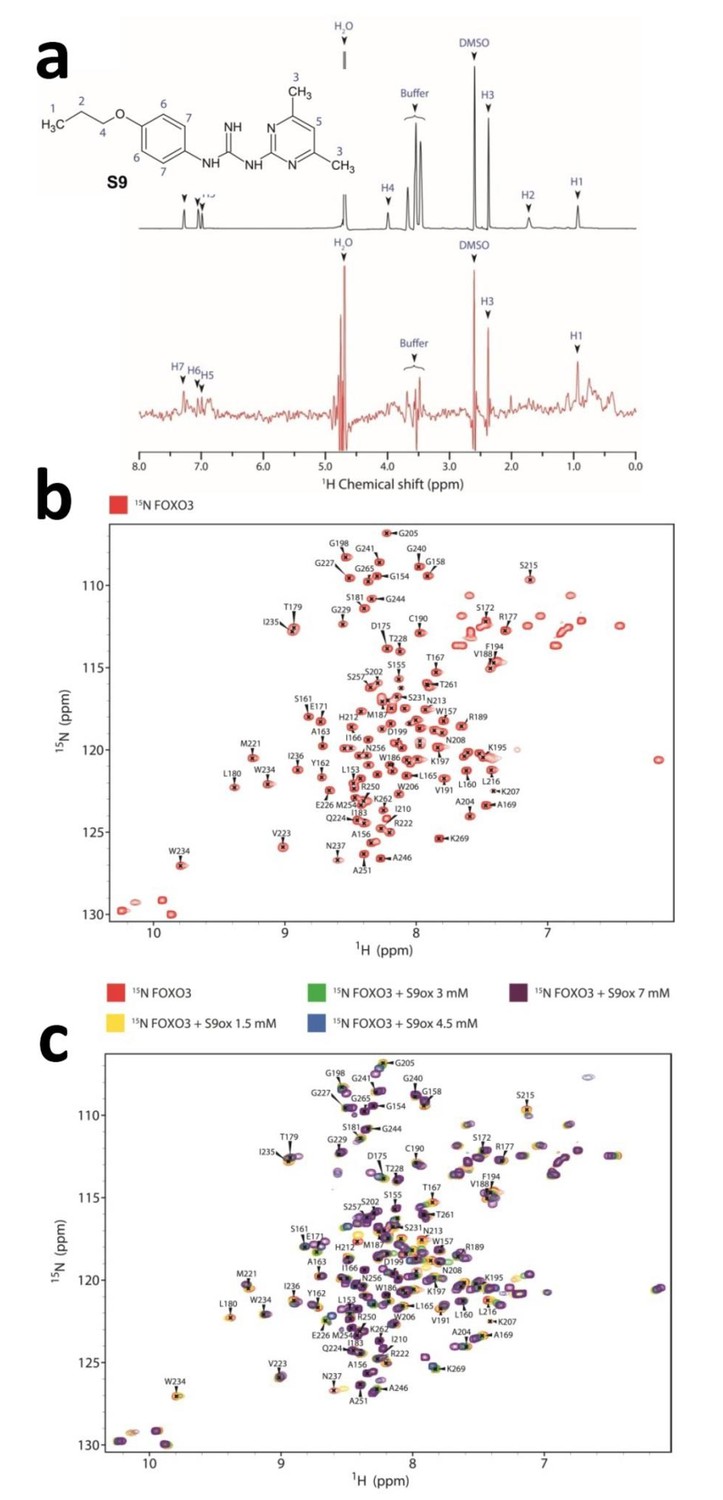
S9 binding to FOXO3-DBD.
(a) 1D 1 H STD-NMR experiments for S9 compound in the presence of the 15 µM FOXO3-DBD. The reference spectrum of S9 is shown in black, the corresponding STD-NMR spectrum is shown in red. Chemically equivalent hydrogens in S9 molecule are numbered from 1 to 7. 10% dimethyl sulfoxide (DMSO) was added to the buffer to increase the S9 solubility. (b) 1 H- 15 N HSQC spectrum of 15 N-labeled FOXO3-DBD. (c) 1 H- 15 N HSQC spectra of 15 N-labeled FOXO3-DBD in the absence of S9ox (red) and in the presence of various concentrations of S9ox. The interaction induced both the change in signal positions or significant signal intensity reduction in the 1 H- 15 N HSQC spectrum of FOXO3-DBD.
Figure 2—figure supplement 2
Comparison of S9OX binding to various FOXO proteins.
The comparison of chemical shift perturbation (CSP) obtained for 100 μM FOXO1- DBD (red), FOXO3-DBD (blue) and FOXO4-DBD (yellow) in the presence of 3 mM S9OX. Lines indicate changes greater than the mean (FOXO1-DBD, dotted line, CSP > 0.011; FOXO3-DBD, dashed line, CSP > 0.014; FOXO4-DBD, solid line, CSP > 0.012). The relative CSPs were calculated as described in the legend of Figure 2. The regions of the protein backbone that could not be unambiguously assigned are highlighted in grey. The horizontal axis in the upper panel shows mouse FOXO1 sequence.
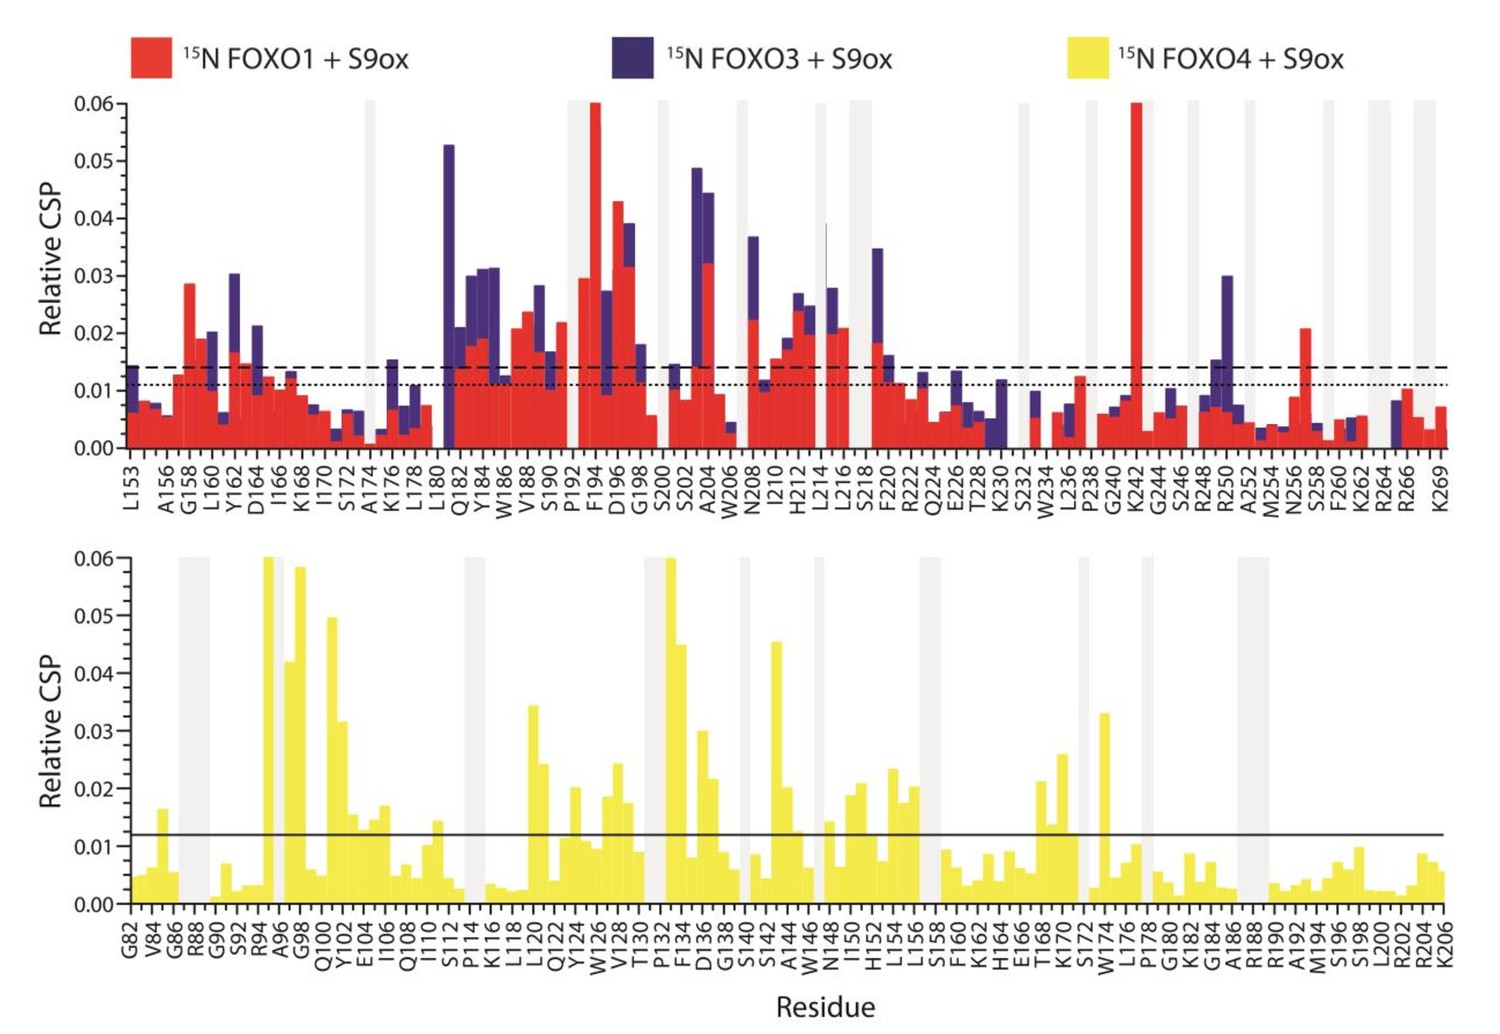
Figure 3
Compounds S9/S9OX affect induction of FOXO3 target gene mRNAs.
(a) Heatmaps of Affymetrix microarray analyses (U133 plus 2.0 expression profiling chips). Total RNA was prepared of SH-EP/FOXO3 cells treated with 100 nM 4OHT alone or in combination with 50 µM S9 for three hours. Expression heatmap shows average expression of the differentially expressed genes within three replicates in each condition. The rows were scaled around 0. (b) Left volcano blot shows log2 fold changes of all probesets on the microarray on x-axis and the significance level (-log10(p-value)) on the y-axis – probesets significantly induced by FOXO3 are in red. The right volcano blot shows log2 fold change of S9+4OHT as compared to FOXO3-induced probesets. (c) Venn diagram showing numbers of genes regulated in common when cells with activated FOXO3 were treated with S9 or solvent as control. (d) NOXA, (e) BIM, (f) SESN3, and (g) DEPP1 mRNA levels were measured by quantitative RT-PCR in SH-EP/FOXO3 cells after treatment with 100 nM 4OHT for three hours alone or in combination with 50 µM S9 or S9OX (cells were preincubated with compounds for 30 min). Bars represent mean + SD of three independent experiments, each performed in triplicates (untreated control was set as 100%). Significant differences between 4OHT treatment and S9+4OHT or S9OX+4OHT: *p<0.05, **p<0.01 (students t-test, two-tailed).
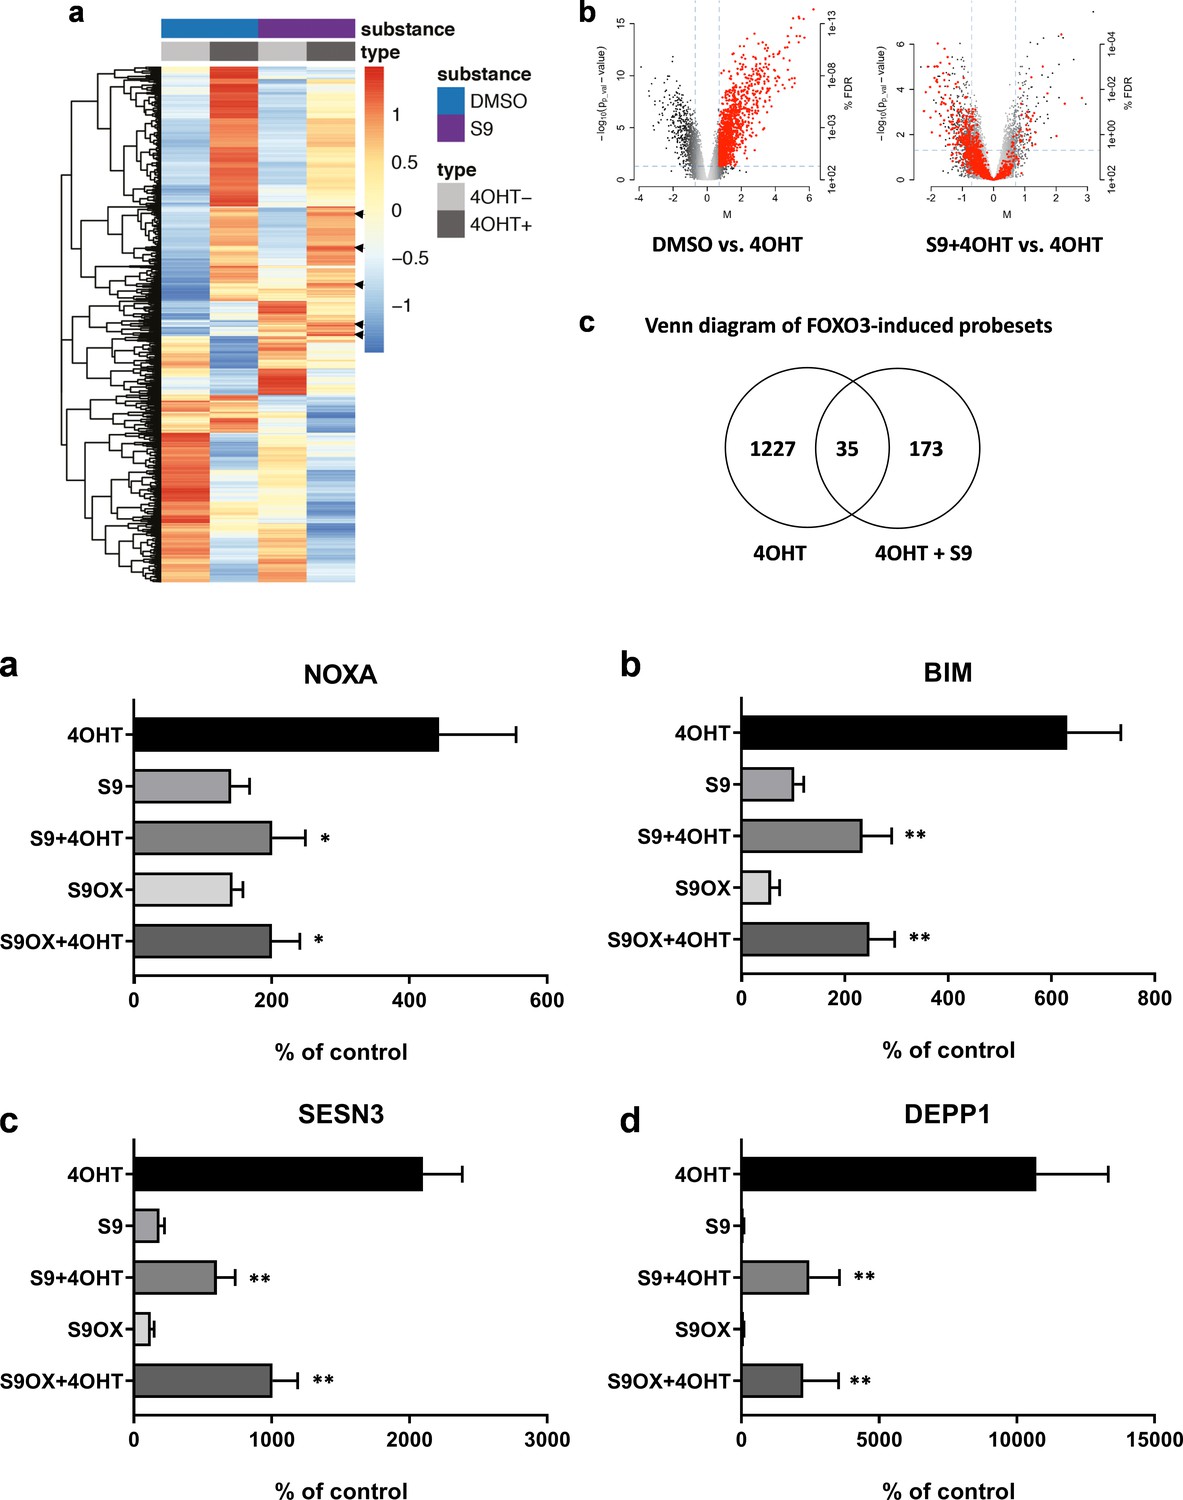
Figure 4
Compounds S9 and S9OX inhibit protein expression of FOXO3-regulated proteins and prevent binding of FOXO3 to target promoters.
SH-EP/FOXO3 cells were treated for eight hours (a,b) or 24 hr (c,d) with 100 nM 4OHT alone or in combination with 50 µM S9 or S9OX. Cell lysates were subjected to immunoblot analyses using antibodies against NOXA and BIM (8 hr) or SESN3 and DEPP1 (24 hr). Shown are representative immunoblots (a,c) or densitometric analyses of three independent cell lysates mean values + SD. Regulations are expressed as fold over DMSO-control (100%). Significant differences between 4OHT treatment and S9+4OHT or S9OX+4OHT were analyzed by students t-test: *p<0.05, **p<0.01, ***p<0.001; two-tailed. (e) ChIP analyses were performed in SH-EP/FOXO3 cells treated with 100 nM 4OHT for three hours alone or in combination with 50 µM S9. Binding of FOXO3 to the promoter regions of BIM, NOXA, SESN3, and DEPP1 was measured by quantitative PCR. Shown is the mean value + SD of three independent experiments, each performed in duplicates. Significantly different to untreated cells: *p<0.05, **p<0.01, ***p<0.001, two-tailed. (f) Binding of FOXO3 to the promoter region of DEPP1 was assessed after transfection of a DEPP1-luciferase reporter plasmid into SH-EP/FOXO3 cells. 24 hr after transfection cells were seeded into 24 well plates. After adherence for another 24 hr, cells were treated for three hours with 100 nM 4OHT with or without increasing amounts of S9 (preincubated for 30 min). Firefly-luciferase was analyzed using the Luciferase Assay System (Promega). The increase of light emission (relative light units, RLU) was calculated as percent of untreated controls. Shown are mean values + SD of four independent experiments, each performed in triplicate. Significant differences between 4OHT treatment and S9+4OHT: *p<0.05, **p<0.01 (students t-test, two-tailed).
Figure 5
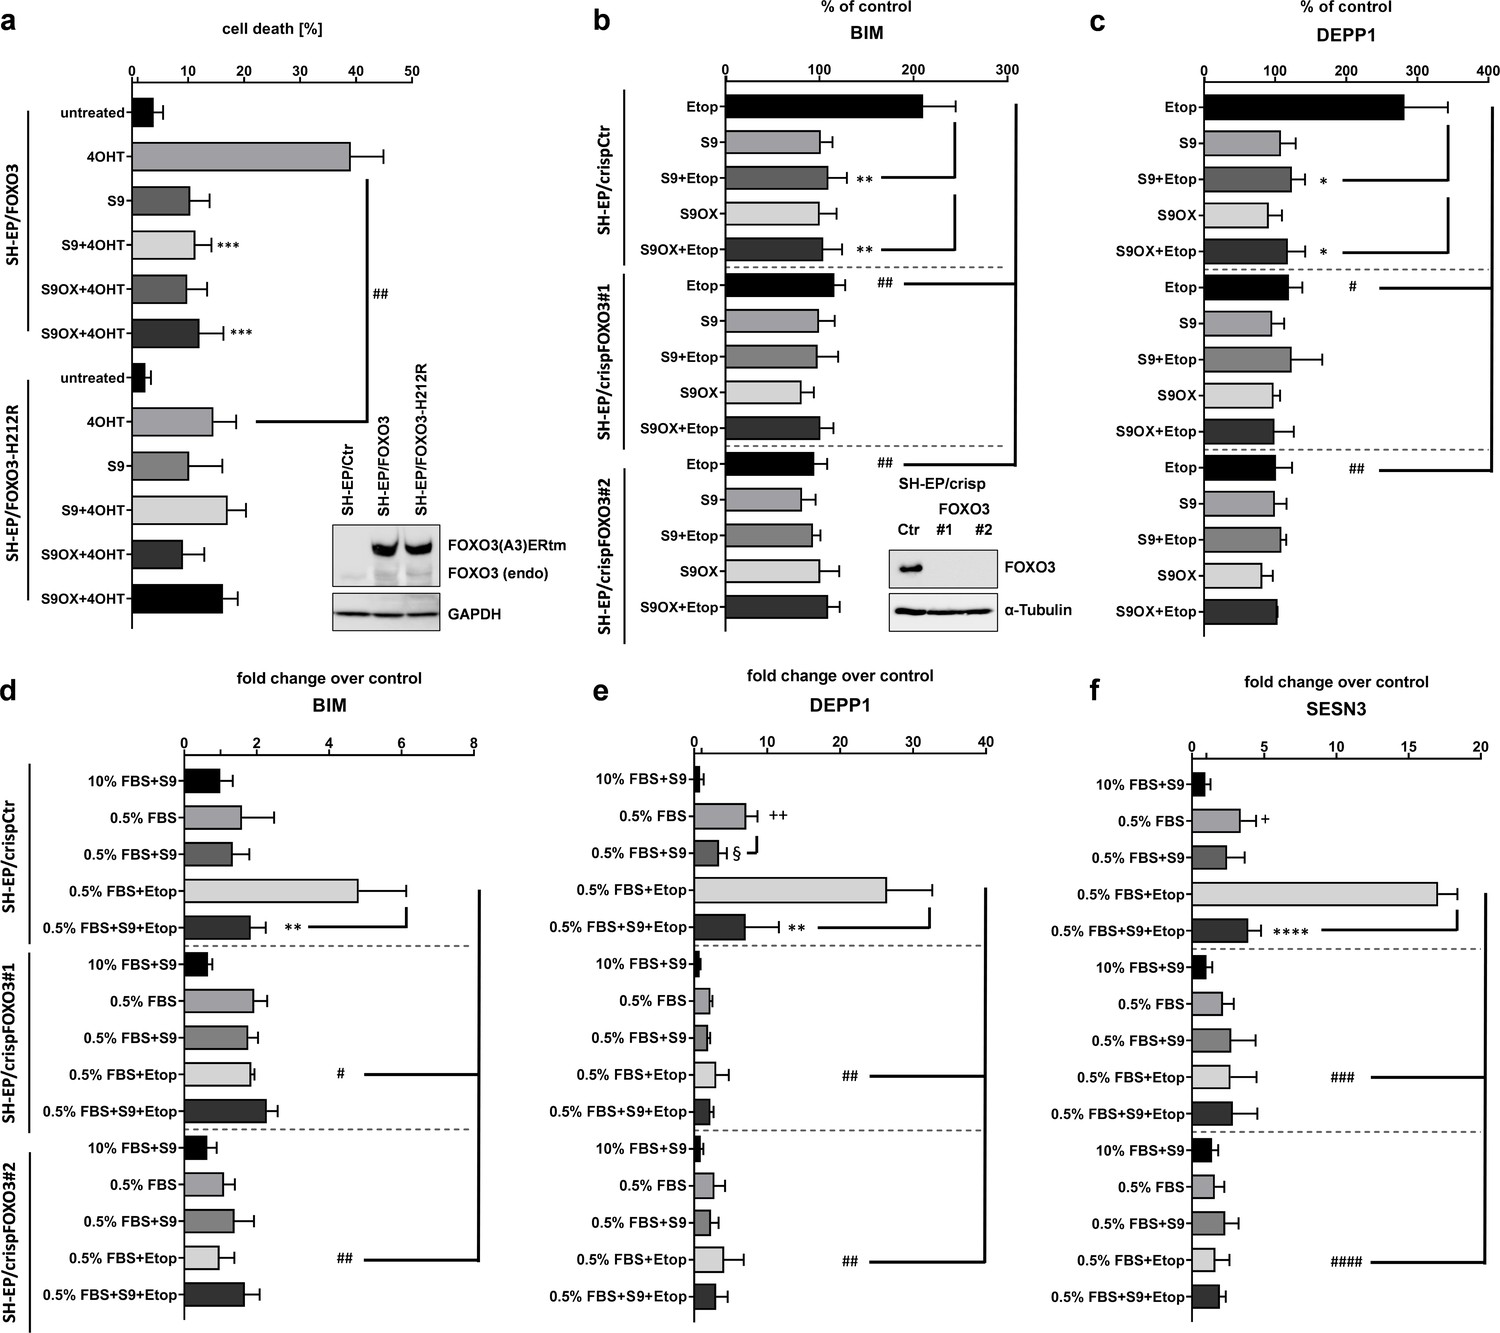
Selectivity assessment of S9 and S9OX for FOXO3.
SH-EP cells expressing a conditionally activated FOXO3(A3)-ERtm-H212R mutant or FOXO(A3)-ERtm were analyzed by immunoblot, treated with 20 nM 4OHT with or without 50 µM S9 or S9OX and subjected to flow cytometric cell death analyses after 48 hr (a). Shown is the mean of four independent experiments (two-tailed students t-test: ##p<0.01, ***p<0.001). To assess whether S9- or S9OX-mediated inhibition of FOXO target gene regulation relies on endogenous FOXO3 we generated FOXO3 knock-out cells using CRISPR/Cas9 technology. Immunoblot demonstrates complete loss of endogenous FOXO3 expression in lines #1 and #2. SH-EP/crispCtr and SH-EP/crispFOXO3#1 and #2 cells were transfected with either a Bim-promoter-, a DEPP1-promoter-, or control luciferase reporter plasmid. 24 hr after transfection cells were seeded into 24 wells and kept under 0.5% FBS for 16 hr. Pre-incubation (30 min) with 50 µM S9 or S9OX was performed before 20 µg/ml etoposide were applied for three hours. Luciferase-activity of Bim- and DEPP1-promoters was assessed using Luciferase Assay System (Promega) according to manufacturer’s instructions. RLU were normalized to control luciferase reporter and expressed as % of control. Shown is the mean of three independent experiments (two-tailed students t-test: #p<0.05, ##p<0.01, *p<0.05, **p<0.01; b, c). SH-EP/crispCtr and SH-EP/crispFOXO3#1 and #2 cell lines were kept at 10% FCS or 0.5% FCS for 16 hr, treated for 30 min with 50 µM of compounds S9 and then for another three hours with 20 µg/ml etoposide as indicated. Effect of endogenous expression of Bim (d), DEPP1 (e) and SESN3 (f) was assessed by quantitative RT-PCR. Shown is the mean of three independent experiments each performed in triplicate (two-tailed students t-test: #p<0.05, ##p<0.01, ###p<0.001, +p<0.05, ++p<0.01, *p<0.05, **p<0.01, §<0.05).
Figure 6
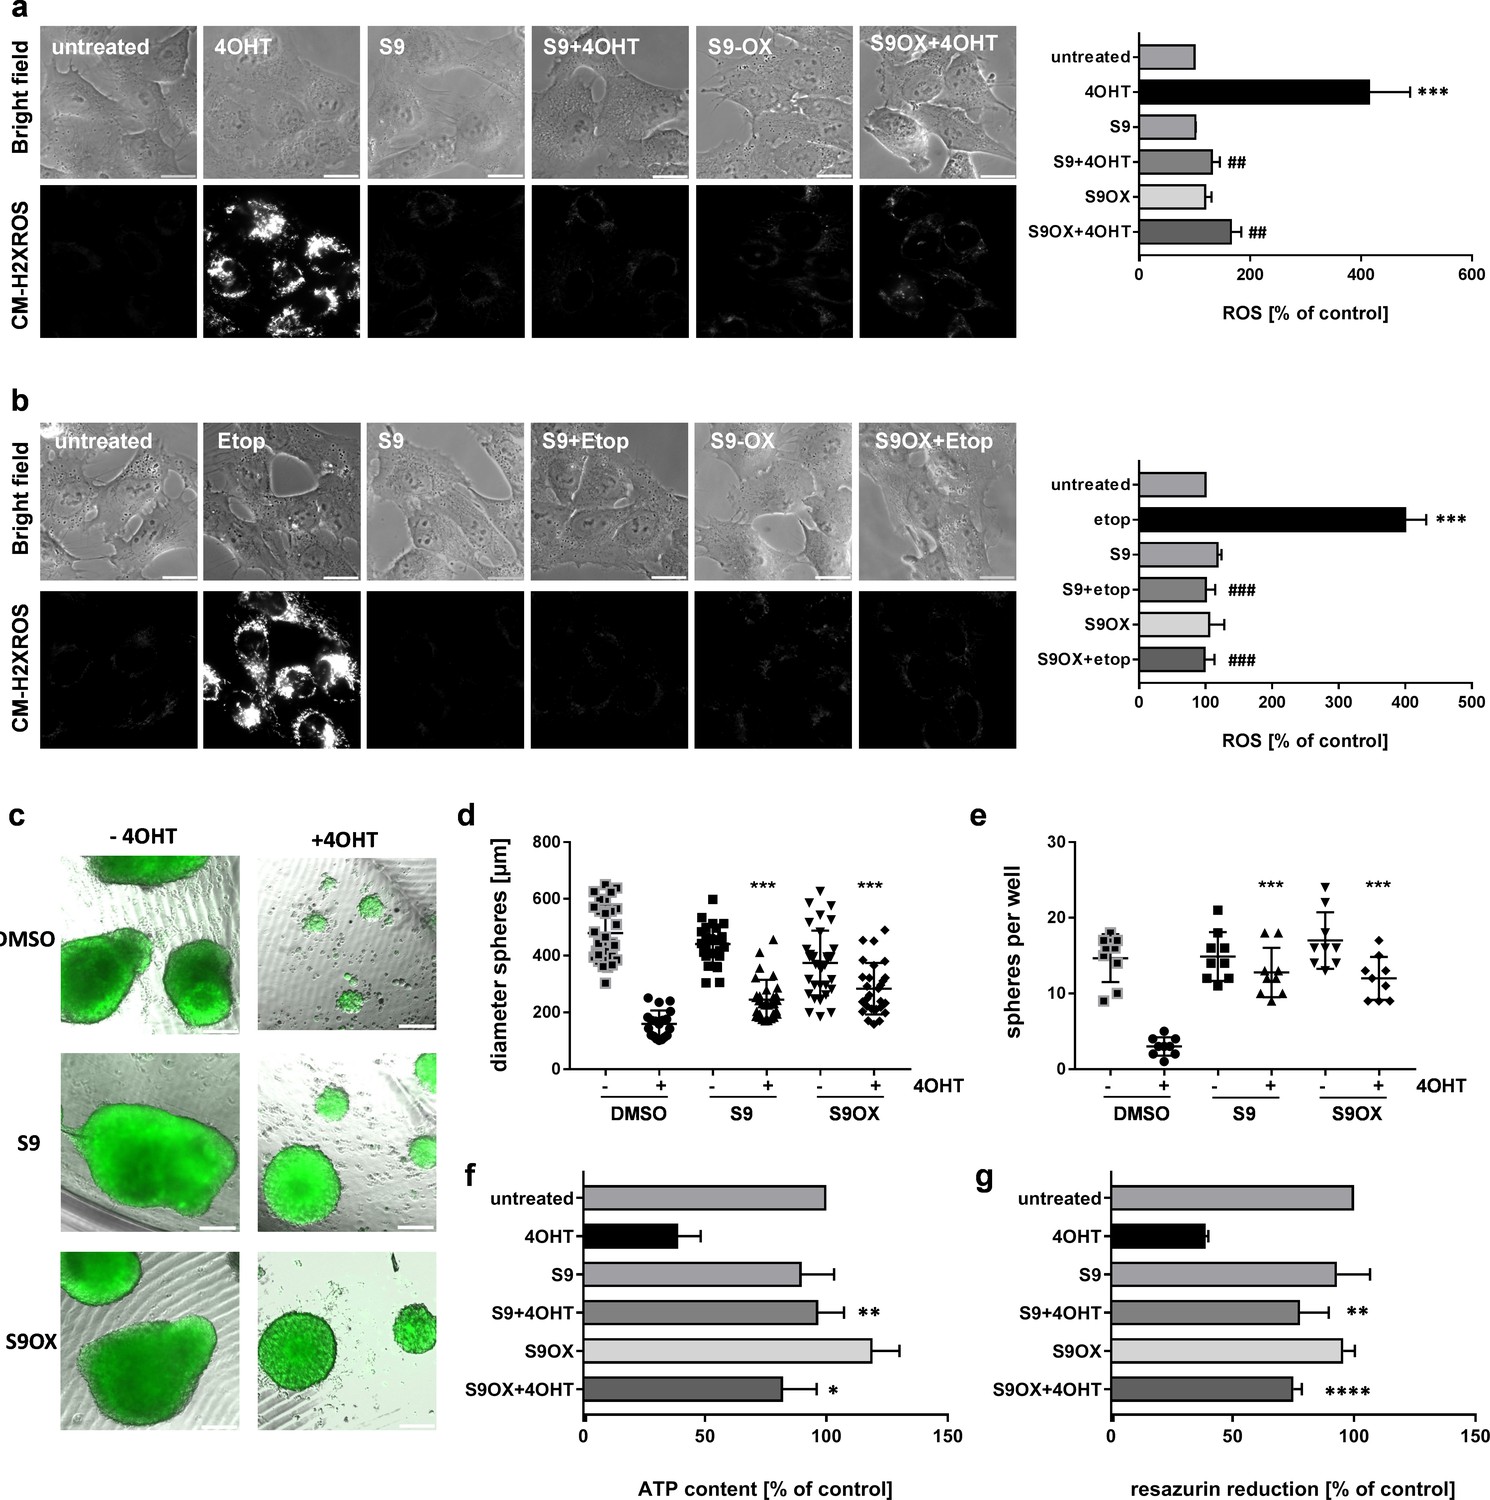
Effects of compounds S9/S9OX on FOXO3-induced ROS and sphere growth in 3D cell culture models.
SH-EP/FOXO3 cells were treated either for four hours with 100 nM 4OHT (a) or for two hours with 20 µg/ml etoposide (b). 50 µM S9 or S9OX were pre-incubated for 15 min. ROS accumulation was analyzed using CM-H2XROS (500 nM). Images were acquired by live-cell imaging using an Axiovert200M microscope, equipped with a 63x oil objective, bar 20 µm. Shown are representative images (left panel) or densitometric analyses of three independent experiments (more than 15 cells per experiment were quantified) using AxioVision software version 4.8; Significantly different to untreated cells (students t-test, two-tailed): ***p<0.001; significantly different between 4OHT-treatment and S9+4OHT or S9OX+4OHT cells: ##p<0.01, ###p<0.001; significantly different between etop-treatment and S9+etop or S9OX+etop cells: ###p<0.001. 3D spheroids of NB15/FOXO3-GFP cells that express a 4OHT-regulated FOXO3 allele and constitutively EGFP were formed by magnetic bioprinting for 72 hr before treatment with 10 nM 4OHT alone or in combination with 5 µM S9 or S9OX for another 72 hr. After one week, spheroids were analyzed by live cell microscopy and further used for viability analyses. Shown are representative images (c) and sphere size/mean diameter (d) as well as the number of spheroids per well (e) out of three independent experiments. Statistical differences between single 4OHT treatment or combinational treatment were assessed by Mann-Whitney test (two-tailed ***P<0.001). Viability of spheroids was assessed by measuring of ATP content (f) and resazurin reduction (g). Shown are mean values + SD of three independent experiments each performed with spheres of eight different wells. Statistical differences were assessed by students t-test (two-tailed) between 4OHT-DMSO and 4OHT-compound (*P<0.05, **P<0.01, ****p<0.0001).
Additional files
-
Supplementary file 1
Synthesis of S9 and S9OX.
- https://cdn.elifesciences.org/articles/48876/elife-48876-supp1-v3.pdf
-
Supplementary file 2
Key Resources Table.
- https://cdn.elifesciences.org/articles/48876/elife-48876-supp2-v3.doc
-
Transparent reporting form
- https://cdn.elifesciences.org/articles/48876/elife-48876-transrepform-v3.pdf
Download links
A two-part list of links to download the article, or parts of the article, in various formats.
Downloads (link to download the article as PDF)
Open citations (links to open the citations from this article in various online reference manager services)
Cite this article (links to download the citations from this article in formats compatible with various reference manager tools)
Modulating FOXO3 transcriptional activity by small, DBD-binding molecules
eLife 8:e48876.
https://doi.org/10.7554/eLife.48876


