Synaptic mitochondria regulate hair-cell synapse size and function
- National Institute on Deafness and Other Communication Disorders, National Institutes of Health, United States
Figures
Figure 1 with 2 supplements

Mito-Ca2+ uptake initiates adjacent to ribbons.
(A) Cartoon illustration of a lateral-line hair cell containing: an apical mechanosensory bundle (blue), mitochondria (green), presynaptic ribbons (magenta), CaV1.3 channels (orange) and postsynaptic densities (purple). (B) Airyscan confocal image of 6 live hair cells (1 cell outlined in white) expressing MitoGCaMP3 (mitochondria) and Ribeye a-tagRFP (ribbons) in a developing neuromast at 2 dpf. Also see Figure 1—figure supplement 1. (C) A representative TEM showing a mitochondrion (m) in close proximity to a ribbon (R) at 4 dpf. (D) Quantification of mitochondrion to ribbon distance in TEM sections (n = 17 ribbons). (E) Side-view of a hair cell (outlined in white) shows the spatio-temporal dynamics of evoked mito-Ca2+ signals during a 2 s stimulation at 6 dpf. The change in MitoGCaMP3 signal (∆F) from baseline is indicated by the heatmap and are overlaid onto the pre-stimulus grayscale image. (E’-E’’) Circles 1–3 (1.3 μm diameter) denote regions used to generate the normalized (∆F/F0) temporal traces of mito-Ca2+ signals in E’’: adjacent to the presynapse (‘1’), and midbody (‘2’ and ‘3’) in the same cell as E. (F) Average evoked mito-Ca2+ response before (solid black) and after 30 min treatment with 10 μM Ru360 (dashed green), 2 μM Ru360 (solid green), or 10 μM isradipine (gray) (3–5 dpf, n ≥ 9 cells per treatment). Error bars in D are min and max; in F the shaded area denotes SEM. Scale bar = 500 nm in C, 5 µm in B and 2 µm in E and E’.
-
Figure 1—source data 1
Summary of quantified TEM data and mito-Ca2+ trace data.
- https://cdn.elifesciences.org/articles/48914/elife-48914-fig1-data1-v2.xlsx
Figure 1—figure supplement 1
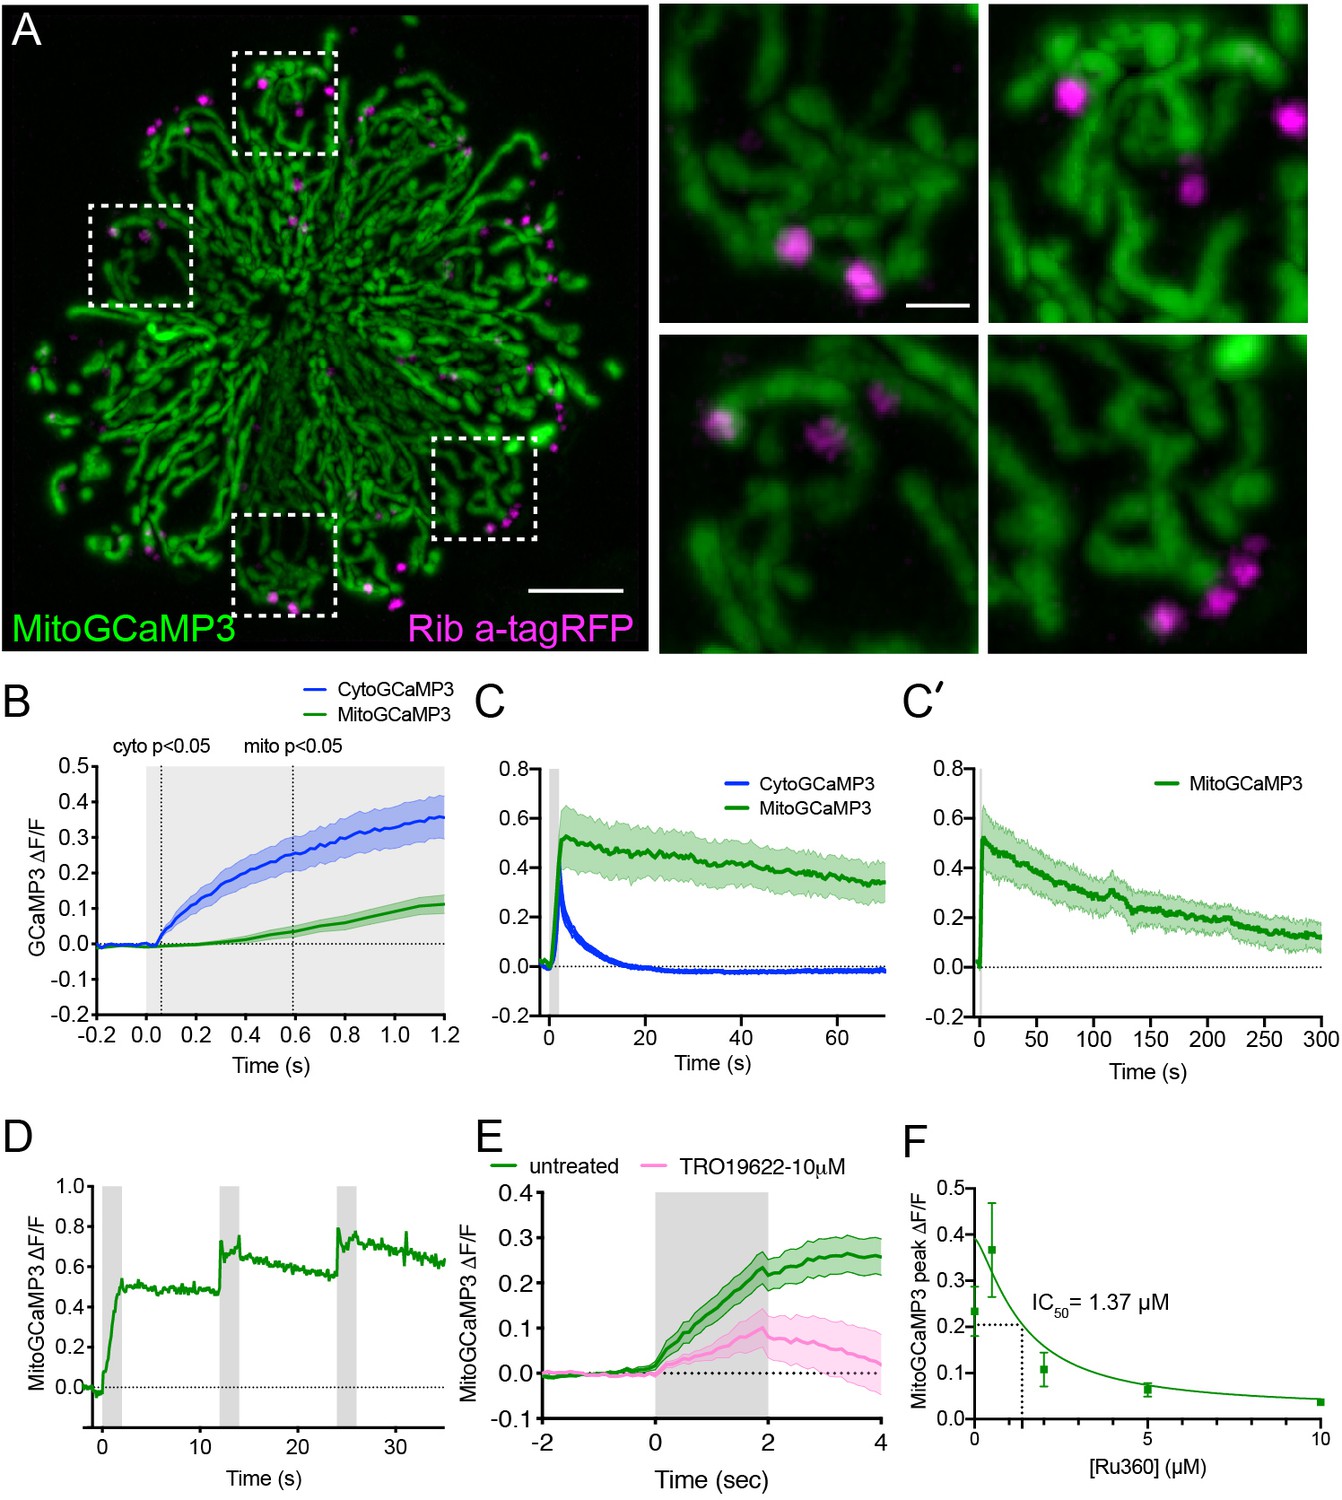
The time course of mechanically-evoked mito-Ca2+ signals are longer-lasting than cyto-Ca2+ signals.
(A) Airyscan confocal image of a live neuromast expressing MitoGCaMP3 (mitochondria) and Ribeye a-tagRFP (ribbons) at 6 dpf. Insets show the base of 4 individual hair cells from the neuromast in A (dashed white boxes). (B) Average cyto-Ca2+ (blue) and mito-Ca2+ (green) ∆F/F GCaMP3 signals during the onset of a 2 s stimulus. Mito-Ca2+ signals rise with a delay compared to cyto-Ca2+ signals, 3–6 dpf, n ≥ 18 cells. (C-C’) Average cyto-Ca2+ and mito-Ca2+ ∆F/F GCaMP3 signals during and after a 2 s stimulation shows that cyto-Ca2+ signals return to baseline shortly after stimulation (C) while mito-Ca2+ remains elevated up to 5 min after stimulation (C–C’), 3–6 dpf, n ≥ 7 cells. (D) A series of 3, evoked 2 s stimuli initiated at: t = 0–2, 12–14 and 24–26 s. A rise in MitoGCaMP3 can be detected during each stimulus, prior to MitoGCaMP3 signals returning to baseline. (E) 10 µM of the VDAC inhibitor TRO 19622 partially blocks evoked MitoGCaMP3 signals, 5 dpf, n = 15 cells. (F) A dose response curve indicates that Ru360 blocks evoked MitoGCaMP3 signals with an IC50 value of 1.37 µM at 5 dpf, n ≥ 9 cells per dose. Error in panel (B-C’) E and F represent SEM. Scale bar = 5 µm in A and 2 µm in inset.
-
Figure 1—figure supplement 1—source data 1
Summary CytoGCaMP3 and MitoGCaMP3 traces and MitoGCaMP3 data used to generate Ru360 dose response curve.
- https://cdn.elifesciences.org/articles/48914/elife-48914-fig1-figsupp1-data1-v2.xlsx
Figure 1—figure supplement 2
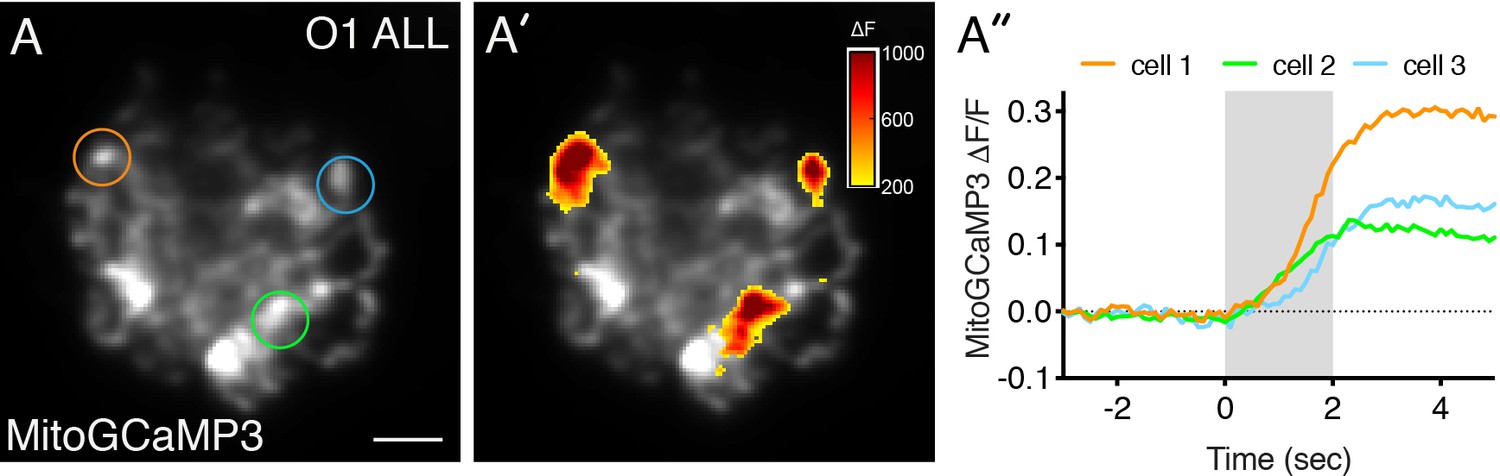
Mito-Ca2+ uptake occurs in anterior lateral-line hair cells.
(A) A live Image of an anterior-lateral line (ALL) neuromast viewed top-down, expressing the mito-Ca2+ sensor MitoGCaMP3 at 5 dpf. (A’) shows the spatio-temporal dynamics of evoked mito-Ca2+ signals during a 2 s stimulation. The MitoGCaMP3 signals during the stimulation (∆F) are indicated by the heatmap overlaid onto the baseline grayscale image. (A’’) Temporal traces of evoked mito-Ca2+ signals were generated from three regions denoted by three circles in A. Scale bar = 5 µm in A.
-
Figure 1—figure supplement 2—source data 1
MitoGCaMP3 traces in anterior lateral line hair cells.
- https://cdn.elifesciences.org/articles/48914/elife-48914-fig1-figsupp2-data1-v2.xlsx
Figure 2 with 1 supplement
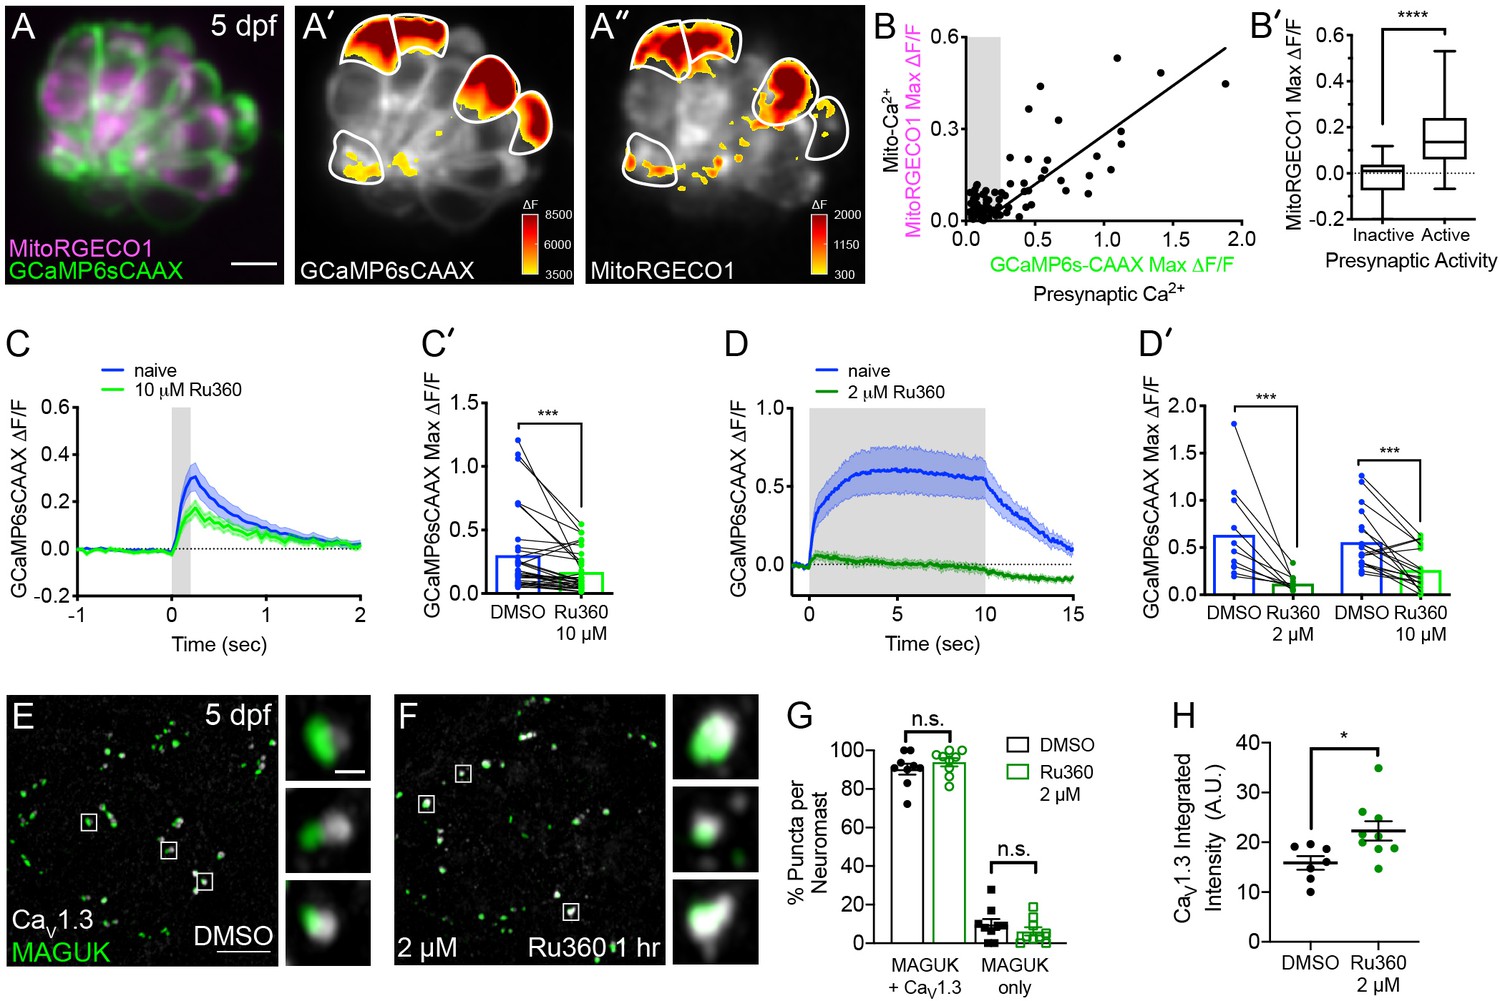
Mito-Ca2+ uptake can impact presynaptic-Ca2+ signals.
(A) A live Image of a neuromast viewed top-down, expressing the presynaptic-Ca2+ sensor GCaMP6sCAAX (green) and mito-Ca2+ sensor MitoRGECO1 (magenta) at 5 dpf. A’-A’’, GCaMP6sCAAX (A’) and MitoRGECO1 (A’’) signals (∆F) from baseline during a 2 s stimulation are indicated by the heatmaps and occur in the same cells (white outline). (B) Scatter plot with linear regression of peak presynaptic- and mito-Ca2+ response for individual cells at 4–5 dpf, n = 136 cells. Gray background in graph denotes presynaptic-Ca2+ signals below 0.25, a threshold used as a cutoff for presynaptic activity (below inactive, above active). (B’) Plot of mito-Ca2+responses segregated based on the activity threshold in B. (C-D’) Presynaptic-Ca2+ response (example in Figure 2—figure supplement 1C–C’) averaged per cell before (blue) and after a 30 min treatment with 10 μM Ru360 (light green) or 2 μM Ru360 (dark green), n ≥ 10 cells per treatment. C and D show averaged traces while C’ and D’ show before-and-after dot plots of the peak response per cell. (E-F) Representative images of mature neuromasts (5 dpf) immunostained with CaV1.3 (white, calcium channels) and MAGUK (green, postsynapses) after a 1 hr incubation in 0.1% DMSO (E) or 2 μM Ru360 (F). G-H, Scatter plots show percentage of postsynapses that pair with CaV1.3-channel clusters (CaV1.3 + MAGUK) and orphan postsynapses (MAGUK only) (G). The integrated intensity of CaV1.3-channel immunolabel at presynapses is lower in control compared to treatment group (H), n ≥ 7 neuromasts per treatment. Whiskers on plots in B’ represent min and max; the shaded area in plots C and D and the error bars in C’, D’ and G-H denotes SEM. Mann-Whitney U test was used in B’; Wilcoxon matched-pairs signed-rank test was used in C’ and D’. Welch’s unequal variance t-test was used in G-H. *p<0.05, ***p<0.001, ****p<0.0001. Scale bar = 5 µm in A and E.
-
Figure 2—source data 1
Summary of MitoRGECO1 and GCaMP6sCAAX and synapse quantification data.
- https://cdn.elifesciences.org/articles/48914/elife-48914-fig2-data1-v2.xlsx
Figure 2—figure supplement 1
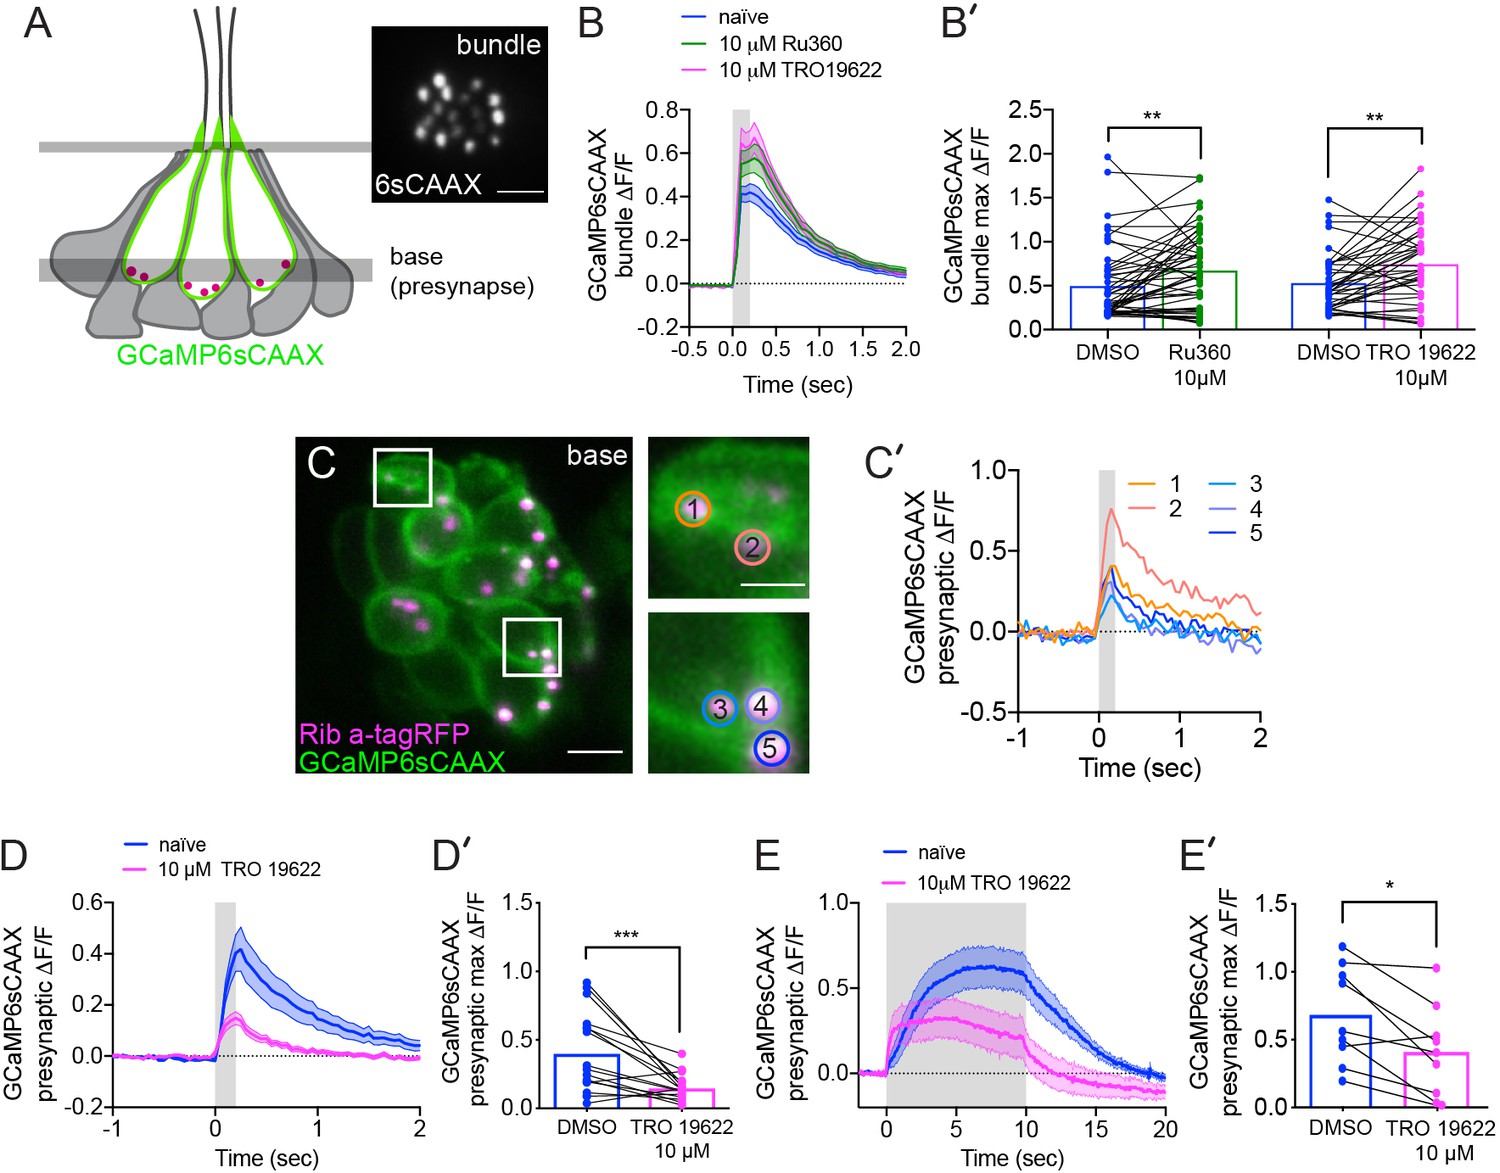
The effects of MCU and VDAC block on mechanotransduction and the effect of VDAC block on presynaptic-Ca2+ signals.
(A) Illustration of a neuromast and the imaging planes used to study the mechanotransduction in hair-bundles and the presynaptic-Ca2+ influx at ribbons. Localization of the membrane-localized Ca2+ sensor GCaMP6sCAAX shown in green. Inset in A shows an example top-down view of GCaMP6sCAAX bundle plane (6sCAAX) at 5 dpf. (B-B’) Bundle-Ca2+ signals before (blue) and after a 30 min treatment with 10 μM Ru360 (green) or 10 μM TRO 19622 (magenta), n ≥ 39 bundles per treatment. Average traces are shown in B while dot plots of the peak response per bundle are shown in B’. (C) Double-transgenic hair cells expressing GCaMP6sCAAX (At presynaptic membranes) and Ribeye a-tagRFP (Labels ribbons) at 5 dpf. Example cells in presynaptic imaging plane are boxed in white and duplicated in right insets. (C’) Example cells show evoked presynaptic-Ca2+ signals at ribbons during a 0.2 s stimulation. Circles 1–5 (1.3 μm diameter) in insets in C denote regions at ribbons used to generate the temporal traces of presynaptic-Ca2+ signals at each ribbon in C’. Similarly-colored traces of presynaptic-Ca2+ signals originate from different presynapses of the same cell. (D-E’) Presynaptic-Ca2+ signals averaged per cell before (blue) and after a 30 min 10 μM TRO 19622 (magenta), n ≥ 9 cells per treatment. D and E show averaged traces while D’ and E’ show before-and-after treatment dot plots of the peak response per cell. Error in panel B-B’, D-E’ represent SEM. A Wilcoxon matched-pairs signed-rank test was used in B’,D’ and E’. *p<0.05, **p<0.01, ***p<0.001. Scale bar = 5 µm in A and C and 2 µm in C inset.
-
Figure 2—figure supplement 1—source data 1
Mechanosensitive and presynaptic GCaMP6sCAAX traces and quantification after Ru360 and TRO 19622 application.
- https://cdn.elifesciences.org/articles/48914/elife-48914-fig2-figsupp1-data1-v2.xlsx
Figure 3 with 2 supplements
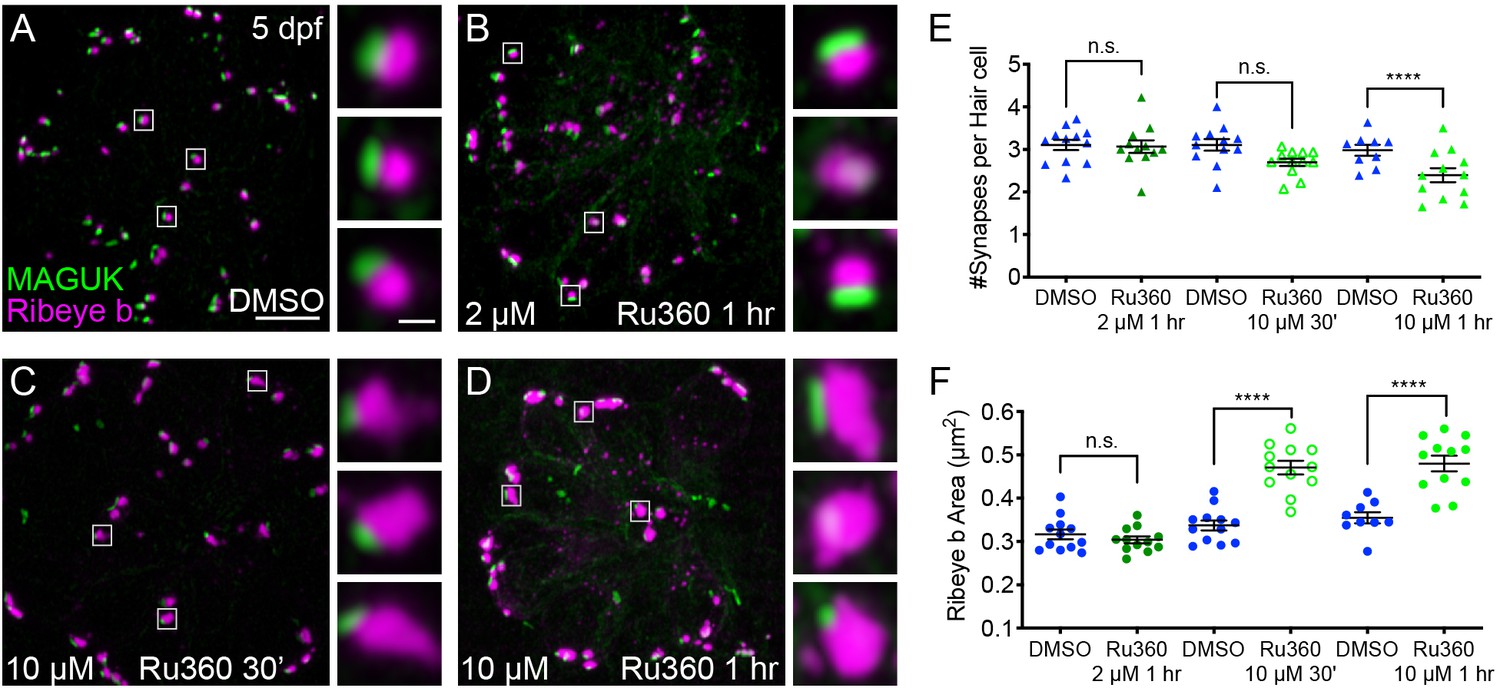
Mito-Ca2+ is important for ribbon size and synapse integrity in mature hair cells.
(A-D) Representative images of mature neuromasts (5 dpf) immunostained with Ribeye b (magenta, ribbons) and MAGUK (green, postsynapses) after a 1 hr 0.1% DMSO (A), a 1 hr 2 μM Ru360 (B), a 30 min 10 μM Ru360 (C), or a 1 hr 10 μM Ru360 (D) treatment. Insets show three example synapses (white squares). E-F, Scatter plots show synapse counts (E), and ribbon area (F) in controls and in treatment groups. Ribbon areas, synapse numbers, and hair-cell counts are unaffected after a 1 hr 2 µM Ru360 treatment. Ribbon areas are larger and there are fewer synapses without significant loss of hair cells after a 30 min treatment with 10 µM Ru360 (F). After a 1 hr 10 µM Ru360 treatment there is an increase in ribbon area and a decrease in synapse (E) and hair-cell counts. N ≥ 9 neuromasts per treatment. Error bars in E-F represent SEM. An unpaired t-test was used in E and a Welch’s unequal variance t-test was used in F. ****p<0.0001. Scale bar = 5 µm in A, and 2 µm in inset.
-
Figure 3—source data 1
Summary of synapse number and ribbon area after Ru360.
- https://cdn.elifesciences.org/articles/48914/elife-48914-fig3-data1-v2.xlsx
Figure 3—figure supplement 1
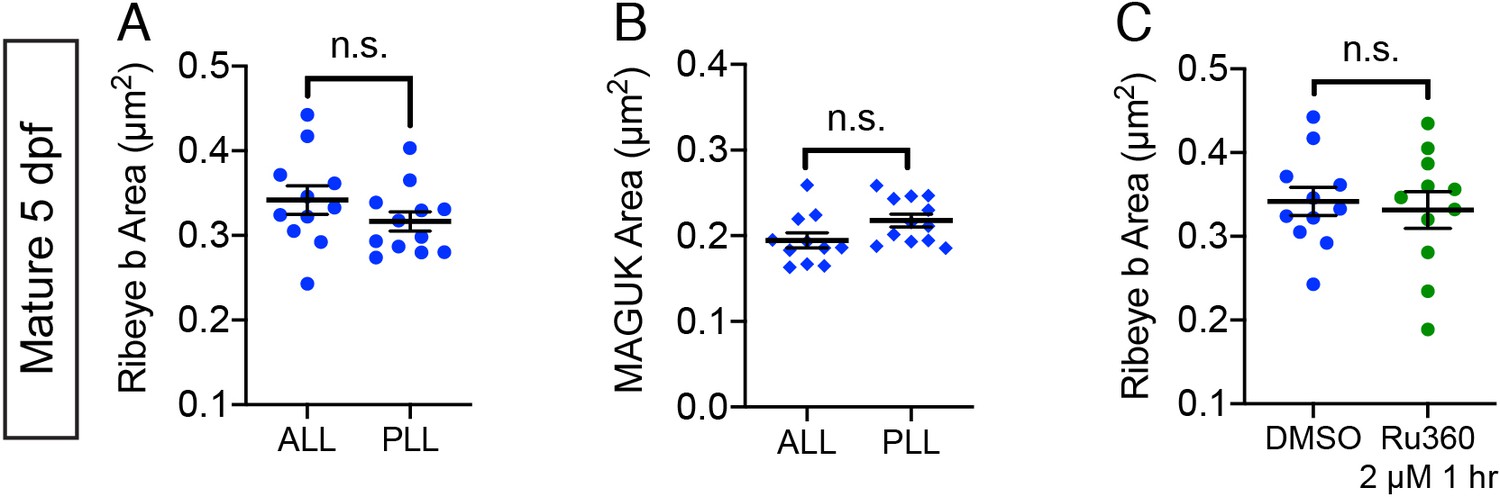
Ribbon and postsynapse size in mature ALL neuromasts.
(A-B) Scatter plots show that ribbon areas (A) and postsynaptic density areas (B) within the same fish are similar between mature anterior lateral-line (ALL) and posterior lateral-line (PLL) neuromasts. (C) Scatter plots show ribbon areas in controls and after a 1 hr treatment with 2 µM Ru360 are similar in mature hair cells within the ALL. Ribbon sizes of untreated anterior lateral-line hair cells are from the same data as A and (C) n ≥ 10 neuromasts per treatment; error bars represent SEM; and a Welch’s unequal variance t-test was used for comparisons.
-
Figure 3—figure supplement 1—source data 1
Summary of data comparing anterior and posterior lateral-line synapses in mature hair cells.
- https://cdn.elifesciences.org/articles/48914/elife-48914-fig3-figsupp1-data1-v2.xlsx
Figure 3—figure supplement 2
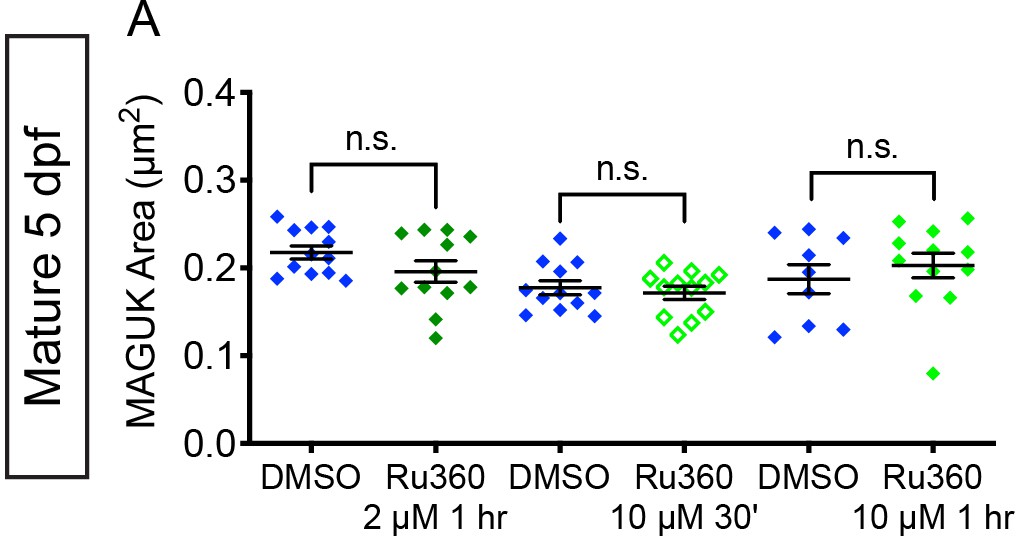
MCU block does not impact postsynapse size in mature hair cells.
(A) Quantification of postsynapse size assayed by MAGUK immunolabel in mature neuromasts indicate the treatments with 2 µM Ru360 and 10 µM Ru360 do not significantly alter postsynapse size compared to controls, n ≥ 9 neuromasts per treatment. Error bars represent SEM. A Welch’s unequal variance t-test was used for comparisons.
-
Figure 3—figure supplement 2—source data 1
Summary of MAGUK area measurements after Ru360 treatments in mature hair cells.
- https://cdn.elifesciences.org/articles/48914/elife-48914-fig3-figsupp2-data1-v2.xlsx
Figure 4 with 1 supplement
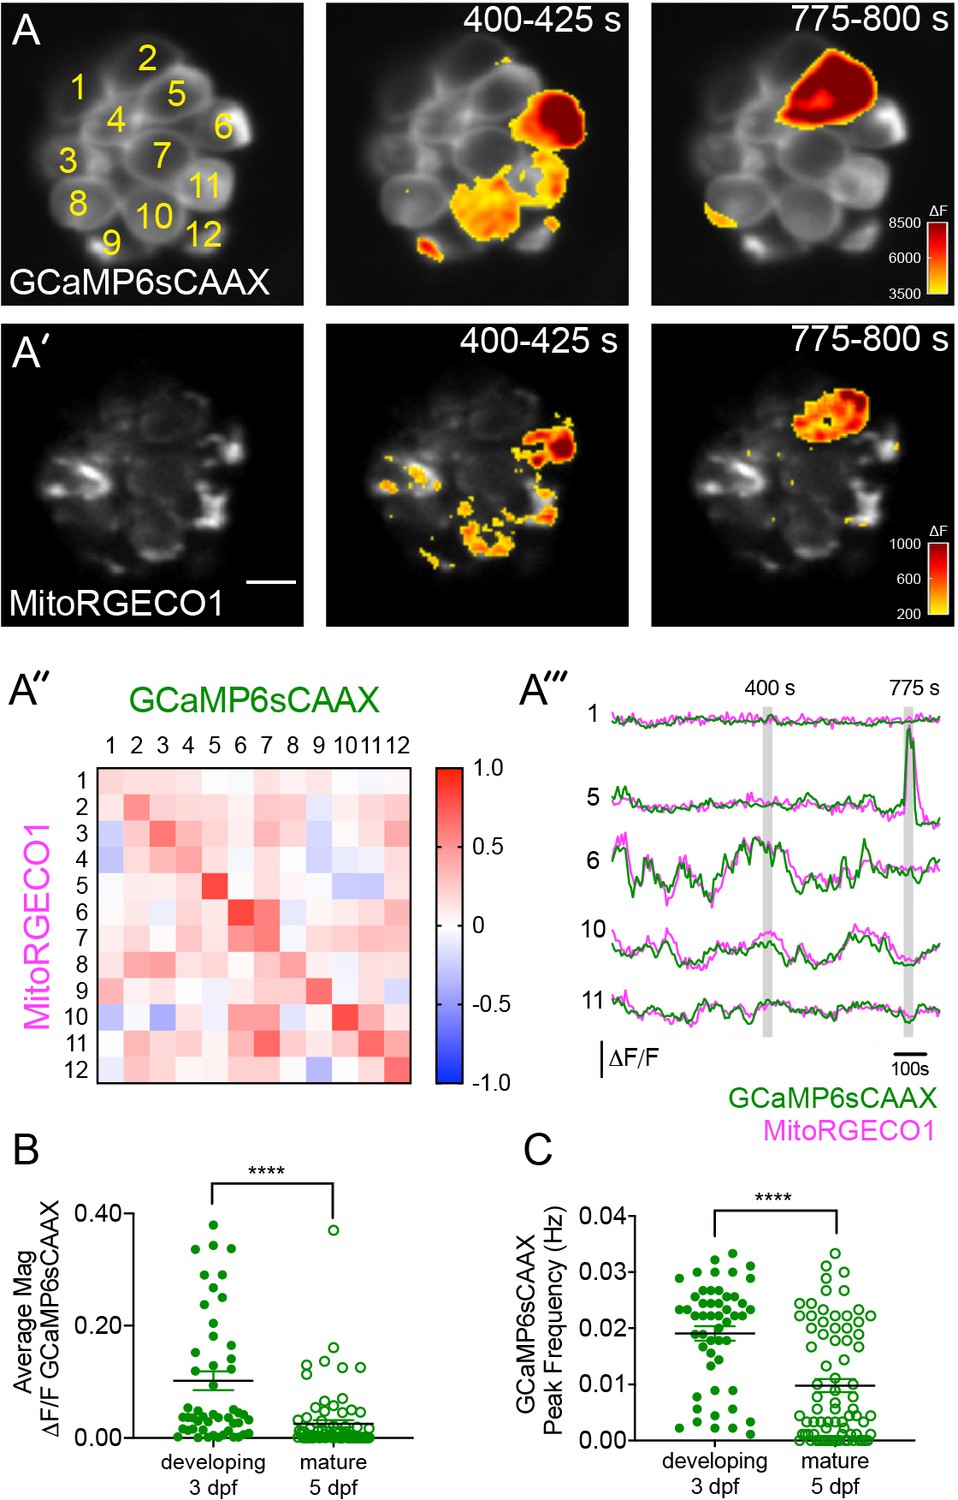
Spontaneous presynaptic- Ca2+ influx and mito-Ca2+ uptake are linked.
(A-A’) A live Image of an immature neuromast viewed top-down, expressing the presynaptic-Ca2+ sensor GCaMP6sCAAX (A) and mito-Ca2+ sensor MitoRGECO1 (A’) at 3 dpf. Example GCaMP6sCAAX (A’) and MitoRGECO1 (A’) signals during two 25 s windows within a 900 s acquisition are indicated by the ∆F heatmaps and occur in the same cells. (A’’) A heatmap of Pearson correlation coefficients comparing GCaMP6sCAAX and MitoRGECO1 signals from the cells in A-A’. (A’’’) Example GCaMP6sCAAX (green) MitoRGECO1 (magenta) traces during the 900 s acquisition from the 5 cells numbered in A, also see Video 2. (B) Scatter plot showing the average magnitude of GCaMP6sCAAX signals in developing and mature hair cells, n = 6 neuromasts per age. (C) Scatter plot showing frequency of GCaMP6sCAAX events in developing and mature hair cells, n = 6 neuromasts. Error bars in B-C represent SEM. A Mann-Whitney U test was used in B and C. ****p<0.0001. Scale bar = 5 µm in A’.
-
Figure 4—source data 1
Summary of the magnitude and frequency of spontaneous GCaMP6s-CAAX signals.
- https://cdn.elifesciences.org/articles/48914/elife-48914-fig4-data1-v2.xlsx
Figure 4—figure supplement 1

Spontaneous presynaptic and mito-Ca2+ signals are abolished by CaV1.3 channel antagonist isradipine.
(A) A live Image of a neuromast viewed top-down, expressing the presynaptic-Ca2+ sensor GCaMP6sCAAX (green) and mito-Ca2+ sensor MitoRGECO1 (magenta) at 6 dpf. (B) Representative GCaMP6sCAAX (green) and MitoRGECO1 (magenta) traces from the cells in A during a 900 s continuous image acquisition in the absence of stimuli and 10 µM isradipine. (C) There is no correlation between GCaMP6sCAAX and MitoRGECO1 signals within each cell from B in the presence of isradipine. Scale bar = 5 µm in A.
-
Figure 4—figure supplement 1—source data 1
Summary of MitoRGECO and GCaMP6s traces used to generate correlation plot.
- https://cdn.elifesciences.org/articles/48914/elife-48914-fig4-figsupp1-data1-v2.xlsx
Figure 5 with 2 supplements

Mito-Ca2+ regulates ribbon formation.
(A-C) Representative images of immature neuromasts (3 dpf) immunostained with Ribeye b (magenta, ribbons) and MAGUK (green, postsynapses) after a 1 hr 0.1% DMSO (A), 2 μM Ru360 (B) or 10 µM Ru360 (C) treatment. Insets show three representative synapses (white squares) for each treatment. D-E, Scatter plot show quantification of synapse number (D), and ribbon area (E) in controls and in treatment groups. (F) Side-view of 2 hair cells (white outline) shows synaptic ribbon (three magenta asterisks in each cell) and extrasynaptic Ribeye b aggregates after a 1 hr 0.1% DMSO or 10 μM Ru360 treatment. (G) Quantification of extrasynaptic Ribeye puncta. N ≥ 12 neuromasts per treatment. Error bars in D-E and G represent SEM. An unpaired t-test was used in D and a Welch’s unequal variance t-test was used in E and G, *p<0.05, **p<0.01, ****p<0.0001. Scale bar = 5 µm in A, 2 µm in insets and F.
-
Figure 5—source data 1
Summary of synapse number and ribbon area after Ru360 application in developing hair cells.
- https://cdn.elifesciences.org/articles/48914/elife-48914-fig5-data1-v2.xlsx
Figure 5—figure supplement 1
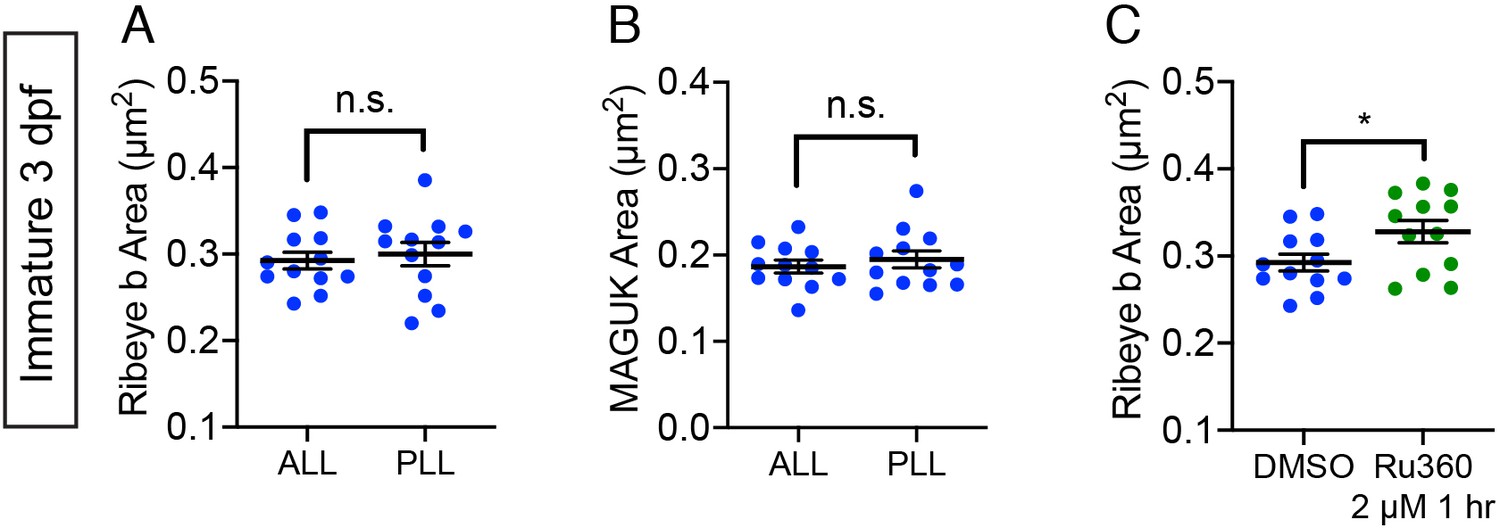
Ribbon and postsynapse size in immature ALL neuromasts.
(A-B) Scatter plots show that ribbon areas (A) and postsynaptic density areas (B) within the same fish are similar between immature anterior lateral-line (ALL) and posterior lateral-line (PLL) neuromasts. (C) Scatter plots show ribbon areas in controls and after a 1 hr treatment with 2 µM Ru360 are larger in immature hair cells within the ALL. Ribbon sizes of untreated anterior lateral-line hair cells are from the same data as A and C, n ≥ 10 neuromasts per treatment; error bars represent SEM; and a Welch’s unequal variance t-test was used for comparisons. *p<0.05.
-
Figure 5—figure supplement 1—source data 1
Summary of data comparing anterior and posterior lateral-line synapses in developing hair cells.
- https://cdn.elifesciences.org/articles/48914/elife-48914-fig5-figsupp1-data1-v2.xlsx
Figure 5—figure supplement 2

MCU and CaV1.3 block do not impact postsynapse size.
(A) Quantification of postsynapse size assayed by MAGUK immunolabel in mature neuromasts indicate the treatments with 10 µM isradipine, 2 µM Ru360 and 10 µM Ru360 do not significantly alter postsynapse size compared to controls, n ≥ 9 neuromasts per treatment. Error bars represent SEM. A Welch’s unequal variance t-test was used for comparisons.
-
Figure 5—figure supplement 2—source data 1
Summary of MAGUK area measurements after Ru360 treatment in developing hair cells.
- https://cdn.elifesciences.org/articles/48914/elife-48914-fig5-figsupp2-data1-v2.xlsx
Figure 6
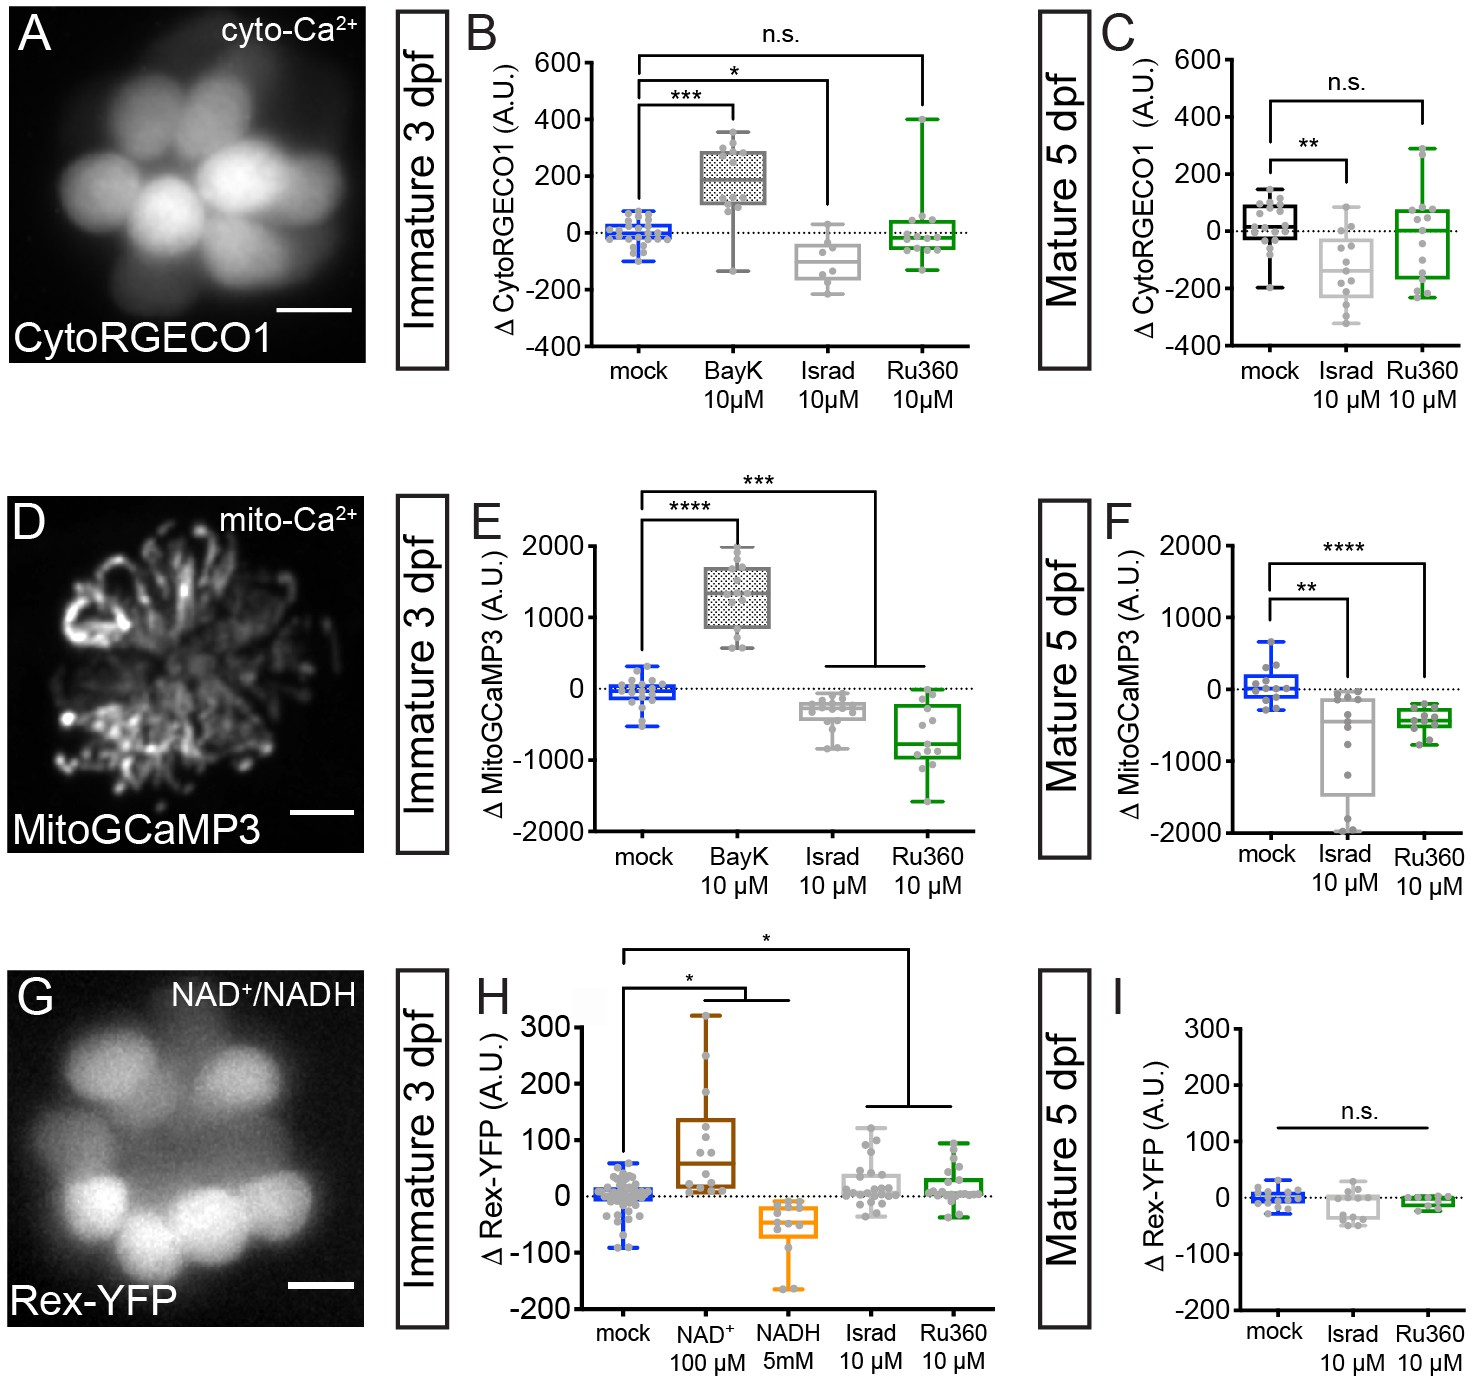
Cyto-Ca2+, mito-Ca2+ and NAD+/NADH redox baseline measurements.
Live hair cells expressing RGECO1 (A), MitoGCaMP3 (D), or Rex-YFP (G) show resting cyto-Ca2+, mito-Ca2+ or NAD+/NADH levels respectively. (B-C) RGECO1 baseline measurements before and after a 30 min mock treatment (0.1% DMSO) or after a 30 min 10 μM Bay K8644 (BayK), 10 μM isradipine, or 10 μM Ru360 treatment. (E-F) MitoGCaMP3 baseline measurements before and after a 30 min mock treatment (0.1% DMSO) or after a 10 μM BayK, 10 μM isradipine, or 10 μM Ru360 treatment. (H-I) Rex-YFP baseline measurements before and after 30 min mock treatment (0.1% DMSO) or after a 30 min 100 μM NAD+, 5 mM NADH, 10 μM isradipine, or 10 μM Ru360 treatment. All plots are box-and-whiskers plot that show median, min and max. N ≥ 9 neuromasts per treatment. A one-way Brown-Forsythe ANOVA with Dunnett’s T3 post hoc was used to calculate the difference in (B-C), (E-F), and a one-way Brown-Forsythe and Welch ANOVA with Holm-Sidak’s post hoc was used in H-I, *p<0.05, **p<0.01, ***p<0.001, ****p<0.0001. Horizontal lines in E, H, and I indicate that both conditions had similar p values compared to mock treatment. Scale bar = 5 μm in A, D and G.
-
Figure 6—source data 1
Summary of baseline CytoRGECO1, MitoGCaMP3 and Rex-YFP measurements.
- https://cdn.elifesciences.org/articles/48914/elife-48914-fig6-data1-v2.xlsx
Figure 7 with 1 supplement
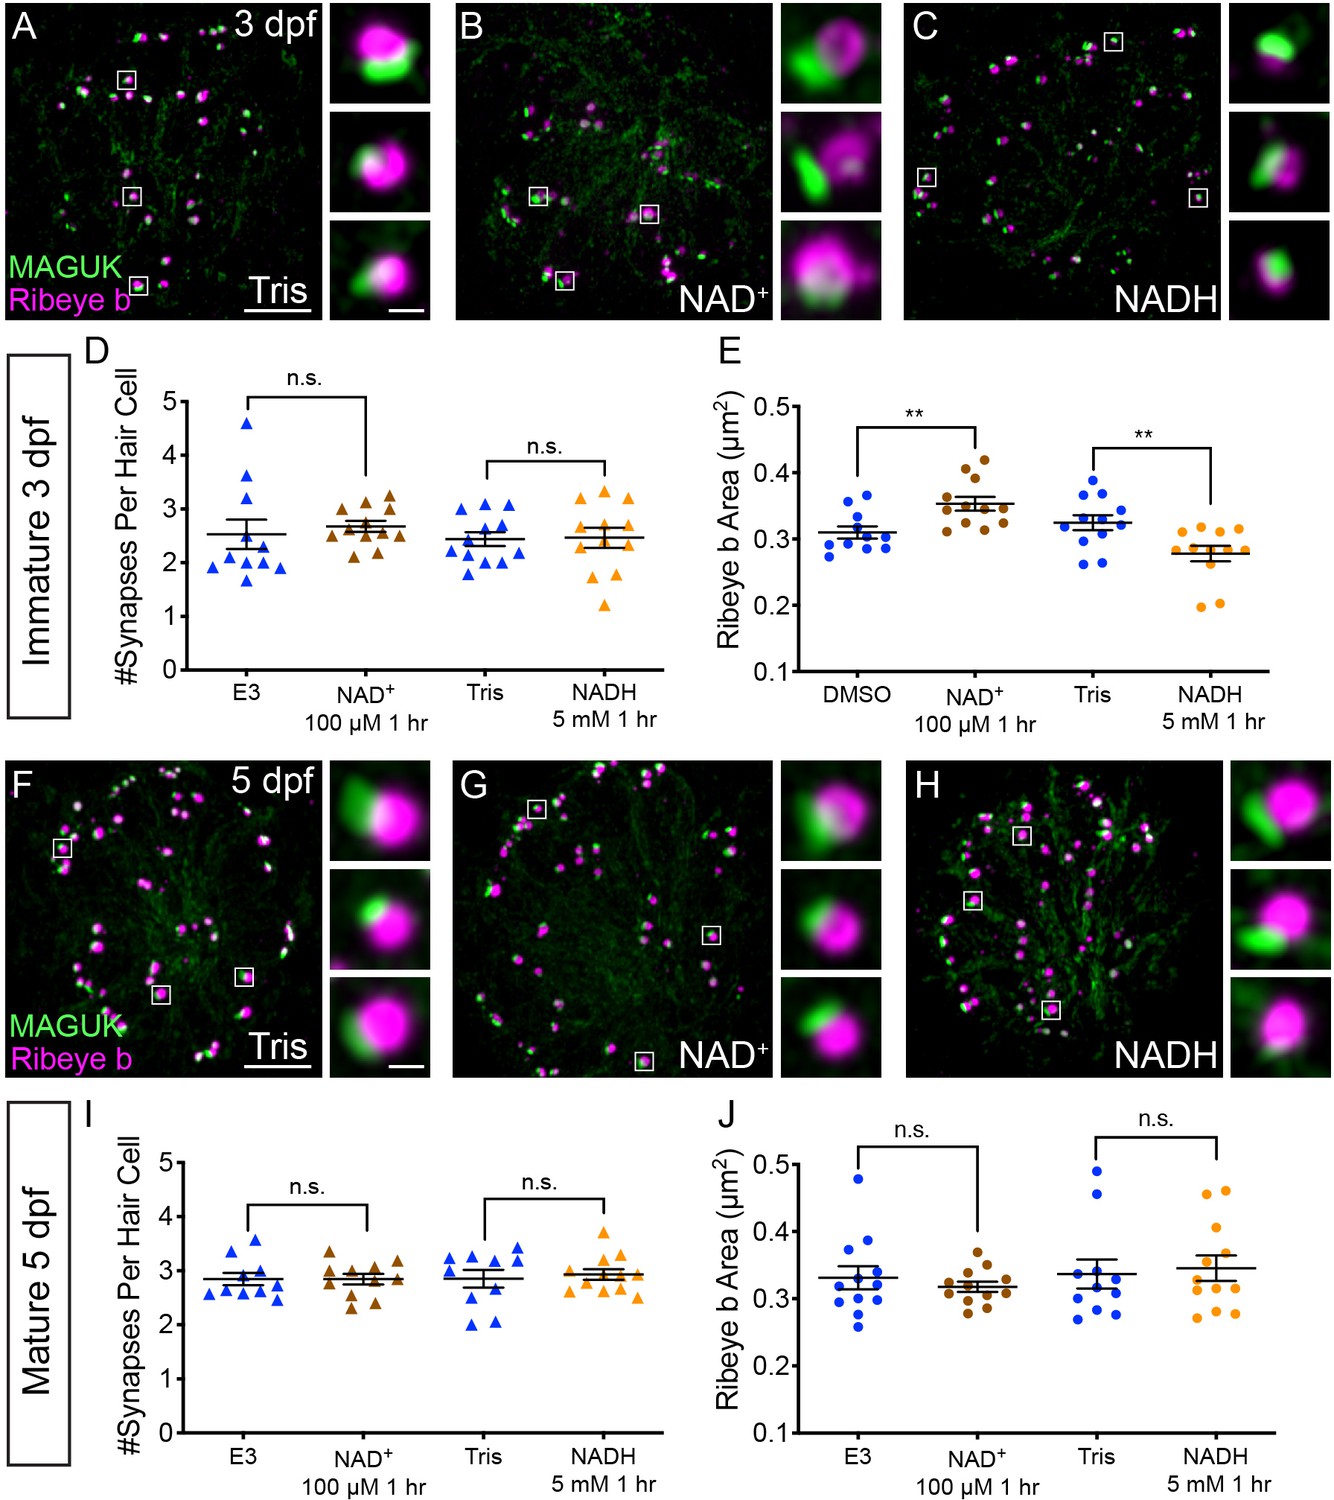
NAD+ and NADH directly influence ribbon formation.
Representative images of immature (A-C, 3 dpf) and mature (G-H, 5 dpf) neuromasts immunostained with Ribeye b (magenta, ribbons) and MAGUK (green, postsynapses) after a 0.1% Tris-HCl (A, F), 100 μM NAD+ (B, G) or 5 mM NADH treatment (C, H). Insets show three example synapses (white squares). D-E and I-J, Scatter plots show synapse count (D, I) and ribbon area (E, J) in controls and treatments groups. N ≥ 10 neuromasts per treatment. Error bars in B-C represent SEM. An unpaired t-test was used for comparisons in D and I and a Welch’s unequal variance t-test was used for comparisons in E and J, **p<0.01. Scale bar = 5 µm in A and F, 2 µm in insets.
-
Figure 7—source data 1
Summary of synapse number and ribbon area measurements after NAD+ and NADH application.
- https://cdn.elifesciences.org/articles/48914/elife-48914-fig7-data1-v2.xlsx
Figure 7—figure supplement 1
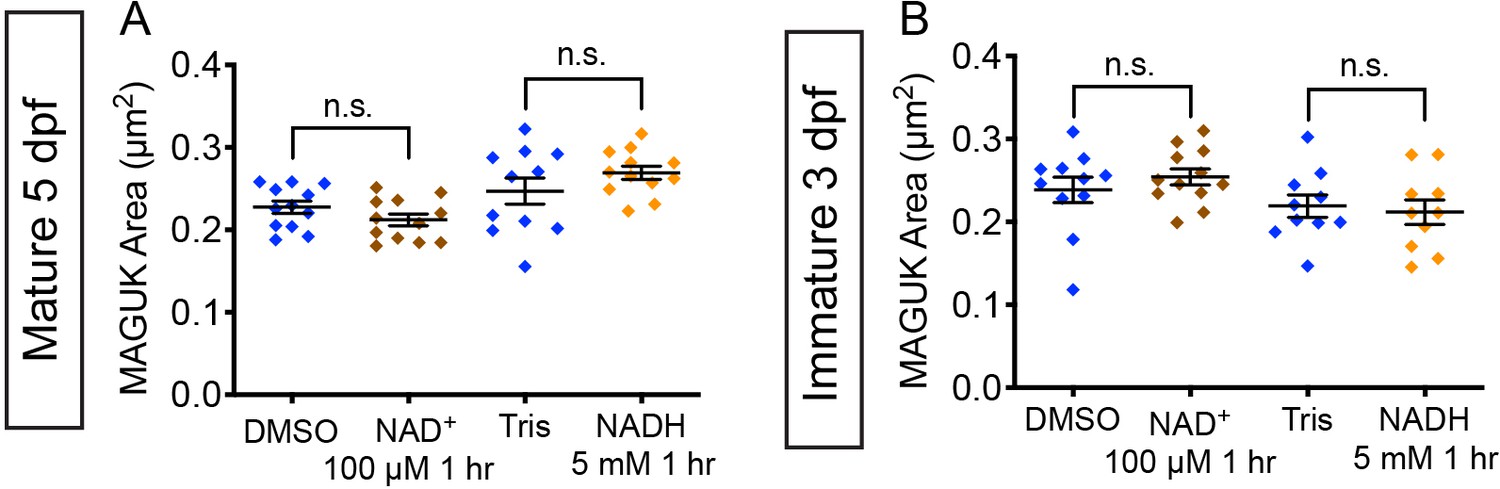
NAD+ and NADH treatment do not impact postsynapse size.
(A-B) Quantification of postsynapse size assayed by MAGUK immunolabel in mature (A) and immature (B) neuromasts indicate the treatment with 100 μM NAD+ and 5 mM NADH do not significantly alter postsynapse size compared to controls, n ≥ 9 neuromasts per treatment. Error bars represent SEM. A Welch’s unequal variance t-test was used for comparisons.
-
Figure 7—figure supplement 1—source data 1
Summary of MAGUK area after NAD+ and NADH treatment.
- https://cdn.elifesciences.org/articles/48914/elife-48914-fig7-figsupp1-data1-v2.xlsx
Figure 8
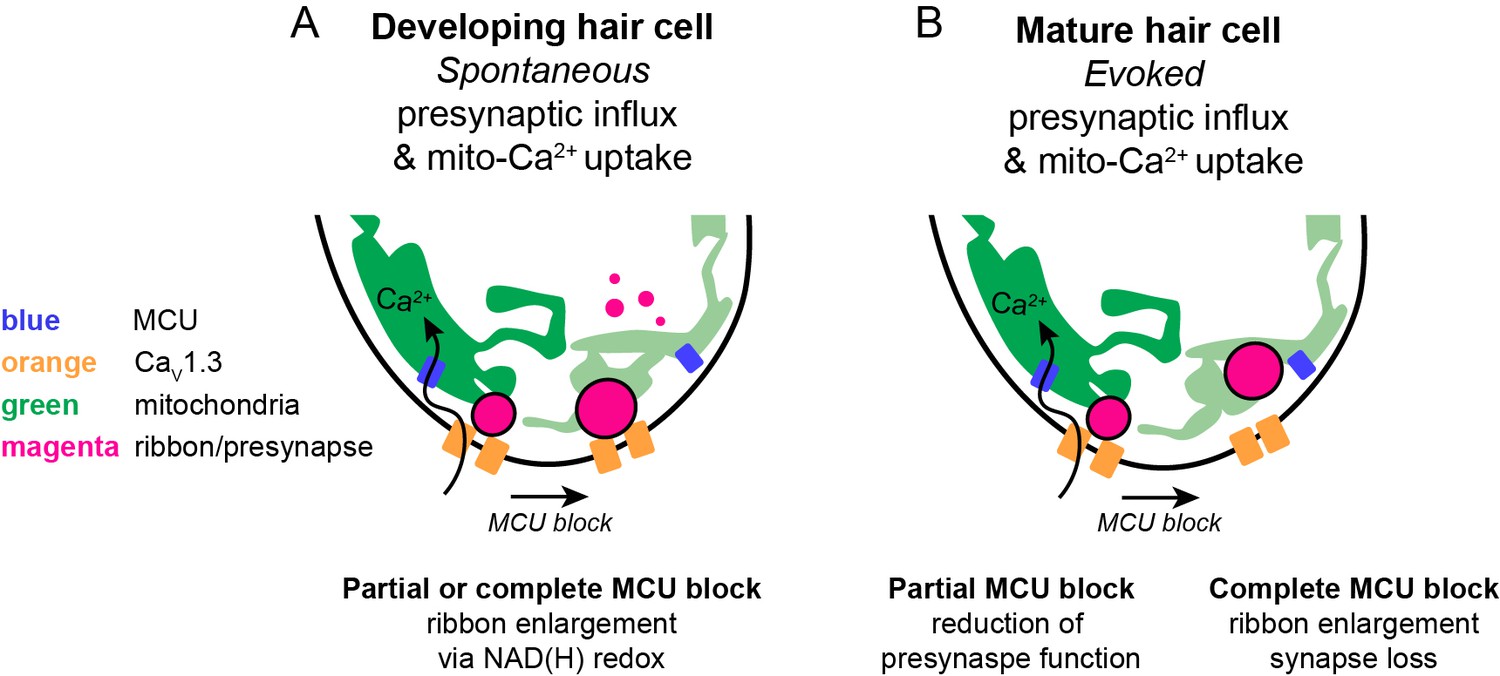
Schematic model of mito-Ca2+ in developing and mature hair cells.
(A) In developing hair cells, spontaneous presynaptic-Ca2+ influx is linked to mito-Ca2+ uptake. Together these Ca2+ signals function to regulate ribbon size during ribbon formation. When the CaV1.3 or MCU channels are blocked, ribbon formation is increased leading to larger ribbons. These Ca2+ signals regulate ribbon formation via NAD(H) redox. MCU block lowers mito-Ca2+, increases the NAD+/NADH ratio and promotes ribbon formation. (B) In mature hair cells, evoked presynaptic-Ca2+ influx is linked to mito-Ca2+ uptake. When the MCU is partially blocked there is a reduction in presynaptic-Ca2+ influx. When the MCU is completely blocked there are synaptopathic consequences; ribbons are enlarged and synapses are lost.
Videos
Video 1
Airyscan image of MitoGCaMP3 and Rib a-tagRFP at the base of a single live hair cell.
Video 2
Spontaneous ∆F GCaMP6sCAAX (left) and ∆F MitoRGECO1 (right) signals acquired at 3 dpf, 25 s per frame.
Tables
Key resources table
| Reagent type (species) or resource | Designation | Source or reference | Identifiers | Additional information |
|---|---|---|---|---|
| Strain, strain background (Danio rerio) | Tübingen | ZIRC | RRID: ZIRC_ZL57; ZFIN ID: ZDB-GENO-990623–3 | |
| Strain, strain background (Danio rerio) | TL | ZIRC | RRID: ZIRC_ZL86; ZFIN ID: ZDB-GENO-990623–2 | |
| Genetic reagent (Danio rerio) | Tg(myo6b:GCaMP6s-CAAX)idc1; GCaMP6sCAAX; 6sCAAX; GCaMP6s | (Jiang et al., 2017) | RRID: ZFIN_ZDB-ALT-170113-3; https://zfin.org/ZDB-ALT-170113-3 | Membrane-localized calcium biosensor |
| Genetic reagent (Danio rerio) | Tg(myo6b:RGECO1)vo10Tg; CytoRGECO1 | (Maeda et al., 2014) | RRID: ZFIN_ZDB-ALT-150114-2; https://zfin.org/ZDB-ALT-150114-2 | Cell-fill calcium biosensor |
| Genetic reagent (Danio rerio) | Tg(myo6b:GCaMP3)w78Tg; CytoGCaMP3 | (Esterberg et al., 2013) | RRID: ZFIN_ZDB-ALT-130514-1; https://zfin.org/ZDB-ALT-130514-1 | Cell-fill calcium biosensor |
| Genetic reagent (Danio rerio) | Tg(myo6b:mitoGCaMP3)w119Tg; MitoGCaMP3; Mito | (Esterberg et al., 2014) | RRID: ZFIN_ZDB- ALT-141008–1; https://zfin.org/ZDB-ALT-141008-1 | Mitochondria-localized calcium biosensor |
| Genetic reagent (Danio rerio) | Tg(myo6b:ribeye a-tagRFP)idc11Tg; Rib a-RFP; Rib a-tagRFP; Rib a | (Sheets, 2017) | RRID: ZFIN_ZDB- ALT-190102–4; https://zfin.org/ZDB-ALT-190102-4 | Ribbon-localized fluorescent protein |
| Genetic reagent (Danio rerio) | Tg(myo6b:mitoRGECO1)idc12Tg; MitoRGECO1 | This paper | RRID: ZFIN_ZDB-ALT-190102-5; https://zfin.org/ZDB-ALT-190102-5 | Mitochondria-localized calcium biosensor. See Materials and methods,‘Cloning and Transgenic Fish Production’ |
| Genetic reagent (Danio rerio) | Tg(myo6b:Rex-YFP)idc13Tg; Rex-YFP | This paper | RRID: ZFIN_ZDB- ALT-190102–6; https://zfin.org/ZDB-ALT-190102-6 | Cell-fill NAD+/NADH ratio biosensor. See Materials and methods, ‘Cloning and Transgenic Fish Production’ |
| Antibody | Ribbon label: Mouse anti-Ribeye b IgG2a; Ribeye b; Ribeye; Rib b | (Sheets et al., 2011) | N/A | 1:10,000 |
| Antibody | PSD label: Mouse anti-pan-MAGUK IgG1; MAGUK | NeuroMab | RRID: AB_10673115; K28/86, #75–029 | 1:500 |
| Antibody | Hair cell label: Rabbit anti-Myosin VIIa | Proteus | RRID: AB_10015251; #25–6790 | 1:1000 |
| Antibody | goat anti-mouse IgG2a, Alexa Fluor 488 | ThermoFisher Scientific | RRID: AB_2535771; #A-21131 | 1:1000 |
| Antibody | goat anti-rabbit IgG (H+L) Alexa Fluor 568 | ThermoFisher Scientific | RRID: AB_143157; #A-11011 | 1:1000 |
| Antibody | goat anti-mouse IgG1 Alexa Fluor 647 | ThermoFisher Scientific | RRID: AB_2535809; #A-21240 | 1:1000 |
| Recombinant DNA reagent | Plasmid: 5E-pmyo6b | (Kindt et al., 2012) | N/A | |
| Recombinant DNA reagent | Plasmid: 3E-polyA | (Kwan et al., 2007) | #302 | |
| Recombinant DNA reagent | Plasmid: pDestTol2CG2 | (Kwan et al., 2007) | #395 | |
| Recombinant DNA reagent | Plasmid: pC1-Rex-YFP | (Bilan et al., 2014) | Addgene #48247 | |
| Recombinant DNA reagent | Plasmid: pDONR221 | ThermoFischer | Cat #12536017 | |
| Recombinant DNA reagent | Plasmid: CMV-R-GECO1 | (Zhao et al., 2011) | Addgene #32444 | |
| Recombinant DNA reagent | Plasmid: pME-Rex-YFP | This paper | N/A | See Materials and methods, ‘Cloning and Transgenic Fish Production’ |
| Recombinant DNA reagent | Plasmid: pME-mitoRGECO1 | This paper | N/A | See Materials and methods, ‘Cloning and Transgenic Fish Production’ |
| Sequence-based reagent | RexYFP attB FWD | This paper | PCR primers | GGGGACAAGTTTGTACAAAAAAGCAGGCTCCGCCACCATGAAGGTCCCCGAAGCG; Made by Integrated DNA Technologies (IDT). |
| Sequence-based reagent | REX-YFP attB REV | This paper | PCR primers | GGGGACCACTTTGTACAAGAAAGCTGGGTGTCACCCCATCATCTCTTCCCG |
| Sequence-based reagent | RGECO1 FWD1 | This paper | PCR primers | [ATGTCCGTCCTGACGCCGCTGCTGCTGCGGGGCTTGACAGGCTCGGCCCGGCGGCTCCCAGTGCCGCGCGCCAAGATCCATTCGTTGGGGGATCCA]-GTCGACTCTTCACGTCGTAAGTG; Made by IDT. |
| Sequence-based reagent | RGECO1 REV1 | This paper | PCR primers | CTACTTCGCTGTCATCATTTGTACAAACTC; Made by IDT. |
| Sequence-based reagent | RGECO1 attB FWD2 | This paper | PCR primers | GGGGACAAGTTTGTACAAAAAAGCAGGCTGCCACCATGTCCGTCCTGACGCCGC; Made by IDT. |
| Sequence-based reagent | RGECO1 attB REV2 | This paper | PCR primers | GGGGACCACTTTGTACAAGAAAGCTGGGTGCTACTTCGCTGTCATCATTTGTACAAACTC; Made by IDT. |
| Peptide, recombinant protein | α-bungarotoxin | Tocris | 2133 | |
| Chemical compound, drug | Isradipine; Israd | Sigma-Aldrich | I6658 | |
| Chemical compound, drug | BayK 8644; BayK | Sigma-Aldrich | B133 | |
| Chemical compound, drug | Ru360 | Millipore | 557440 | |
| Chemical compound, drug | NAD+ | Sigma-Aldrich | N1511 | |
| Chemical compound, drug | NADH | Cayman Chemical | 16038 | |
| Chemical compound, drug | Tricaine; MESAB | Sigma-Aldrich | A5040 | |
| Chemical compound, drug | Paraformaldehyde: EM | Electron Microscopy Sciences | 15710 | |
| Chemical compound, drug | Glutaraldehyde: EM | Electron Microscopy Sciences | 16210 | |
| Chemical compound, drug | Paraformaldehyde: IHC | ThermoFisher Scientific | 28906 | |
| Chemical compound, drug | TRO 19622; TRO | Cayman Chemical | 21264 | Vortex vigorously to dissolve in embryo media + 0.1% DMSO |
| Software, algorithm | Prism (v. 8) | Graphpad Software | RRID: SCR_002798; https://www.graphpad.com | |
| Software, algorithm | Adobe Illustrator | Adobe | RRID: SCR_014198; https://www.adobe.com | |
| Software, algorithm | FIJI is just ImageJ | NIH | RRID: SCR_003070; https://fiji.sc | |
| Software, algorithm | Zen | Zeiss | RRID: SCR_01367; https://www.zeiss.com/microscopy/int/products/microscope-software/zen.html | |
| Software, algorithm | Prairie View | Bruker Corporation | RRID: SCR_017142; https://www.bruker.com/products/fluorescence-microscopes/ultima-multiphoton-microscopy/ultima-in-vitro/overview.html | |
| Software, algorithm | Python Programming Language | Python Software Foundation | RRID: SCR_008394; https://www.python.org/ |
Additional files
Download links
A two-part list of links to download the article, or parts of the article, in various formats.
Downloads (link to download the article as PDF)
Open citations (links to open the citations from this article in various online reference manager services)
Cite this article (links to download the citations from this article in formats compatible with various reference manager tools)
Synaptic mitochondria regulate hair-cell synapse size and function
eLife 8:e48914.
https://doi.org/10.7554/eLife.48914


