Formin-2 drives polymerisation of actin filaments enabling segregation of apicoplasts and cytokinesis in Plasmodium falciparum
- University of Glasgow, United Kingdom
- Ludwig Maximilian University, Germany
Figures
Figure 1 with 2 supplements
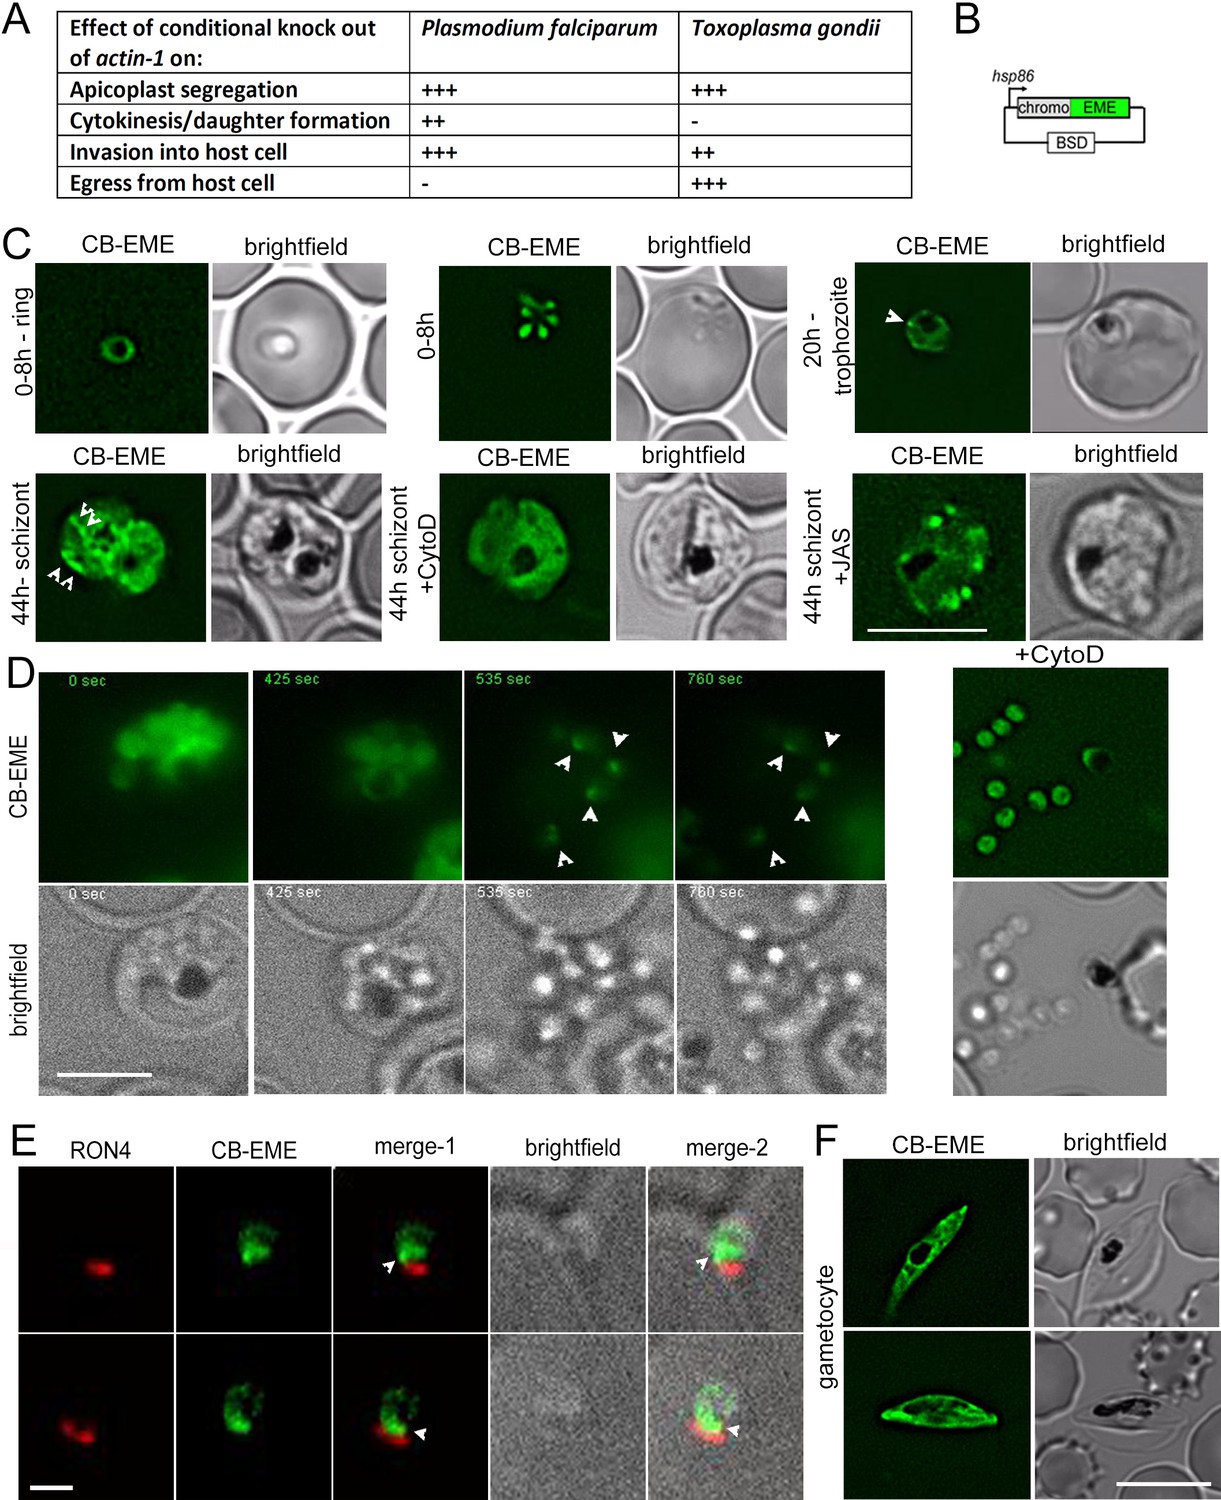
Chromobody-Emerald constructs label F-actin structures throughout the P. falciparum lifecycle.
(A) Table summarising the functions of actin in P. falciparum and T. gondii (Andenmatten et al., 2013; Das et al., 2017; Whitelaw et al., 2017). Upon conditional disruption of actin-1 in either organism, highly penetrant phenotypes observed are labelled as +++, moderate phenotypes as ++, and no effect on phenotype with -. (B) Chromobody construct used in this study under the hsp86 promoter with a C-terminal emerald tag (CB-EME). See also Figure 1—figure supplement 1 for a chromobody construct with a C-terminal halo tag (CB-HALO) and its characterisation. Blasticidin-S-deaminase (BSD) confers resistance to blasticidin. (C) CB-EME labels actin filaments throughout the 48 hr asexual life cycle with, in ring stages (0–8 hr), trophozoite stages (20 hr) and in 44 hr schizont stages. White arrows mark structures, in all likelihood F-actin, which disappear upon cytochalasin-D treatment (+CytoD), and islands of F-actin are stabilised upon jasplakinolide treatment (+JAS). Scale bar 5 µm. See also Videos 1, 2 and 3 and Figure 1—figure supplement 2. (D) Time lapse imaging of schizonts undergoing egress from the host cell, reveals a bright fluorescent signal (CB-EME) of F-actin (white arrows) at a polar end of the merozoite, appearing immediately after host cell rupture (occurs in 56 ± 9% egressed merozoites, N = 260 from three independent experiments). See also Video 4. Cytochalasin-D treatment completely prevents the polar polymerisation of F-actin in all cells (+CytoD). Scale bar 5 µm. (E) IFA of invading merozoites with the junction marker RON4 shows CB-EME staining close to the RON4 stain, implying that F-actin polymerises at the apical end prior to invasion. Scale bar 1 µm. (F) The F-actin network and dynamics can be visualised in gametocytes (see also Video 5). Brightfield images provided in greyscale alongside. Scale bar 5 µm.
-
Figure 1—source data 1
Source data for table in Figure 1A.
- https://doi.org/10.7554/eLife.49030.005
Figure 1—figure supplement 1
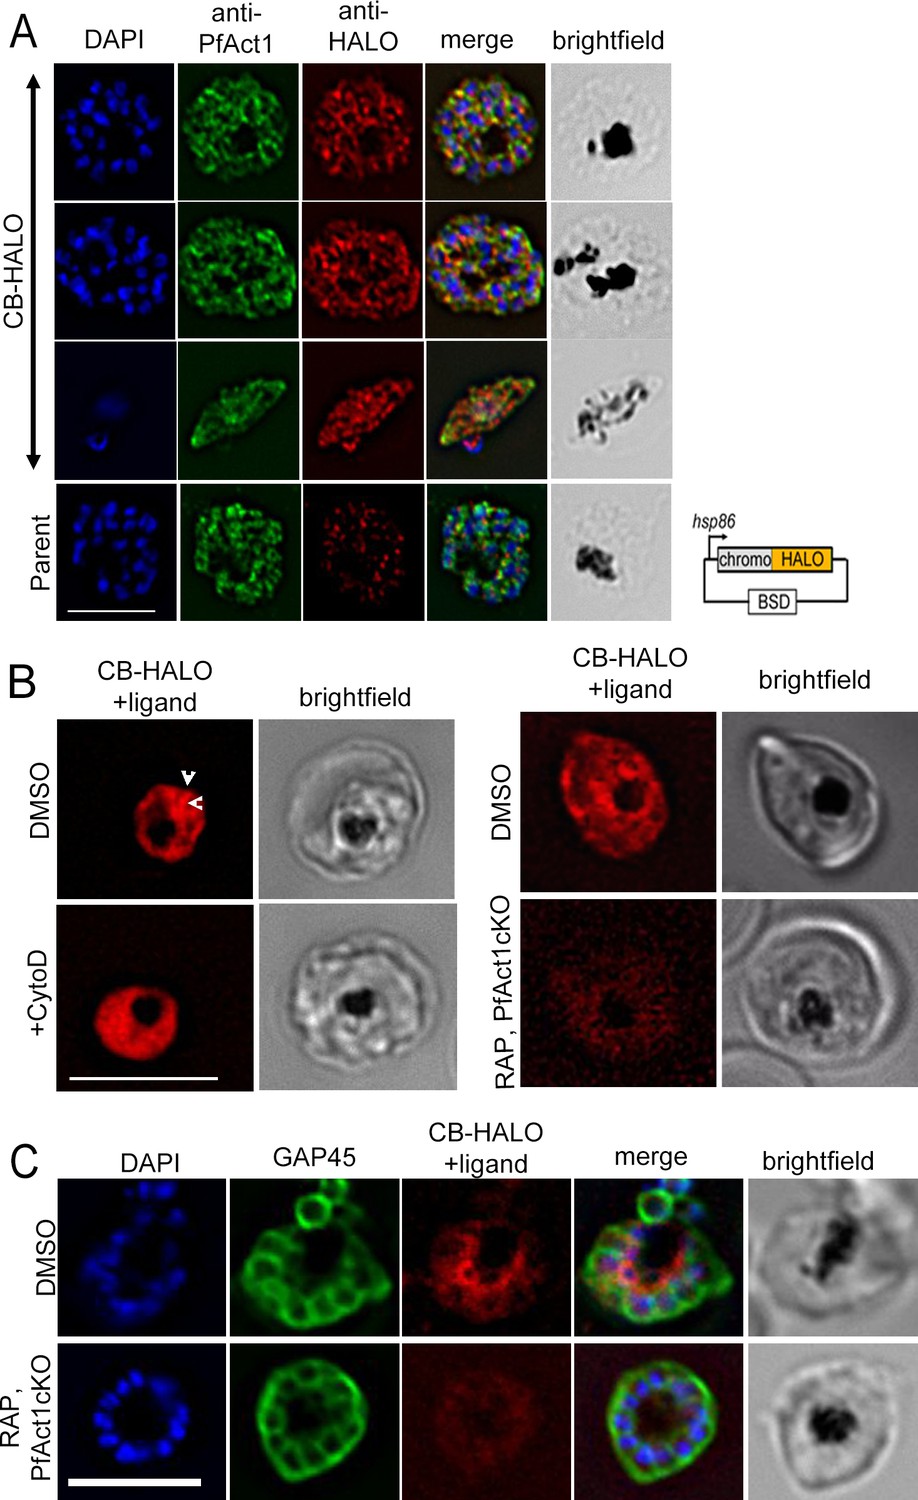
CB-HALO labels the F-actin network similar to CB-EME.
(A) IFA of CB-HALO expressing parasites showing staining with anti-PfACT1 and with an anti-HALO antibody. Note that the anti-HALO antibody shows background staining in the parental strain. Right: The construct pB-CB-HALO has been depicted which uses the hsp86 promoter and blasticidin-S-deaminase (BSD) confers resistance to blasticidin. (B) Imaging of CB-HALO by addition of the ligand TMR: Left panels: Filamentous structures in DMSO controls (white arrows) are lost upon cytochalasin-D-treatment (+CytoD). Right panels: Intensity of CB-HALO expression and filament structures (red) are lost upon PfACT1 disruption (RAP, PfAct1 cKO). (C) IFA with anti-GAP45 antibodies show high intensity of CB-HALO (therefore F-actin) around the FV (or at the basal end of newly forming daughter cells) in DMSO parasites, which is lost upon excision of pfact1 (RAP, PfAct1 cKO). Scale bars 5 µm.
Figure 1—figure supplement 2
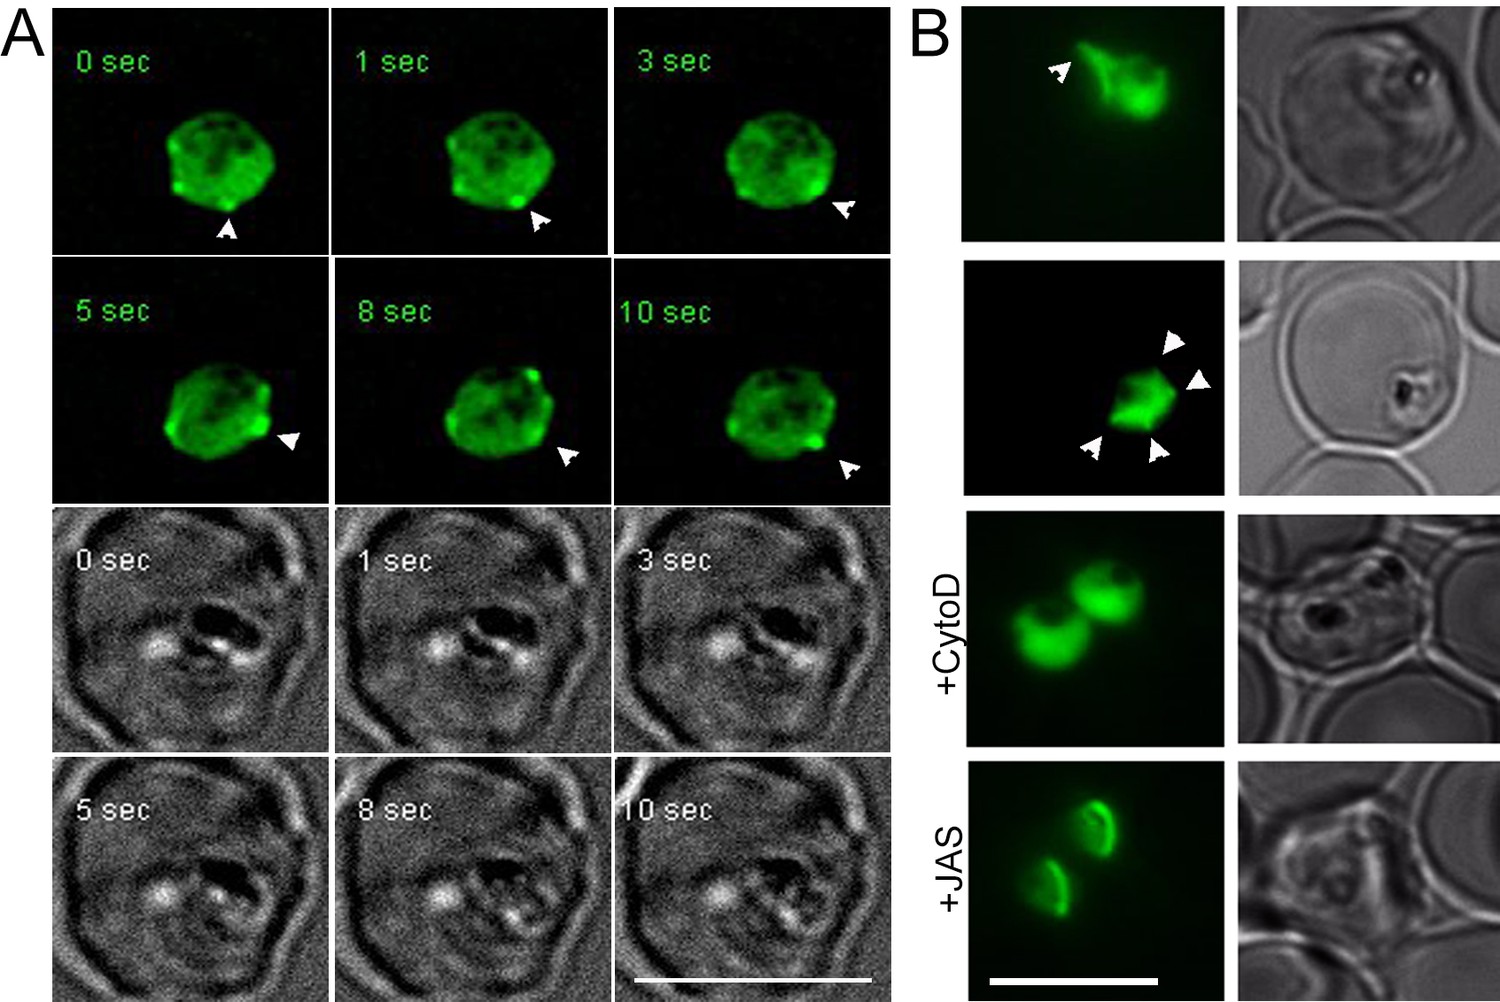
Rapid actin dynamics are visible in 20 hr old trophozoites during intracellular growth.
(A) Deconvoluted time lapse images show rapid changes (in the order of seconds) in peripheral F-actin accumulations (white arrows). See also Video 2. CB-EME visible in the green channel, and brightfield images have been provided below in greyscale. (B) F-actin-rich protrusions at the periphery of the parasite cell body (white arrows) could be seen by standard fluorescence microscopy in 45 ± 12 % cells (N = 195 from three independent experiments), which could be disrupted by cytochalasin-D (+CytoD) and jasplakinolide (+JAS). Scale bars 5 µm.
Figure 2 with 2 supplements
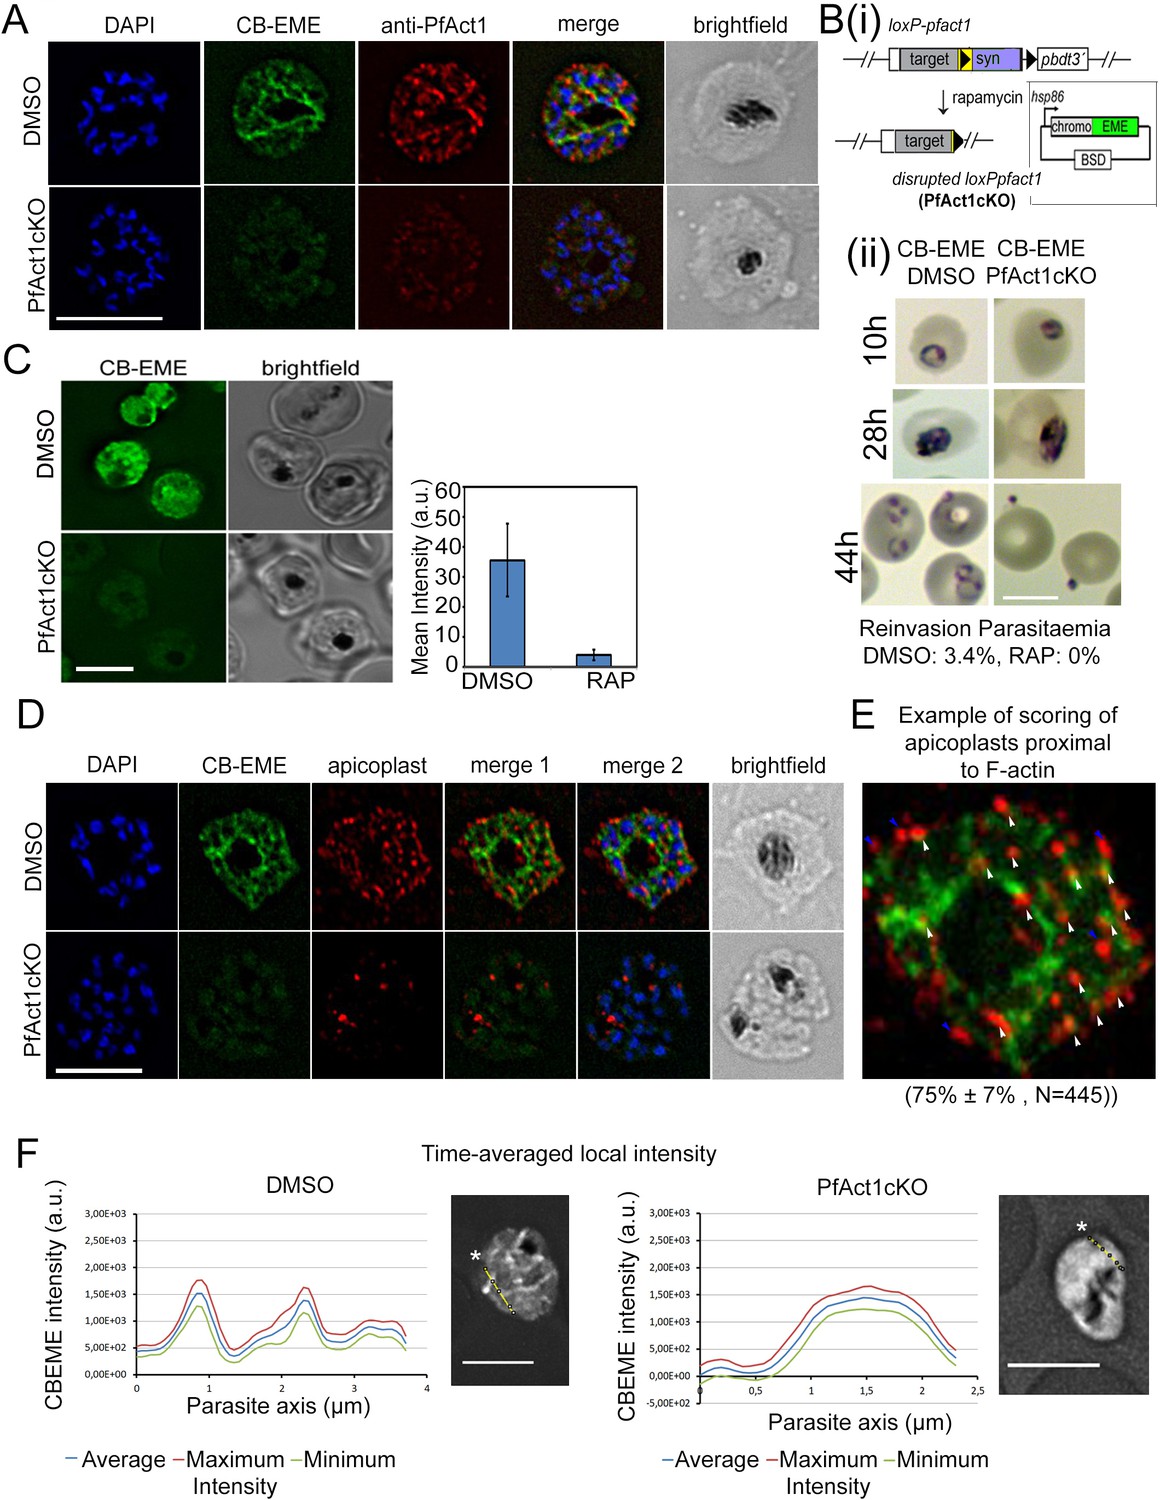
The CB-EME-labelled F-actin network is disrupted upon genetic excision of pfact1.
(A) IFA showing the F-actin network in P. falciparum (CB-EME), which stains the same network as an actin antibody (anti-PfAct1), though at slightly different regions, Pearson’s R value = 0.6, compared to R values of 0.2 when the CB-EME signal was tested for colocalisation with the DAPI signal. DAPI labels nuclei. (B) (i). Schematic of transfection of pB-CB-EME into the loxPpfact1 strain and PfACT1 loss upon rapamycin (RAP)-mediated DiCre-activation. (ii) Giemsa-stained parasites showing time points after induction with RAP. Invasion is abrogated in PfACT1 cKOs as compared to the DMSO controls (lower panels). (C) Stills from live imaging of CB-EME-expressing parasites and the loss of fluorescence intensity upon RAP-treatment. Right panel shows quantification of fluorescence intensities. See also Video 7. (D) IFA showing apicoplasts (red) in context of the F-actin network (CB-EME, DMSO) and the disruption of the network together with apicoplasts when PfACT1 is deleted (PfAct1cKO). (E) Example of scoring of apicoplast signals proximal to CB-EME signal (white arrows) and not proximal to the CB-EME signal (blue arrows). 445 data points were collected from three repeat experiments. The mean and SD have been depicted below the image. (F) Quantification of intracellular F-actin dynamics: Time-averaged local intensity along a defined transect (yellow line) shows defined areas of F-actin accumulation as discrete peaks (left panel) as compared to no peaks along a transect in the PfACT1 cKO. Asterisks indicate the start of the measurement axis (0 µm). Scale bar 5 µm. Additional transects confirm these differences in Figure 2—figure supplement 2.
Figure 2—figure supplement 1

Super-resolution of the CB-EME-labelled F-actin network.
(A) Mean fluorescence intensity of the CB-EME channel for schizonts has been presented, N = 40. Error bars show SD. (B) Super-resolution imaging of schizonts shows the F-actin network (CB-EME, yellow) co-stained in magenta with IMC-markers GAP45, MTIP and the apicoplast marker CPN60. Note the proximity of the apicoplasts with the F-actin network. DAPI stains nuclei (cyan). A Pearson’s R value of 0.4 was obtained for colocalisation of the apicoplast(s) signal with the CBEME channel compared to 0.1 with the DAPI channel. (C) Stills from live imaging of CB-EME expressing parasites co-stained with Mitotracker (mitochondria). The branched mitochondrial structure (DMSO) could not be distinguished from RAP-treated parasites (PfACT1 cKO). Scale bars 5 µm.
Figure 2—figure supplement 2

Quantification of intracellular F-actin dynamics (additional transects).
Time-averaged local intensity along four defined transects (yellow lines) shows defined areas of F-actin accumulation as discrete peaks (left panels) as compared to no discrete peaks along transects in the PfACT1 cKO (right panels). Note the very high intensity around the FV in panel 01_04. Asterisks indicate the start of the measurement axis (0 µm). Scale bars 5 µm.
Figure 3 with 1 supplement

Apicomplexan formins have distinct protein domains, with Formin-2 localising to apicoplasts in Toxoplasma and P. falciparum.
(A) Other than the conserved FH1/FH2 domains common to all formins, Pf and Tg Formin-1 contain tetratricopeptide repeat domains (TPR), while Pf and Tg Formin-2 contain a PTEN C2-like domain. (B) Rooted neighbour-joining tree of FH2 domains detected in apicomplexan sequences flagged by hmmsearch and extracted from alignments produced by hmmalign, both using the PFAM profile PF02181.23: Proteins with sub-sequences similar to PTEN-C2 domains (detected by psi-Blast) are indicated with circular leaf symbols (within the shaded blue area). Those sequences already annotated as Formin-1 (#) and Formin-2 (*) are indicated. Colour coding of the leaf nodes: Red: Plasmodium, Green: Eimeria, Magenta: Sarcocystidae, Cyan: Piroplasmida, Black: Cryptosporidium, Grey: Gregarinidae (C) Strategy depicting endogenous C-terminal HA tagging of tgfrm2 in Toxoplasma. CRISPR/Cas9 was exploited to introduce a double-stranded DNA break and repair DNA amplified by PCR with homologous DNA regions coding for 3xHA. (D) Diagnostic PCR confirming integration of DNA described in C into the RH_Δku80_DiCre line. (E) IFA showing localisation of TgFRM2-HA (green) at the vicinity of the apicoplast staining (anti-G2Trx, red). Nuclei are stained with DAPI (blue). White dotted line depicts the parasite vacuole outline. Parasites were grown for 24 hr. Scale bar 5 µm F. Super-resolution microscopy confirming the close apposition of TgFRM2-HA (green) to the apicoplast (anti-G2Trx, orange). Toxoplasma parasites were fixed 24 hr after inoculation. Scale bar 2.5 µm. (G) Strategy showing simultaneous floxing and C-terminal HA tagging of the endogenous pffrm2 locus using single cross over recombination into a DiCre expressing strain to give rise to the LoxPpfformin2 strain (modified). A 906 bp targeting sequence (target) followed by a heterologous intron with an internal LoxP site (LoxPint) followed by synthetic recodonised DNA sequence with additional LoxP sites at the 3´ end ensures recombination upstream of LoxP sites. Human dihydrofolate reductase (hdhfr) confers resistance to the drug WR99210. Primers for diagnostic PCR have been annotated as half arrows. (H) Diagnostic PCR on genomic DNA from two transfectants confirmed integration in one of the two transfected lines (Transfectant 1). Primers depicted with red half arrows (int) are specific to the integrated locus, while red and blue half arrows (Endo) are specific to the endogenous locus (I) IFA showing localisation of PfFRM2-HA (green) in the context of a PfACT1-antibody staining (red). Nuclei are stained with DAPI (blue). (J) IFA showing localisation of PfFRM2-HA in context of apicoplasts using a CPN60 antibody (red) throughout P. falciparum intracellular development (24, 40, 48 hr). (K) Super-resolution image confirming the apparent proximity of PfFRM2-staining (green) with apicoplasts (orange). Scale bars are 5 µm, except where otherwise noted.
Figure 3—figure supplement 1
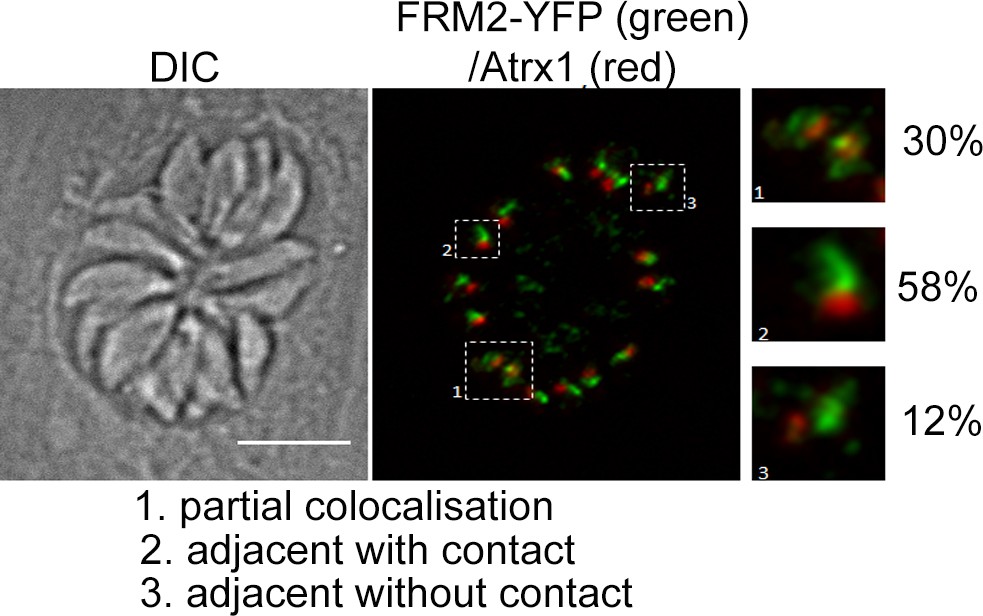
Positioning of TgFRM2 with respect to apicoplasts.
Localisation of TgFRM2 and the apicoplast (Atrx1) was investigated inTgFRM2-YFPloxP parasites 48 hr post inoculation. Three different types of positioning were identified, namely partial colocalisation, adjacent with contact and adjacent without contact. n = 142 parasites (from 22 vacuoles). Pearson’s R value for co-localisation of FRM2 and apicoplast: 0.47 (±0.07) (n = 4 images). Scale bar 5 µm.
Figure 4
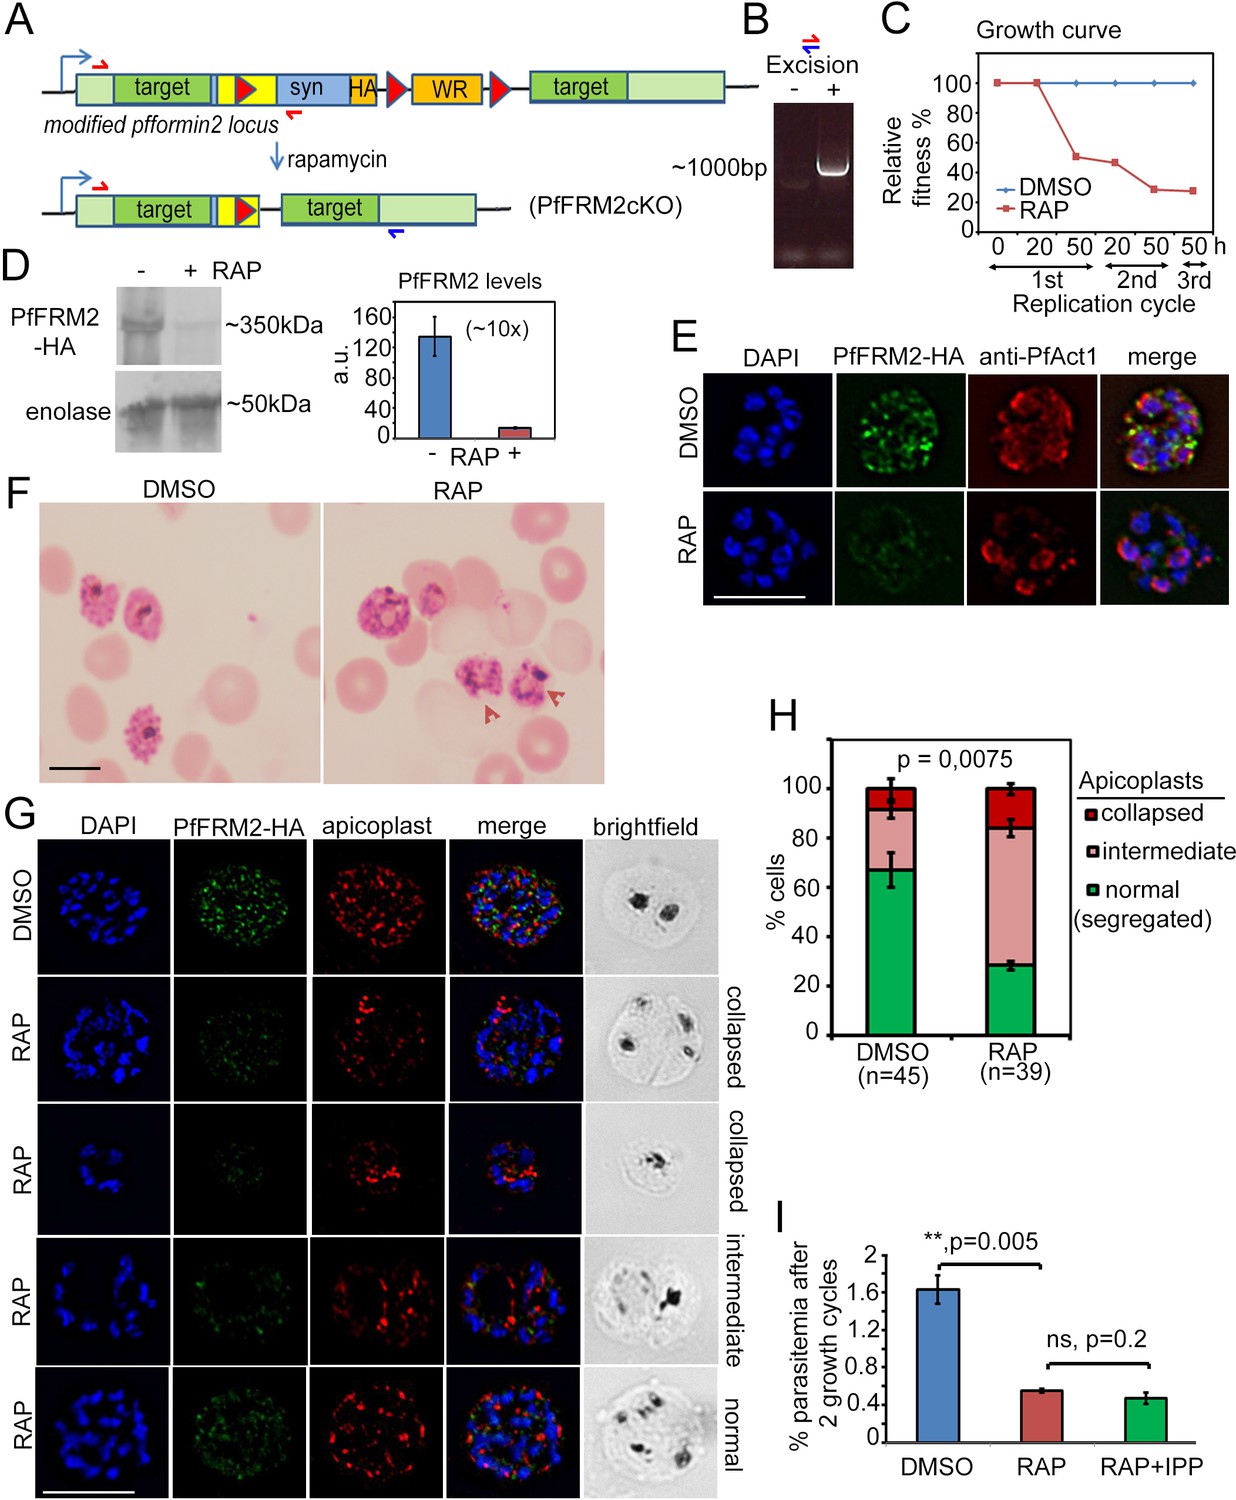
Conditional excision of pffrm2 disrupts apicoplast segregation and causes a severe fitness defect in P. falciparum.
(A) Strategy showing the DiCre-mediated genomic excision of the LoxPpfFRM2 locus (modified). Primers for diagnostic PCR have been annotated as red/blue half arrows. (B) Diagnostic PCR confirming genomic excision of the pffrm2 locus upon rapamycin treatment (+). (C) A growth curve showing the relative fitness of RAP-treated PfFRM2 cKO parasites in comparison to DMSO controls. Various time points (h) from the pulse treatment of 1h-old rings at time 0 in the 1st, 2nd and 3rd replication cycles have been measured. (D) left panel, Western blot showing the loss of PfFRM2-HA upon RAP-treatment, enolase has been used as a control. Right panel, Quantification of PfFRM2-HA protein levels using intensity values normalised to enolase from three different immunoblots shows at least a 10-fold drop in protein levels, Error bars depict SD. Values are in arbitrary units (a.u.) (E) IFA showing loss of PfFRM2-HA staining (green) upon RAP-treatment. Levels of PfACT1-staining (red) do not change. (F) Giemsa-stained images of RAP-treated parasites reveal dysmorphic parasites 44 hr after RAP-treatment. (G) Apicoplast staining (red) is affected to various degrees – collapsed, intermediate and apparently normal in RAP-treated parasites as compared to DMSO controls, where a normal punctate staining for apicoplasts is visible in a multi-nucleated schizont. (H) Quantification of phenotypes seen in G) shows a 3-fold reduction in normal apicoplast staining in PfFRM2 cKOs (RAP). Error bars depict SD. (I) Isopentenyl pyrophosphate (IPP) cannot rescue the fitness defect (RAP +IPP) in PfFRM2 KO parasites (RAP) compared to DMSO controls, as measured by final parasitemia after two growth cycles. Error bars depict SD. Scale bars 5 µm.
Figure 5 with 1 supplement
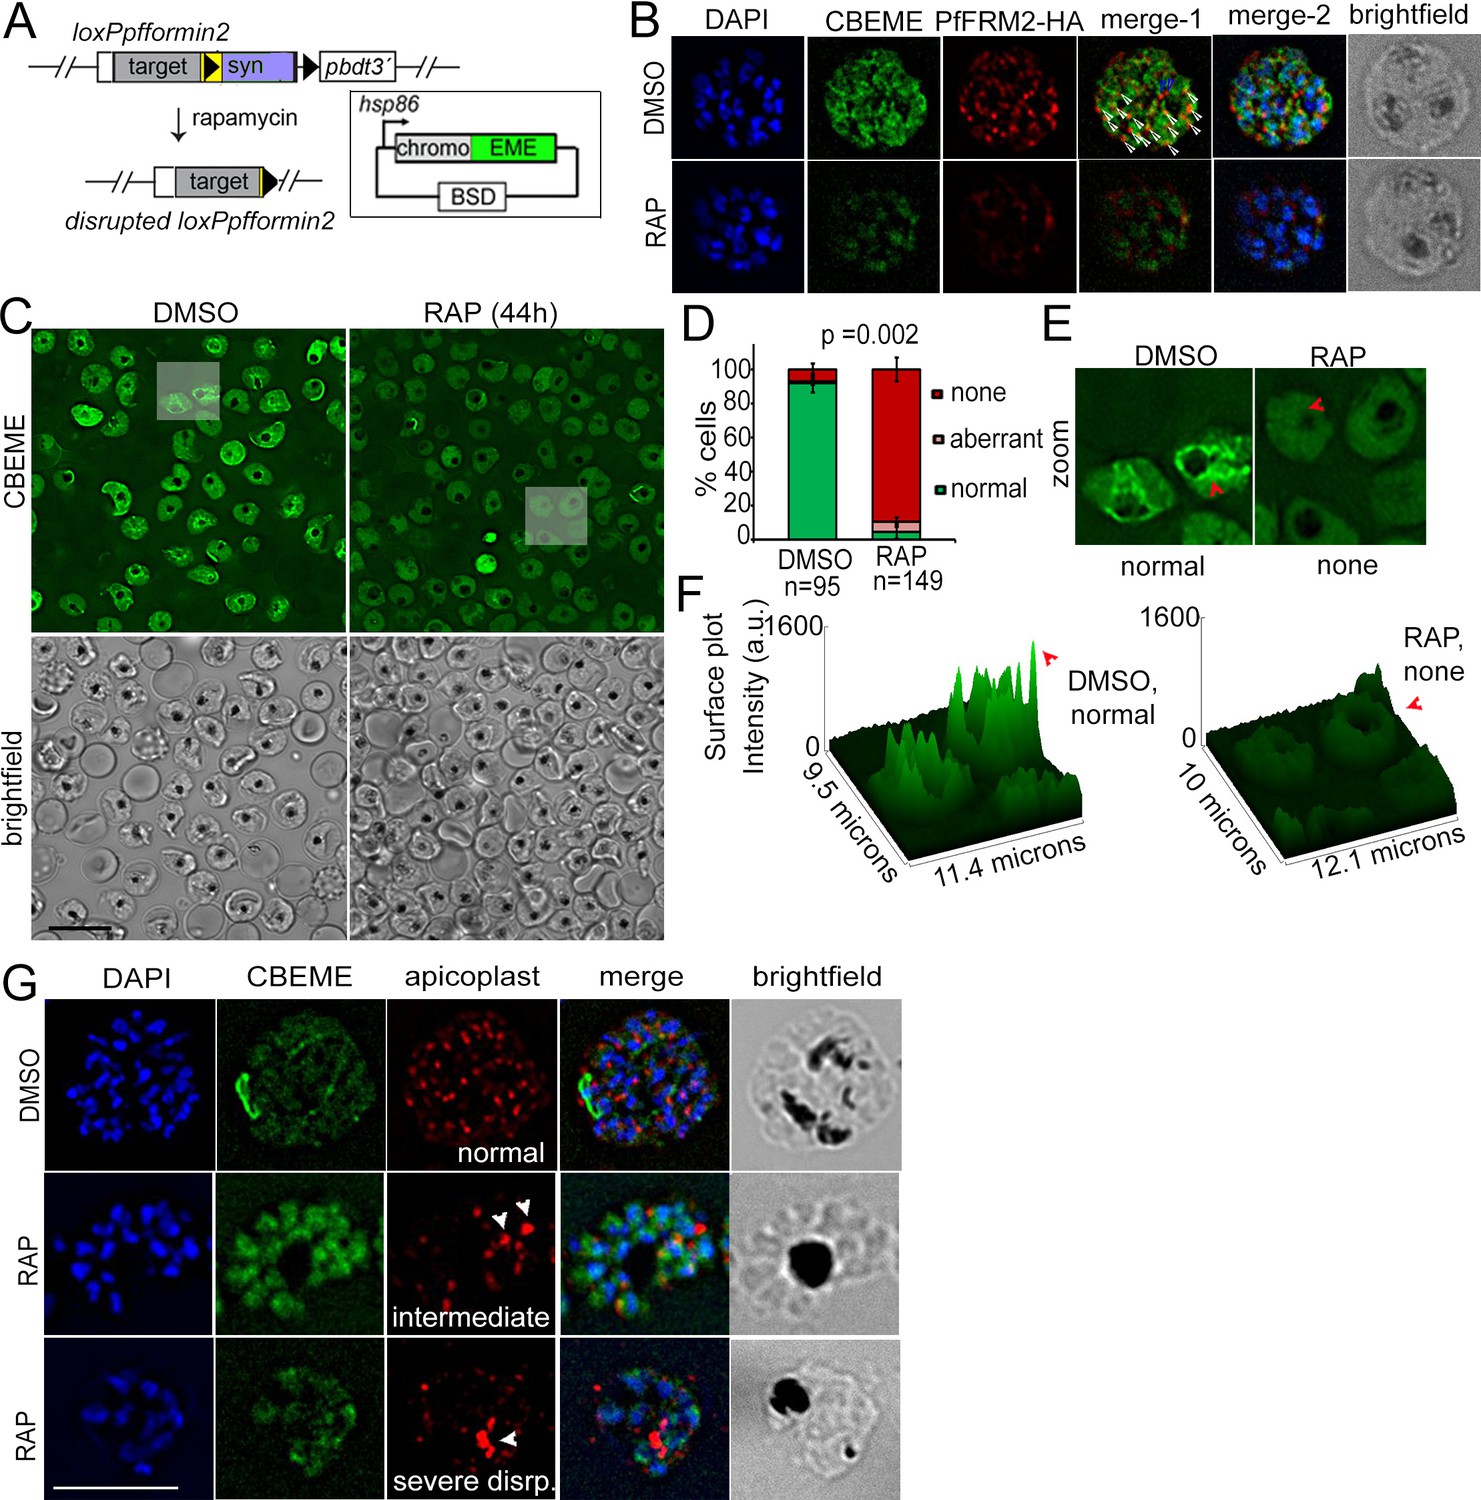
Conditional deletion of PfFRM2 abrogates the intracellular F-actin network in P. falciparum.
(A) Strategy showing expression of p-CB-EME in the RAP-inducible LoxPpffrm2 background. (B) IFA showing PfFRM2-HA staining in the context of the F-actin network labelled by CB-EME expression (DMSO) and the subsequent loss of CB-EME and PfFRM2-HA staining in PfFRM2 cKO parasites (RAP). (C) Stills from a time-lapse movie showing loss of normal intracellular F-actin fluorescence (green). Brightfield images have been provided below. See also Video 8. (D) Graph showing loss of normal F-actin fluorescence in ~95% RAP-treated parasites. > 90% of DMSO controls show presence of the network. (E) Zoomed images of indicated boxed parasites in (C) showing loss of the actin network in RAP (none, red arrows) as compared to DMSO controls (normal). (F) Intensity surface plots clearly show a difference in localised intensity (red arrows) within cells on comparing the DMSO-control parasites with RAP-treated PfFRM2 cKOs. (G) IFA staining of the apicoplast with a CPN60 antibody (red) together with the fluorescent F-actin network (green) confirms a defect in apicoplast segregation in RAP treated parasites (white arrows). Nuclei are stained in blue and brightfield images are provided alongside. Examples of normally segregated apicoplasts, intermediate and severely disrupted apicoplasts have been provided. Scale bars 5 µm. See also Figure 5—figure supplement 1.
Figure 5—figure supplement 1
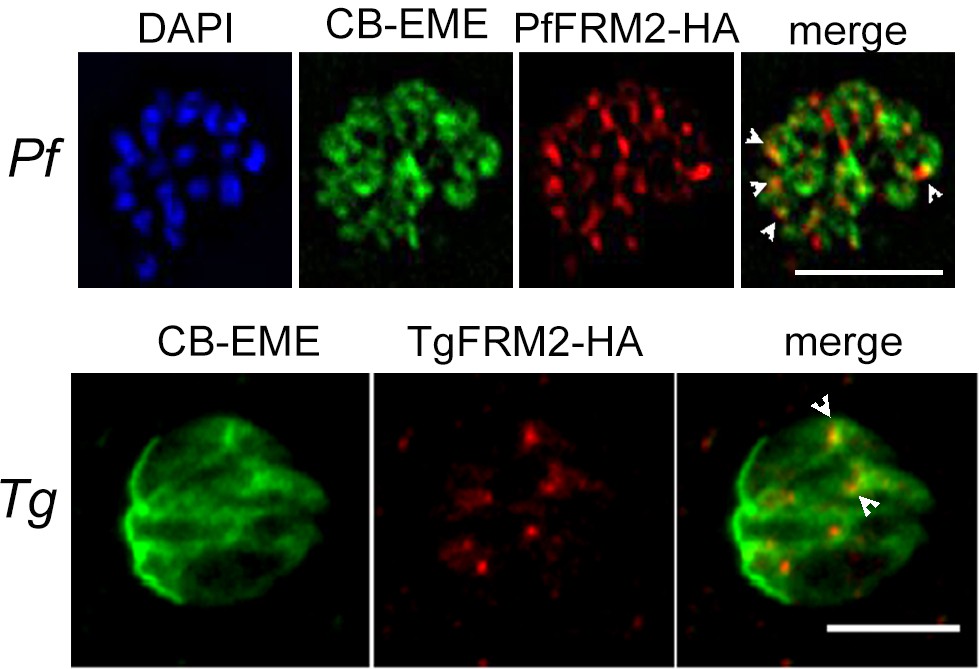
Formin-2 localises to the F-actin network in P. falciparum and T. gondii.
Upper panel. IFA depicting PfFRM2-HA localisation using an anti-HA antibody in P. falciparum expressing CB-EME (green). PfFRM2-HA punctae localised to F-actin (merge, white arrows). Nuclei were stained with DAPI (blue). Lower panel. IFA showing staining for TgFRM2-HA using an anti-HA antibody in Toxoplasma transiently expressing CB-EME (green). TgFRM2-HA localised in close proximity to intracellular actin polymerisation centres (merge, white arrows). Parasites were transiently transfected with CB-EME and grown for 48 hr. Scale bar 5 µm.
Figure 6 with 1 supplement
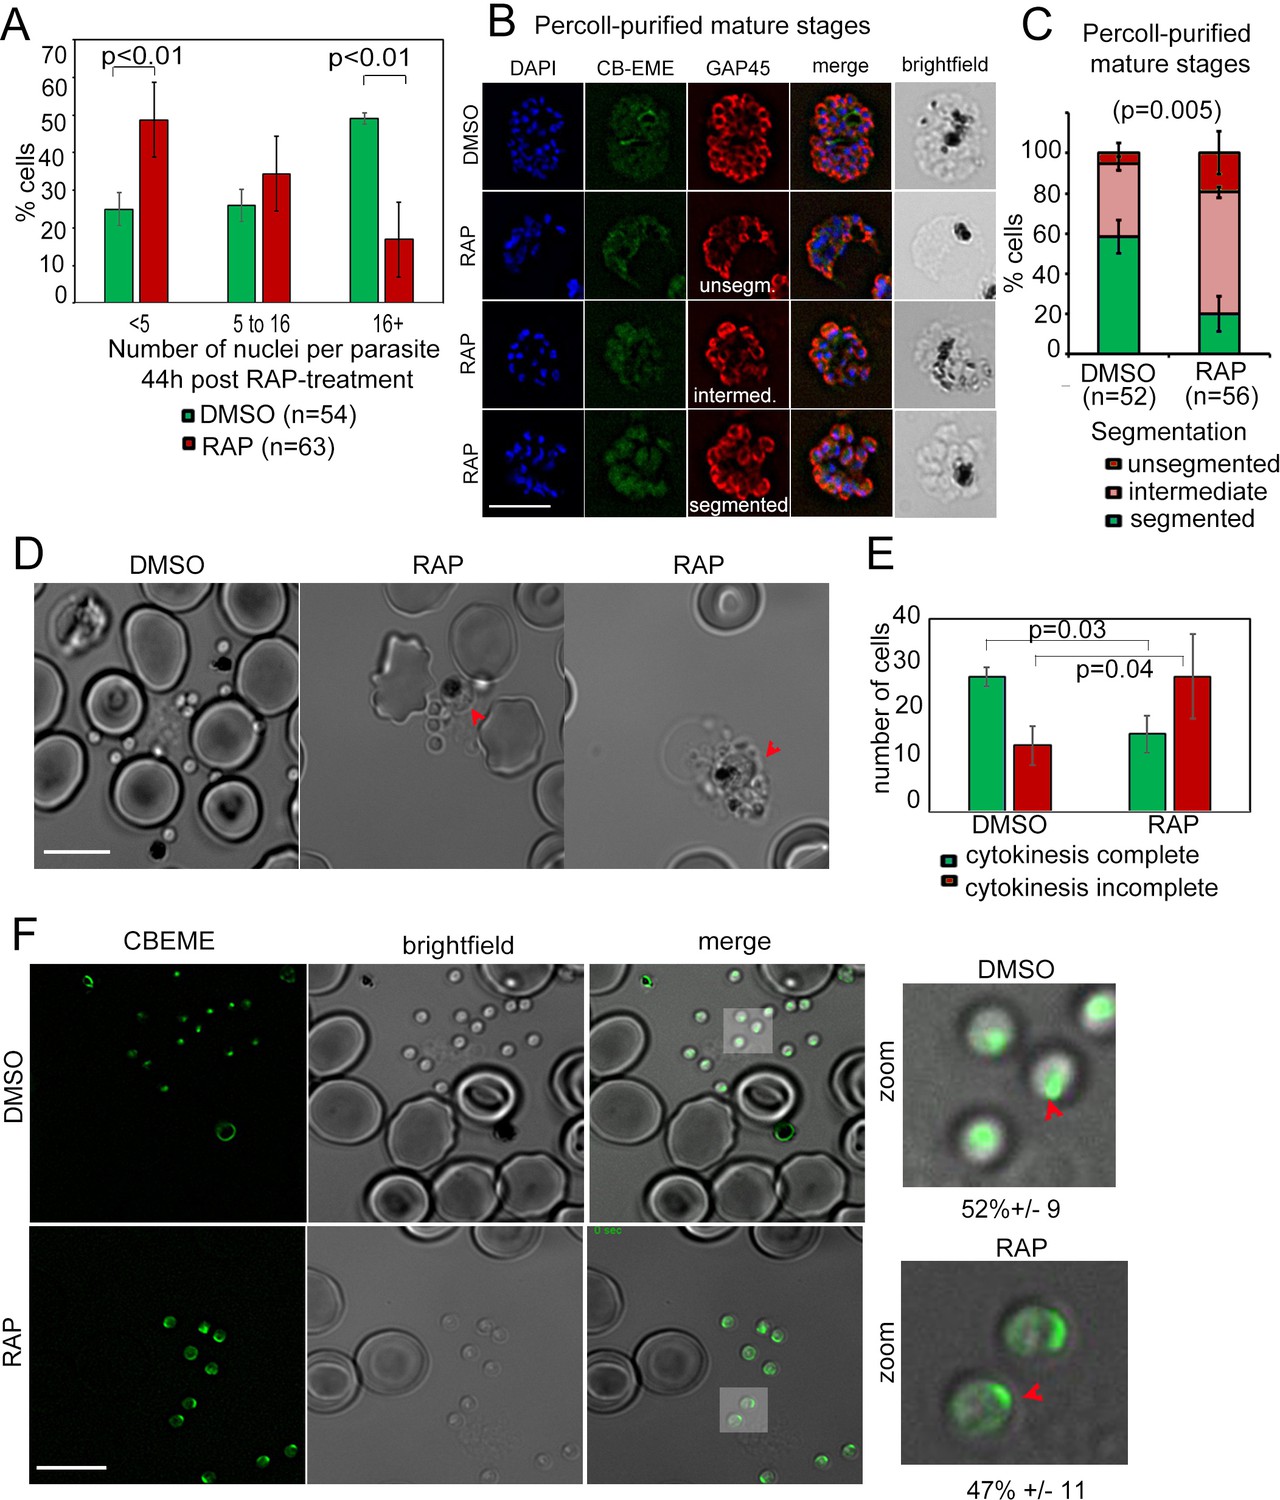
Defects in merozoite formation/cytokinesis in PfFRM2 cKO parasites.
(A) Quantification by IFA of number of nuclei in DMSO or RAP-treated LoxPpffrm2/CBEME parasites, 40 hr post treatment: Number of nuclei were binned to <5, 5 to 16 and 16 + in DMSO controls and RAP-treated parasites. The graph shows a significant reduction in the number of DAPI-stained nuclei in RAP-treated parasites. (B) IFA on Percoll-purified mature LoxPpffrm2/CBEME schizonts 44 hr post DMSO/RAP treatment, further allowed to mature for 4 hr in Compound 2: An anti-GAP45 antibody (red) revealed defects to varying degrees in IMC formation in these parasites. Examples for unsegmented, intermediate and segmented IMCs have been provided. (C) Quantification of defects in IMC formation from the IFA in B shows a significant reduction in segmented daughter merozoite formation in the RAP-treated population. (D) When DMSO/RAP-treated schizonts were allowed to egress, conjoined merozoites around the FV were apparent in the RAP-treated populations (red arrows) much more frequently than the DMSO controls. (E) Quantification of phenotypes observed in D revealed >2 times as many PfFRM2 cKOs parasites not completing cytokinesis as compared to DMSO controls. (F) Post-schizont egress, merozoites from DMSO controls and RAP-treated group show similar propensity to polymerise apical F-actin (CB-EME fluorescence shown in green). Red arrows show apical F-actin in zoomed images (right panels). Scale bars 5 µm.
Figure 6—figure supplement 1
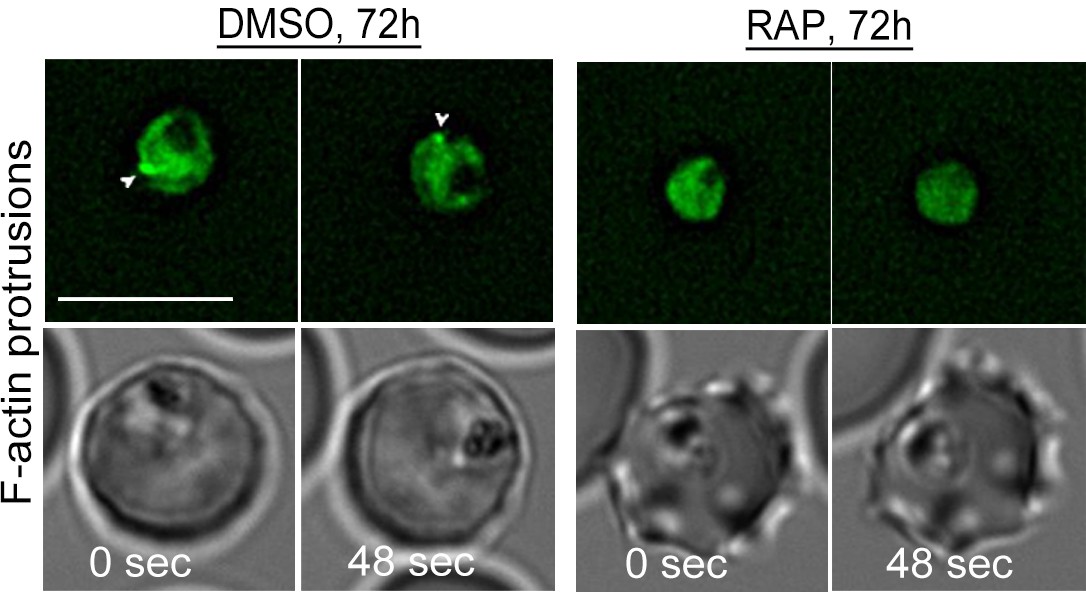
Loss of peripheral F-actin in LoxPpfFRM2/CB-EME trophozoites in the second growth cycle (72 hr post RAP-treatment).
Time-lapse deconvolution microscopy reveals a loss of intense dynamic F-actin staining at the trophozoite periphery in PfFRM2 cKOs, as compared to DMSO controls (white arrows). Two time points have been depicted and brightfield images have been supplied below. Scale bars 5 µm.
Figure 7 with 1 supplement
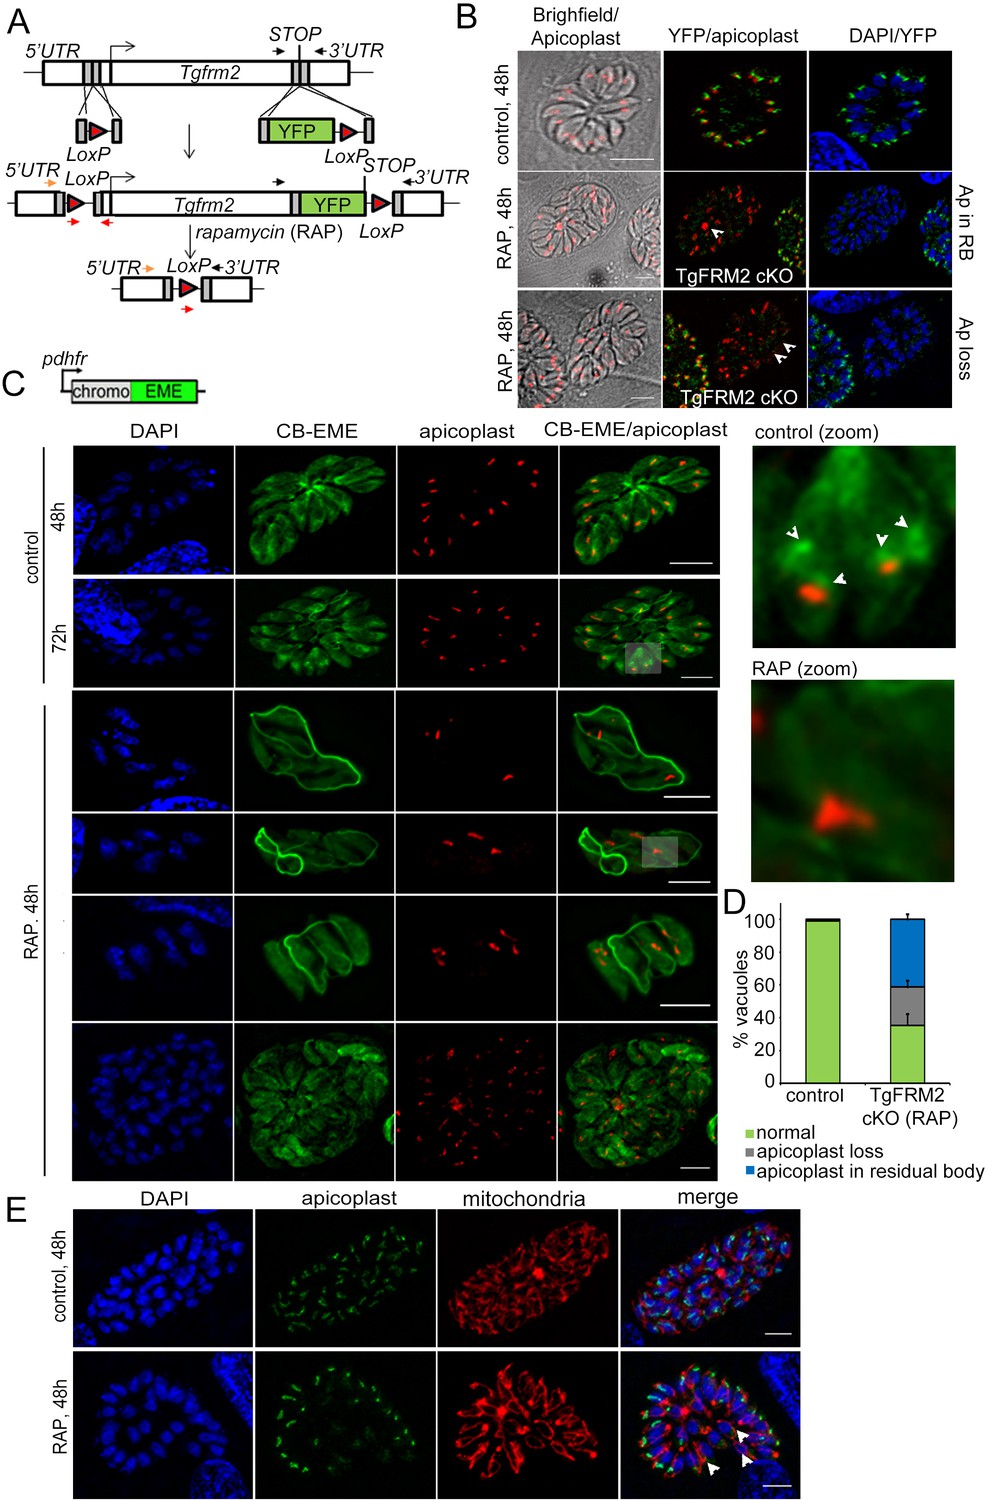
Conditional deletion of TgFRM2 disrupts normal segregation of apicoplasts together with abrogation of the intracellular F-actin polymerisation centre.
(A) Strategy to generate LoxPTgFRM2-YFP, a floxed and C-terminal YFP-tagged Tgfrm2 locus in the RH_Δku80_DiCre line. For this purpose, CRISPR/Cas9 was exploited to introduce DNA double-strand breaks in the 5’ UTR and C-terminus of the tgfrm2 gene. Integration was confirmed by PCR (see Figure 7—figure supplement 1). Arrows represent PCR primers used in Figure 7—figure supplement 1A. (B) IFA staining with anti-YFP (TgFRM2-YFP) and anti-Atrx1 (apicoplast) shows an apicoplast segregation defect in TgFRM2-YFP cKO parasites. In control parasites, TgFRM2-YFP localises to the vicinity of the apicoplast (upper panel). The loss of TgFRM2-YFP causes an apicoplast segregation defect (middle and bottom panels, white arrows). The middle and lower panels depict a TgFRM2-YFP cKO vacuole together with a TgFRM2-YFP positive vacuole for comparison. Apicoplast (Ap) phenotypes in TgFRM2-YFP cKO parasites were classified as Ap loss and Ap in residual body (RB). Scale bars 5 µm. (C) Upper panel depicts the CB-EME construct used under the dhfr promoter for expression in the LoxPTgFRM2-YFP strain. Lower panel: IFA showing CB-EME and apicoplast (anti-CPN60) in control and RAP-treated LoxPTgFRM2-YFP parasites. In untreated parasites, the apicoplast localises to intracellular actin polymerisation centres (control, white arrows in zoom). Parasites exhibiting TgFRM2 cKO-specific apicoplast phenotype lack intracellular actin polymerisation centres. Zoomed images depict indicated areas. See also Figure 7—figure supplement 1B. (D) Quantification of apicoplast inheritance defect shows a significant reduction in apicoplast numbers in TgFRM2 cKOs. Classification of the apicoplast phenotype (apicoplast loss or apicoplast in residual body) refer to IFA depicted in B. Vacuoles from three independent experiments were examined. For each biological repeat and condition (control or RAP), 100 vacuoles were counted (total n=300 for each condition). Error bars depict SD. (E) IFA showing normal mitochondrial staining (red) in TgFRM2 cKO parasites (RAP, 48 hr) which have lost their apicoplasts (white arrows). Control parasites shows normal apicoplast and mitochondria staining (upper panel). DNA was stained with DAPI, apicoplast staining was performed with anti-Atrx1 antibody and mitochondrial staining with anti-TOM40 antibody. Scale bars 5 µm.
Figure 7—figure supplement 1

Loss of TgFRM2-YFP upon RAP-treatment.
(A) Integration PCR for TgFRM2-YFP parasites described in Figure 7 confirming 5’ integration (i) and 3’ integration (ii). While the amplification of YFP indicates the presence of non-induced parasites in the rapamycin-treated population (iii), excision of TgFRM2-YFP could only be shown for parasites growing under rapamycin (iv). For the excision PCRs (iii, iv) parasites were grown with or without 50 nM rapamycin and mechanically lysed after 48 hr prior to gDNA collection. Colour-coded arrows indicate primers shown on the schematic in (v). (v) Schematic reproduced from Figure 7A shows floxing strategy of the tgfrm2 gene. (B) IFA depicting apicoplast (anti-CPN60) and background fluorescence in LoxPTgFRM2-YFP parasites (clone B), which serendipitously outlines the mitochondria. In the control population (no RAP treatment), the TgFRM2-YFP was not detectable in the absence of an YFP-antibody. RAP-treated parasites show the characteristic mislocalisation of apicoplast material into the residual body, while mitochondria appear unaffected (green). Parasites were grown for 72 hr before fixation. Scale bars 5 µm.
Figure 8 with 2 supplements
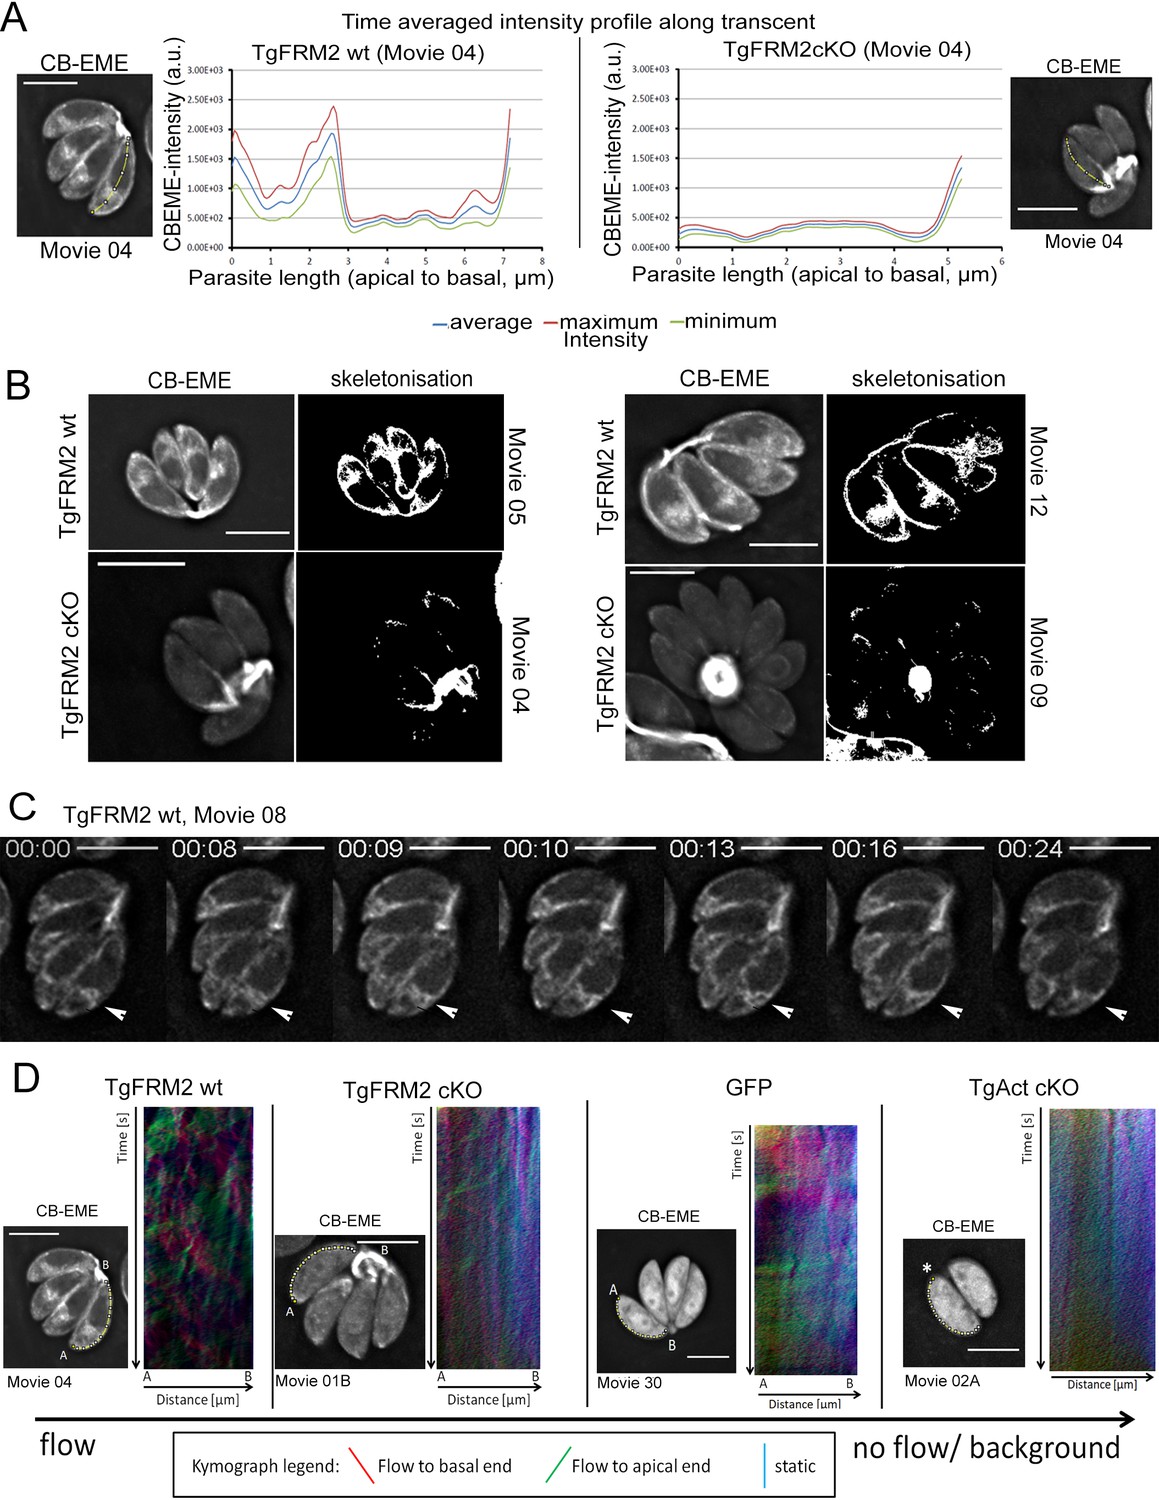
Intensity profiling and skeletonization of TgFRM2wt (control) and TgFRM2-Cas9cKO (TgFRM2cKO) parasites reveal major impact of TgFRM2 on intracellular F-actin distribution.
(A) Time-averaged local intensity profiling along the parasite middle axis (yellow line). Control TgFRM2 wt parasites show actin accumulation at the two poles and the region anterior to the nucleus (intracellular polymerization centre). Upon loss of TgFRM2, the intracellular actin polymerization centre is lost. Presence of actin at the apical pole appears reduced. (B) Skeletonisation analysis reveals actin accumulation at the periphery of intracellular parasites. Control parasites show actin at the two poles, the cytoplasmic intracellular polymerization centre and the periphery. TgFRM2 cKO mutants lack actin polymerisation within the region anterior to the nucleus and show less actin in the lateral space of the parasites. Actin still accumulates at the two poles. (C) Live imaging of TgFRM2 wt parasites illustrates the dynamic interaction between the cytoplasmic actin pool and the periphery of the parasite. Videos and skeletonisations are shown as images of collapsed t-stacks. At least 10 independent movies were produced and analysed for each condition. The figure shows representative images. Scale bars 5 µm. See also Video 9. (D) Kymograph analysis: Particle movement alongside the periphery was depicted via three colour-coded kymographs. Red tracks represent particles moving to the basal end, green tracks show particle flow to the apical end and blue depicts static particles. For TgFRM2 wt, kymographs show tracks (trajectories) of particle movement events to the apical and basal pole of the parasite. This suggests bi-directional flow of actin at the lateral parasite axis. Upon loss of TgAct, the kymographs appear more diffuse and depict only background particle flow (refer to Figure 8—figure supplement 1). While TgFRM2 cKO kymographs do not appear as diffuse as TgAct cKO kymographs, their overall flow events are less defined and more diffuse making them resemble RH-GFP kymographs. The yellow line represents the area of kymograph measurement. Particle movement was measured from the apical (A) to the basal pole (B). As polarity is difficult to define for TgAct cKO parasites, the start point of the flow measurement is indicated with an asterisk. Videos are depicted as collapsed t-stacks. At least 5 (actin) or 10 (others) independent movies were produced and analysed for each depicted condition. The figure shows representative kymographs. Conditional KO mutants represent Cas9cKO strains. WT parasites represent the non-induced TgFRM2-wt Cas9 strain. Scale bars are 5 µm. See also Figure 8—figure supplement 1, Videos 9, 10, 11 and 12.
Figure 8—figure supplement 1
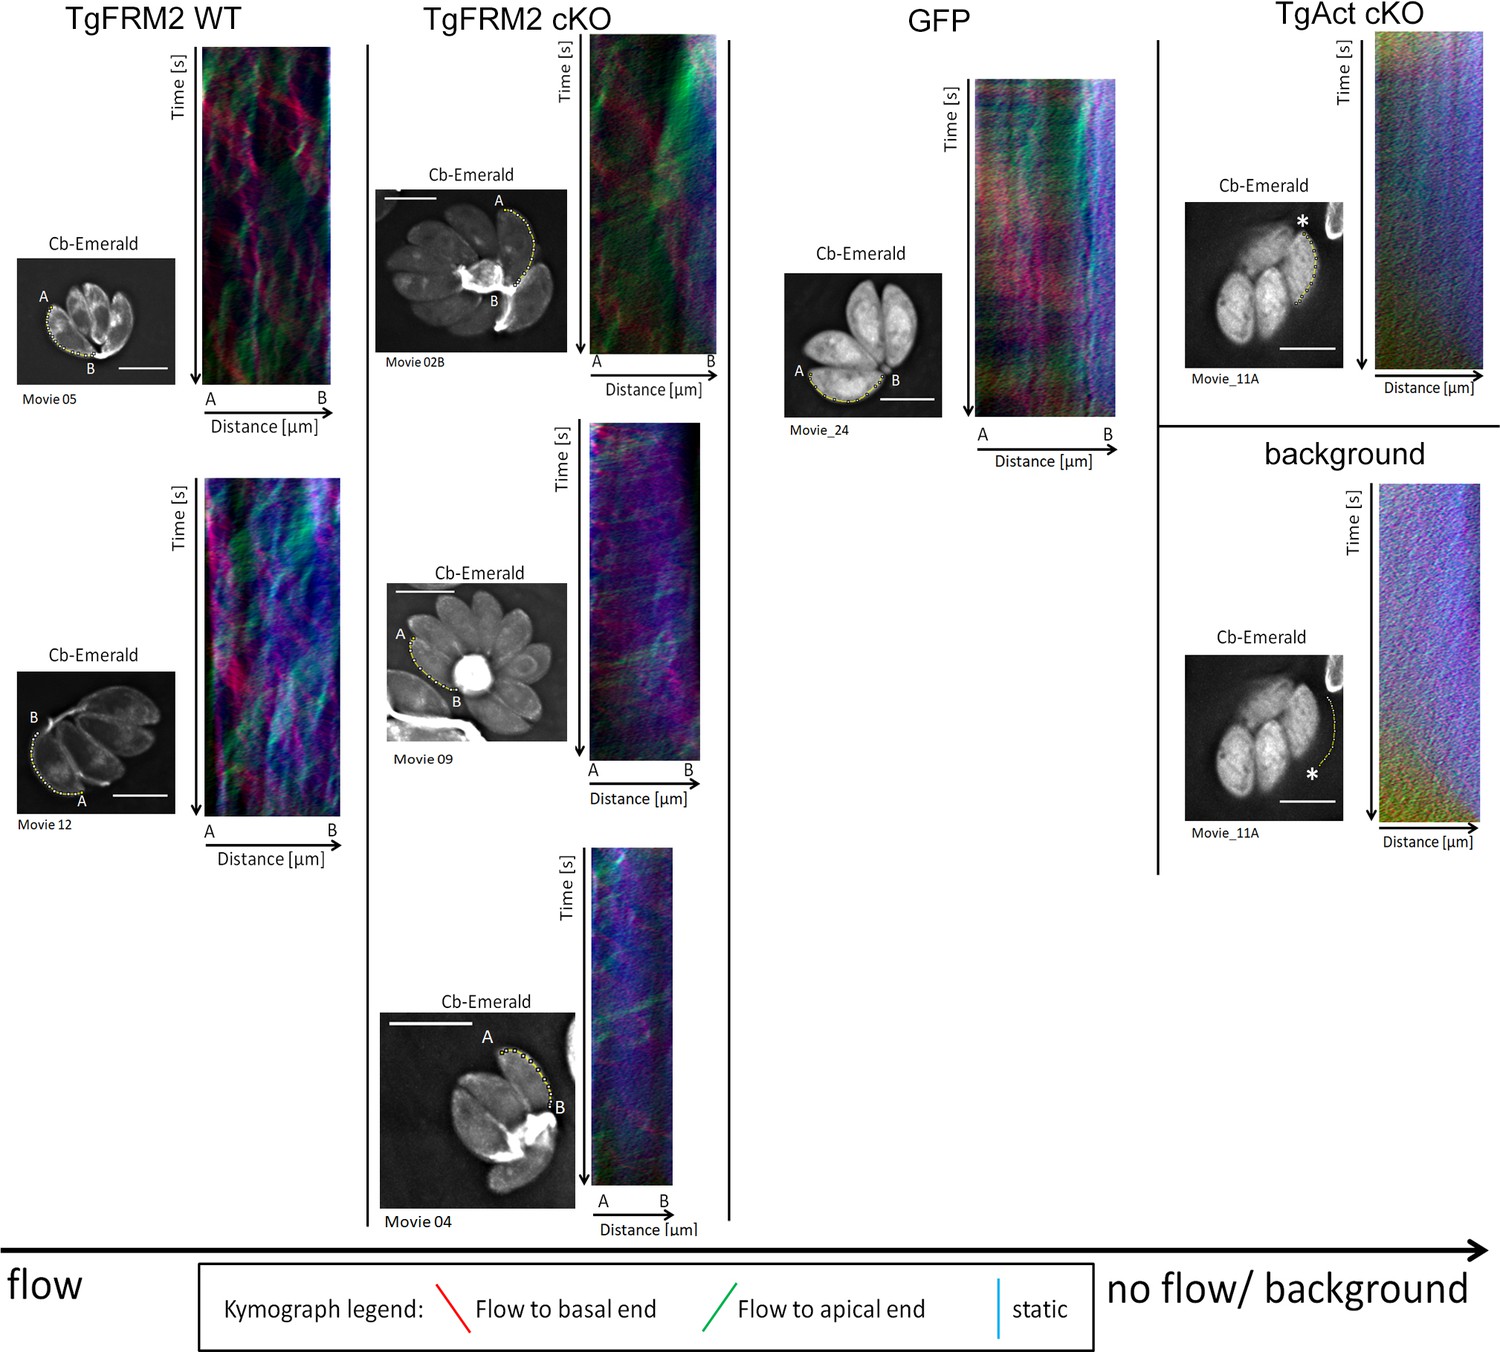
Kymograph analysis reveals bi-directional peripheral actin flow in intracellular Toxoplasma parasites.
Supplementary to Figure 8, additional three colour- coded kymographs have been depicted here. Particle movement alongside the periphery was depicted via three colour-coded kymographs. Red tracks represent particles moving to the basal end, green tracks show particle flow to the apical end and blue depicts static particles. For wild-type parasites, kymographs show tracks of particle movement events to the apical and basal pole of the parasite. This suggests bi-directional flow of actin at the lateral parasite axis. Upon loss of TgAct, the kymographs appear more diffuse and depict only background particle flow. This observation is supported by the fact that TgAct-cKO kymographs are almost not distinguishable from flow measurements performed on the movie background. While Tgformin2 cKO kymographs do not appear as diffuse as Tgactin1 cKO kymographs, their overall flow events are less defined and more diffuse making them resemble RH-GFP kymographs. The yellow line represents the area of kymograph measurement. Particle movement was measured from the apical (A) to the basal pole (B). As polarity is difficult to define for TgAct-cKO parasites, the start point of the flow measurement is indicated with an asterisk. Videos are depicted as collapsed t-stacks. At least 5 (actin) or 10 (others) independent movies were produced and analysed for each depicted condition. The figure shows representative kymographs. Conditional KO mutants represent Cas9cKO strains. WT parasites represent the non-induced TgFRM2-wt Cas9 strain. Scale bars are 5 µm. See also Videos 9, 10, 11 and 12.
Figure 8—figure supplement 2
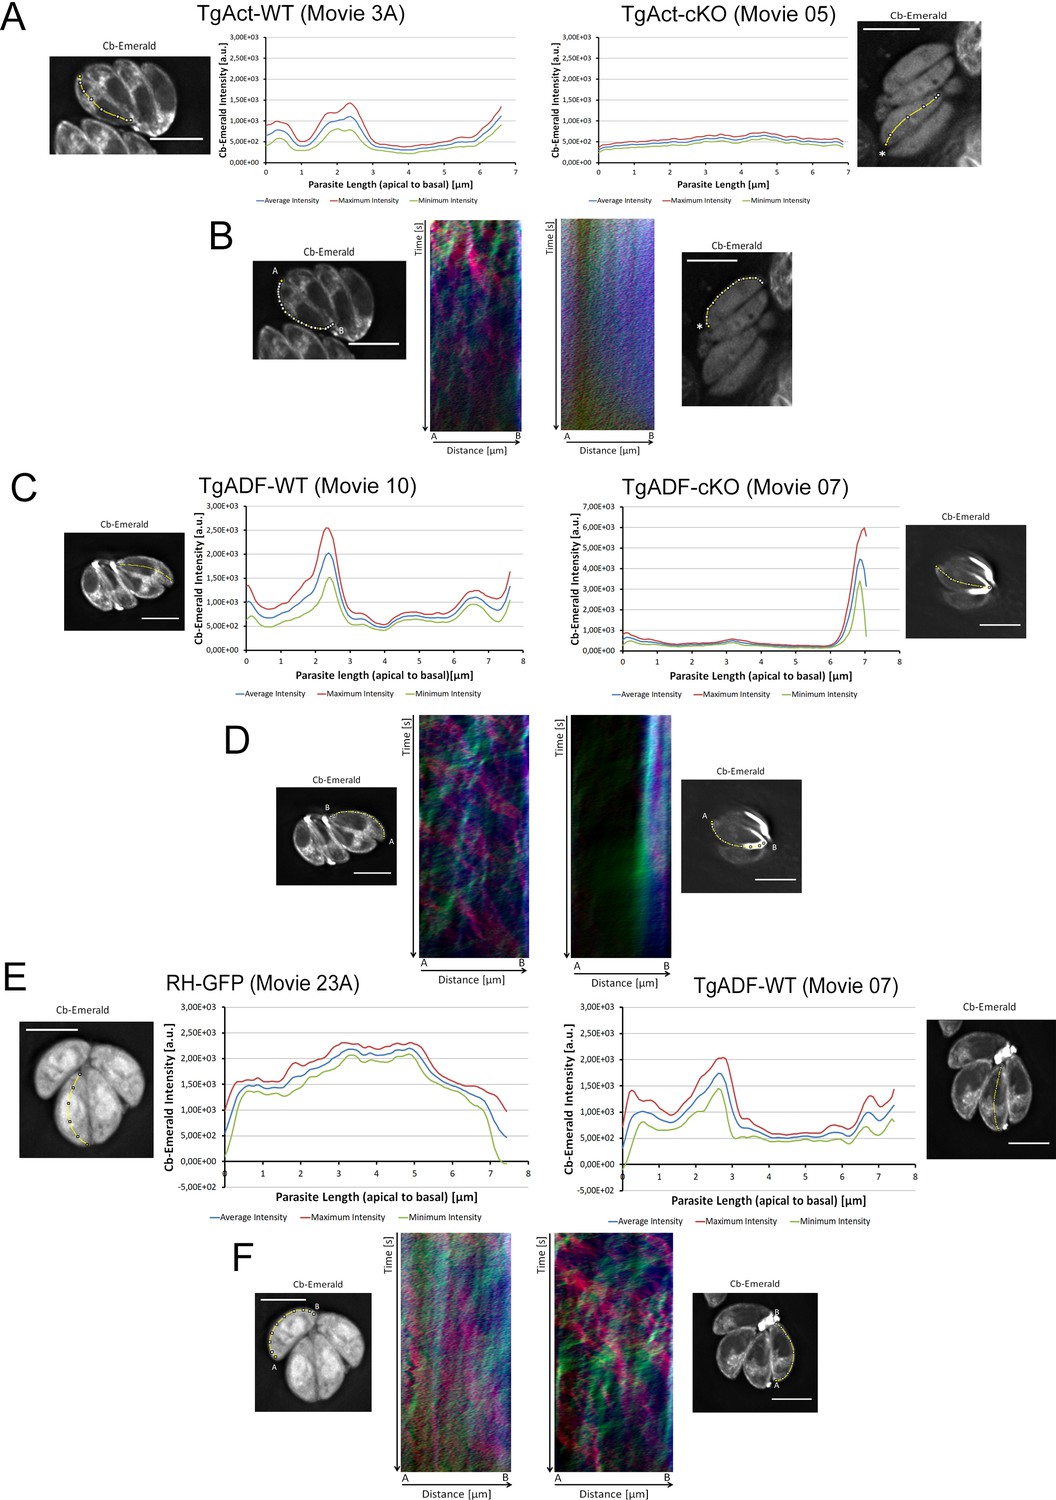
Time-averaged local intensity profiling and kymograph analysis for Toxoplasma parasites.
(A and B) TgAct wt vs TgAct-Cas9cKO (TgAct-cKO) parasites (see also Video 10). (C and D) TgADF-wt vs TgADF-Cas9cKO (TgADF-cKO) parasites (see also Video 11). By showing diffuse particle movement along the parasite periphery and strong accumulation of static signal at the basal end, TgADF-cKO kymographs support the characteristic TgADF-cKO phenotype as described in time-averaged intensity profiling. (E and F) RH-GFP parasites vs wild-type control parasites (TgADF-wt) (See also Videos 11 and 12). Distribution of GFP throughout the parasites as depicted by intensity profiling is distinct from Cb-EME distribution along the middle axis. The yellow line represents the area of measurement. Particle movement (kymograph analysis) was measured from the apical (A) to the basal pole (B). As polarity is difficult to define for TgAct cKO parasites, the start point of the flow measurement is indicated with an asterisk. Videos are depicted as collapsed t-stacks. At least 5 (actin) or 10 (others) independent movies were produced and analysed for each depicted condition. The figure shows representative intensity profiles and kymographs. Scale bars 5 µm.
Figure 9
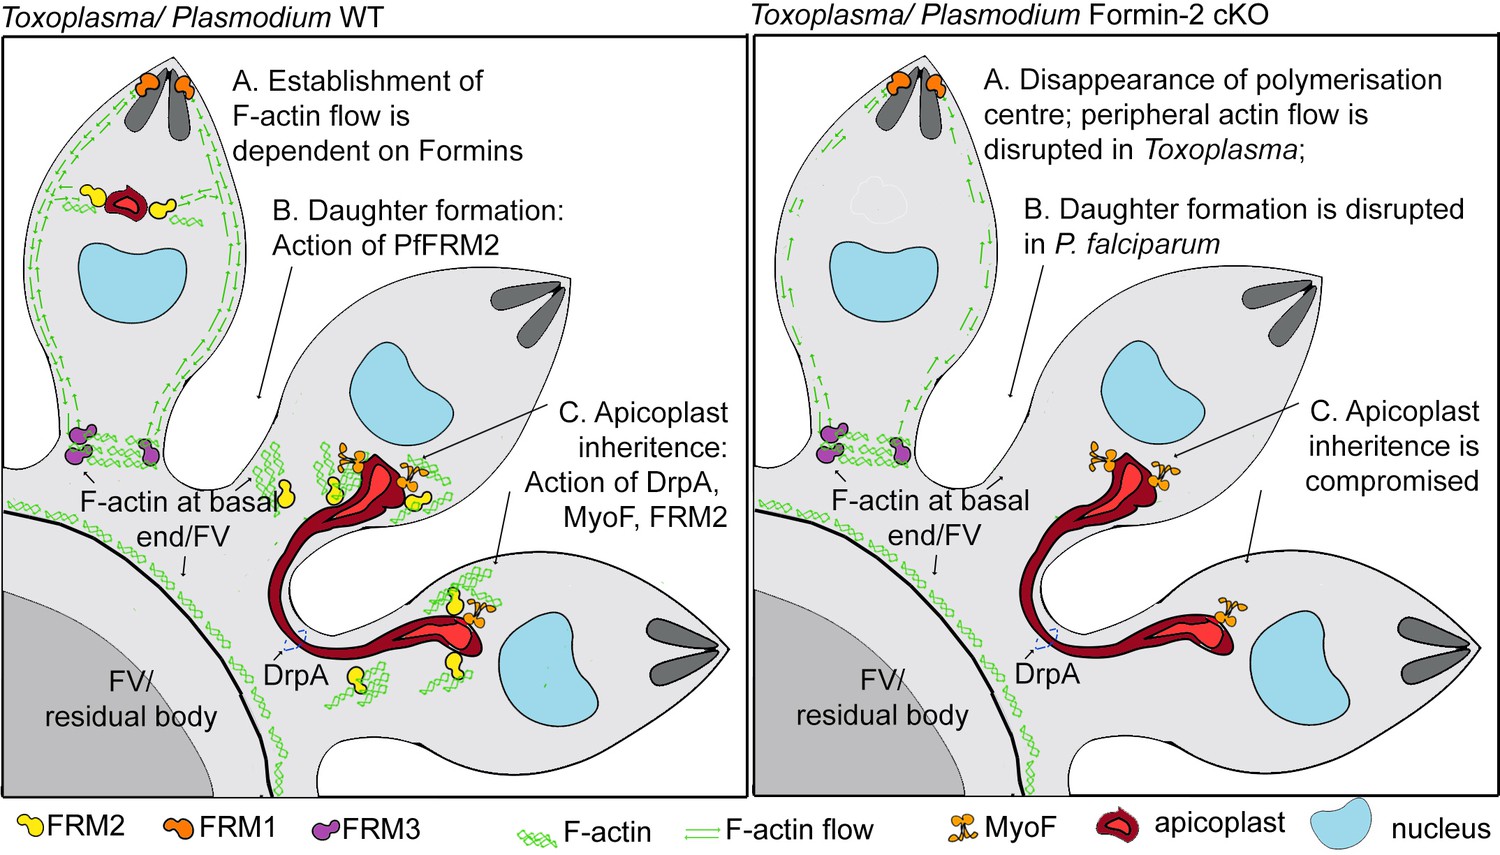
A model summarising Formin-dependent F-actin organisation, achieving apicoplast inheritance and daughter formation during intracellular replication of in P. falciparum and T. gondii.
Toxoplasma/P. falciparum WT parasites: (A) Establishment of actin flow in intracellular parasites is dependent on Formin-2 (yellow) at the F-actin organising centre anterior to the nucleus, and may be further regulated by Formin-1 (orange) at the apical end and Formin3 (purple, Toxoplasma-specific) at the basal end. (B) Daughter cell formation in P. falciparum is controlled by Formin-2-dependent F-actin polymeriation at FV/basal end of the budding daughter cells. (C) Apicoplast inheritance in both P. falciparum and T. gondii occurs via the concerted action of DrpA-mediated scission, and MyoF-mediated pulling of apicoplasts along F-actin tracks created by Formin-2. Toxoplasma/P. falciparum Formin2 cKO parasites: (A) Polymerisation centres disappear with a complete lack of intracellular F-actin. In Toxoplasma, Formin-3 can still make extracellular F-actin connections between daughter cells. Establishment of bidirectional peripheral F-actin flow is disrupted. (B) Daughter cell formation in P. falciparum is compromised in Formin2 cKOs, possibly due to the lack of F-actin at the cytokinetic furrow. (C) Apicoplast inheritance in both P. falciparum and T. gondii is compromised due to the unavailability of tracks for movement of apicoplasts.
Author response image 1

Actin flow in Toxoplasma.
Videos
Video 1
Rapid shape changes of ring stages of P. falciparum expressing CB-EME (green).
Acquisition time is shown in seconds. Scale bar 5 µm.
Video 2
Dynamic Filopodia-like F-actin extensions from the parasite edges into the RBC cytosol.
Acquisition time is shown in seconds. Scale bar 5 µm.
Video 3
Dynamic actin filaments in CB-EME expressing parasites (DMSO) are disrupted upon addition of cytochalasin-D and stabilised upon addition of jasplakinolide.
The green channel shows CB-EME expression. Brightfield images also shown. Acquisition time is shown in seconds. Scale bar 5 µm.
Video 4
Polar polymerisation of F-actin at the merozoite tip following egress.
Time lapse images of a representative schizont which undergoes egress, followed by polymerisation of F-actin at the merozoite edge (white arrows appearing). Images (green channel, CBEME) and brightfield (greyscale) were acquired every 5 s. Acquisition time is shown in seconds. Scale bar 5 µm.
Video 5
F-actin dynamics in gametocytes.
Two representative examples of gametocytes expressing CB-EME show dynamic filaments running along the parasite length and enriched at the tips. Acquisition time is shown in seconds. Scale bar 5 µm.
Video 6
Multilobular structures of trophozoites are not lost upon addition of cytochalasin-D.
https://doi.org/10.7554/eLife.49030.010
Video 7
CB-EME staining disappears upon conditional genetic deletion of pfact1.
Ring stage LoxPpfACT1/CBEME parasites were pulse treated with DMSO or RAP for 4 hr and imaged after 40 hr. CB-EME was imaged in the green channel and shows a disappearance of F-actin upon RAP-treatment. Mitochondria were stained with Mitotracker (red channel). Acquisition time is shown in seconds. Scale bar 5 µm.
Video 8
Actin filaments disappear upon genetic deletion of pffrm2.
Ring stage LoxPpfFRM2/CBEME parasites were DMSO- or RAP-treated for 4 hr and imaged 40 hr later. CB-EME was imaged in the green channel and shows a disappearance of intracellular F-actin upon RAP-treatment. Acquisition time is shown in seconds. Scale bar 5 µm.
Video 9
F-actin dynamics in TgFRM2-wt and TgFRM2-cKO parasites.
Time-lapse movie showing CB-EME signal. The movies were captured at a speed of 0.25 s/frame. Scale bars are 5 µm. Movies are depicted at 60fps. Time is shown as mm:ss.
Video 10
F-actin dynamics in TgAct-wt and TgAct-cKO parasites.
Time-lapse movie showing CB-EME signal. The movies were captured at a speed of 0.29 s/frame. Scale bars are 5 µm. Movies are depicted at 60fps. Time is shown as mm:ss.
Video 11
F-actin dynamics in TgADF-wt and TgADF-cKO parasites.
Time-lapse movie showing CB-EME signal. The movies were captured at a speed of 0.32 s/frame. Scale bars are 5 µm. Movies are depicted at 60fps. Time is shown as mm:ss.
Video 12
Live microscopy of RH-GFP parasites.
The movies were captured at a speed of 0.33 s/frame. Scale bars are 5 µm. Movies are depicted at 60fps. Time is shown as mm:ss.
Tables
Key resources table
| Reagent type (species) or resource | Designation | Source or reference | Identifiers | Additional information |
|---|---|---|---|---|
| Gene (Plasmodium falciparum) | PfActin-1, PfACT1 PfFormin2, PfFRM2 | Das et al. (2017) Baum et al., 2008b | PF3D7_1246200 PF3D7_1219000 | |
| Gene (Toxoplasma gondii) | Tgformin2; Tgfrm2 | PMID: 22397711; Tosetti et al., 2019 | TGME49_206580; TGGT1_206580 | |
| Gene (Toxoplasma gondii) | Tgactin1; Tgact1, TgAct | Andenmatten et al., 2013; PMID: 9227855; PMID: 8601316; Whitelaw et al., 2017; PMID: 26081631; Egarter et al., 2014; PMID: 21998582; PMID: 23921463; PMID: 22397711 | TGME49_209030; TGGT1_209030 | |
| Gene (Toxoplasma gondii) | Tgadf | PMID: 20042603; PMID: 21820516; PMID: 21346192 | TGME49_220400; TGGT1_220400 | |
| Transfected construct (Plasmodium falciparum) | pCB-EME and pCB-HALO | this paper | actin-chromobody construct with emerald and HALO tags under the P. falciparum hsp86 promoter | |
| Cell line (Plasmodium falciparum) | 1G5 DiCre strain | Collins et al., 2013a | DiCre-expressing cell line | |
| Cell line (Plasmodium falciparum) | B11 DiCre strain | Perrin et al., 2018 | DiCre-expressing cell line | |
| Cell line (Plasmodium falciparum) | LoxPAct1 | Das et al., 2017 | The Actin-1 gene was floxed for DiCre-mediatedconditional excision | |
| Cell line (Plasmodium falciparum) | LoxPPfAct1/CBEME | this paper | The actin chromobody emerald construct pCB-EME was transfected on top of LoxPACT1 | |
| Cell line (Plasmodium falciparum) | LoxPPfAct1/CBHALO | this paper | The actin chromobody HALO tagged construct pCB-HALO was transfected on top of LoxPACT1 | |
| Cell line (Plasmodium falciparum) | LoxPPfFRM2-HA | this paper | The Formin-2 gene was simultaneously floxed and tagged in the B11 DiCre strain | |
| Cell line (Plasmodium falciparum) | LoxPPfFRM2-HA/CBEME | this paper | The actin chromobody construct pCB-EME was transfected on top of LoxPPfFRM2-HA | |
| Cell line (Homo sapiens) | Human foreskin fibroblasts (HFF) | ATCC | ATCC SCRC-1041; RRID: CVCL_3285 | The cell line is commercially available at ATCC |
| Cell line (Toxoplasma gondii) | RHΔhxgprt | PMID: 8662859 | ||
| Cell line (Toxoplasma gondii) | RHΔku80 DiCre | Hunt et al., 2019 | Dr Moritz Treek (The Francis Crick Institute, London) | |
| Cell line (Toxoplasma gondii) | TgFRM2-HA | this paper | The Tgfrm2 gene was endogenously tagged with 3xHA at the c-terminus | |
| Cell line (Toxoplasma gondii) | LoxPTgFRM2 (also referred to as LoxPTgFRM2-YFP-LoxP; referred to as TgFRM2 cKO or TgFRM2-YFP cKO upon excision of TgFRM2) | this paper | The Tgfrm2 gene was floxed in RH Δ ku80 DiCre parasites and endogenously tagged at the c-terminus with YFP | |
| Cell line (Toxoplasma gondii) | TgFRM2-Cas9wt (referred to as TgFRM2-wt when non-induced; referred to TgFRM2-Cas9cKO or TgFRM2-cKO when induced with Rapamycin) | this paper | RH parasites expressing a conditional Cas9 system together with a gRNA targeting Tgfrm2 | |
| Cell line (Toxoplasma gondii) | TgACT1-Cas9wt (referred to as TgACT1-wt when non-induced; referred to TgACT1-Cas9cKO or TgACT1-cKO when induced with Rapamycin) | this paper | RH parasites expressing a conditional Cas9 system together with a gRNA targeting Tgact1 | |
| Cell line (Toxoplasma gondii) | TgADF-Cas9wt (referred to as TgADF-wt when non-induced; referred to TgADF-Cas9cKO or TgADF-cKO when induced with Rapamycin) | this paper | RH parasites expressing a conditional Cas9 system together with a gRNA targeting Tgadf | |
| Cell line (Toxoplasma gondii) | RHΔhxgprt-GFP | other | Dr Musa Hassan (Unibersity of Edinburgh, The Roslin Institute, Edinburgh); the gfp gene was randomly integrated into the parasite genome. | |
| Antibody | mouse anti-actin | Angrisano et al., 2012 | RRID: AB_2665920 | Polyclonal antibody raised against a parasite-specific polypeptide epitope. IFA dilution 1:500 |
| Antibody | Rat anti-haemagglutinin (HA) | Roche | cat# 1187431001 | Monoclonal antibody raised in rat |
| Antibody | rabbit anti-GFP | Abcam | cat #ab6556; RRI D:AB_305564 | Polyclonal antibody, IFA dilution 1: 500 |
| Antibody | mouse anti-Atrx1 | (DeRocher et al., 2008) PMID:18586952 | Polyclonal antibody, IFA dilution 1:500 | |
| Antibody | rabbit anti-G2Trx | Biddau and Sheiner, unpublished. | Polyclonal antibody, IFA dilution 1:500; Dr Lilach Sheiner (University of Glasgow, Institute of Infection, Immunity and Inflammation, Glasgow) | |
| Antibody | rabbit anti-TOM40 | (van Dooren et al., 2016) PMID: 27458014 | Polyclonal antibody, IFA 1:1000 | |
| Antibody | rabbit anti-CPN60 (apicoplast) | (Agrawal et al., 2009) PMID: 19808683 | Polyclonal antibody, reactive to Toxoplasma and P. falciparum. IFA dilution 1:2000 | |
| Chemical compound, drug | Compound 2 | Collins et al., 2013b | P. falciparum Protein Kinase G inhibitor | |
| Software, algorithm | Ima ge J | Schneider et al., 2012; Schindelin et al., 2012 | ||
| Software, algorithm | ImageJ plug-in‘KymographClear’ | Mangeol et al., 2016 | ||
| Software, algorithm | KymographDirect | Mangeol et al., 2016 | ||
| Software, algorithm | Graphpad PRISM 7 ver 7.03 | GraphPad Software | Commercial software for statistical analysis |
Additional files
-
Supplementary file 1
Antibodies used in this study.
- https://doi.org/10.7554/eLife.49030.034
-
Supplementary file 2
Proteomes of interest.
- https://doi.org/10.7554/eLife.49030.035
-
Transparent reporting form
- https://doi.org/10.7554/eLife.49030.036
Download links
A two-part list of links to download the article, or parts of the article, in various formats.
Downloads (link to download the article as PDF)
Open citations (links to open the citations from this article in various online reference manager services)
Cite this article (links to download the citations from this article in formats compatible with various reference manager tools)
Formin-2 drives polymerisation of actin filaments enabling segregation of apicoplasts and cytokinesis in Plasmodium falciparum
eLife 8:e49030.
https://doi.org/10.7554/eLife.49030


