The regulation of oocyte maturation and ovulation in the closest sister group of vertebrates
- Suntory Foundation for Life Sciences, Japan
- Research Fellow of Japan Society for the Promotion of Science, Japan
Figures
Figure 1
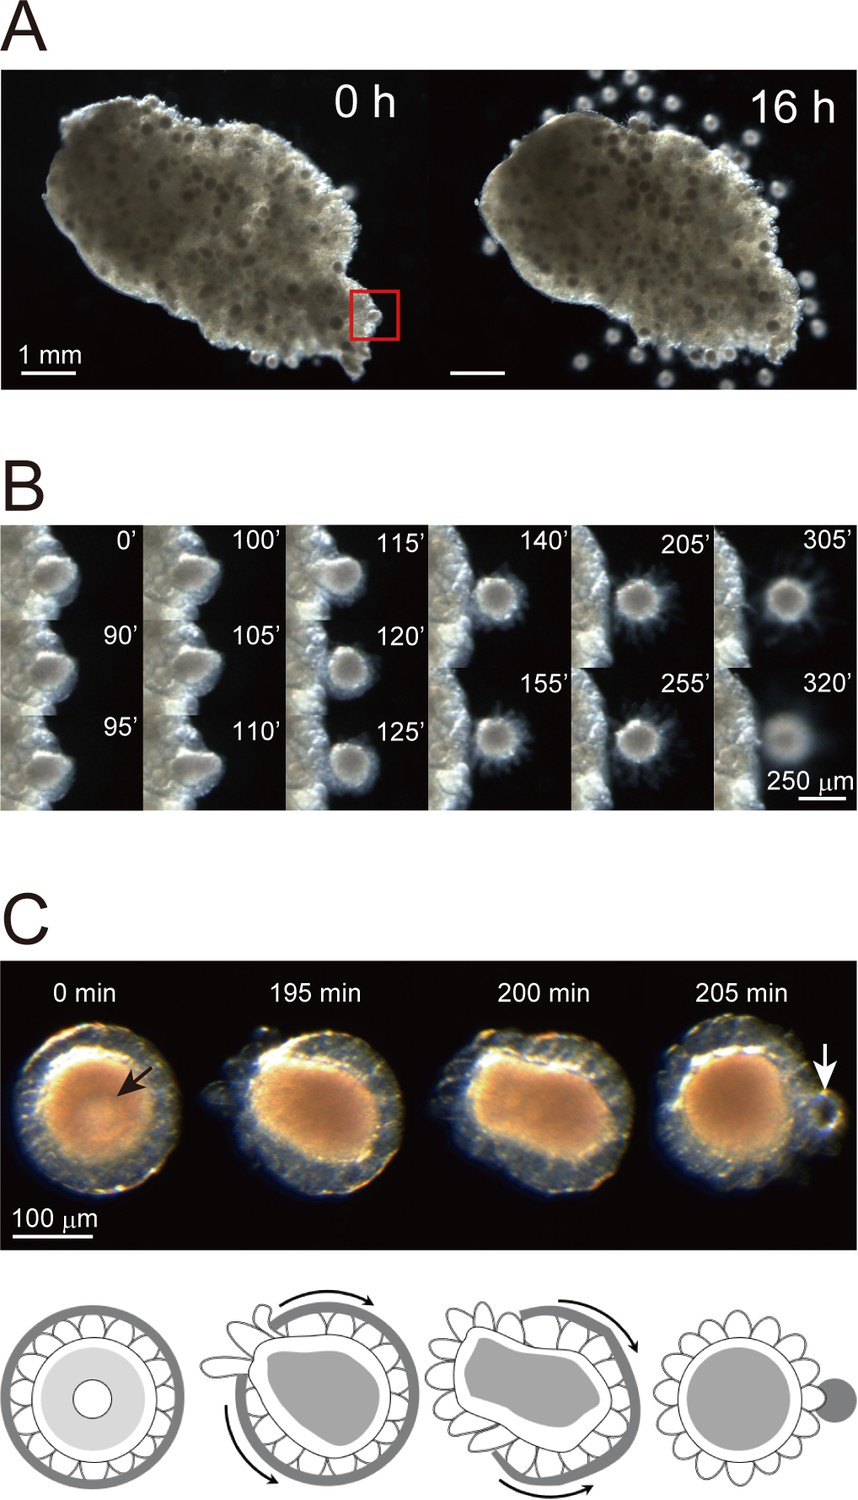
In vitro system for evaluating Ciona oocyte maturation and ovulation.
(A) A Ciona ovary was cut into half and incubated in ASW. Numerous follicles were released from the ovary after 16 hr of incubation. (B) Time-lapse images of the red-boxed area in (A) at the indicated time. The rupturing of the outer follicular cell layer led to follicle release. (C) Time-lapse images of an isolated immature/pre-ovulatory (stage III) follicle at the indicated times (upper) and corresponding schematic drawings (lower). Oocyte maturation was observed with germinal vesicle (black arrow) breakdown, and the outer follicular cell layer was ruptured and shrank after ovulation (white arrow). Scale bars are shown for the indicated length.
Figure 2 with 2 supplements
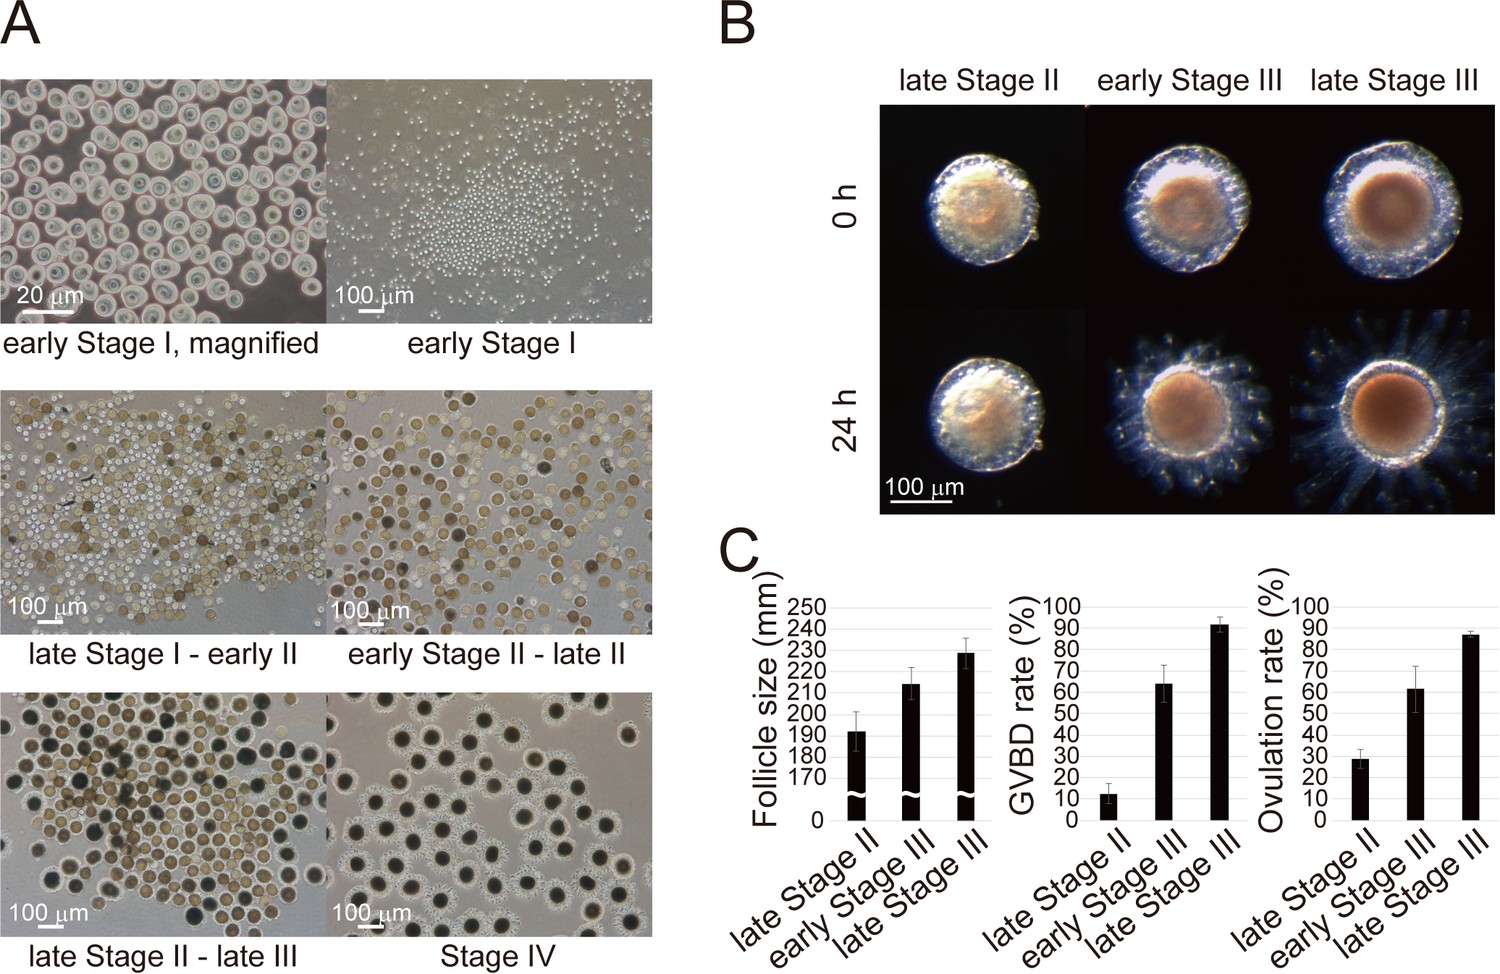
Fractionation of Ciona follicles.
(A) Isolated follicles were fractionated using stainless steel sieves of varying particle sizes (20, 38, 63, 90, or 150 μm). Each fraction contained respective stage of Ciona follicles corresponding to (i) early stage I, (ii) late stage I to early stage II, (iii) early stage II to late stage II, (iv) late stage II to late stage III, or (v) stage IV oocytes. (B) Immature/pre-ovulatory follicles were further divided into three groups as indicated, and representative follicles are shown before and after a 24 hr incubation. Scale bars in (A) and (B) represent 20 and 100 μm. (C) Size, GVBD rate, and ovulation rate of late stage II (n = 145), early stage III (n = 100), and late stage III (n = 99) follicles are shown as mean ± SEM.
Figure 2—figure supplement 1
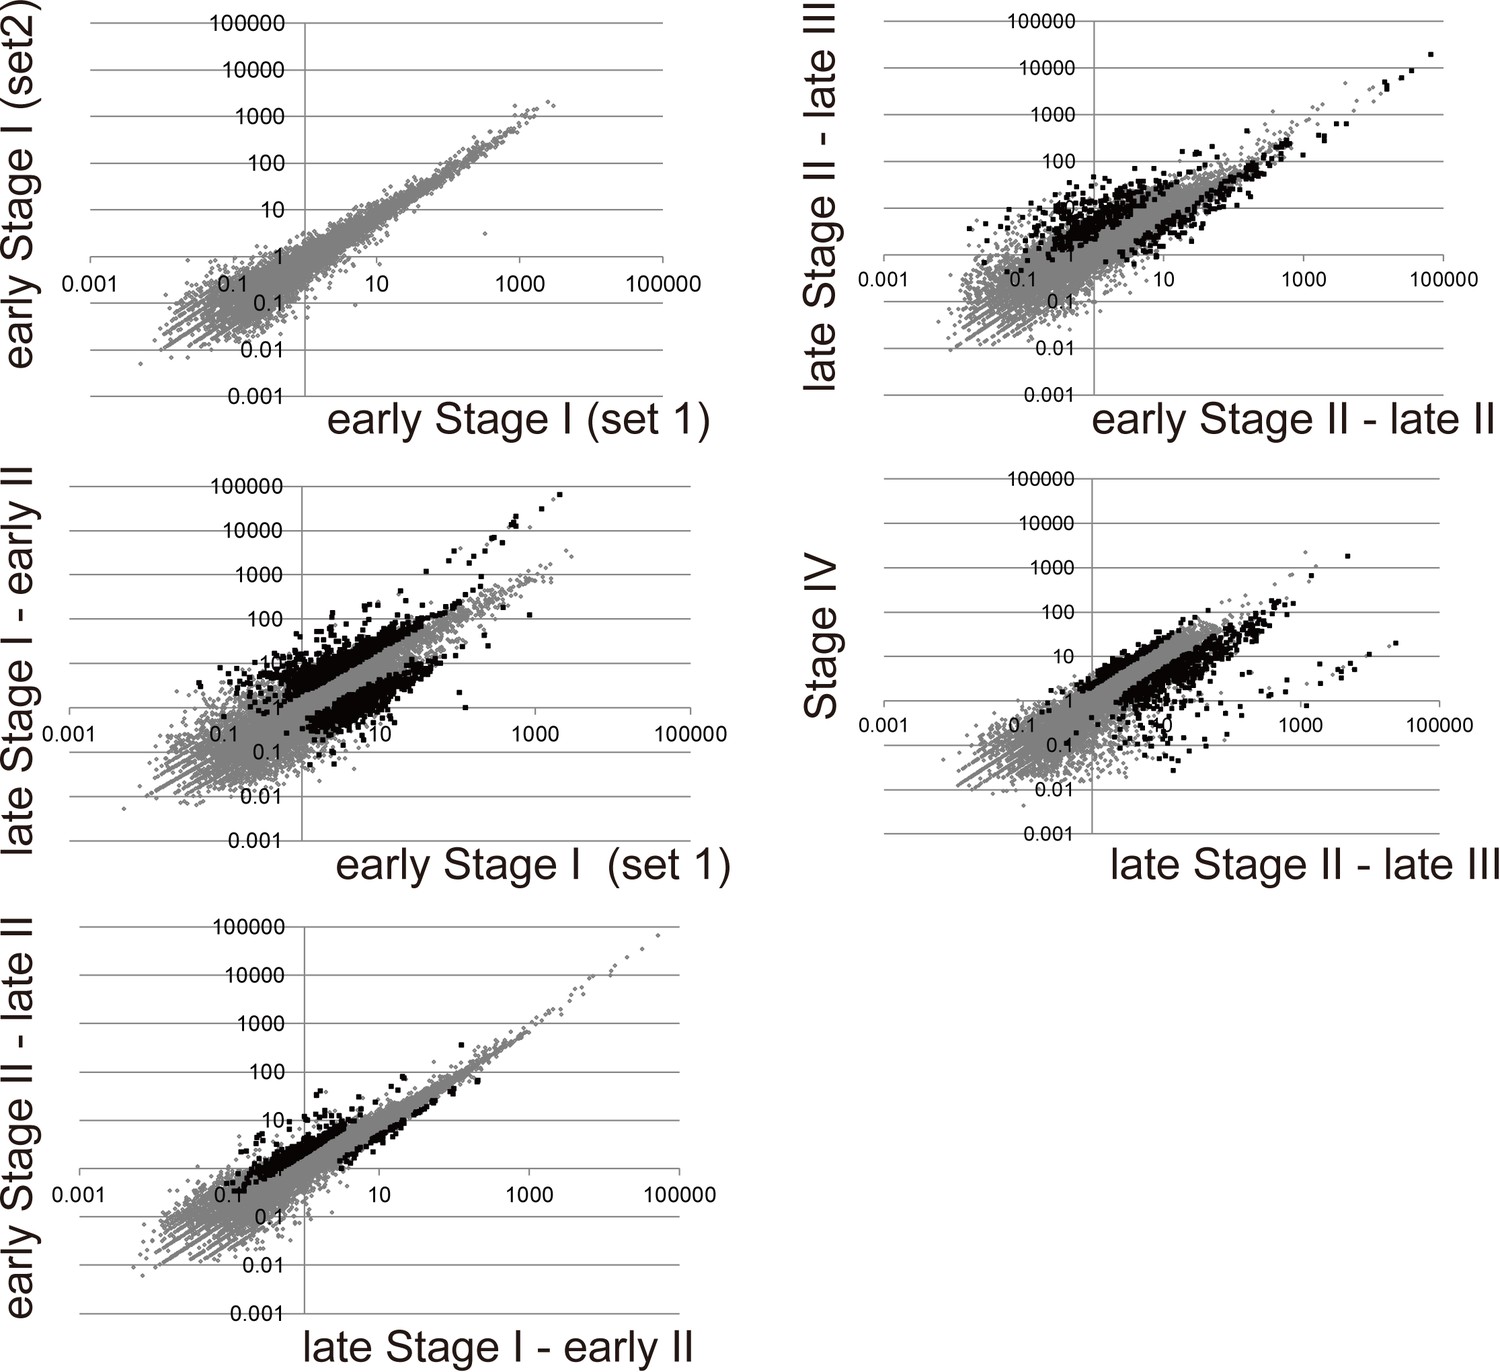
Transcriptomic profiles during follicular development.
RNA-seq was performed using 500 ng of total RNA from fractionated follicles. The expression level of each gene was calculated and shown as the reads per kilobase, megareads (RPKM) in the scatter plot. Differentially expressed genes (DEGs) that were upregulated (>2 fold) or downregulated (<0.5 fold) between two consecutive fractions are indicated in black.
Figure 2—figure supplement 2
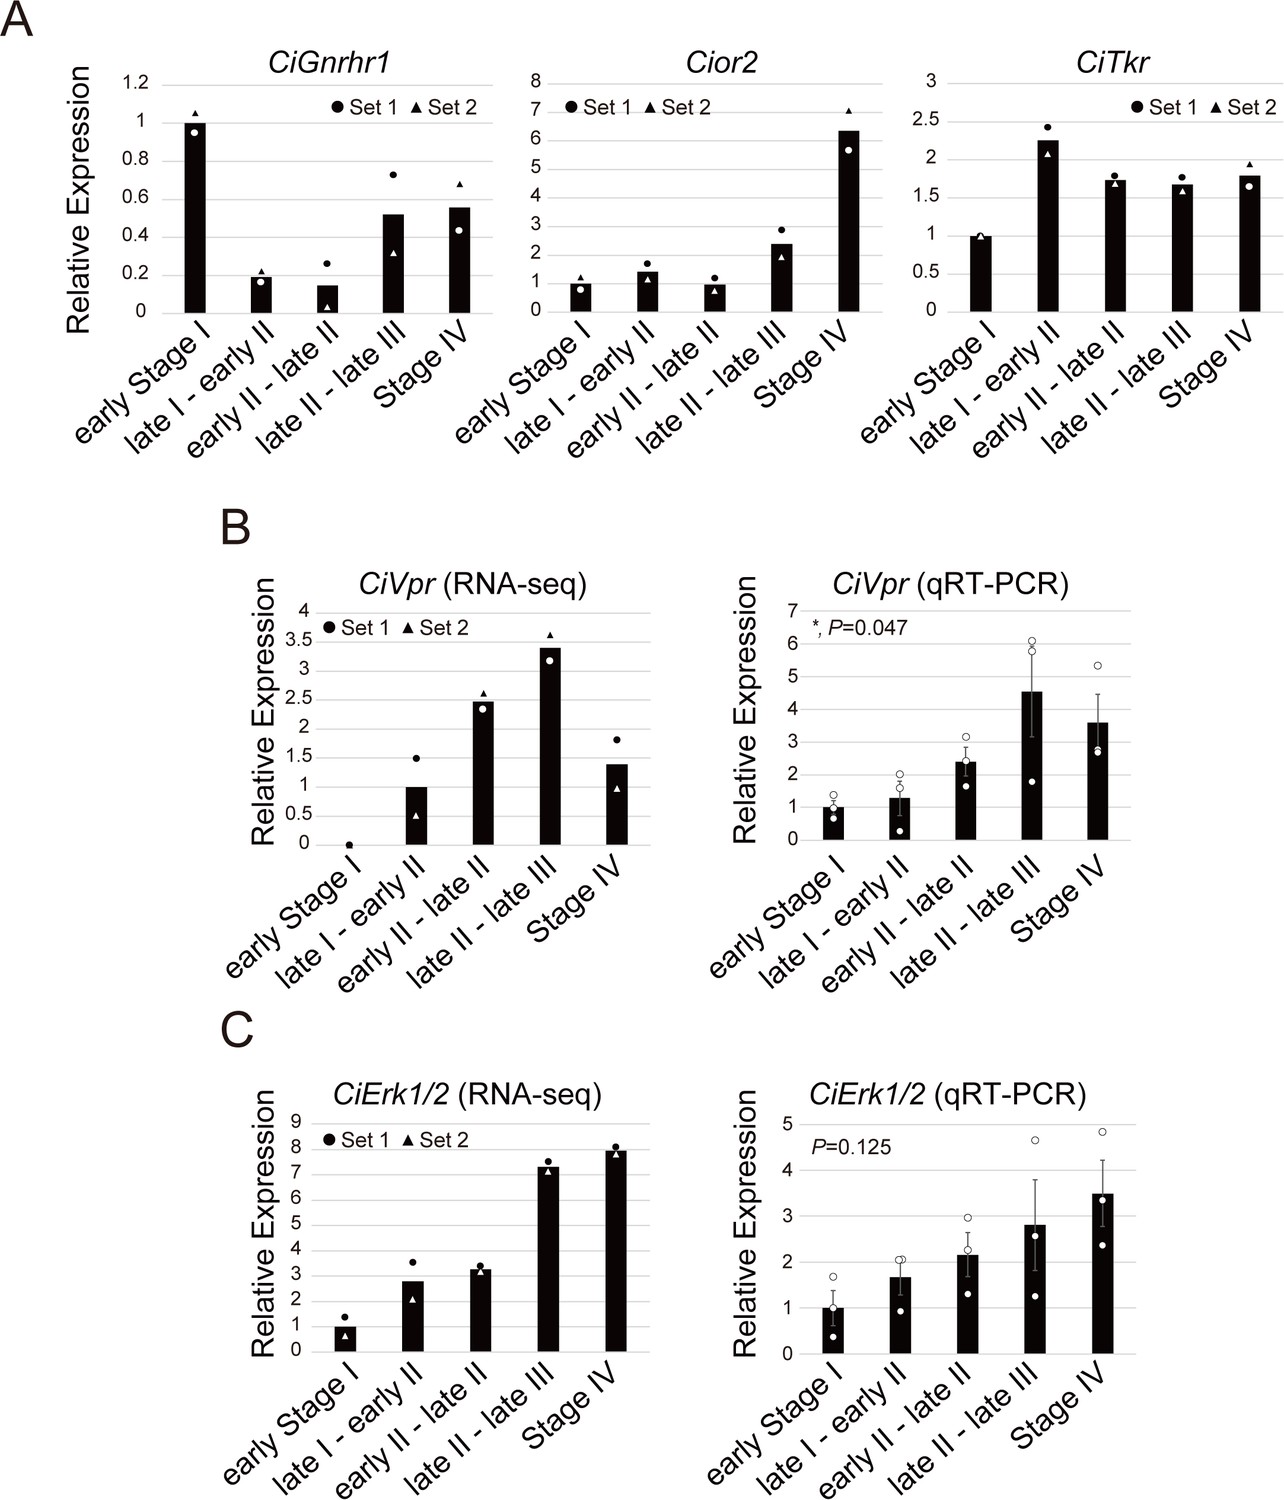
Expression of the CiVpr and CiErk1/2 genes increases toward oocyte maturation and ovulation.
(A) Expression patterns of three receptors for the known neuropeptides, tGnRHs (CiGnRHR1), cionin (CioR2), and tachykinin (CiTKR). None of the receptors were specifically upregulated before GVBD and ovulation (late stage II to late stage III). (B, C) Expression patters of the CiVpr (B) and CiErk1/2 (C) were examined by RNA-seq (left) and qRT-PCR (right), respectively. Expression was normalized to that of the ubiquitin associated domain containing one gene (CiUbac1), which RNA-seq indicated is expressed constitutively throughout follicular development. Results are shown as mean with data points and/or mean ± SEM. The expression levels of early stage I or late stage I to early stage II were set as 1. Two and three independent sets of follicles were used for RNA-seq and qRT-PCR, respectively. The qRT-PCR data were analyzed by one-way factorial ANOVA (F = 3.55; *, p=0.047 for CiVpr and F = 2.34; p=0.125 for CiErk1/2) followed by Tukey’s post hoc test. Similar patterns were observed between RNA-seq and qRT-PCR, confirming upregulation of the two genes toward oocyte maturation and ovulation.
-
Figure 2—figure supplement 2—source data 1
Source data for Figure 2—figure supplement 2.
Relative expression values of the genes to CiUbac1 (RNA-seq and qRT-PCR data) are shown.
- https://doi.org/10.7554/eLife.49062.008
Figure 3 with 1 supplement
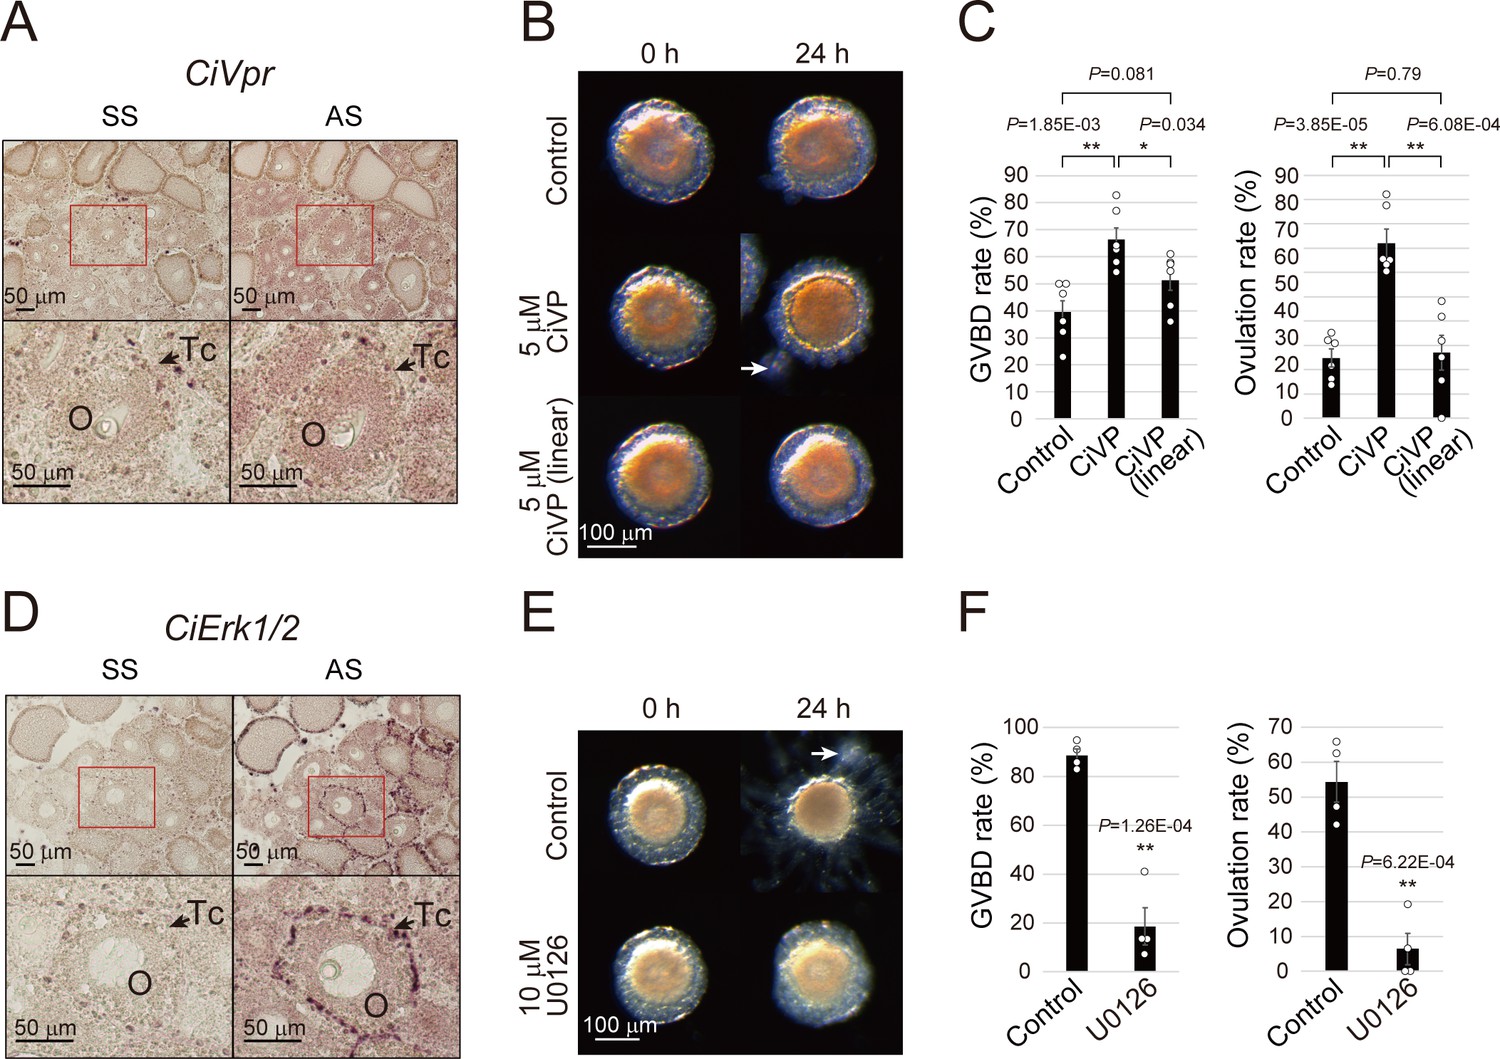
CiVP and CiErk1/2 promote both GVBD and ovulation.
(A) In situ hybridization using sense strand (SS) or antisense strand (AS) DIG-labeled probes and an NBT/BCIP system for visualizing CiVpr indicated its localization in late stage II oocytes (O). Enlarged images of red-boxed areas in the upper panels are shown below. (B) Representative images of follicles before and after treatment with CiVP for 24 hr. GVBD and ovulation of late stage II follicles were enhanced in the presence of 5 μM CiVP (t-value: −4.19; **, p=1.84E-03 in GVBD and t-value: −6.97; **, p=3.85E-05 in ovulation), whereas not in the presence of 5 μM inactive linear CiVP (t-value: −1.94; p=0.081 in GVBD and t-value: −0.27; p=0.79 in ovulation). (C) GVBD and ovulation rates were calculated from six independent experiments (n = 6; approximately 20 follicles per experiment) and found to be significantly upregulated in CiVP-treated follicles, indicating that CiVP promotes both oocyte maturation and ovulation. Data were analyzed by Student’s t test and are shown as mean ± SEM with data points. (D) In situ hybridization for CiErk1/2 indicated its localization in oocytes (O) and test cells (Tc). (E) Spontaneous GVBD and ovulation of early stage III follicles were inhibited in the presence of 10 μM U0126, an MEK inhibitor. (F) GVBD and ovulation rates from four independent experiments (n = 4) indicated that CiErk1/2 regulates both oocyte maturation (t-value: 8.72; **, p=1.26E-04) and ovulation (t-value: 6.52; **, p=6.22E-04). Data were analyzed and are shown as in (C). White arrows (B, E) indicate outer follicular cells remaining alongside the follicle. Scale bars in (A, D) and (B, E) represent 50 and 100 μm, respectively.
-
Figure 3—source data 1
Source data for Figure 3C,F, and Figure 3—figure supplement 1.
Percentages of GVBD and ovulated follicles after incubating with CiVP (Figure 3C) or a MEK inhibitor, U0126 (Figure 3F). Percentage of immature follicle or developed embryo incubated after in vitro fertilization using CiVP-induced follicles (Figure 3—figure supplement 1).
- https://doi.org/10.7554/eLife.49062.012
Figure 3—figure supplement 1

CiVP-treated follicles are competent for fertilization and development.
In vitro fertilization assay using CiVP-treated follicles. GVBD of late stage II follicles was induced by 24 hr incubation with CiVP. After an additional 24 hr incubation, follicles were mixed with Ciona sperm and incubated for 16 hr. The rate of embryo development to the pre-hatched stage was calculated (left). Data from four independent experiments were analyzed by Student’s t test and are shown as mean ± SEM with data points. The rates of immature follicle and pre-hatched embryo were significantly decreased (t-value: 4.88; **, p=2.78E-03) and increased (t-value: −6.90; **, p=4.56E-04) in the CiVP-treated follicles, respectively, confirming that CiVP induces bona fide oocyte maturation via GVBD. Representative images of immature follicle and pre-hatch embryo of CiVP-treated follicles are shown (right).
Figure 4 with 3 supplements
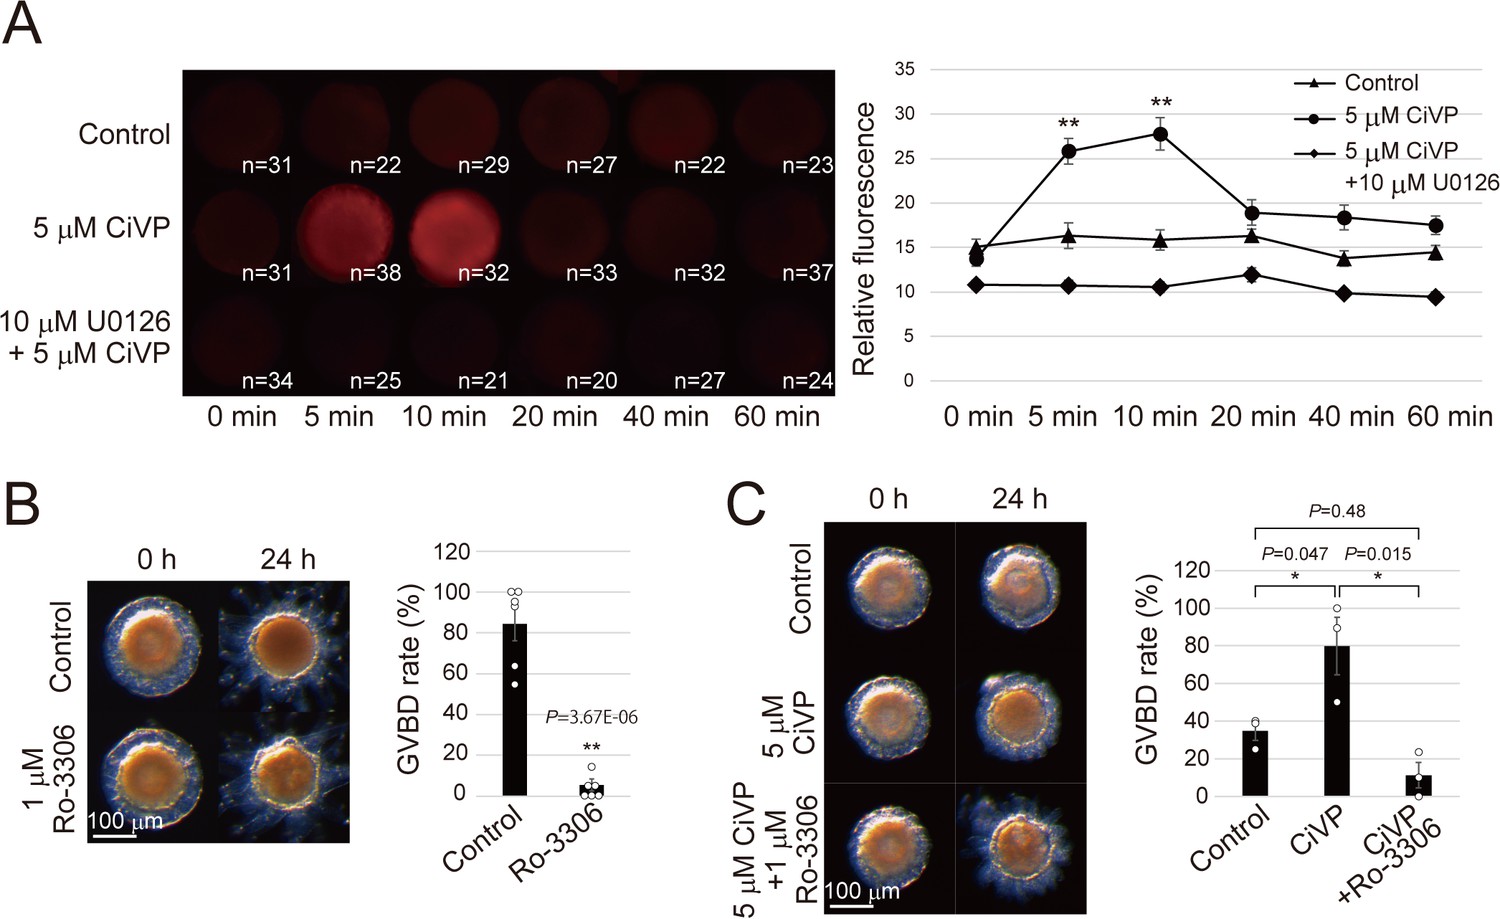
CiVP promotes GVBD via CiErk1/2-CiMPF pathway.
(A) Indicated numbers of numbers of de-folliculated oocytes pretreated with or without 10 μM U0126 were stimulated with 5 μM CiVP for 0, 5, 10, 20, 40, and 60 min. Immunofluorescence using anti-phosphorylated ERK1/2 antibody indicated specific activation of CiErk1/2 at 5 to 10 min after CiVP stimulation (F = 14.91; p=2.12E-12), which was not observed in control (F = 1.05; p=0.39) or U0126-pretreated oocytes (F = 2.13; p=0.065). Representative images are shown (left). Signal intensities were quantified using Fiji software (right), and significant activation was verified by one-way factorial ANOVA followed by Tukey’s post hoc test (**, P<0.01). (B) Treatment with 1 μM Ro-3306, a selective Cdc2 inhibitor, significantly inhibited GVBD in late stage III follicles (t-value: 9.12; **, p=3.67E-06). (C) CiVP-induced GVBD of late stage II follicles (t-value: −2.83; *, p=0.047) was disrupted by Ro-3306 (t-value: 4.12; *, p=0.015). Representative images of follicles and GVBD rates are shown. Data from six (B, n = 6) and three (C, n = 3) independent experiments were analyzed by Student’s t test and are shown as mean ± SEM with data points.
-
Figure 4—source data 1
Source data for Figure 4B,C, Figure 4—figure supplement 3A and C.
Percentages of GVBD follicles after incubating with CiVP and/or a Cdc2 inhibitor, Ro-3306 (Figure 4B and C). Relative expression values of the CiCcnb and CiCdk1 genes to CiUbac1 (RNA-seq data, Figure 4—figure supplement 3A) and relative values of in vitro CiCdk1 activity are also shown (Figure 4—figure supplement 3C).
- https://doi.org/10.7554/eLife.49062.019
Figure 4—figure supplement 1
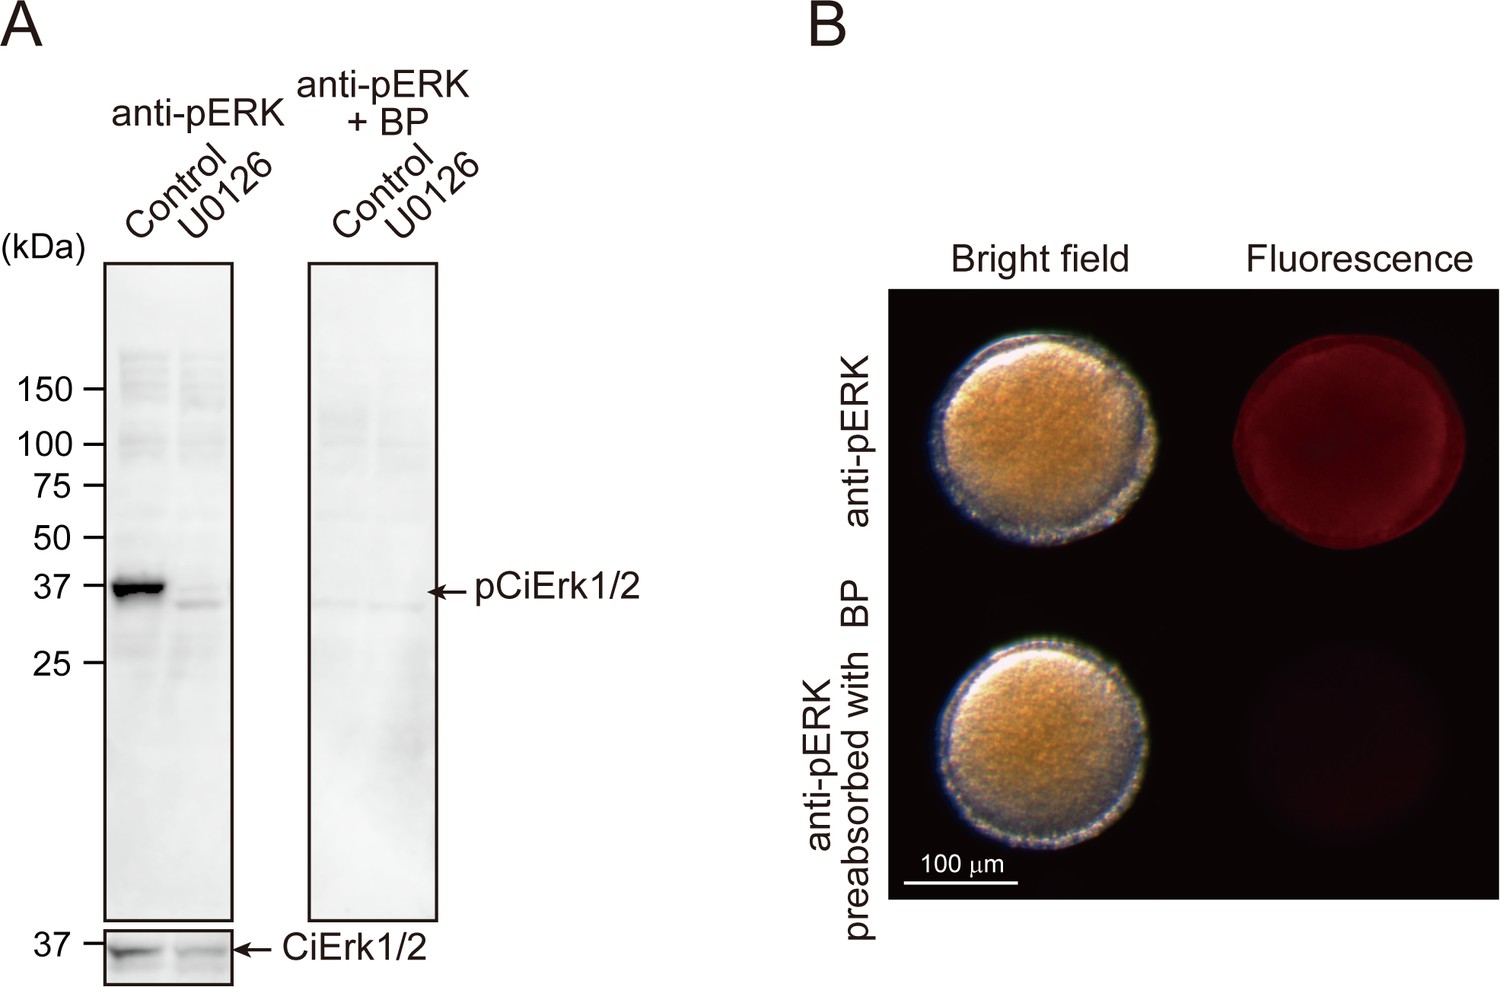
Specificity of the anti-pERK1/2 antibody.
(A) A total of 30 μg of soluble protein from stage IV follicles pre-treated with or without 10 μM U0126 for 1 hr were subjected to Western blotting. A single band of endogenous pCiErk1/2 was detected by anti-pERK1/2 antibody, whereas no bands were detected in the follicles pre-treated with U0126 (left). Similarly, the band specific to pCiErk1/2 was abolished by pre-incubation of anti-pERK1/2 antibody with blocking peptide (BP), confirming the specificity of the anti-pERK1/2 antibody and the inhibitory effects of U0126 on pCiErk1/2. Anti-ERK1/2 antibody was used as an internal control. Similar results were obtained by immunostaining using de-folliculated oocytes (B).
Figure 4—figure supplement 2
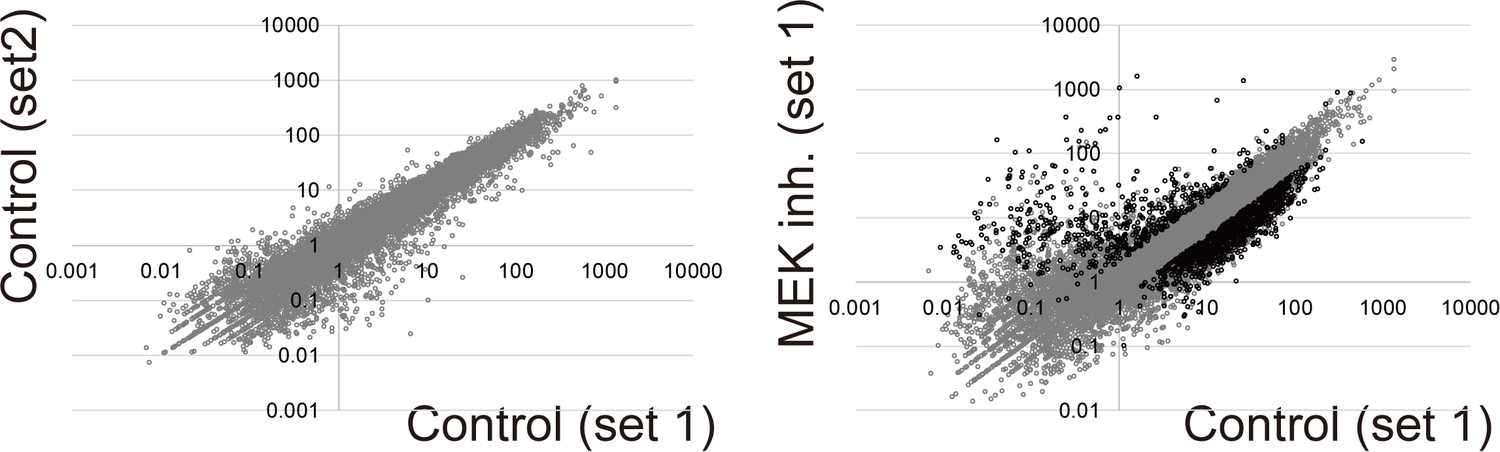
DEG-profile in MEK-inhibited follicles.
RNA-seq was performed using 150 ng of total RNA from the U0126-treated, early stage III follicles. Three independent sets of follicles were used (n = 3). Data were shown as Figure 2—figure supplement 1. Scatter plot shows various genes that were upregulated (>2 fold) or downregulated (<0.5 fold) upon MEK inhibition.
Figure 4—figure supplement 3
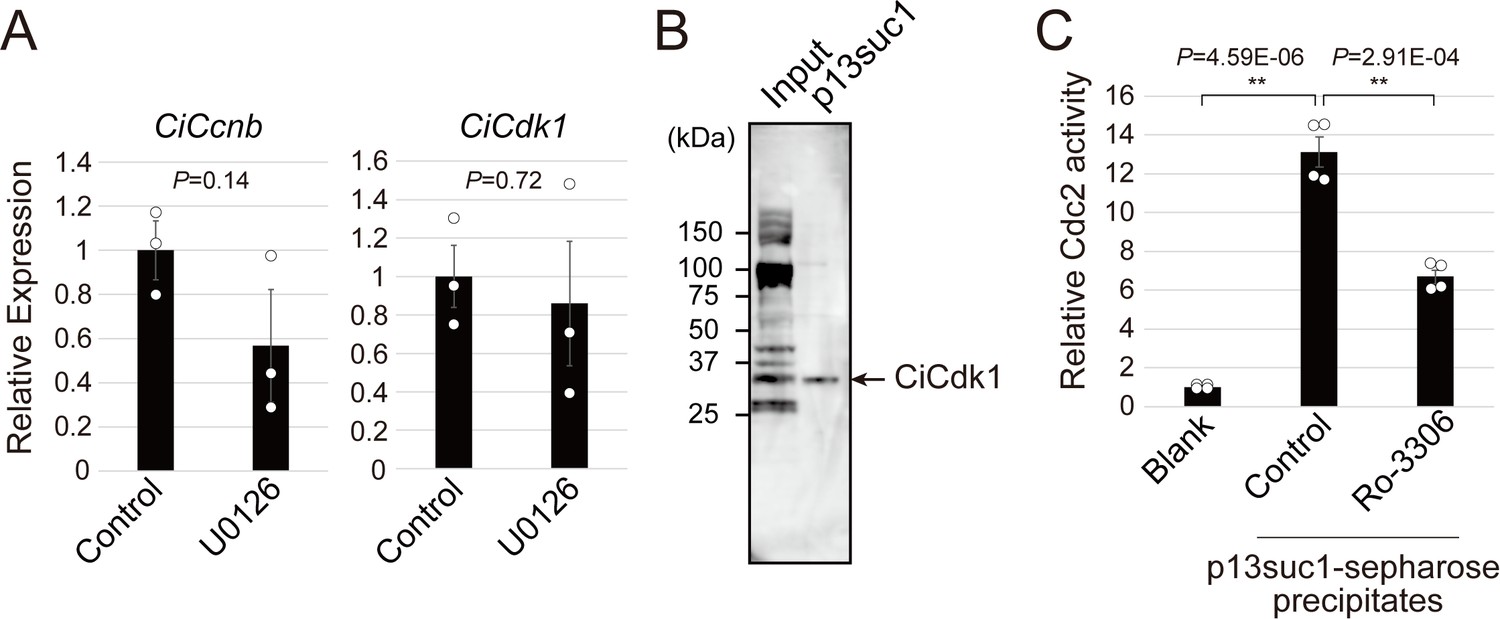
Ciona MPF is responsible for CiVP-directed oocyte maturation.
(A) RNA-seq indicated that the expression levels of the MPF component, Ciona cyclin B (CiCcnb) and CiCdc2 (CiCdk1) were not altered in MEK-inhibited follicles, suggesting the post-translation regulation of MPF. Data were analyzed by Student’s t test compared with control (t-value: 1.84; p=0.14 for CiCcnb and t-value: 0.39; p=0.72 for CiCdk1) and are shown as mean ± SEM (n = 3). (B) Western blotting using anti-PSTAIR antibody for precipitates of p13suc1-sepharose confirmed the specific enrichment of CiCdk1. (C) Significant enzymatic activity of CiCdk1 was measured (t-value: −15.48; **, p=4.59E-06). In vitro reaction with 1 μM Ro-3306, a Cdc2 inhibitor, significantly inhibited CiCdk1 activity (t-value: 7.50; **, p=2.91E-04). Data were analyzed by Student’s t test (n = 4).
Figure 5 with 3 supplements
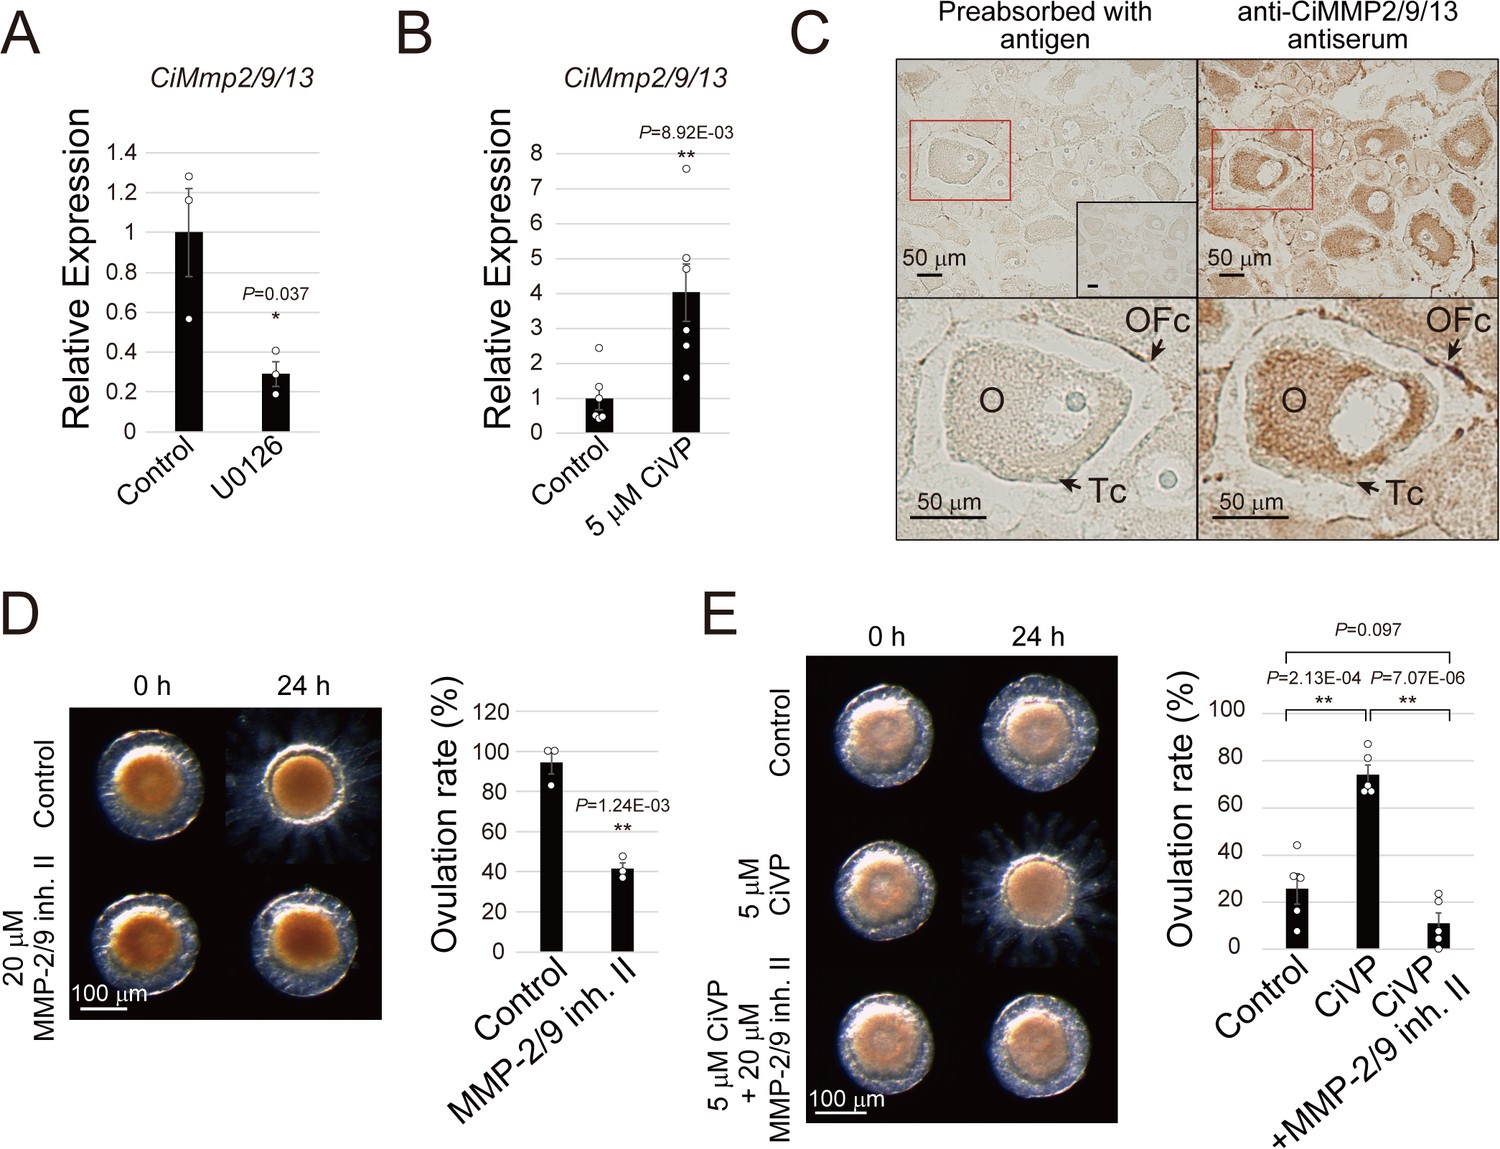
CiVP activates CiMMP2/9/13 via MEK/ERK signaling during ovulation.
(A, B) qRT-PCR indicated that MEK inhibition with 10 μM U0126 in early stage III follicles (A) and 5 μM CiVP stimulation in late stage II follicles (B) for 24 hr results in decrease and increase of CiMmp2/9/13 expression relative to CiUbac1, respectively. Data from three (A, n = 3) and six (B, n = 6) independent experiments were analyzed by Student’s t test and are shown as mean ± SEM with data points (t-value: 3.08; *, p=0.037 in (A) and t-value: −3.24; **, p=8.92E-03 in (B)). (C) Immunohistochemistry using anti-CiMMP2/9/13 antiserum and the ABC detection system confirmed that CiMMP2/9/13 is localized in oocytes (O) and outer follicular cells (OFc), but not in test cells (Tc). Antiserum pre-absorbed with antigen or pre-immune serum (inset) were used as negative controls. Enlarged images of red-boxed areas in the upper panels are shown below. (D) Treatment with 20 μM MMP-2/9 inhibitor II significantly inhibited ovulation of late stage III follicles (t-value: 8.14; **, p=1.24E-03). (E) Significant CiVP-induced ovulation of late stage II follicles (t-value: −6.38; **, p=2.13E-04) was disrupted by MMP-2/9 inhibitor II (t-value: 10.25; **, p=7.07E-06). Data from three (D, n = 3) and five (E, n = 5) independent experiments were analyzed by Student’s t test and are shown as mean ± SEM with data points.
-
Figure 5—source data 1
Source data for Figure 5A,B,D,E, Figure 5—figure supplements 1 and 3.
Relative expression values of the CiMmp2/9/13 gene to CiUbac1 (RNA-seq and qRT-PCR data, Figure 5A and B). Percentages of ovulated follicles after incubating with CiVP and/or MMP-2/9 inhibitor II (Figure 5D and E). Relative expression values of the CiMmp genes to CiUbac1 (RNA-seq data, Figure 5—figure supplement 1). Raw values of in vitro collagenase activity of recombinant MMP-2/9/13 are also shown (Figure 5—figure supplement 3).
- https://doi.org/10.7554/eLife.49062.025
Figure 5—figure supplement 1
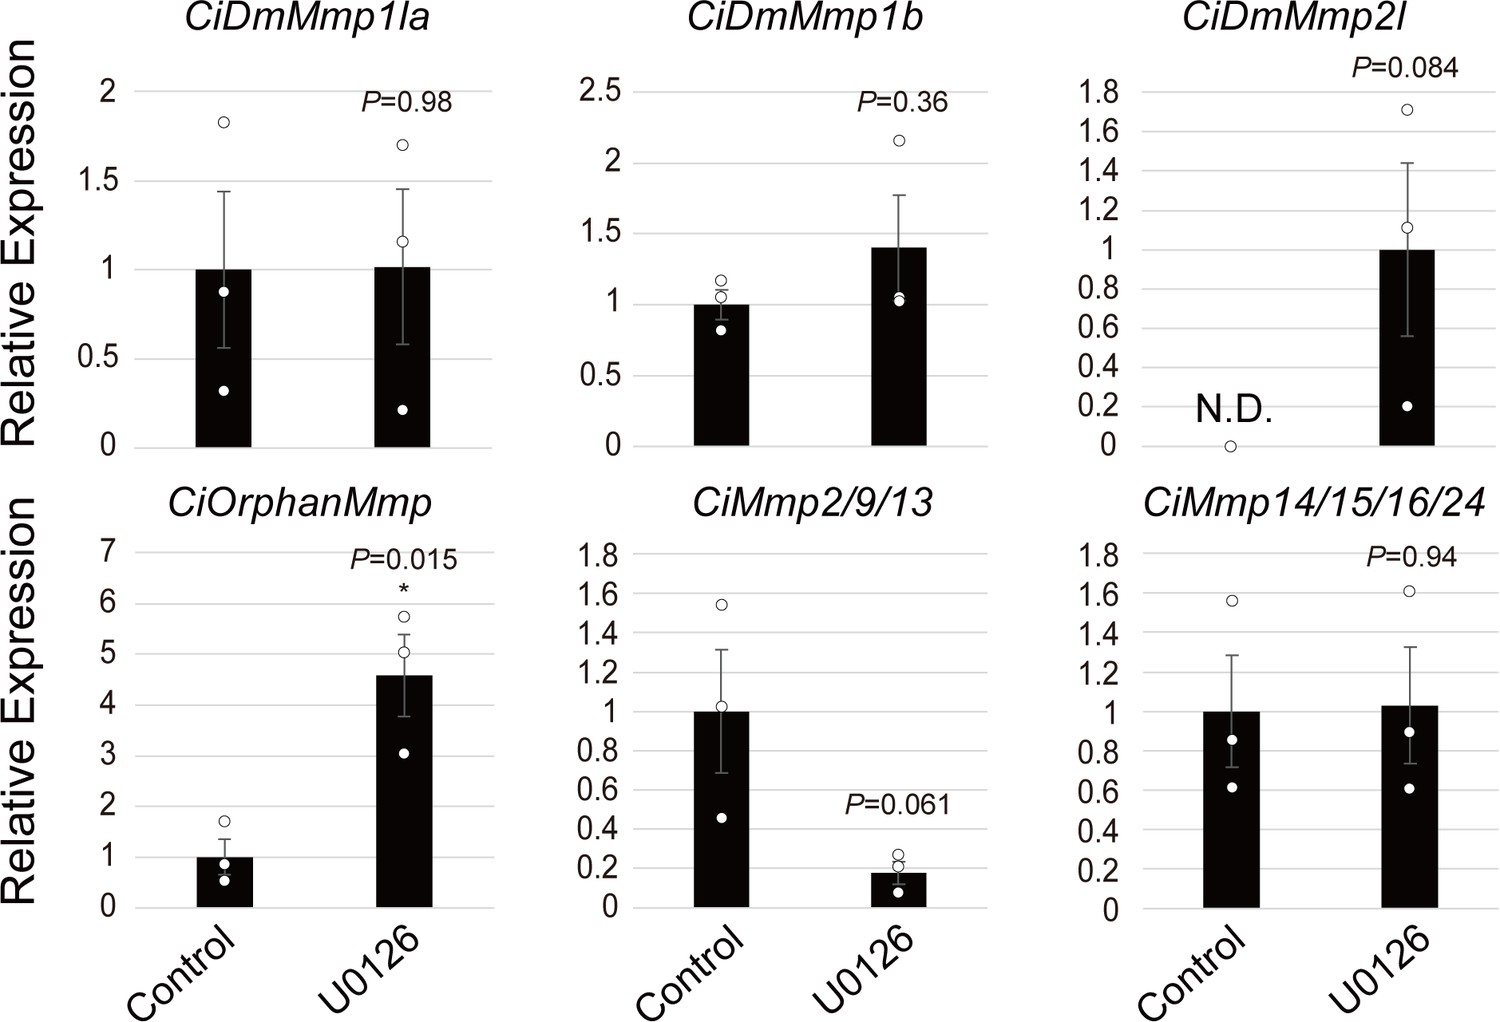
Ciona-MMP expressions in MEK-inhibited follicles.
The expression of six MMP genes in Ciona was investigated using RNA-seq data. Data were analyzed by Student’s t test compared with control (t-value: −0.026; p=0.14 for DmMMP1 like a; t-value: −1.03; p=0.36 for DmMMP1 like b; t-value: −2.28; p=0.084 for DmMMP2 like; t-value: −4.05; *, p=0.015 for OrphanMMP; t-value: 2.58; p=0.061 for MMP-2/9/13; t-value: −0.074; p=0.94 for MMP-14/15/16/24) and are shown as mean ± SEM (n = 3). The expression of only CiMmp2/9/13 was downregulated in MEK-inhibited follicles, along with the ovulation rate. N.D., not detected.
Figure 5—figure supplement 2
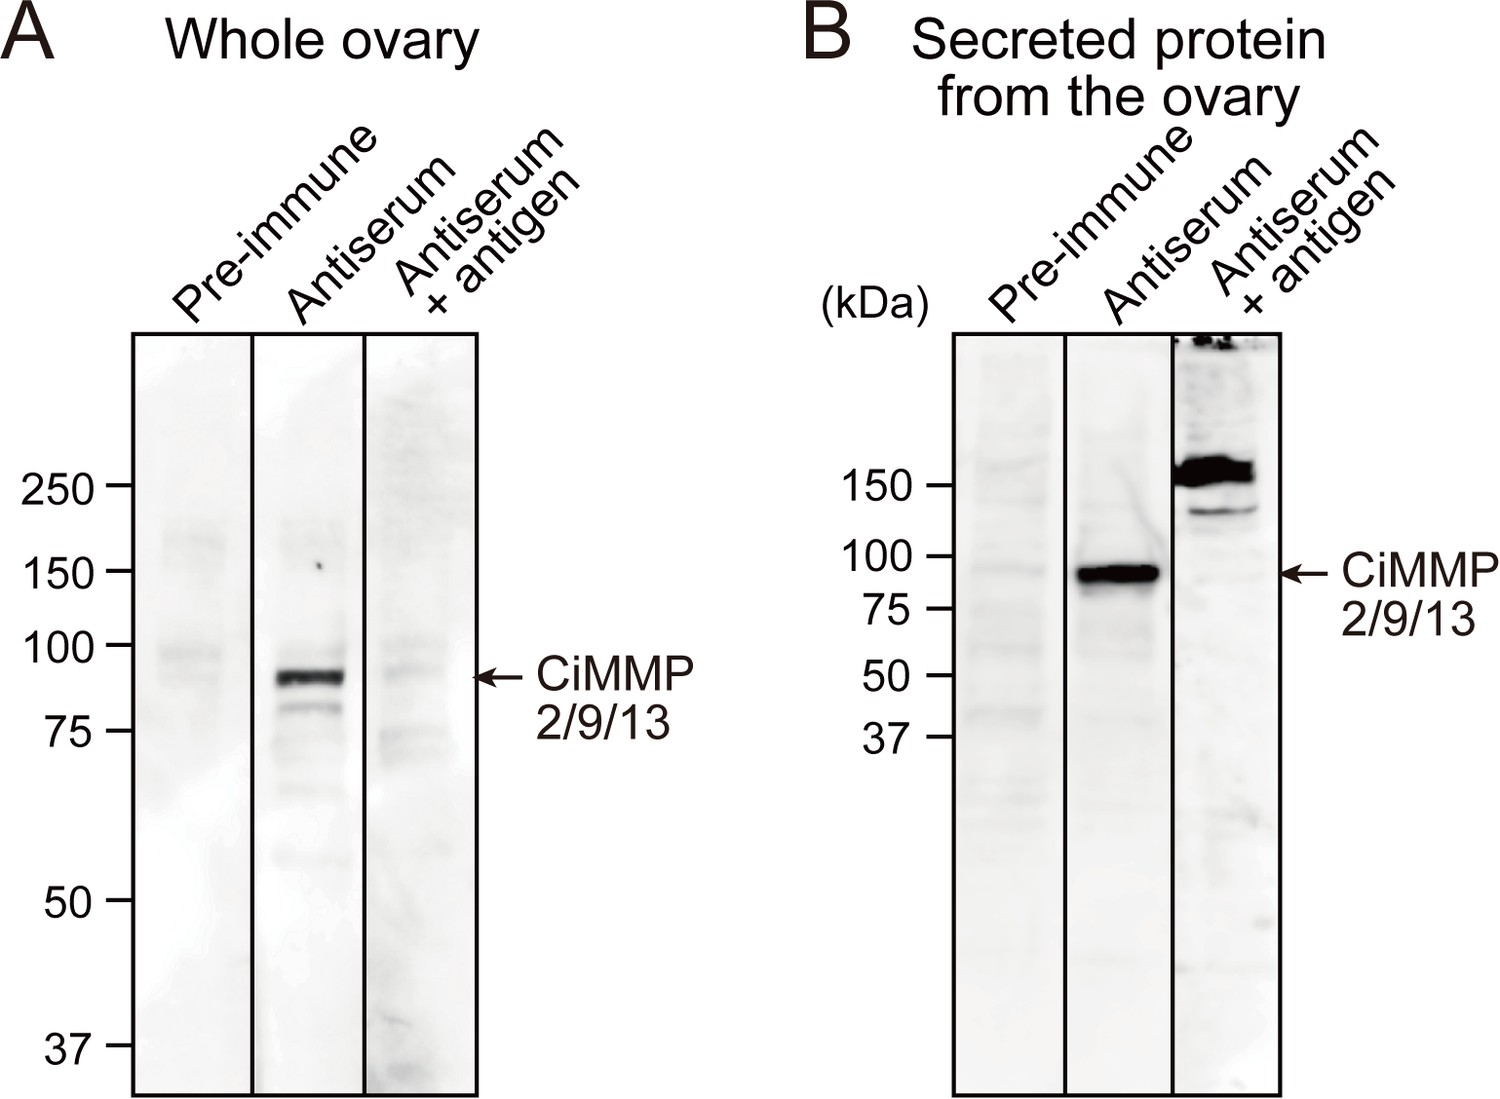
Specificity of the anti-CiMMP2/9/13 antibody.
A total of 30 μg of soluble protein (A) and secreted protein (B) form Ciona ovaries was subjected to Western blotting. Bands specific to CiMMP2/9/13 were detected with anti-CiMMP2/9/13 antiserum but not pre-immune serum. The bands were abolished by pre-incubation of the antiserum with antigen, confirming the specificity of anti-CiMMP2/9/13 antibody.
Figure 5—figure supplement 3
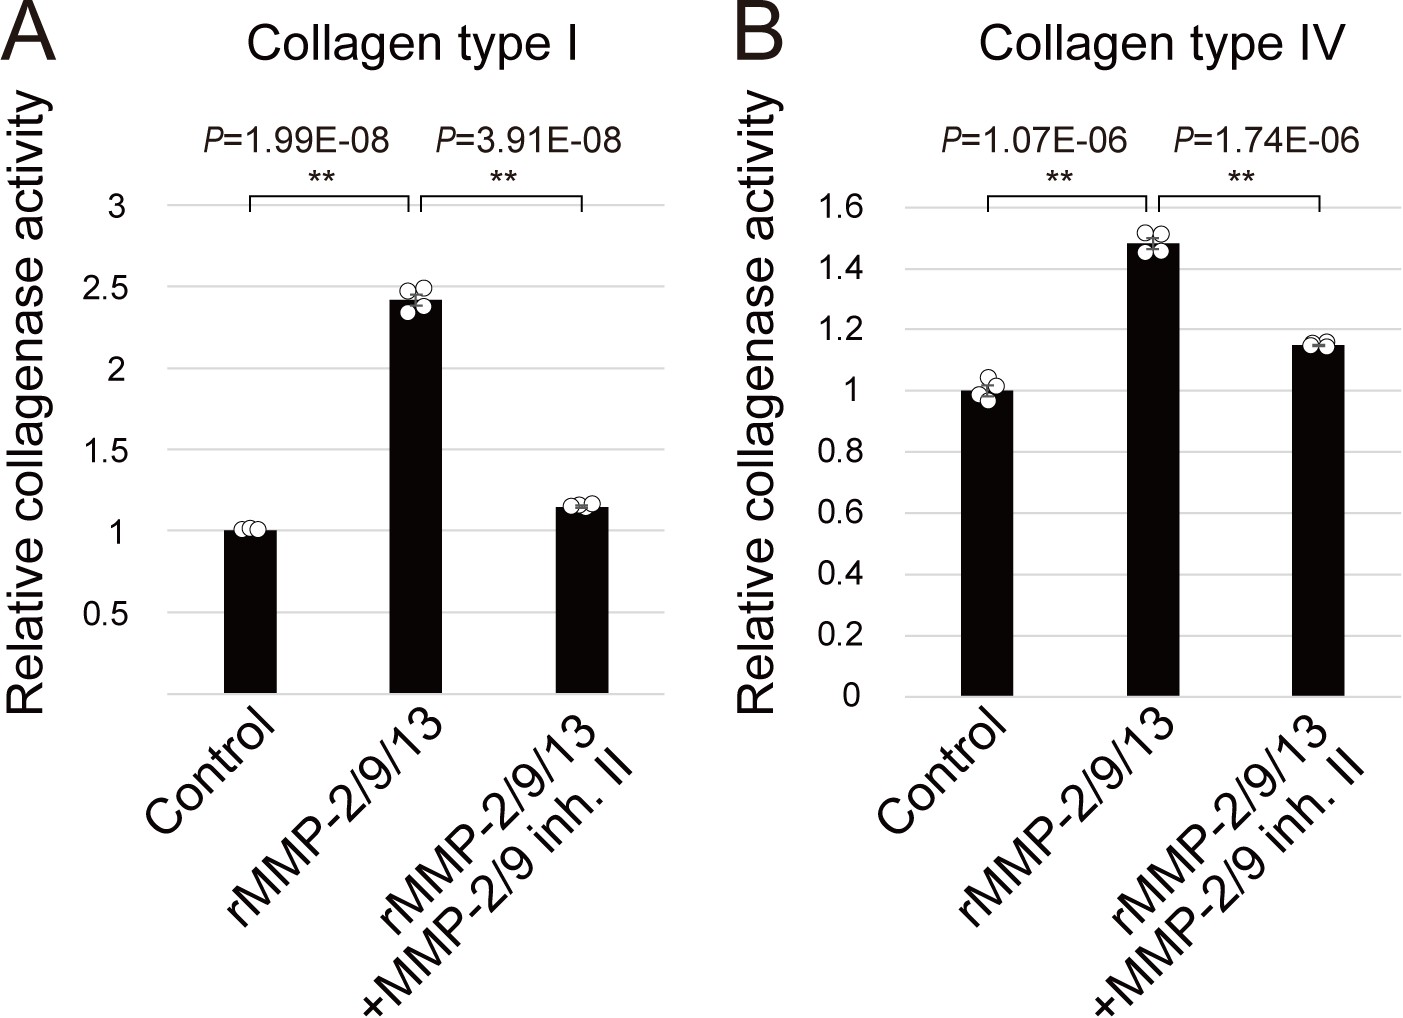
In vitro collagenase assay.
A total of 0.5 μg of rMMP-2/913 was incubated with DQ collagen type I (A) or type IV (B) in in the presence or absence of 1 μM MMP-2/MMP-9 inhibitor II at 20°C. After the 48 hr incubation, the fluorescence was measured. Data are shown as mean ± SEM and analyzed by Student’s t test (n = 4). The significant collagenase activity of rMMP-2/9/13 was observed (t-value: −38.69; **, p=1.99E-08 in type I collagen and t-value: −19.82; **, p=1.07E-06 in type IV collagen), which was significantly inhibited in the presence of MMP-2/9 inhibitor II (t-value: 34.56; **, p=3.91E-08 in type I collagen and t-value: 18.25; **, p=1.74E-06 in type IV collagen), confirming an availability of the inhibitor.
Figure 6
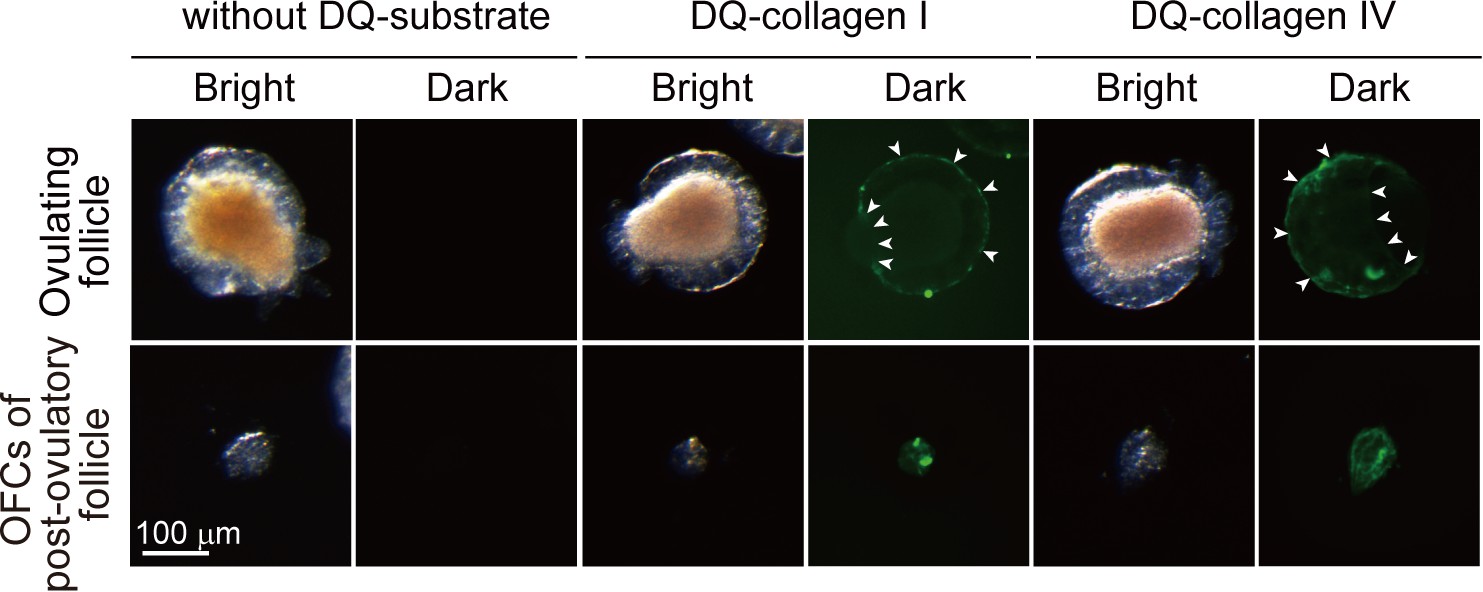
Collagenase activity is localized to the outer follicular cells.
Ovulating follicles and outer follicular cells of post-ovulatory follicles were incubated for 3 hr in the presence of 50 μg/ml of DQ-collagen type I or type IV. In situ zymography indicated that the collagenase activity was localized to the outer follicular cells of ovulating follicles (upper, arrowheads) and post-ovulatory follicles (lower). No signals were observed in the follicles incubated without DQ-substrates.
Figure 7 with 1 supplement
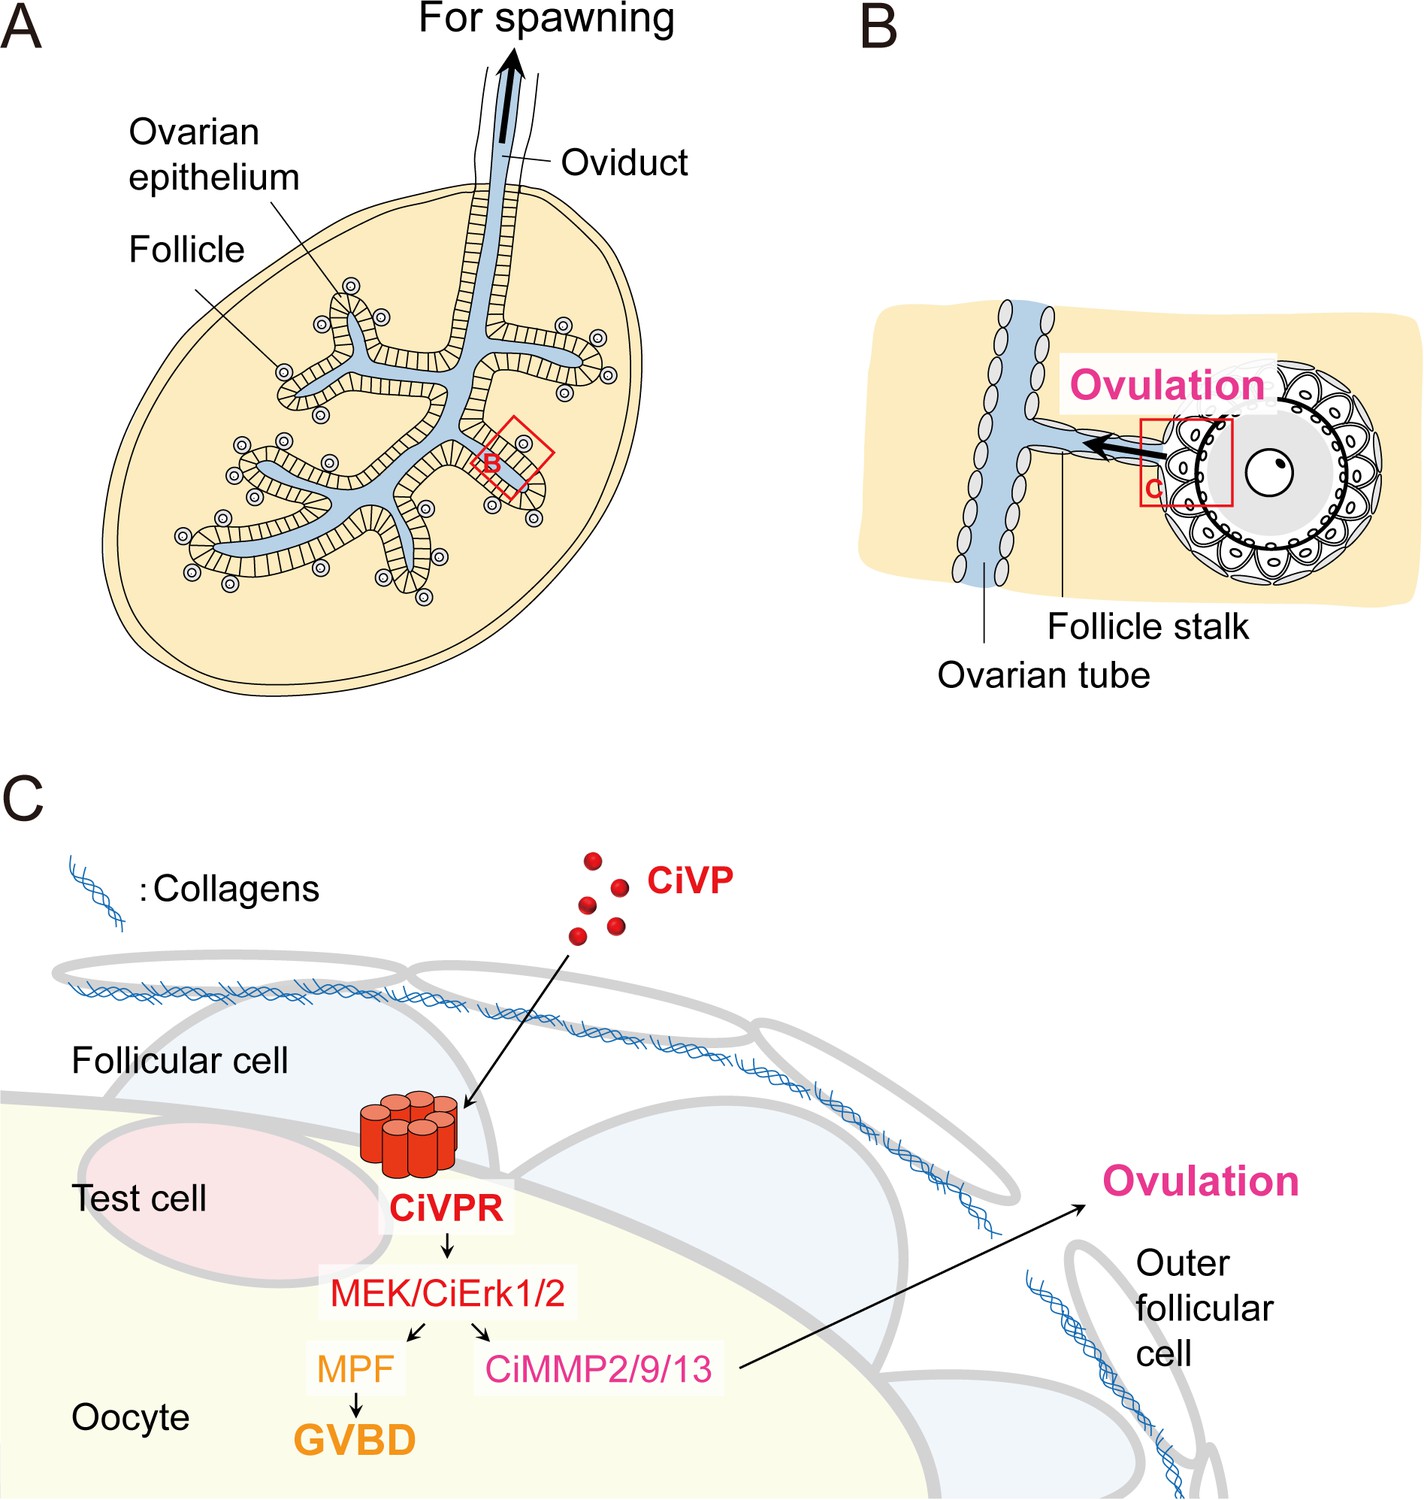
Model describing the regulation of CiVP-directed oocyte maturation and ovulation.
(A) Schematic diagram of the Ciona ovary, modified from Sugino et al. (1990). Mature/ovulated follicles are stored in the oviduct and wait for spawning stimulation. Yellow and blue represent inside and outside of the ovary, respectively. (B) Enlarged structure of ovulating follicle indicated by the red box in (A), modified from Kawamura et al. (2011). (C) Enlarged illustration of the red box in (B) and regulatory mechanisms of the CiVP-directed Ciona oocyte maturation and ovulation. CiVP interacts with its receptor expressed in the oocyte and directly activates MEK/CiErk1/2 signaling. Subsequent activation of CiMPF leads to GVBD and oocyte maturation. Activated CiErk1/2 also induces the CiMMP2/9/13 expression in the oocyte; secreted CiMMP2/9/13 then digests collagens in the outer follicular cell layer, leading to the rupture of the follicular layer and ovulation.
Figure 7—figure supplement 1

Schematic model of the evolution of ovulatory systems.
Simple phylogenetic tree (upper) and ovulatory mechanisms (lower) of the three species are shown. (i)-(iii) correspond to the possible evolutionary events described in the Discussion section. CiVP is expressed in the neural complex and act to the CiVPR expressed in the Ciona ovary. CiErk1/2 is phosphorylated and induce the CiMMP2/9/13, leading to ovulation. In medaka, MMP-15 is induced by sex steroid for ovulation at the end of HPG-axis, whereas the specific role of MEK/ERK remains unknown. In mice, MEK/ERK activation by gonadotropins is responsible for ovulation, but no critical proteases related to MEK/ERK or specific associated sex steroids have been identified.
Videos
Video 1
In vitro ovulation of a Ciona ovary.
An isolated Ciona ovary was cut in half and incubated in ASW for 16 hr. Time-lapse images were captured every 5 min. Numerous follicles were in turns ovulated from the ovary. The higher-magnification movie of the boxed area indicates that the rupturing of the outer follicular cell layer leads to follicle release.
Video 2
In vitro oocyte maturation and ovulation of a Ciona follicle.
An immature/pre-ovulatory (stage III) follicle was incubated in ASW for 3 hr. Time-lapse images were captured every 20 s. The follicle structure is illustrated at the right. After germinal vesicle breakdown (GVBD) occurred, the outer follicular cell layer was ruptured, and the follicle was released into ASW, reproducing the ovulation observed in the ovary (Video 1).
Video 3
CiVP induces Ciona GVBD and ovulation.
Isolated late stage II follicles were incubated with (right) or without (left) 5 μM CiVP for 24 hr. Time-lapse images were captured every 5 min. GVBD and ovulation were observed in the CiVP-treated follicle, whereas not in the control follicle.
Video 4
The MEK inhibitor U0126 inhibits Ciona GVBD and ovulation.
Isolated early stage III follicles were incubated with (right) or without (left) 10 μM U0126 for 24 hr. Time-lapse images were captured every 5 min. GVBD and ovulation were observed in the control follicle, whereas those were inhibited in the U0126-treated follicle.
Tables
Table 1
RNA-seq analysis of fractionated Ciona follicles.
https://doi.org/10.7554/eLife.49062.009| Sample | Total reads | % Mapped | Accession no. |
|---|---|---|---|
| Set 1 | |||
| early stage I | 22,071,592 | 65.72 | SRR8374812 |
| late stage I – early stage II | 21,118,716 | 90.90 | SRR8374811 |
| early stage II – late stage II | 23,935,632 | 84.31 | SRR8374810 |
| late stage II – late stage III | 23,839,575 | 50.50 | SRR8374809 |
| stage IV | 22,398,645 | 32.02 | SRR8374816 |
| Set 2 | |||
| early stage I | 22,317,382 | 45.99 | SRR8374815 |
| late stage I – early stage II | 24,094,643 | 88.73 | SRR8374814 |
| early stage II – late stage II | 21,434,672 | 60.23 | SRR8374813 |
| late stage II – late stage III | 20,686,040 | 43.45 | SRR8374808 |
| stage IV | 23,730,547 | 31.13 | SRR8374807 |
Table 2
RNA-seq analysis of MEK-inhibited follicles
https://doi.org/10.7554/eLife.49062.020| Sample | Total reads | % Mapped | Accession no. |
|---|---|---|---|
| Set 1 | |||
| Control | 32,160,880 | 74.49 | SRR8375763 |
| U0126 | 24,928,350 | 74.46 | SRR8375762 |
| Set 2 | |||
| Control | 32,642,355 | 72.66 | SRR8375761 |
| U0126 | 32,197,268 | 64.87 | SRR8375760 |
| Set 3 | |||
| Control | 32,136,047 | 58.70 | SRR8375759 |
| U0126 | 25,912,488 | 60.77 | SRR8375758 |
Key resources table
| Reagent type (species) or resource | Designation | Source or reference | Identifiers | Additional information |
|---|---|---|---|---|
| Gene (Ciona intestinalis type A) | CiVp | Ciona Ghost Database (http://ghost.zool.kyoto-u.ac.jp/cgi-bin/gb2/gbrowse/kh/) | KH.C6.11. | |
| Gene (Ciona intestinalis type A) | CiVpr | Ciona Ghost Database (http://ghost.zool.kyoto-u.ac.jp/cgi-bin/gb2/gbrowse/kh/) | KH.C9.885. | |
| Gene (Ciona intestinalis type A) | CiErk1/2 | Ciona Ghost Database (http://ghost.zool.kyoto-u.ac.jp/cgi-bin/gb2/gbrowse/kh/) | KH.L153.20. | |
| Gene (Ciona intestinalis type A) | CiCcnb | Ciona Ghost Database (http://ghost.zool.kyoto-u.ac.jp/cgi-bin/gb2/gbrowse/kh/) | KH.C4.213. | |
| Gene (Ciona intestinalis type A) | CiCdk1 | Ciona Ghost Database (http://ghost.zool.kyoto-u.ac.jp/cgi-bin/gb2/gbrowse/kh/) | KH.C12.372. | |
| Gene (Ciona intestinalis type A) | CiMmp2/9/13 | Ciona Ghost Database (http://ghost.zool.kyoto-u.ac.jp/cgi-bin/gb2/gbrowse/kh/) | KH.L76.4. | |
| Recombinant DNA reagent | pET21a-CiMMP2/9/13 (plasmid) | This paper | Expression vector of Ci-MMP2/9/13 | |
| Strain, strain background (Escherichia coli) | Rossetta 2 (DE3) | Novagen | Cat.#:71400–3 | Competent cells for rCi-MMP2/9/13 expression |
| Antibody | anti-ERK (rabbit polyclonal) | Cell Signaling Technology | Cat.#:9102S; RRID:AB_330744 | WB (1:500) |
| Antibody | anti-pERK (rabbit polyclonal) | Cell Signaling Technology | Cat.#:9101S; RRID:AB_331646 | IF (1:200); WB (1:1000) |
| Antibody | anti-PSTAIR (mouse monoclonal) | Abcam | Cat.#:Ab10345; RRID:AB_297080 | WB (1:1000) |
| Antibody | anti-CiMMP2/9/13 | This paper | IHC (1:400); WB (1:3000) | |
| Commercial assay or kit | MESACUP Cdc2/Cdk1 Kinase Assay kit | MBL | Cat.#:5235 | |
| Commercial assay or kit | Universal Elite ABC kit | Vector Laboratories | Cat.#:PK-7200 | |
| Peptide, recombinant protein | CiVP | Kawada et al., 2008 (PMID: 18586058) | 5 μM | |
| Chemical compound, drug | U0126 | Promega | Cat.#:V1121 | 10 μM |
| Chemical compound, drug | Ro-3306 | Abcam | Cat.#:ab141491 | 1 μM |
| Chemical compound, drug | MMP-2/MMP-9 inhibitor II | Calbiochem | Cat.#:444249 | 20 μM |
| Chemical compound, drug | DQ Collagen, type I | Thermo Fisher Scientific | Cat.#:D12060 | 50 μg/ml |
| Chemical compound, drug | DQ Collagen, type IV | Thermo Fisher Scientific | Cat.#:D12052 | 50 μg/ml |
| Software, algorithm | Free-JSTAT statistical software | FreeJSTAT (http://toukeijstat.web.fc2.com/) | Version 22.0E | |
| Software, algorithm | Fiji software | Fiji (http://fiji.sc/); Schindelin et al., 2012 (PMID: 22743772) | RRID:SCR_002285 | |
| Sequence-based reagent | Primers | This paper | Sequences are listed in Table 3 |
Table 3
Primer sets used in this study
https://doi.org/10.7554/eLife.49062.029| Name | Accession no. | Forward | Reverse |
|---|---|---|---|
| qRT-PCR | |||
| CiVpr | KH.C9.885 | ATGCACCGTGTCCGAAATG | CAAAGCGACCAGGACACAAG |
| CiErk1/2 | KH.L153.20 | TTATGTCTCTGCCGAACAAGC | AAGGTCAGCATACGGTCCAA |
| CiMmp2/9/13 | KH.L76.4 | GCTTAATTGGCTGCGATCCA | TCGTCTCCATAGTGACATCGG |
| CiUbac1 | KH.L133.5 | ACACGCCGATGATTCAAGTG | GGTGAGTCGGGTTTGGTTTG |
| Probes for ISH | |||
| CiVpr | KH.C9.885 | CCTGCAGCGACAAATACGAA | GGAACAACTGTGGTGTGGAC |
| CiErk1/2 | KH.L153.20 | TAAGAGCTCCCACACTTGCA | GCATGATTTCGGGAGCTCTG |
Additional files
-
Supplementary file 1
DEG profiles based on RNA-seq of fractionated follicles.
DEGs (upregulated (>2 fold) or downregulated (<0.5 fold) genes) in the indicated stages of follicles are shown in each tab. Gene ID (column A), reads mapped to the cDNA library (column B-K), RPKM (column L-U), ratio (column V-AC), UniProt ID (column AD), homologous protein (column AE), and E-value (column AF) are shown.
- https://doi.org/10.7554/eLife.49062.030
-
Supplementary file 2
DEG profiles based on RNA-seq of MEK-inhibited follicles.
DEGs (upregulated (>2 fold) or downregulated (<0.5 fold) genes) in early stage III follicles following MEK-inhibition for 24 hr are shown. Gene ID (column A), reads mapped to the cDNA library (column B-G), RPKM (column H-M), ratio (column N-P), UniProt ID (column Q), homologous protein (column R), and E-value (column S) are shown.
- https://doi.org/10.7554/eLife.49062.031
-
Transparent reporting form
- https://doi.org/10.7554/eLife.49062.032
Download links
A two-part list of links to download the article, or parts of the article, in various formats.
Downloads (link to download the article as PDF)
Open citations (links to open the citations from this article in various online reference manager services)
Cite this article (links to download the citations from this article in formats compatible with various reference manager tools)
The regulation of oocyte maturation and ovulation in the closest sister group of vertebrates
eLife 8:e49062.
https://doi.org/10.7554/eLife.49062


