An ancestral apical brain region contributes to the central complex under the control of foxQ2 in the beetle Tribolium
- University of Göttingen, Germany
- Neurosciences and Biophysics, Germany
- Goethe University, Germany
Figures
Figure 1 with 2 supplements
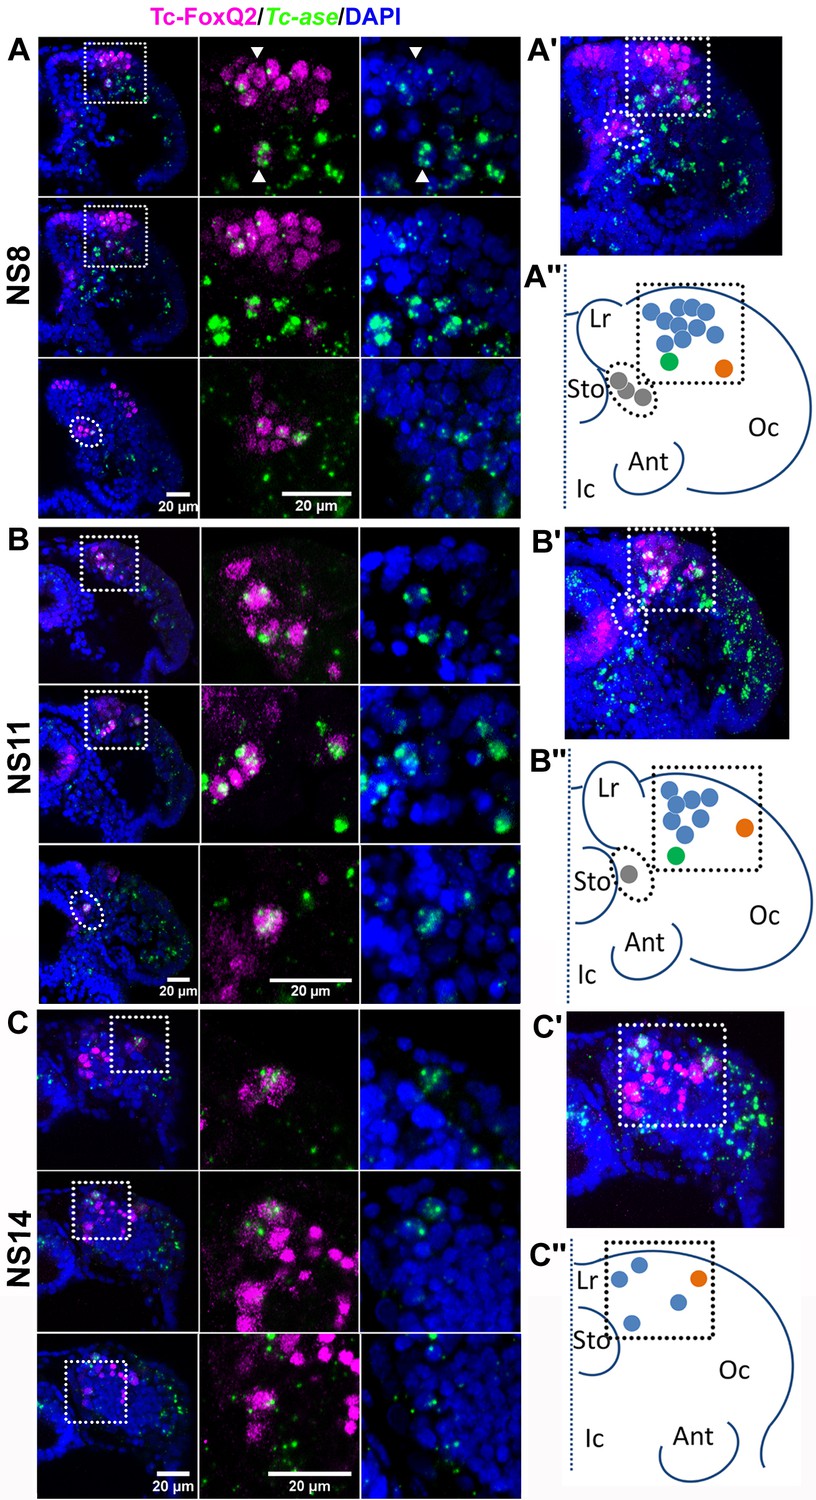
Tc-FoxQ2 positive neural progenitor cells.
Tc-FoxQ2 protein is visualized by immunohistochemistry at different stages (magenta) while neural progenitor cells (NPCs) are marked by intronic Tc-asense whole mount in situ hybridization (green). Nuclei are visualized by DAPI (blue). Optical sections of right halves of stained heads are shown in the left column while respective close-ups are shown in second and third column (see hatched areas in left column in (A, B and C). A projection of all optical sections is given in the right column (A’, B’ and C’). The schemes represent the outline of right halves of the head lobes of flattened embryos. The dotted line represents the midline. This depiction is comparable to the one previously used for Drosophila neuroblast maps (Urbach and Technau, 2003a) (A’’, B’’ and C’’). (A–A’’) At NS8 about 15 Tc-FoxQ2 positive NPCs are found (n = 6). By position, three groups are distinguished: A large anterior median group (blue in A’’) with one neuroblast slightly separated posteriorly (green in A’’), one single lateral NPC (orange in A’’) and a group located closely to the midline (gray in A’’). White arrowheads show two exemplary NPCs. (B–B’’) At NS11 about 10 Tc-FoxQ2 positive NPCs are observed (n = 6). (C–C’’) At NS14, the number has decreased to 5–7 cells (n = 6). The single lateral NPC remains distinguishable (orange in C’’). Lr: labrum; Sto: stomodeum; Oc: ocular region; Ant: antenna; Ic: Intercalary region.
Figure 1—figure supplement 1
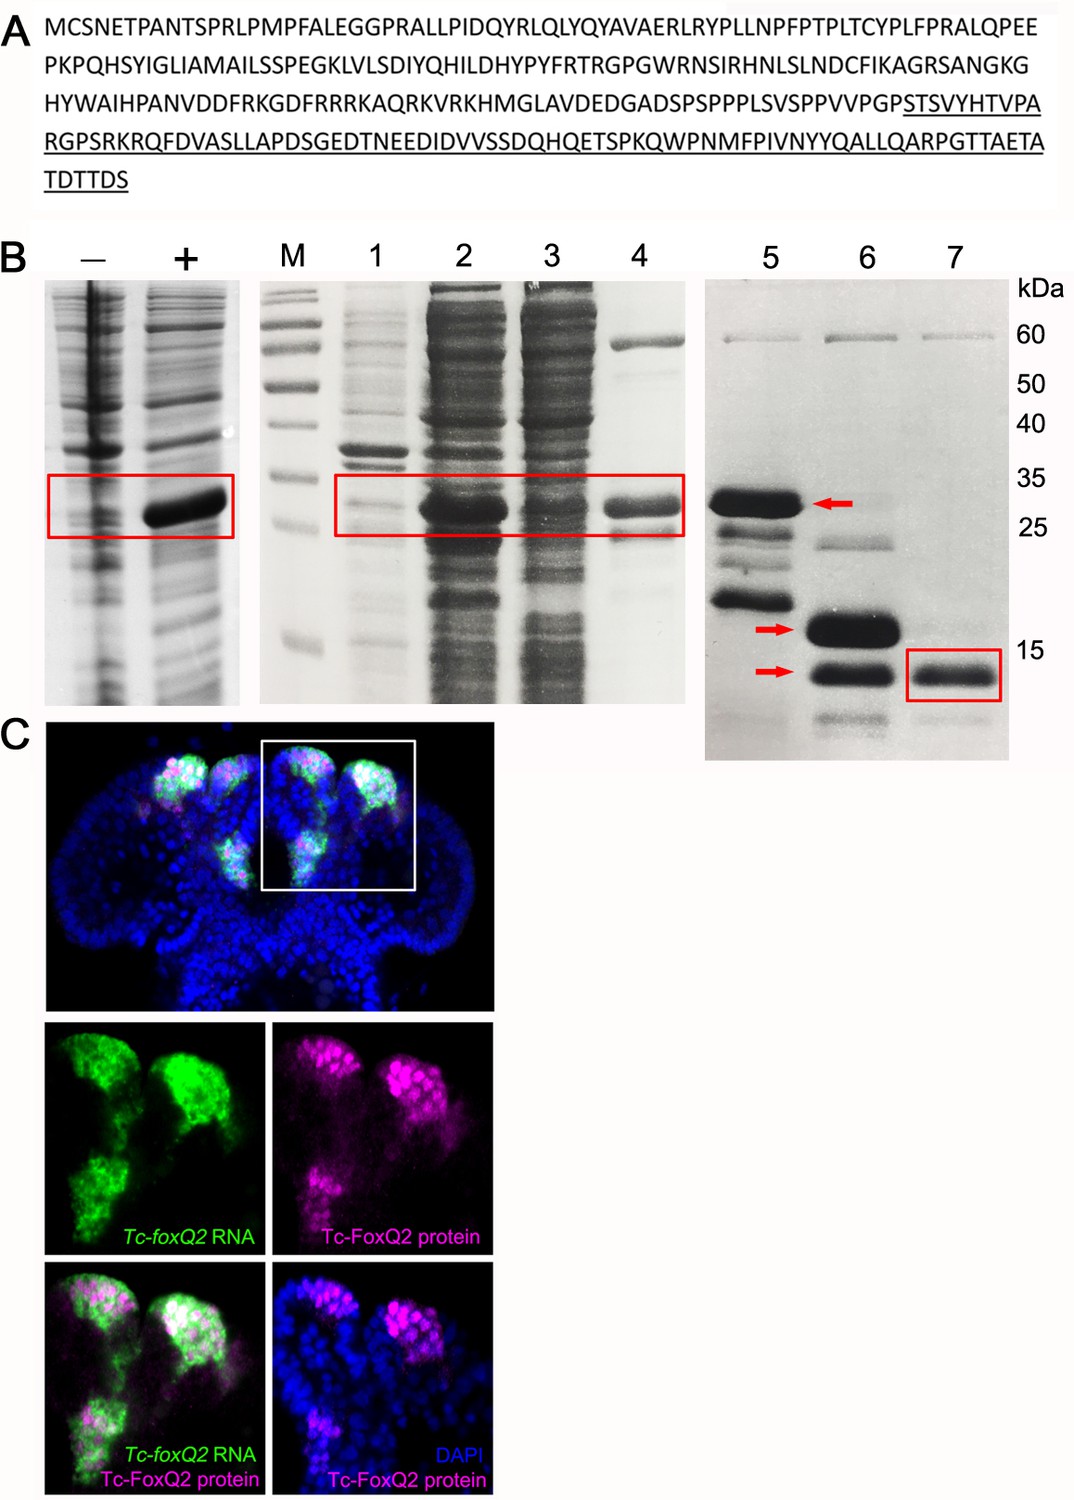
Generation of a Tc-FoxQ2 antibody.
(A) Protein sequence of Tc-FoxQ2. The C-terminus containing 85 amino acids (underlined) has little homology to other proteins in Tribolium and was used for protein expression. (B) Coomassie-blue stained SDS-PAGE gel analysis of expression and purification of Tc-FoxQ2. (-) Before IPTG induction; (+) after IPTG induction. M, marker; lane 1, cell pellet; lane 2, supernatant; lane 3, flow through after Ni2+ chelate affinity chromatography; lane 4, eluted fractions by imidazole; lane 5, before SUMO protease digestion (red arrow); lane 6, after SUMO protease digestion, two bands are observed (red arrows): 6xHis-SUMO and Tc-FoxQ2; lane 7, flow through after re-Ni2+ chelate affinity chromatography which contains Tc-FoxQ2. (C) Expression of Tc-foxQ2 RNA (green) and Tc-FoxQ2 protein (magenta) in the embryo. Tc-foxQ2 RNA is detected throughout the cytoplasm, while Tc-FoxQ2 protein is detected in the nuclei (blue). Tc-foxQ2 RNA and Tc-FoxQ2 protein show a high overlap.
Figure 1—figure supplement 2
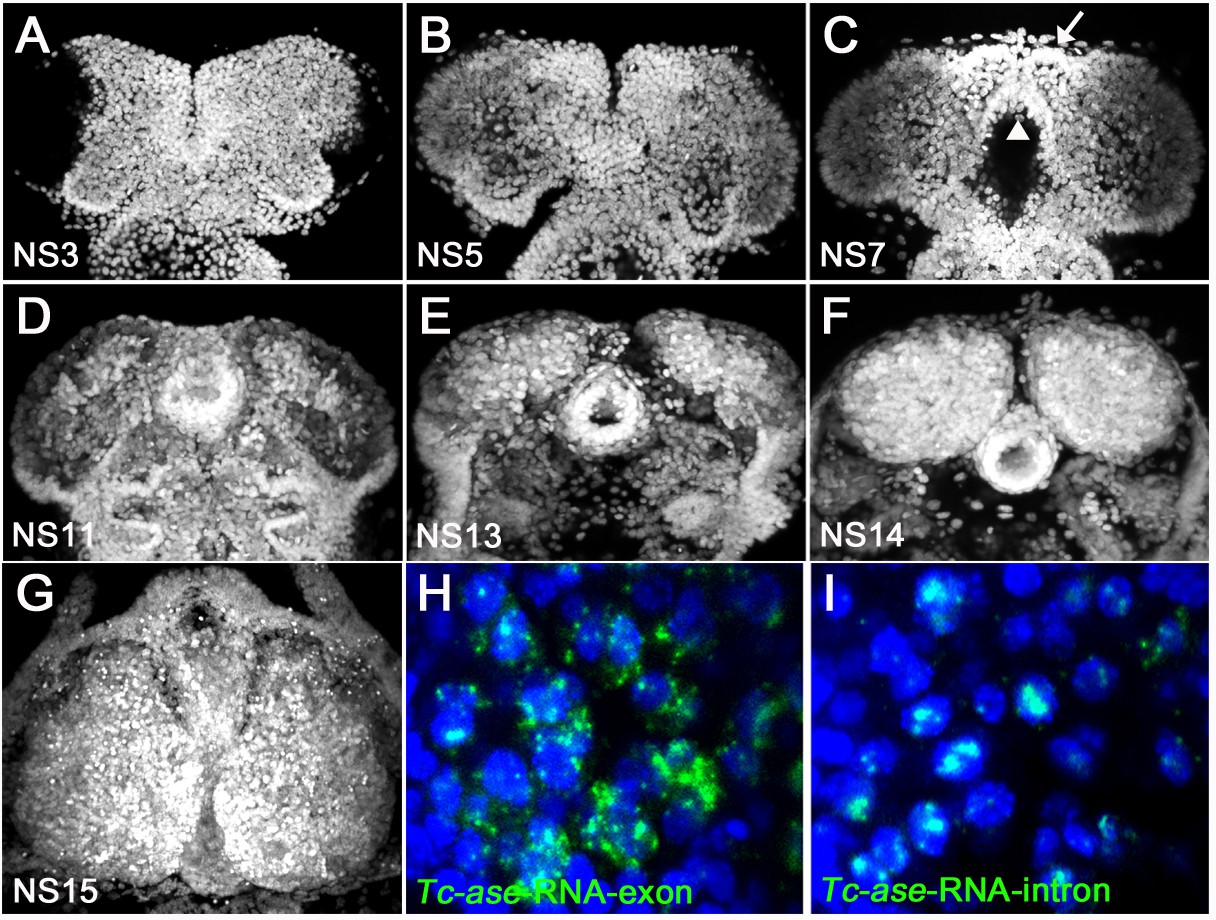
Developmental staging and comparison of exonic versus intronic Tc-asense probes.
In Tribolium, the established morphological staging system (Biffar and Stollewerk, 2014) with respect to early neurogenesis has 15 stages, termed NS1 to NS15. (A, B) From NS3 to NS5, the neuroectoderm is still a flat sheet of cells. (C) At NS7, the labral and stomodeal buds have formed (arrow, white arrowhead). (D) At NS11, the brain grows thicker and contains an increased number of cells. (E, F) From NS13 onwards, the brain hemispheres become an oval shape and grow. (G) At NS15, the brain hemisphere shows a pear-like shape. All planes are dorsal view. (H) Tc-ase-RNA exonic probe marks cytoplasm. (I) Tc-ase-RNA intronic probe marks only nuclei, which allows cell identification.
Figure 2

Neural progenitor cells co-express transcription factors.
Tc-FoxQ2 is visualized by immunohistochemistry (red) while the other transcription factors (TFs) are marked by fluorescent in situ hybridization (cyan) at NS8 and NS11. Nuclei are visualized by DAPI (blue). Close-ups of the right halves of embryonic heads are shown (A–H’’’) and schemes are given at the bottom (I and I’). (A–A’’’) Co-expression of Tc-six3 and Tc-FoxQ2. (B–B’’’) Co-expression of Tc-six4 and Tc-FoxQ2. (C–C’’’) Co-expression of Tc-rx and Tc-FoxQ2. (D–D’’’) Co-expression of Tc-chx and Tc-FoxQ2. (E–E’’’) Co-expression of Tc-ey and Tc-FoxQ2. (F–F’’’) Co-expression of Tc-fez1 and Tc-FoxQ2. (G–H’’’) Co-expression of Tc-scro and Tc-FoxQ2. (I, I’) Four different identities of NPCs are distinguished based on their position and co-expression. P-fox-am (1) is located in the anterior median neuroectoderm. The cells in this group co-express Tc-FoxQ2 with Tc-six3, Tc-six4 and later Tc-chx. P-fox-amp (2) is located posteriorly adjacent with additional expression of Tc-scro, Tc-fez1 and in one of the cells also Tc-ey. P-fox-l (3) consists of one lateral cell which co-expresses Tc-FoxQ2 with Tc-six3, Tc-fez1, Tc-rx and Tc-ey. P-fox-v (4) is located ventrally adjacent to the stomodeum, showing only co-expression of Tc-FoxQ2 and Tc-scro. Same abbreviations as in Figure 1.
Figure 3 with 1 supplement
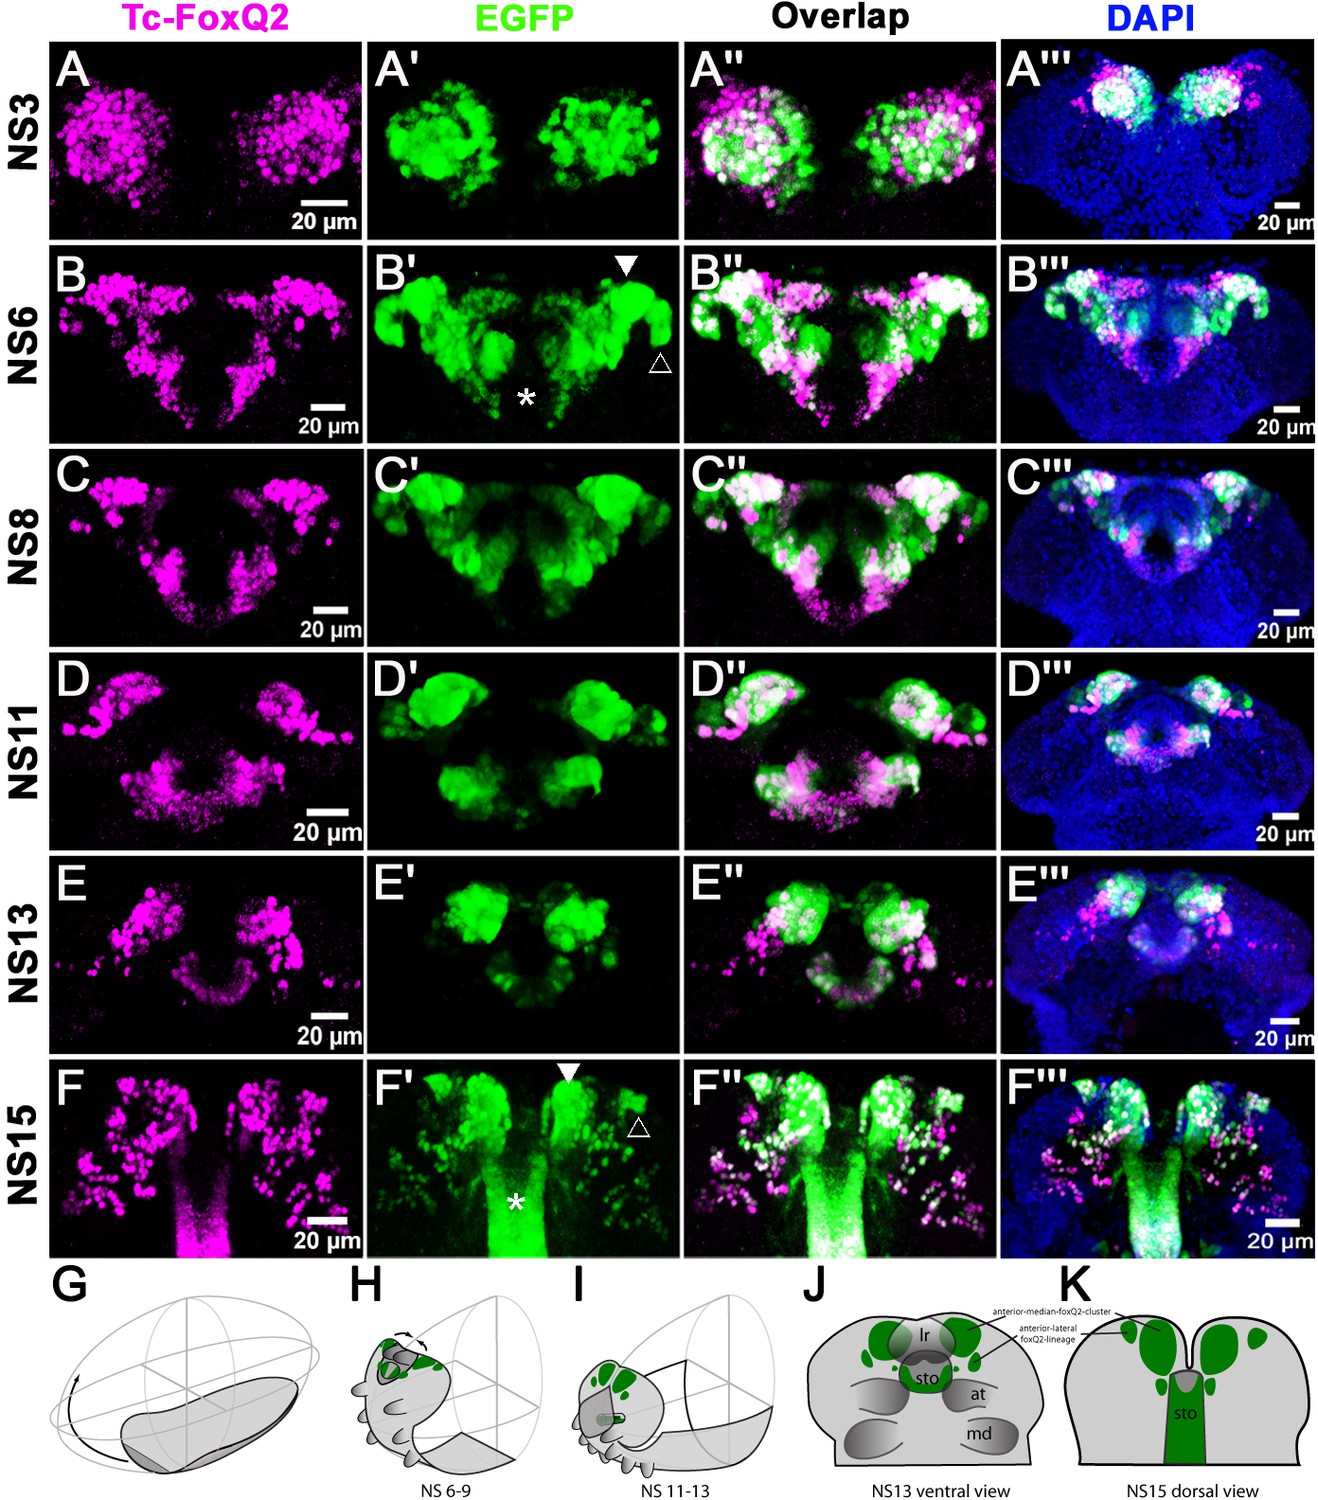
Tc-foxQ2 positive cells marked by antibody and the foxQ2-5’-line.
The expression of EGFP (green) derived from the foxQ2-5’-line and Tc-FoxQ2 protein (magenta) correlate closely throughout embryogenesis. The morphology of the anterior neuroectoderm is visualized with DAPI staining (blue, right column). Shown are heads of embryos dissected out of the egg and flattened to reveal the staining within the neuroectoderm (A’’’–C’’’) and the developing brain (D’’’–F’’’). Some differences between EGFP and Tc-FoxQ2 expression are observed, which may be due to either different dynamics of maturation and degradation of these proteins or to divergence of the enhancer trap signal from the endogenous expression. (A–A’’’) At NS3, Tc-foxQ2 expression shows two bilateral domains within the anterior median region. (B–F’’’) Later, the expression domains split into a stomodeal (asterisk), a median (white arrowhead) and lateral domain (open arrowhead). At NS15, two clusters of cells are observed: The large anterior-median-foxQ2-cluster (white arrowhead in F’) and a smaller anterior-lateral-foxQ2-lineage (open arrowhead in F’). (G–I) The general movements of the head tissue areshown from the germ rudiment (G) to an elongating (H) and a retracting stage (I). The approximate positions of the Tc-foxQ2 marked cells underlying the head epidermis are shown. (J,K) Flat preparations of heads of stage NS13 (J) and NS15 (K) are shown with the approximate positions of the underlying Tc-foxQ2 marked cells shown in green. (G–I) are redrawn from Posnien and Bucher (2010).
Figure 3—figure supplement 1
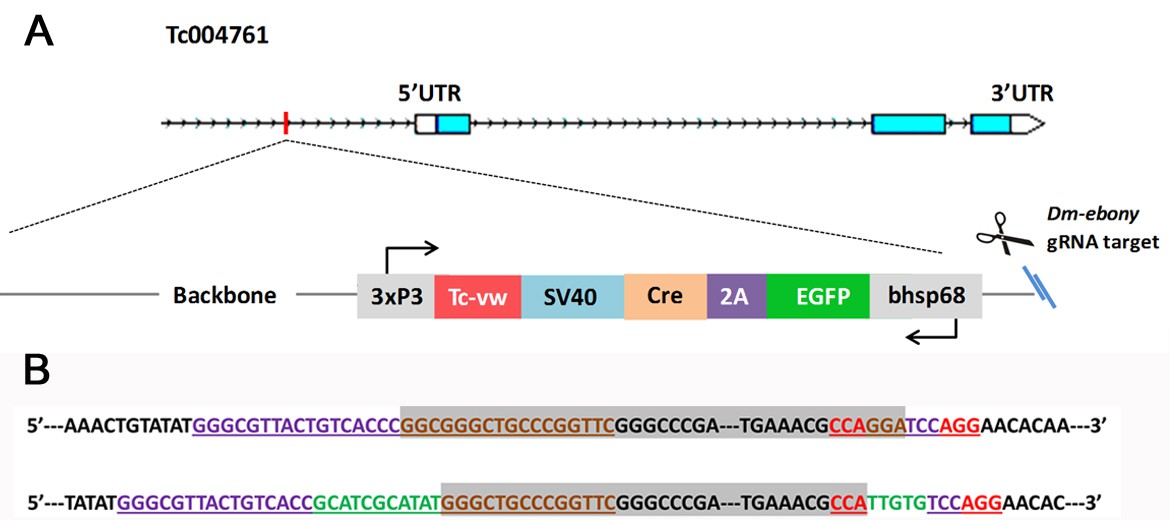
Characterization of the foxQ2-5’-line.
(A) The insertion (including the plasmid backbone) is about 6.8 kb in length and the bhsp68 promoter is located approximately ~700 bp upstream of the transcription start site. The EGFP transcription unit is oriented in the opposite direction to Tc-foxQ2. (B) The upper row is the predicted sequence of a perfect insertion without indels where gray indicates the left and right extremes of the 6.8 kb insert and the gRNA target sequence is underlined. The lower row is the actual sequencing results of this line. The insertion occurred at the predicted site (3 bp upstream of the PAM, AGG shown in red) and small insertions occurred at both integration sites (green). The purple bases represent the gRNA1 target sequence (targeting the genomic DNA) and the brown bases represent the gRNA-eb target sequence (targeting the plasmid for linearization). The genomic region and sequence of Tc-foxQ2 (Tc004761) are viewed by the iBeetle genome browser (http://ibeetle-base.uni-goettingen.de/gb2/gbrowse/tribolium/). gRNA1 target sequence: 5’ GGGCGTTACTGTCACCCTCCAGG 3’gRNA-eb target sequence: 5’ CCAGGAGGCGGGCTGCCCGGTTC 3’.
Figure 4 with 1 supplement
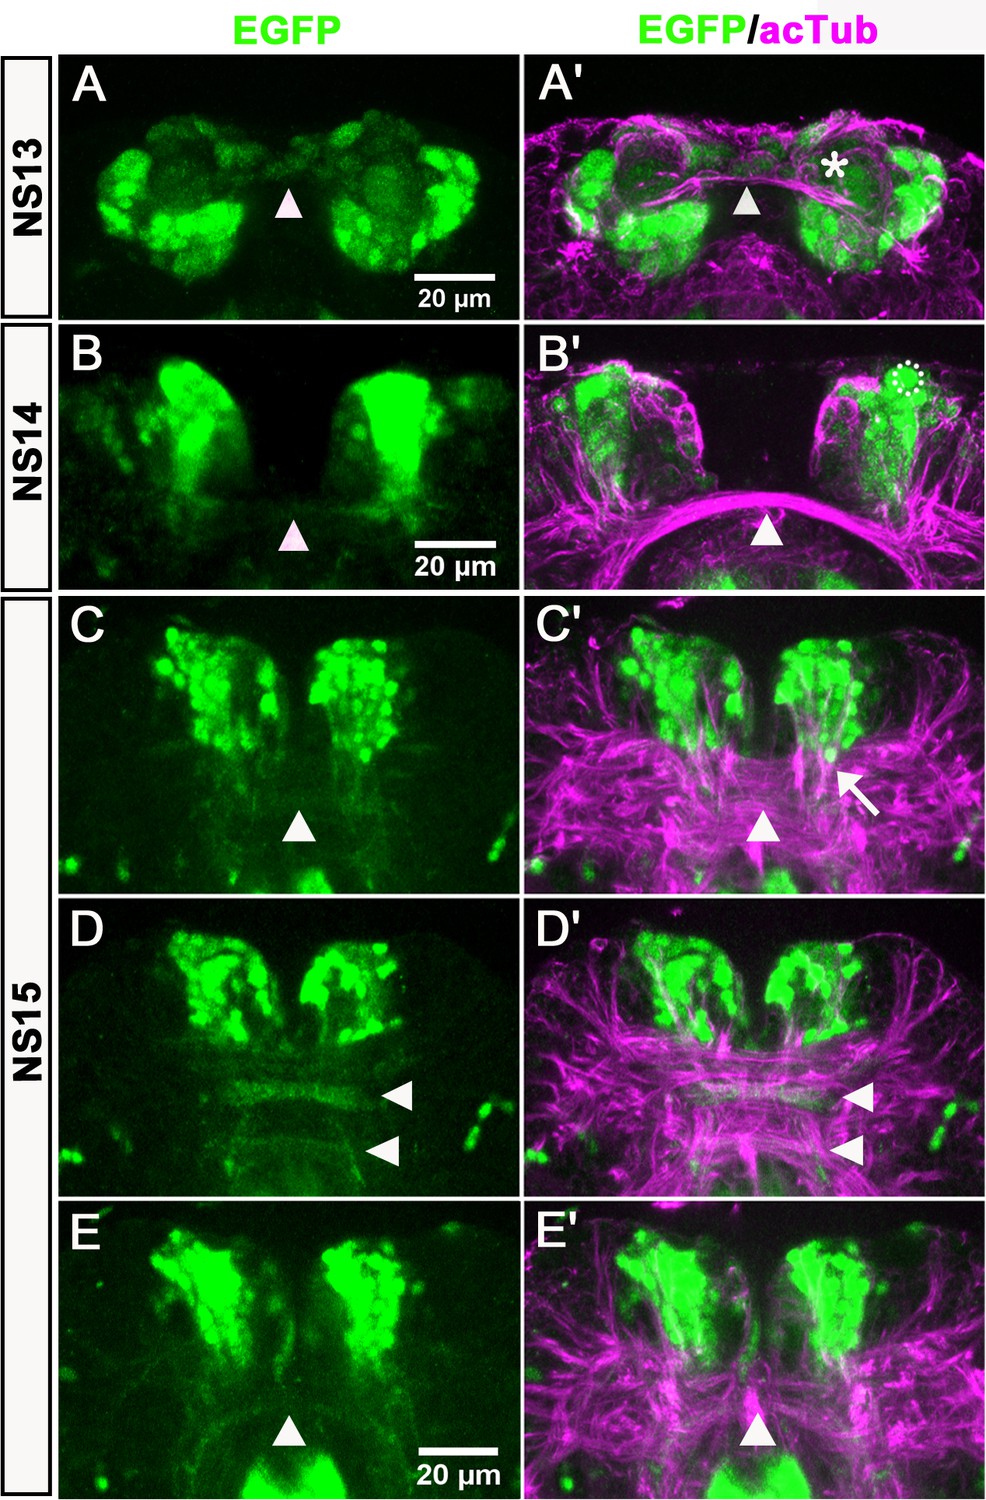
Anterior-median-foxQ2-cluster contributes to the central brain primordium.
Double-immunohistochemistry visualizes the EGFP (green) derived from the foxQ2-5’-line and acTub (magenta) which marks axonal projections – neuraxis anterior is up. (A–A’) At NS13, the first brain commissure marked by acTub appears (white arrowhead in A’). The cell bodies of the anterior-median-foxQ2-cluster are located around this commissure but do not yet project into it. A few weakly stained cells closely attached to the commissure are not Tc-FoxQ2 protein positive (asterisk in A’). (B–B’) At NS14, projections within the brain commissure become visible but have not yet reached the midline (white arrowhead in B). One Tc-FoxQ2 positive NPC is recognized by its morphology and position (hatched circle in B’). (B) and (B’) are not the same embryo but from the same developmental stage. (C–E) At NS15, at least three brain commissures are marked by the anterior-median-foxQ2-cluster: One in the circumesophageal commissure (white arrowhead in E), and two commissures within the central brain primordium (white arrowheads in D). The anterior-median-foxQ2-cluster produces more cells at this stage. (C’–E’) acTub marked brain commissures expand into many fascicles and increase in size. 6–7 axon bundles emanating from the anterior-median-foxQ2-cluster separately join this midline brain primordium (one of them marked by an arrow in C’).
Figure 4—figure supplement 1
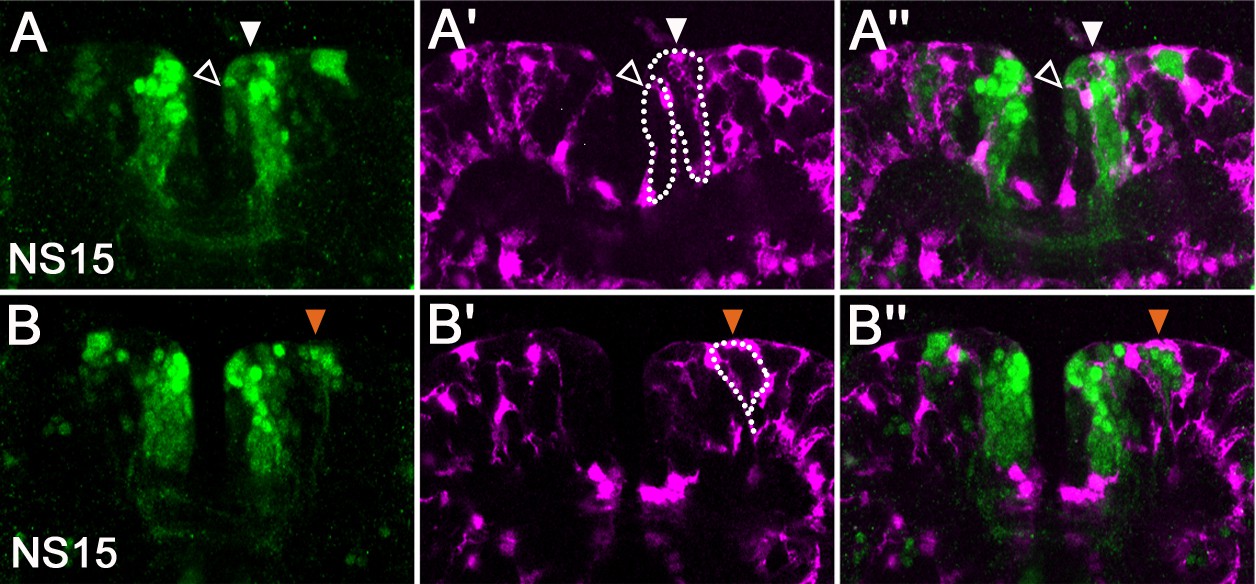
Tc-foxQ2 cell clusters are surrounded by glial sheets.
A cross of the foxQ2-5’-line (green) with the glia-line (Koniszewski et al., 2016); magenta) was imaged. (A–A’’) Most of the cells of the anterior-median-foxQ2-cluster are within one glia sheet (white arrowheads, dashed line). The medial-most cells which show comparably weak EGFP signal are surround by another glia sheet (open arrowheads, dashed line). (B–B’’) The anterior-lateral-foxQ2-lineage is surrounded by one glia sheet (orange arrowheads, dashed line).
Figure 5 with 2 supplements
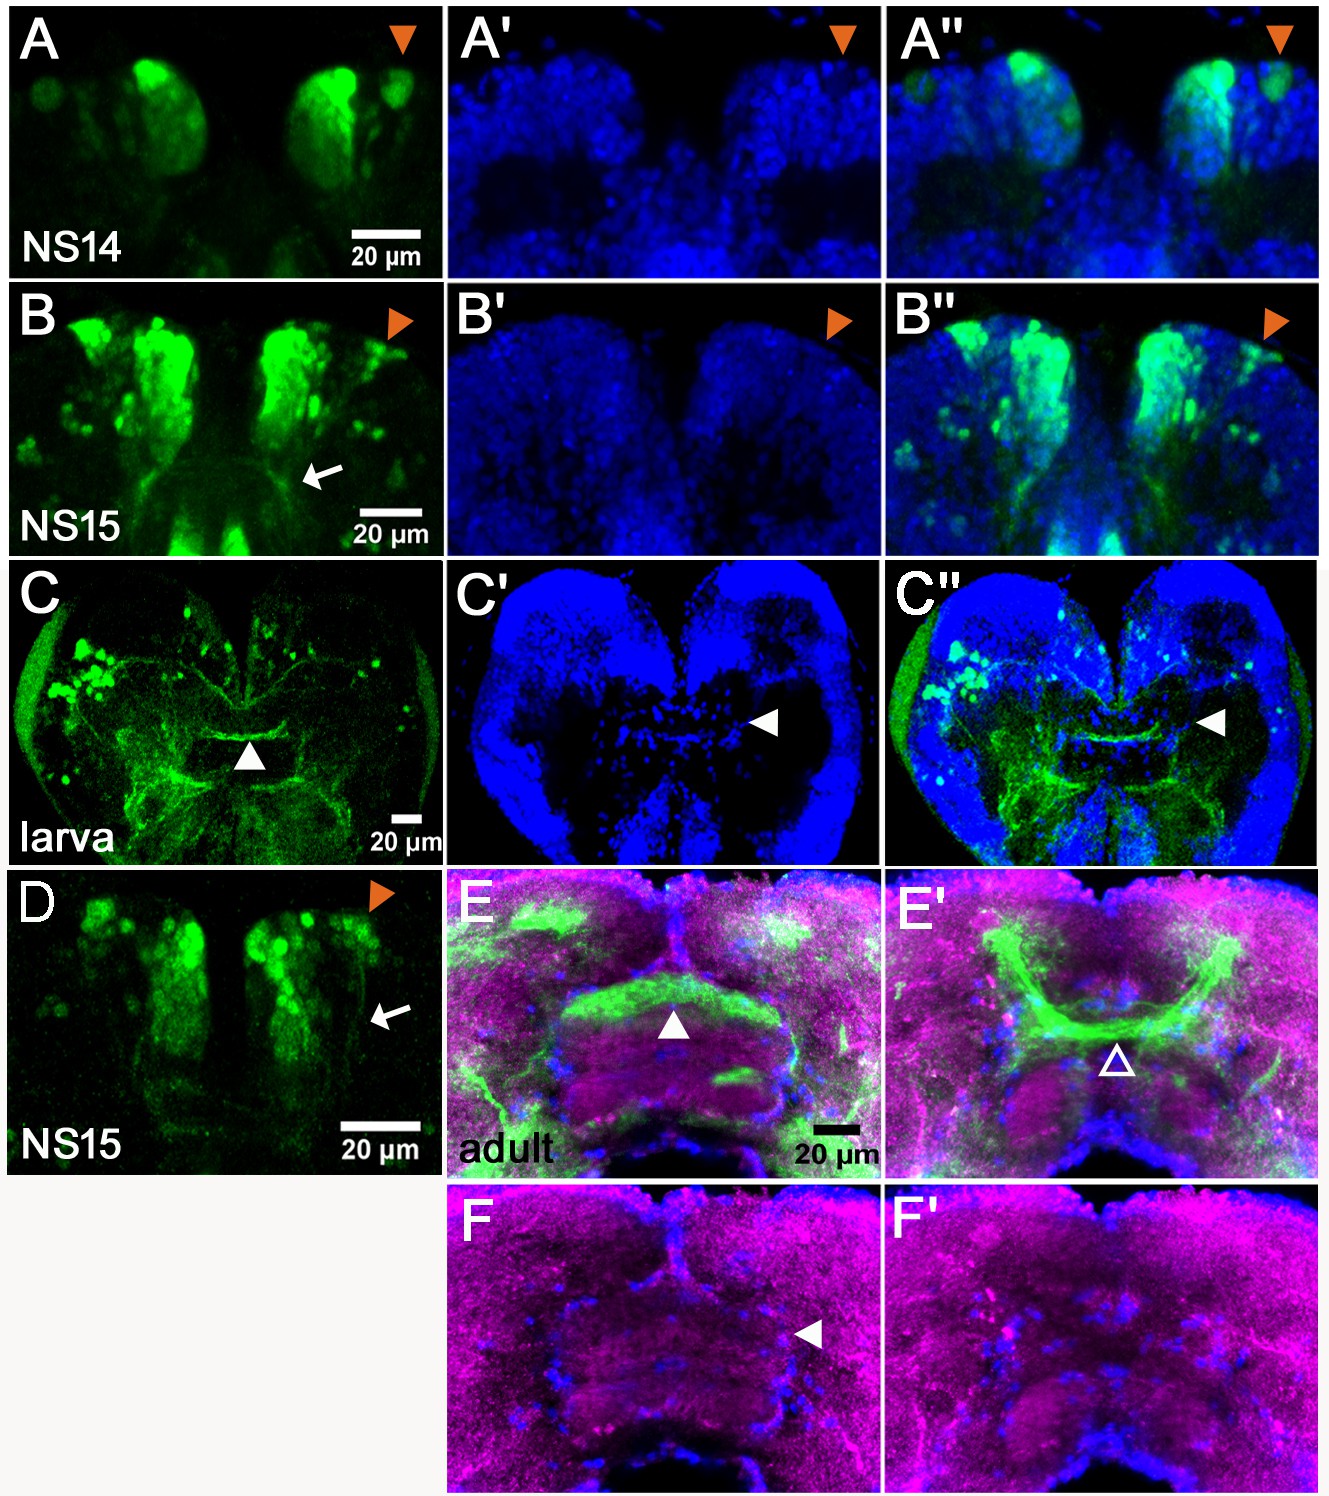
Tc-foxQ2 positive cells project through the central brain primordium and contribute to the central complex.
Immunohistochemistry visualizes EGFP (green) derived from the foxQ2-5’-line. Synapsin visualizes adult brain morphology (magenta in E,F) while nuclei are visualized by DAPI (blue in A’-C’’). (A–A’’) At NS14, the anterior-lateral-foxQ2-cluster consists of one NPC and a small number of progeny (orange arrowheads). (B–B’’, D) At NS15, more cells are marked by EGFP (orange arrowheads) and their projections join a Tc-foxQ2 positive axon bundle (white arrows in B, (D). (C–C’’) EGFP marked projections contribute to the central body in L5 larval brain, which is visualized by its surrounding glia cells (white arrowhead in C’). (E–F) EGFP marked projections contribute to the upper unit of the central body in the adult brain (white arrowhead in E) visualized by synapsin and surrounding glia (white arrowhead in F). (E’–F’) Another fascicle projects across the midline directly posterior of the central body (open arrowhead).
Figure 5—figure supplement 1
foxQ2-5’-line marks cells of the stomodeum and the lateral parts of the labrum.
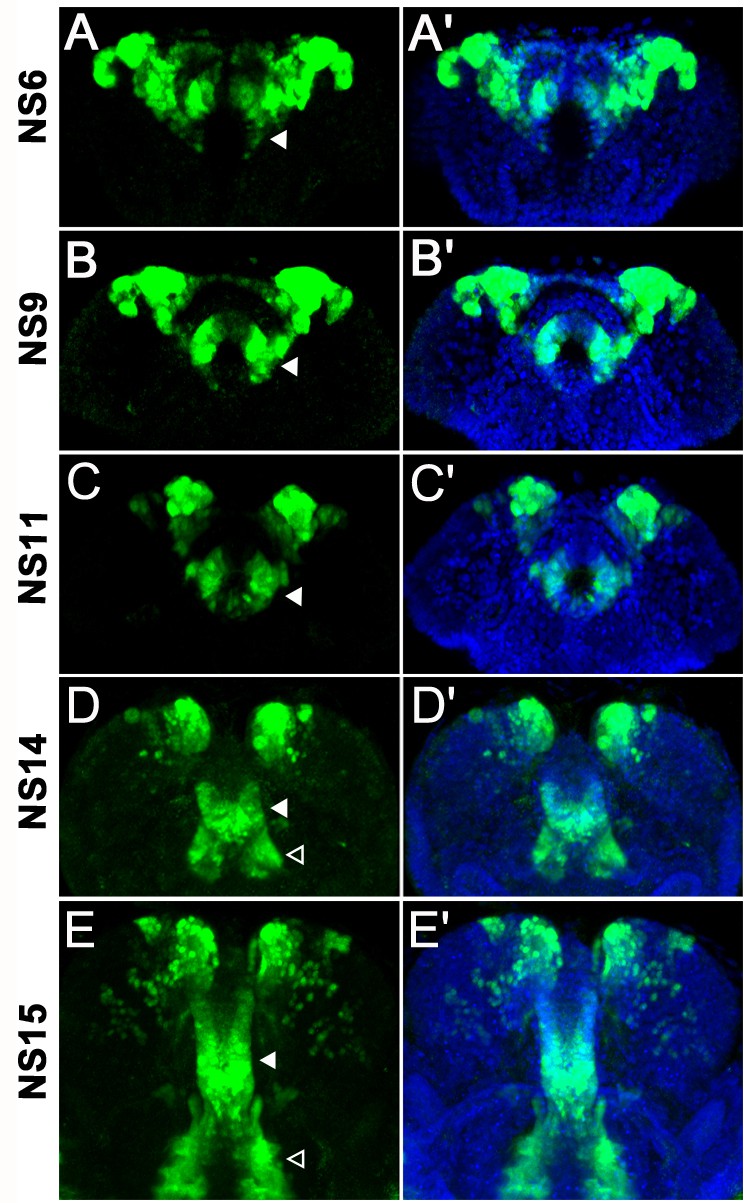
Immunohistochemistry visualizes the EGFP (green) expressed by the foxQ2-5’-line. The outline is visualized with DAPI staining (blue). The expression of Tc-foxQ2 marked by EGFP from NS6 to NS15 is shown. (A–C’) The stomodeum is located posteriorly in anterior median region and cells of it except for the dorsal roof are marked (white arrowheads). (D–E’) At NS14 and NS15, additional marked epidermal cells in the lateral parts of the labrum are observed (open arrowheads).
Figure 5—figure supplement 2
The foxQ2-5’-line marks cells lateral of the stomodeum.
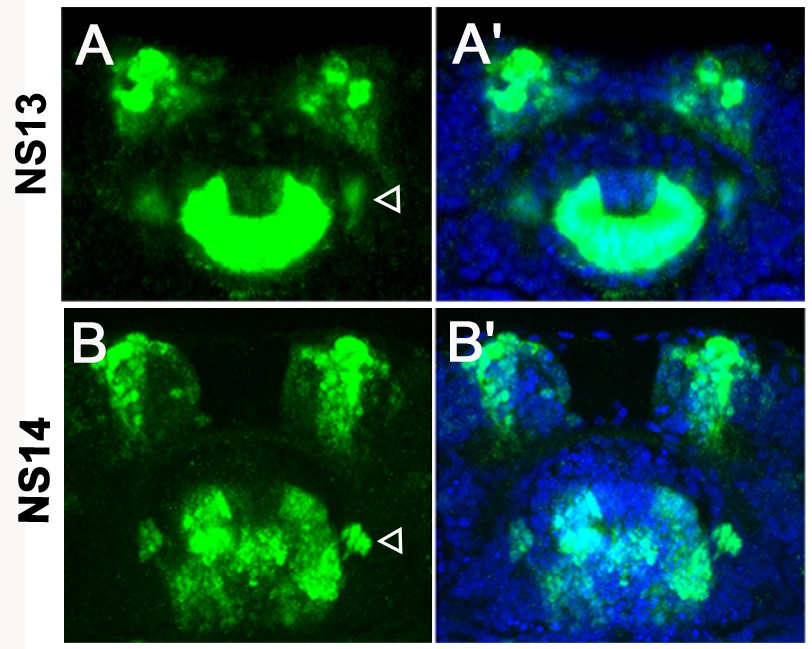
Immunohistochemistry visualizes the EGFP (green) derived from the foxQ2-5’-line. The morphology of the brain is visualized with DAPI staining (blue). (A–A’) At NS13, several cells lateral to the stomodeum are observed (open arrowhead). (B–B’) At NS14, this group of cells project into the posterior circumesophageal commissure (open arrowhead).
Figure 6
In vivo imaging reveals morphogenetic movements during brain development.
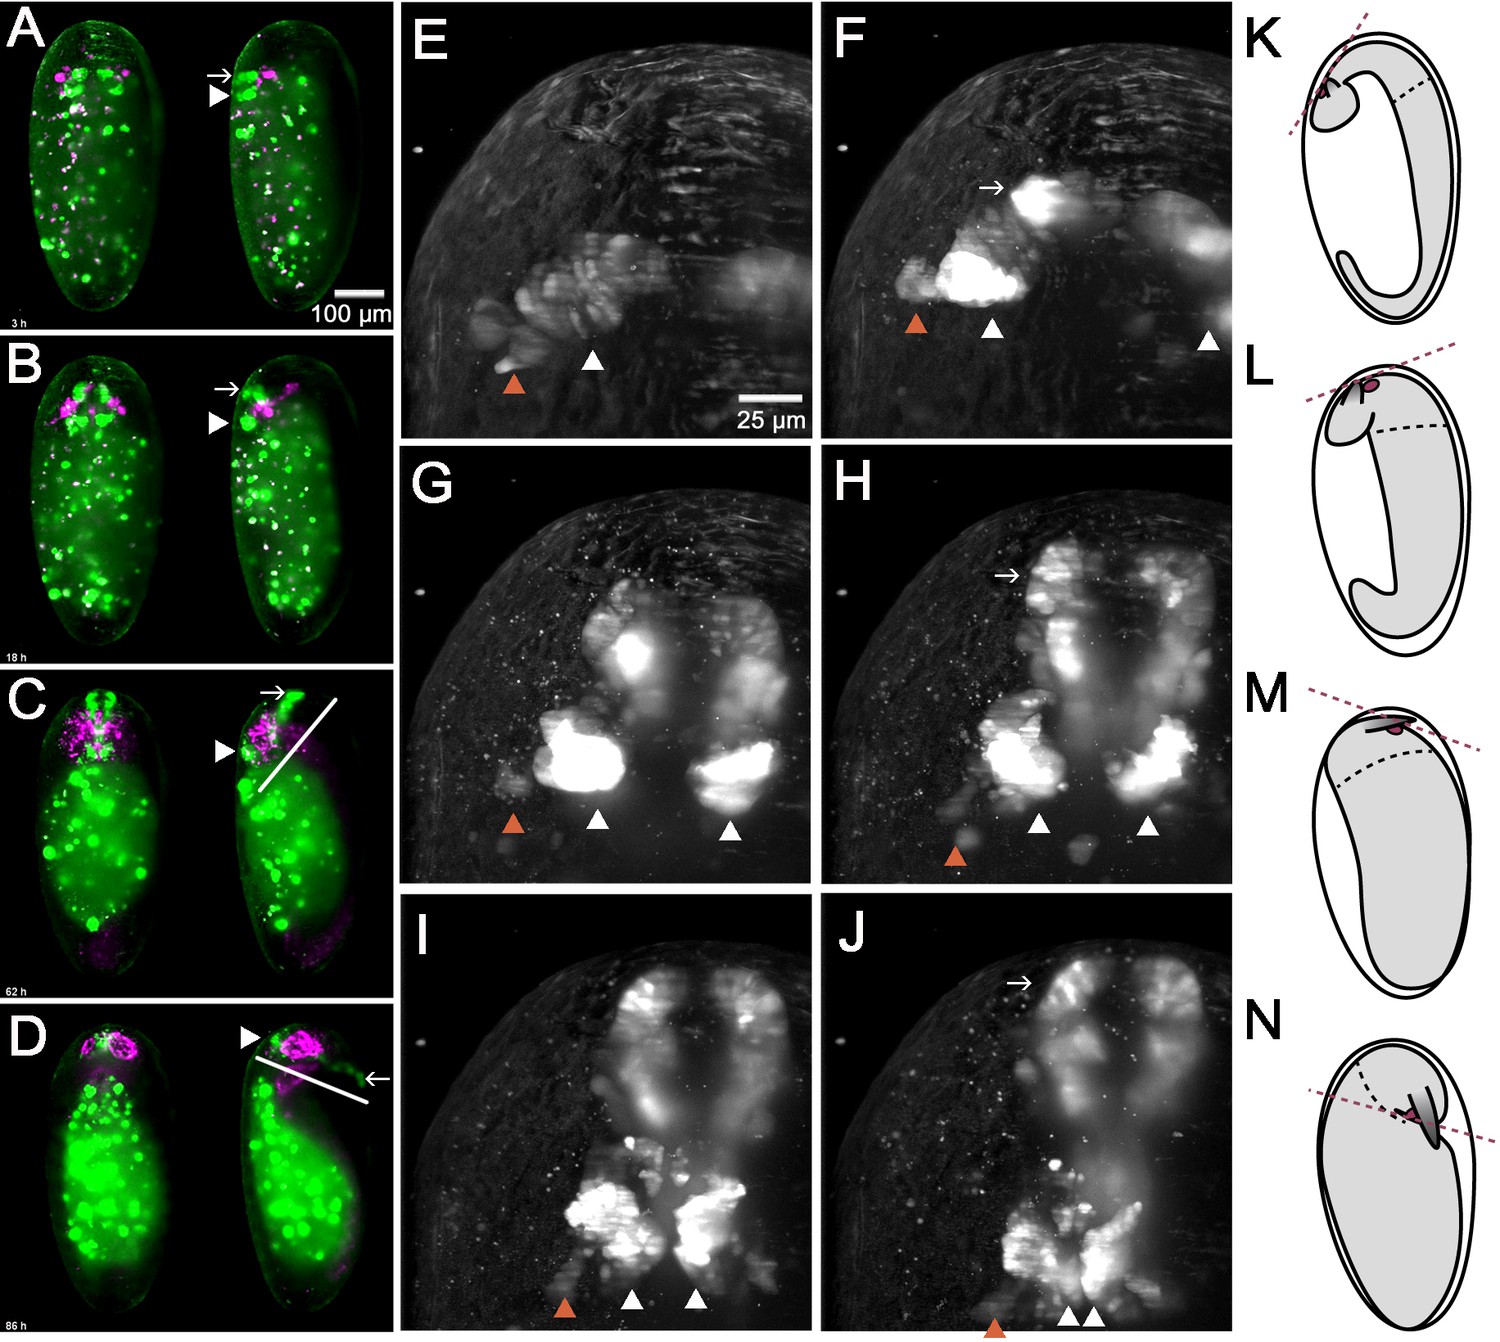
A cross of the foxQ2-5’-line (green) with the AGOC #6 glia reporter line (magenta) was imaged. (A–D) Shown are dorsal views (left specimen) and lateral views with dorsal to the left (right specimen) (A) EGFP signals in brain and stomodeum start out at the dorsal side (white arrowhead and white arrow, respectively). (B–C) Later, the stomodeum becomes elongated and bends away towards the ventral side. (C–D) An overall ventral bending of the head and brain follows, where the relative positions within the head remain similar (compare white lines in C and D). (E–J) Shown is one specimen from the dorsal side with anterior to the top. At the same time, the bilateral Tc-foxQ2 positive cell clusters approach each other towards the midline (white arrowheads). Both the anterior-median-foxQ2-cluster (white arrowheads in E-J) and the anterior-lateral-foxQ2-cluster (orange arrowheads in E-J) can be distinguished throughout development. Note that a small group of marked cells detach from the cluster and fuse at the midline. However, these cells are not Tc-FoxQ2 positive and are, hence, not further considered. (K–N) The overall morphogenetic movements of embryos aredepicted schematically with the embryo highlighted in gray. Marked are the stomodeum (red circle) and the antennae. The black hatched line marks the boundary between thorax and head segments while the red hatched line indicates the plane to which the mouth opens. The embryos are redrawn from Strobl and Stelzer (2014) and do not exactly match the stages shown in A-D.
Figure 7
Loss of Tc-foxQ2 function leads to arrest of development of brain midline structures in the embryo.
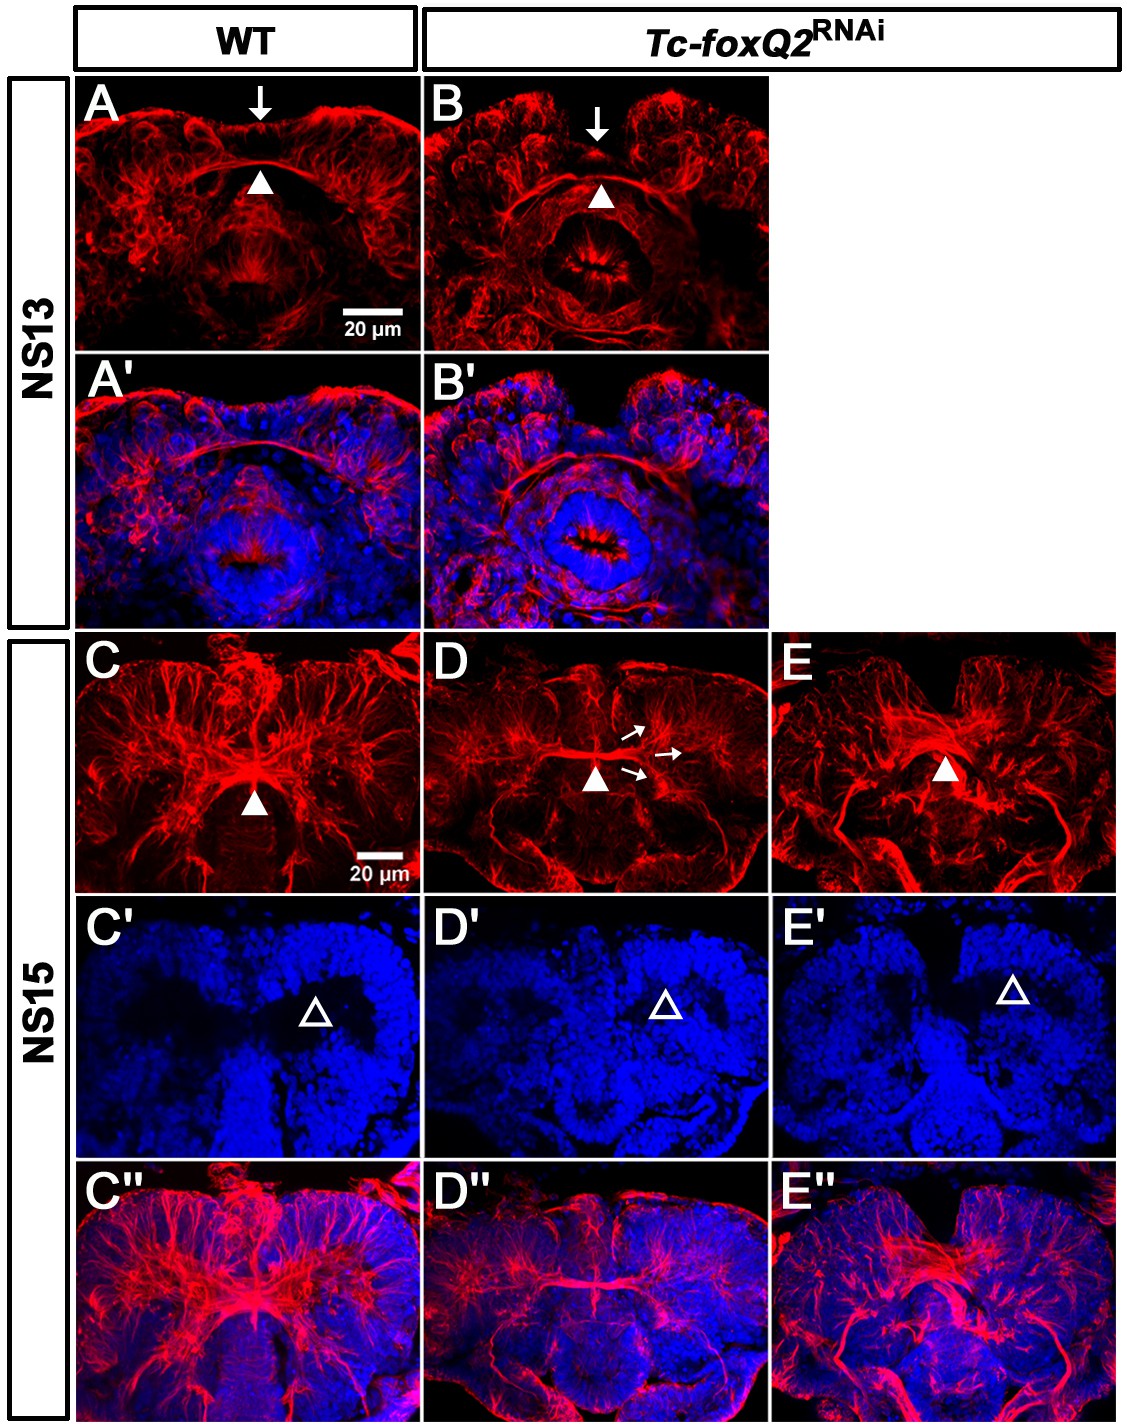
Axonal projections are marked by acTub (red) and cell bodies are visualized by DAPI (blue). (A, A’) In WT, the primary brain commissure forms at NS13 (white arrowhead in A). (B, B’) In RNAi embryos, the primary brain commissure is slightly irregular (white arrowhead in B). The anterior epidermal aberrations reflect the loss of the labrum (compare white arrows in A and B; Kitzmann et al., 2017). (C–C’’) In WT NS15 embryo, the central brain primordium increases in size and contains more fascicles, some of which form chiasmata at the midline (white arrowhead in C). (D–D’’) In strong phenotypes, the primary commissure remains detectable along with three main branches (arrows in D). However, the structures do not expand and commissure splitting does not occur. At the same time, the brain neuropil volume is strongly reduced (compare black space between the cell bodies in C’ and D’, open arrowheads (arrows in D). (E–E’’). Weak phenotypes show some degree of splitting of the brain commissure but axonal projections are disarranged (white arrowhead in E).
Figure 8 with 1 supplement
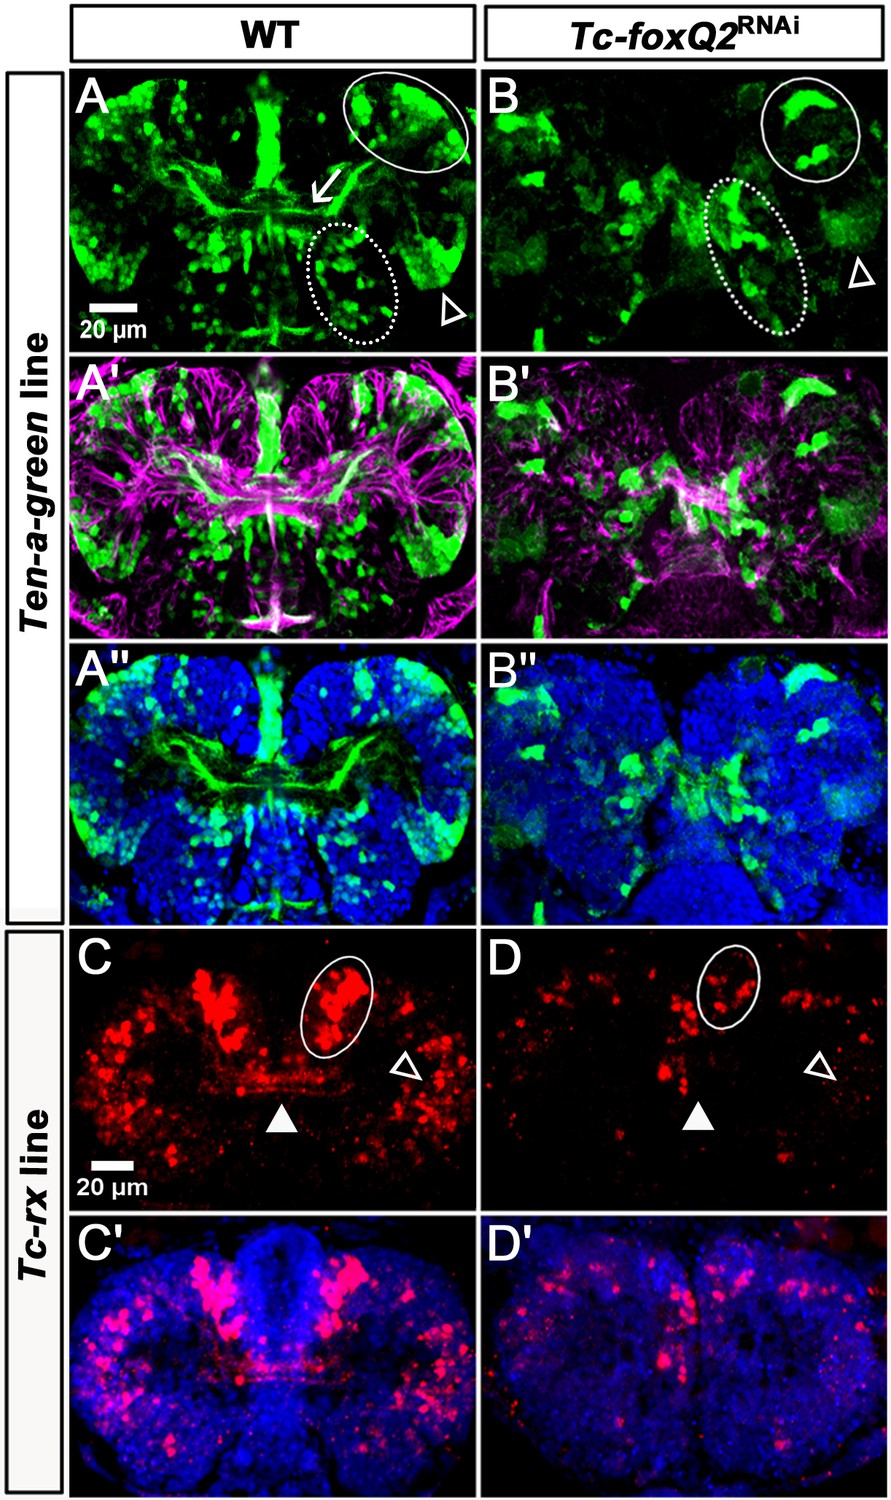
Loss of Tc-foxQ2 function in novel imaging lines confirms the midline phenotype.
(A–A’’) In WT Ten-a-green embryos, three groups of cells are marked by EGFP: An anterior group (white circle), a posterior-lateral group (open arrowhead) and a posterior-median group (dashed circle). The central brain primordium is marked with Ten-a positive fascicles projecting across the midline (white arrow in A). (B–B’’) In Tc-foxQ2 RNAi, the Ten-a positive projections and the number of the marked cells is reduced (n = 4). (C–C’) In WT Tc-rx-5’-up line, the anterior median group of cells marked by DsRed project into the central brain (white circle and white arrowhead). (D–D’) In Tc-foxQ2 RNAi, the cell number in the anterior median group is strongly reduced (n = 6; white circle) and the marked brain commissures are absent (white arrowhead). The peripheral cells are reduced in number as well (n = 6; compare open arrowheads in C,D).
Figure 8—figure supplement 1
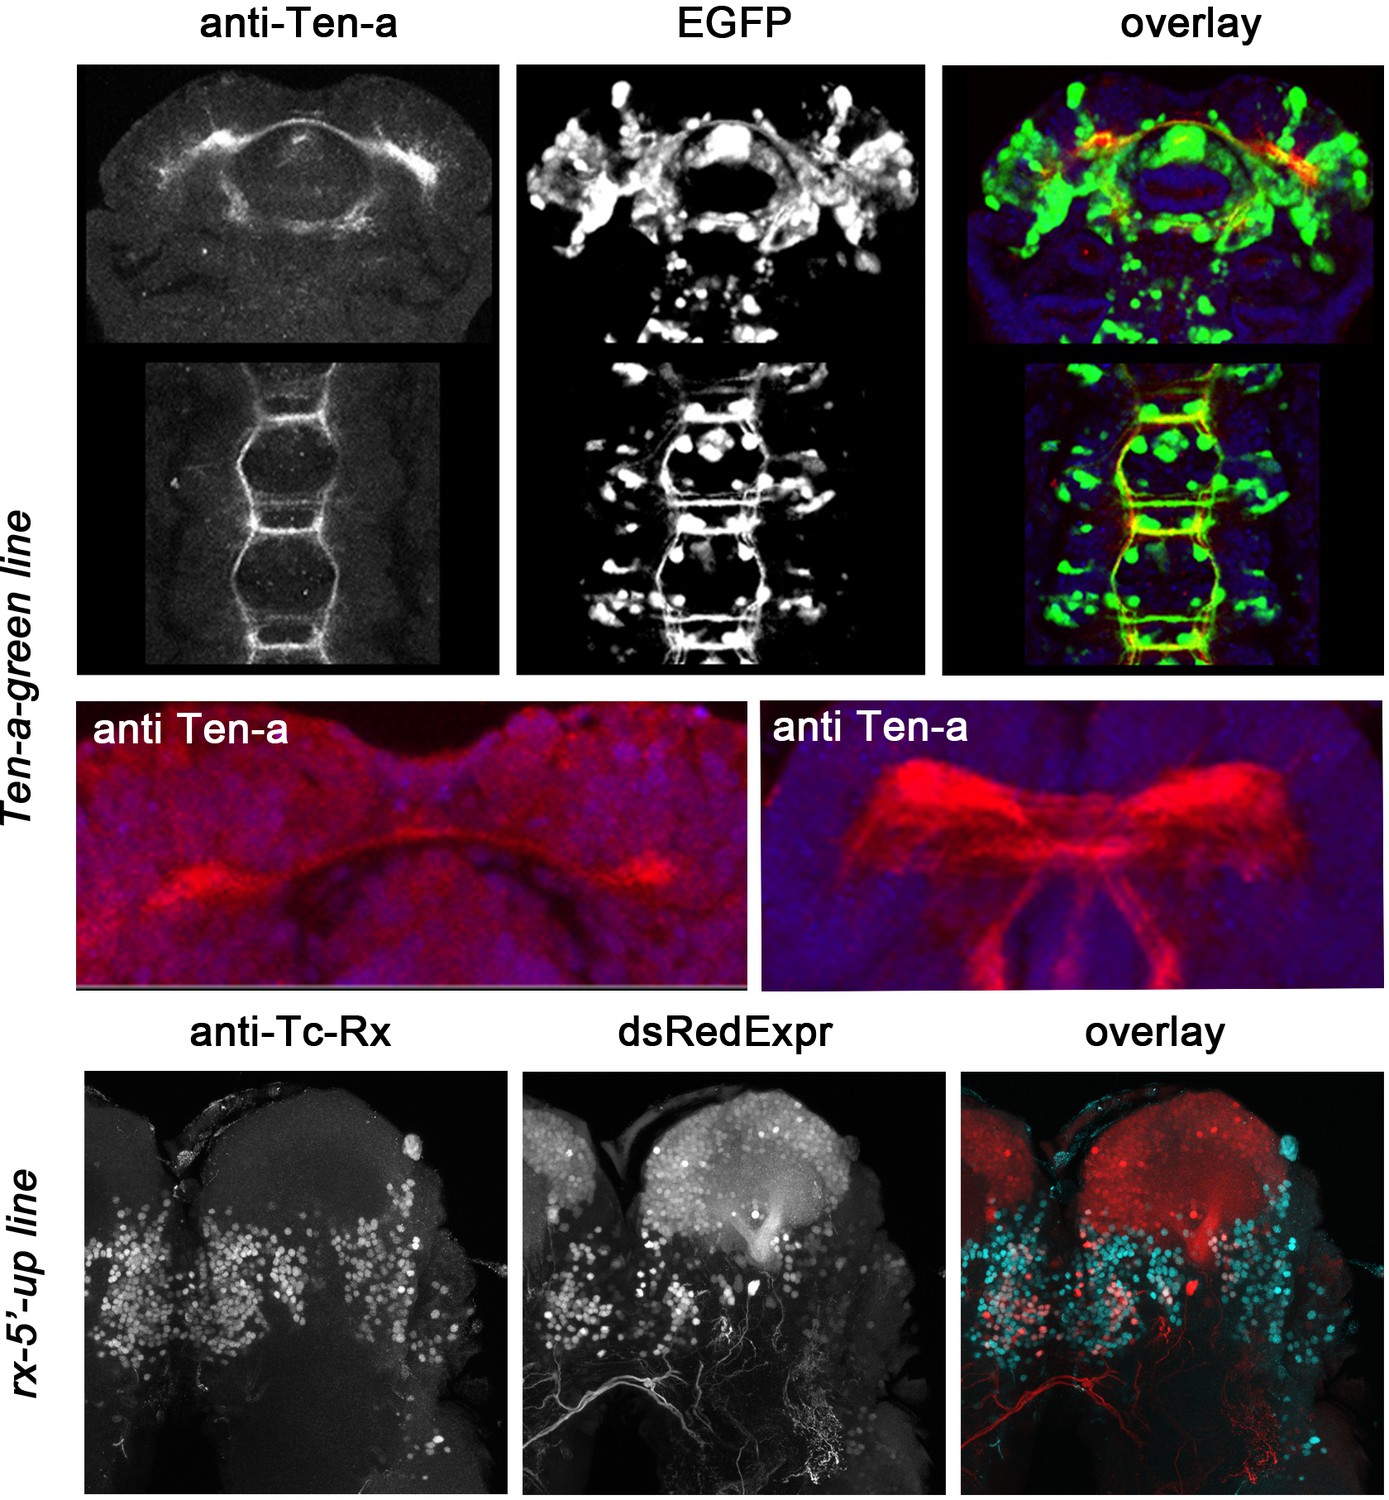
Characterization of imaging lines.
Shown are antibody stainings (left column), signal from transgenic reporter lines (medial column) and overlay (right column). Upper panels: Co-localization of reporter protein with endogenous Ten-a protein in the Ten-a-line. Middle panel: anti Ten-a staining in Tribolium embryo marks the first midline crossing fascicle (left panel). Later, it marks several midline crossing fascicles of the central brain (right panel). Lower panels: Partial co-localization of reporter protein with endogenous protein in the rx-5’-up line.
Figure 9

RNAi in the foxQ2-5’-line indicates self-regulation.
(A–B’) At NS13, Tc-foxQ2 RNAi shows the strongly reduced number of marked cells in the anterior-median-foxQ2-cluster (n = 4; white arrowheads) while the signal in the stomodeum appears to be unaffected (stars). (C–F’) In Tc-foxQ2 RNAi, the number of marked cells decreased significantly (n = 4; white arrowhead). The fascicles are reduced and follow an abnormal rounded path instead of the straight line in WT (compare white arrows in E and F). Legends figure supplements.
Videos
Video 1
Shown are a dorsal (left) and lateral (right) view on a developing embryo with Tc-foxQ2 positive cells marked in green and glial cells marked in red in 10X magnification.
Anterior is up. The development is shown over the time of 80 hr. From 0–20 hr the head lobes and the brain anlagen approach each other at the midline. Subsequently, the labrum is seen to elongate towards anterior until 60 hr. Finally, the head undergoes an overall change of position by a rotation towards the ventral side.
Video 2
Shown is the dorsal view on a developing embryo with Tc-foxQ2 positive cells marked by EGFP at higher magnification (40X).
The movements towards the midline of the marked cell clusters are shown.
Tables
Key resources table
| Reagent type (species) or resource | Designation | Source or reference | Identifiers | Additional information |
|---|---|---|---|---|
| Gene(Tribolium castaneum) | foxQ2 | iBeetle-Base http://ibeetle-base.uni-goettingen.de/ | TC004761 | Drosophila Ortholog: fd102, CG11152 |
| Strain, strain background (Tribolium castaneum) | San Bernardino | SB | NCBI:txid7070 | |
| Strain, strain background (Tribolium castaneum) | vermillionwhite | vw | NCBI:txid7070 for transgenesis, mutant eye color (white) is rescued to black by 3XP3-vw | |
| Genetic reagent (Tribolium castaneum) | foxQ2-5’-line | this publication | marks Tc-foxQ2 positive cells with EGFP; maintained by Bucher-Lab | |
| Genetic reagent (Tribolium castaneum) | Ten-a-green-line | this publication | marks Ten-a positive cells with EGFP; maintained by Bucher-Lab | |
| Genetic reagent (Tribolium castaneum) | rx-5’-up-line | this publication | marks a subset of Tc-rx positive cells with dsRedexpress; maintained by Bucher-Lab | |
| Recombinant DNA reagent | [3xP3:Tc’v-SV40-Cre-2A-EGFP:bhsp68-eb] | this publication Addgene plasmid #124068 | repair template for NHEJ mediated enhancer traps in Tribolium castaneum EGFP and Cre under the control of the Tribolium core heat-shock promoter, which is not heat-shock responsive but takes up enhancer traps. | |
| Recombinant DNA reagent | bhsp68-Cas9 | Gilles et al., 2015 Addgene plasmid #65959 | Cas9 gene for co-injection | |
| Antibody | anti-GFP (chicken polyclonal) | Abcam | RRID:AB_300798 | 1:1000 |
| Antibody | anti-acetylated Tubulin (mouse monogclonal) | Sigma Aldrich | RRID:AB_609894 | 1:50 |
| Antibody | anti-SYNORF1 (synonym: anti synapsin) (mouse monoclonal) | DHSB Hybridoma Bank (University of Iowa) | RRID:AB_2313867 3C11 (DSHB ID) | 1:40 |
| Antibody | anti-RFP (rabbit polyclonal) | Abcam, ab62341 | RRID: AB_945213 | 1:1000 |
| Antibody | anti-Tenascin (Teneurin)-a (rabbit polyclonal) | Fascetti and Baumgartner, 2002 | 1:1000 | |
| Antibody | Secondary antibodies coupled with Alexa Fluor 488 or Alexa Fluor 555 (goat anti mouse or goat anti chicken, polyclonal) | Thermo Fisher Scientific Cat # A32723 Cat # A32727 Cat # A-11039 Cat # A-21437 | RRID:AB_2633275 RRID:AB_2633276 RRID:AB_142924 RRID:AB_2535858 | 1:1000. |
| Commercial assay or kit | MEGAscript T7 Transcription Kit | Thermo Fisher Scientific | production of dsRNA | |
| Sequence-based reagent | Tc-foxQ2RNAi_a-L | Kitzmann et al., 2017 | Primer for dsRNA template production: GAATTGTAATACGACTCAC TATAGGCTTACTTCAGGACCCGG | |
| Sequence-based reagent | Tc-foxQ2RNAi_a-R | Kitzmann et al., 2017 | Primer for dsRNA template production: GAATTGTAATACGACTCACTATAGGTCGCTTGTAACAATGCTTGA |
Additional files
-
Supplementary file 1
Supplementary tables including quantifications and oligo sequences.
- https://doi.org/10.7554/eLife.49065.020
-
Transparent reporting form
- https://doi.org/10.7554/eLife.49065.021
Download links
A two-part list of links to download the article, or parts of the article, in various formats.
Downloads (link to download the article as PDF)
Open citations (links to open the citations from this article in various online reference manager services)
Cite this article (links to download the citations from this article in formats compatible with various reference manager tools)
An ancestral apical brain region contributes to the central complex under the control of foxQ2 in the beetle Tribolium
eLife 8:e49065.
https://doi.org/10.7554/eLife.49065


