An ancestral apical brain region contributes to the central complex under the control of foxQ2 in the beetle Tribolium
- University of Göttingen, Germany
- Neurosciences and Biophysics, Germany
- Goethe University, Germany
Abstract
The genetic control of anterior brain development is highly conserved throughout animals. For instance, a conserved anterior gene regulatory network specifies the ancestral neuroendocrine center of animals and the apical organ of marine organisms. However, its contribution to the brain in non-marine animals has remained elusive. Here, we study the function of the Tc-foxQ2 forkhead transcription factor, a key regulator of the anterior gene regulatory network of insects. We characterized four distinct types of Tc-foxQ2 positive neural progenitor cells based on differential co-expression with Tc-six3/optix, Tc-six4, Tc-chx/vsx, Tc-nkx2.1/scro, Tc-ey, Tc-rx and Tc-fez1. An enhancer trap line built by genome editing marked Tc-foxQ2 positive neurons, which projected through the primary brain commissure and later through a subset of commissural fascicles. Eventually, they contributed to the central complex. Strikingly, in Tc-foxQ2 RNAi knock-down embryos the primary brain commissure did not split and subsequent development of midline brain structures stalled. Our work establishes foxQ2 as a key regulator of brain midline structures, which distinguish the protocerebrum from segmental ganglia. Unexpectedly, our data suggest that the central complex evolved by integrating neural cells from an ancestral anterior neuroendocrine center.
https://doi.org/10.7554/eLife.49065.001Introduction
The brain is among the most complex organs found in animals. During development many different types of neurons are specified to build the macrocircuitry of the central nervous system before the microcircuitry is established. Understanding the genetic and cellular underpinnings of brain development has remained one of the major challenges in developmental biology. Many aspects of neural development are conserved in animals but compared to vertebrates, insects have a strongly reduced number of neural cells and the genes involved are usually present in single copy. This has made insects very useful models to study the genetic control of neural development (Hartenstein and Stollewerk, 2015; Technau et al., 2006). The insect central nervous system is composed of serially homologous segmental ganglia (Snodgrass, 1935; Weber, 1966). However, the anterior-most part of the brain, the protocerebrum, is of different origin. It stems from an anterior non-segmental tissue dating back to the last common bilaterian ancestor (Arendt et al., 2008; Rempel, 1975; Scholtz and Edgecombe, 2006; Snodgrass, 1935; Strausfeld, 2012; Weber, 1966). Accordingly, a number of neural patterning genes are expressed in the anterior brain anlagen but not in the trunk of animals from vertebrates to insects (Acampora et al., 1998; Arendt and Nübler-Jung, 1996; Arendt et al., 2008; Gehring, 1996; Hirth et al., 1995; Hirth et al., 2003; Lowe et al., 2003; Posnien et al., 2011b; Quiring et al., 1994; Sinigaglia et al., 2013; Steinmetz et al., 2010). Conversely, a number of transcription factors that confer spatial identity to trunk neuroblasts (NBs) are expressed in a quite modified way or not at all in the protocerebral neuroectoderm (Urbach and Technau, 2003a; Urbach and Technau, 2003b). A number of profound structural differences distinguish the protocerebrum from segmental ganglia. The former contains unique structures like the optic lobes, the mushroom bodies and is marked by a set of midline-spanning neuropils, the central complex (CX) (El Jundi and Heinze, 2016; Pfeiffer and Homberg, 2014; Snodgrass, 1935; Strausfeld, 2012; Weber, 1966). Further, a process called fascicle switching occurs in the commissure of the brain but not the ventral nerve cord. In that process, some neurites leave their commissural fascicle (de-fasciculation) and join another commissural fascicle (re-fasciculation). Fascicle switching leads to the typical X-shaped chiasmata (decussations) of the central body and is essential for CX development (Boyan et al., 2008; Boyan et al., 2017).
Recently, a molecular subdivision within the protocerebrum was found where an anterior optix/six3 positive region distinguishes an ancestral neuroendocrine center of animals from a more posterior otd/otx positive region (Kittelmann et al., 2013; Steinmetz et al., 2010). The components and some of their interactions of the anterior gene regulatory network (aGRN) including six3 and foxQ2 are conserved within animals (Hunnekuhl and Akam, 2014; Kitzmann et al., 2017; Lowe et al., 2003; Marlow et al., 2013; Range and Wei, 2016; Sinigaglia et al., 2013; Wei et al., 2009; Yaguchi et al., 2008; Yaguchi et al., 2010). Apart from marking neuroendocrine cells throughout animal clades, this neural region gives rise to the apical organ of marine animals including ciliated cells like the apical tuft (Dunn et al., 2007; Marlow et al., 2013; Santagata et al., 2012; Sinigaglia et al., 2013; Wei et al., 2009). It was proposed that the anterior brain of bilaterians evolved by the fusion of an ancestral apical brain with an ancestral blastoporal brain located at the opposite pole of the animal (Tosches and Arendt, 2013). In this model, the ancestral apical brain contained cells for neuroendocrine control and non-visual photoreception and was patterned by the expression of six3 and rx. Based on recent data, foxQ2 adds to this list of apical markers. The blastoporal nervous system, in contrast, was located at the opposite pole of the animal, performed a sensory contractile function and was marked by the expression of nk2.1, Pax6 and other genes. Starting from this ancestral condition, the anterior part of the blastoporal system fused with the apical brain to form an evolutionary ‘chimera’ forming the anterior brain of extant bilaterians. For instance anterior and tuberal hypothalamus and the retina of vertebrates were proposed to be of chimeric origin (Tosches and Arendt, 2013). However, it has remained unclear to which non-neuroendocrine structures the apical region might contribute in arthropods, which do not have an apical organ (Hunnekuhl and Akam, 2014; Marlow et al., 2014). Further, the identity of the neural parts representing the hypothetical chimeric anterior brain has remained enigmatic in insects.
We have been using the red flour beetle Tribolium castaneum as complementary model system for brain development for a number of reasons. First, it represents a more ancestral situation of anterior neuroectoderm development. In Tribolium and most other insects including the basal hemimetabolan insects, the brain neuroectoderm derives from a subterminal ventral blastodermal region rather than from the anterior dorsal blastoderm as found in Drosophila. This difference in blastodermal geometry results in divergent genetic regulation (Ansari et al., 2018; Fu et al., 2012; Kittelmann et al., 2013; Nunes da Fonseca et al., 2008; Posnien et al., 2010). Second, any profound functional comparison of brain development and function between Drosophila and other taxa requires a quite advanced toolkit. With respect to transgenesis, misexpression, genome editing, efficient genome wide RNAi screening and other tools for analysis of gene function, Tribolium is a genetic model insect second only to Drosophila (Berghammer et al., 1999; Bucher et al., 2002; Dönitz et al., 2018; Gilles et al., 2015; Schinko et al., 2010; Schmitt-Engel et al., 2015; Tomoyasu and Denell, 2004; Trauner et al., 2009).
In this work we examined the role of the forkhead transcription factor Tc-foxQ2 in brain development because this gene is exclusively expressed in the region patterned by the aGRN (Kitzmann et al., 2017). Further, it is a highly conserved anterior patterning gene. Orthologs of foxQ2 are involved in anterior-most specification of neural cells in many clades of bilaterians and in cnidarians (Darras et al., 2011; Fritzenwanker et al., 2014; Hunnekuhl and Akam, 2014; Leclère et al., 2016; Marlow et al., 2013; Range and Wei, 2016; Range and Wei, 2016; Sinigaglia et al., 2013; Wei et al., 2009; Yaguchi et al., 2008; Yaguchi et al., 2010; Yu et al., 2003). A notable exception are amphibians and mammals, where the gene was lost from the genome (Mazet et al., 2003). In arthropods, anterior expression of foxQ2 orthologs was described in Drosophila (fd102C, CG11152) and Strigamia maritima, a myriapod (Hunnekuhl and Akam, 2014; Lee and Frasch, 2004) correlating with the location of neuroendocrine cells. Recently, we have shown an upstream role of Tc-foxQ2 in anterior head epidermis patterning in Tribolium where it acts together with six3/optix upstream in the aGRN to build the labrum (Kitzmann et al., 2017).
Intriguingly, an effect on embryonic CX development was noted as well. The two CX neuropils protocerebral bridge (PB) and central body (CB) form partially during embryogenesis in Tribolium and some other holometabolan taxa (Koniszewski et al., 2016; Panov, 1959; Wegerhoff and Breidbach, 1992) while in Drosophila the first functional CX neuropil appears during pupation. In the ancestral situation represented for instance by the hemimetabolan insect Schistocerca gregaria, the entire brain forms during embryogenesis (Boyan et al., 2017; Koniszewski et al., 2016). In Tribolium larvae, the CB neuropil forms a simple bar crossing the midline. Its position prefigures the one of the adult CB but it still lacks columnar structure and subdivision into upper and lower divisions (fan-shaped and ellipsoid body, respectively) (Koniszewski et al., 2016). A modification of the shape of the larval CB was observes after RNAi knock-down of Tc-foxQ2 but apart from that, functional data on the neural function of foxQ2 had been missing in any protostome.
We found that Tc-foxQ2 was continuously expressed in anterior median cell clusters from neural progenitors to postmitotic neurons of the late embryonic, larval and adult brains. Based on co-expression with other protocerebral patterning genes we characterized four different types of Tc-foxQ2 positive neural progenitor cells. Further, we generated genetic neural imaging lines and found that Tc-foxQ2 positive neurons project through the primary brain commissure and later into the upper unit of the central body (fan-shaped body). Tc-foxQ2 RNAi-knock-down embryos failed to develop brain midline structures: The primary brain commissure did form but failed to split into the large number of protocerebral commissures. Consequently, the CB formation was abolished. These results identify Tc-foxQ2 as one of the key factors of embryonic brain development contributing to the different development of the protocerebrum versus segmental ganglia. Unexpectedly, our results show that cells patterned by the aGRN contribute to the CX, a unique protocerebral brain structure. Apparently, the insect CX evolved by integrating cells from the ancestral anterior-most neuroectoderm, which gives rise to the apical organ including the apical tuft in marine animals.
Results
Tc-foxQ2 marks neural progenitor cells with four different molecular identities
In the embryo, Tc-foxQ2 is expressed in the anterior neuroectoderm from earliest stages onwards indicating a role in the specification of neuroblasts (Kitzmann et al., 2017). Hence, we sought to determine which neural progenitor cells (NPCs) expressed Tc-foxQ2. To that end we generated an antibody specific for the Tc-FoxQ2 protein (see Materials and methods and Figure 1—figure supplement 1) and used an intronic probe of Tc-asense (Tc-ase) as marker for NPCs, which could be either NBs, intermediate neural progenitors (INPs) of type II NBs or ganglion mother cells (GMCs) (Boone and Doe, 2008; Bowman et al., 2008). It should be noted that the Tc-ase has been shown to be a marker for NBs in Tribolium (Wheeler et al., 2003) but that its expression in INPs or GMCs is assumed by analogy from Drosophila. In addition, cell size and shape together with large nuclei were used to recognize progenitor cells. See Figure 1—figure supplement 2 for staging according to Biffar and Stollewerk (2014) and for the comparison of the signals of exonic and intronic Tc-ase probes.
The first protocerebral NPCs delaminate at NS4. The first Tc-FoxQ2+ NPCs, however, emerge at NS8. Here, about 15 Tc-FoxQ2+/Tc-ase+ cells were identified (n = 6; Figure 1A; Supplementary file 1-table 1) forming a large anterior group (blue and green in Figure 1A’’), a small median group (gray) and a single lateral cell (orange). These groups correspond to three domains into which the Tc-foxQ2 expression splits in the neuroectoderm (Kitzmann et al., 2017). At NS11, the number had decreased to 9–12 cells expressing both markers (n = 6; Figure 1B; Supplementary file 1-table 1) while at least 5–7 cells were observed at stage 14 (n = 6; Figure 1C; Supplementary file 1-table 1). This reduction could have several reasons: Tc-ase expression may cease once NBs enter quiescence like in Drosophila (Lai and Doe, 2014) or Tc-foxQ2 expression may become repressed in a subset of NPCs. Alternatively, if the anterior group contained type II NBs, the double positive cells would be INPs or GMCs, which based on Drosophila knowledge express asense while type II NBs themselves do not (Boone and Doe, 2008; Bowman et al., 2008). Unfortunately, markers for unequivocally distinguishing NBs, INPs and GMCs remain to be established in Tribolium.
Figure 1 with 2 supplements see all
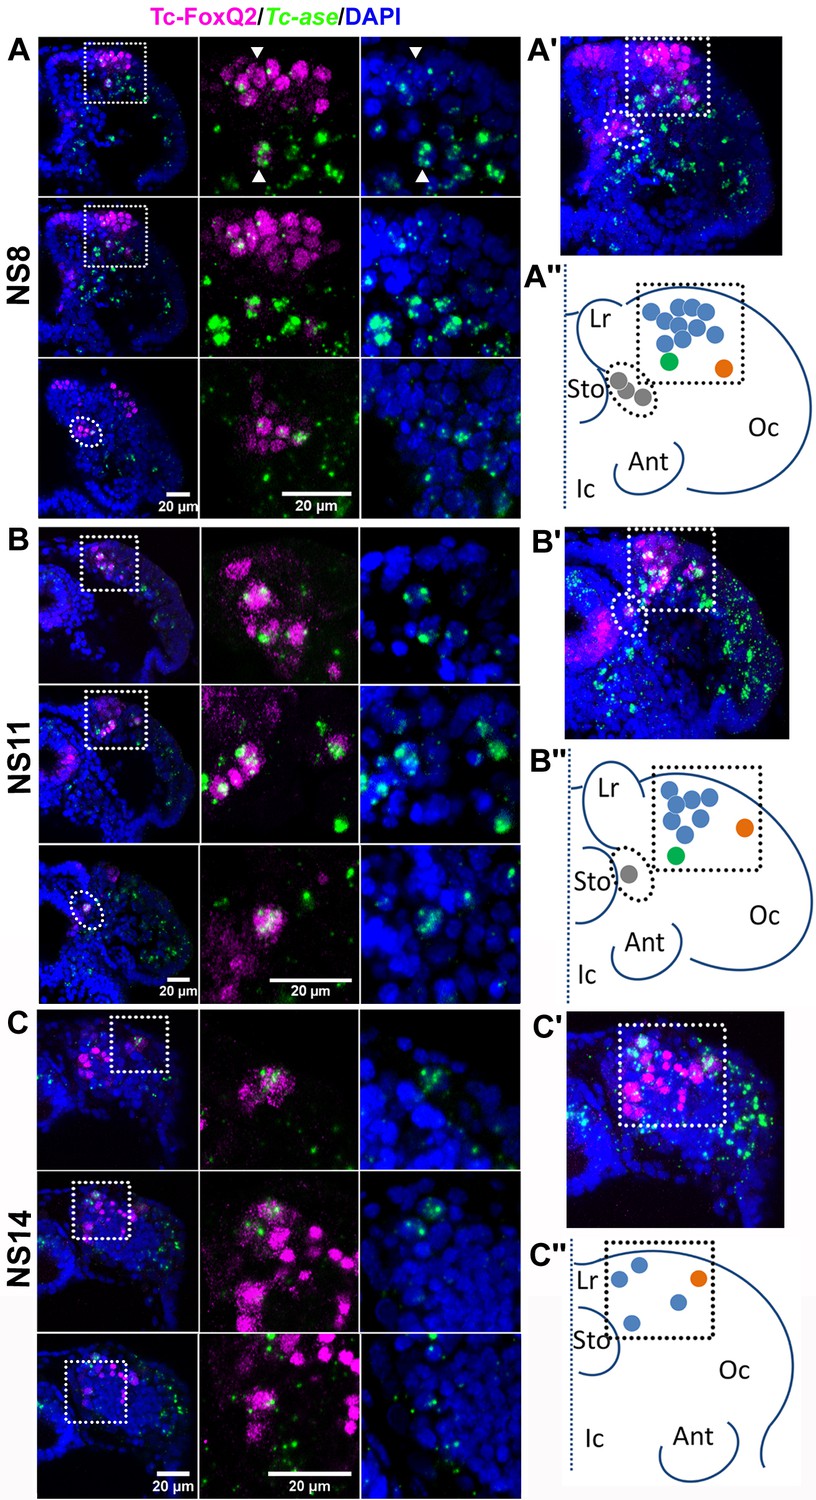
Tc-FoxQ2 positive neural progenitor cells.
Tc-FoxQ2 protein is visualized by immunohistochemistry at different stages (magenta) while neural progenitor cells (NPCs) are marked by intronic Tc-asense whole mount in situ hybridization (green). Nuclei are visualized by DAPI (blue). Optical sections of right halves of stained heads are shown in the left column while respective close-ups are shown in second and third column (see hatched areas in left column in (A, B and C). A projection of all optical sections is given in the right column (A’, B’ and C’). The schemes represent the outline of right halves of the head lobes of flattened embryos. The dotted line represents the midline. This depiction is comparable to the one previously used for Drosophila neuroblast maps (Urbach and Technau, 2003a) (A’’, B’’ and C’’). (A–A’’) At NS8 about 15 Tc-FoxQ2 positive NPCs are found (n = 6). By position, three groups are distinguished: A large anterior median group (blue in A’’) with one neuroblast slightly separated posteriorly (green in A’’), one single lateral NPC (orange in A’’) and a group located closely to the midline (gray in A’’). White arrowheads show two exemplary NPCs. (B–B’’) At NS11 about 10 Tc-FoxQ2 positive NPCs are observed (n = 6). (C–C’’) At NS14, the number has decreased to 5–7 cells (n = 6). The single lateral NPC remains distinguishable (orange in C’’). Lr: labrum; Sto: stomodeum; Oc: ocular region; Ant: antenna; Ic: Intercalary region.
The identity of NPCs is believed to be determined by unique cocktails of transcription factors (Skeath, 1999; Urbach and Technau, 2003a). In order to check whether the positional groups were also molecularly distinct we performed co-expression analyses (n = 6 embryos). We used a number of almost exclusive anterior patterning genes because these were likely to contribute to protocerebrum specific patterning (Posnien et al., 2011a; Posnien et al., 2011b; Steinmetz et al., 2010), the co-expression of which we were able to follow until stage NS11 when morphogenetic movements and the increase in cell number made an identification of individually marked cells challenging. We found four different molecular types that correlated with positional differences (Figure 2). The first type (No1 in Figure 2I’) was the largest group and was located anterior median in the neuroectoderm. This type showed co-expression of Tc-foxQ2 with Tc-six3 (optix), Tc-six4 and later Tc-chx (vsx). We call these cells the P-fox-am group of cells (P stands for protocerebral according to Drosophila nomenclature [Younossi-Hartenstein et al., 1996]). The second type (P-fox-amp) was located posteriorly adjacent and was similar to the P-fox-am but showed additional expression of Tc-scro (nkx2.1), Tc-earmuff (fez1) and in one of the cells also Tc-eyeless (Pax6) (No2 in Figure 2I’). A third type consisted of one lateral NPC, which co-expressed Tc-six3 with Tc-earmuff, Tc-rx and Tc-eyeless (No3 in Figure 2I’). Due to its separate location and molecular distinction, this cell type (P-fox-l) could be followed through several stages (orange in Figure 1). The fourth type showed only co-expression of Tc-foxQ2 and Tc-scro (No4 in Figure 2I’) and was located at a ventral position adjacent to the stomodeum (P-fox-v).
Figure 2

Neural progenitor cells co-express transcription factors.
Tc-FoxQ2 is visualized by immunohistochemistry (red) while the other transcription factors (TFs) are marked by fluorescent in situ hybridization (cyan) at NS8 and NS11. Nuclei are visualized by DAPI (blue). Close-ups of the right halves of embryonic heads are shown (A–H’’’) and schemes are given at the bottom (I and I’). (A–A’’’) Co-expression of Tc-six3 and Tc-FoxQ2. (B–B’’’) Co-expression of Tc-six4 and Tc-FoxQ2. (C–C’’’) Co-expression of Tc-rx and Tc-FoxQ2. (D–D’’’) Co-expression of Tc-chx and Tc-FoxQ2. (E–E’’’) Co-expression of Tc-ey and Tc-FoxQ2. (F–F’’’) Co-expression of Tc-fez1 and Tc-FoxQ2. (G–H’’’) Co-expression of Tc-scro and Tc-FoxQ2. (I, I’) Four different identities of NPCs are distinguished based on their position and co-expression. P-fox-am (1) is located in the anterior median neuroectoderm. The cells in this group co-express Tc-FoxQ2 with Tc-six3, Tc-six4 and later Tc-chx. P-fox-amp (2) is located posteriorly adjacent with additional expression of Tc-scro, Tc-fez1 and in one of the cells also Tc-ey. P-fox-l (3) consists of one lateral cell which co-expresses Tc-FoxQ2 with Tc-six3, Tc-fez1, Tc-rx and Tc-ey. P-fox-v (4) is located ventrally adjacent to the stomodeum, showing only co-expression of Tc-FoxQ2 and Tc-scro. Same abbreviations as in Figure 1.
We were not able to homologize these NPCs with those of Drosophila or Tenebrio. This was due to the lack of a comprehensive map of all brain NBs in Tribolium, lack of data for most of the respective expression patterns in Drosophila NBs and the morphological differences between Tribolium and both Drosophila and Tenebrio (Urbach and Technau, 2003a; Urbach et al., 2003). However, based on the exclusively pre-antennal expression of Tc-foxQ2 during embryogenesis (Kitzmann et al., 2017), we assign all cells to the protocerebrum. We found no Tc-FoxQ2+ cells in the more posterior parts of the brain or the ventral nerve cord.
Taken together, our analysis showed that Tc-foxQ2 marks four distinct types of Tc-ase positive cells in the early neuroectoderm. Its expression suggests a role in the specification of NPCs in the protocerebral part of the insect brain.
Marking of the Tc-foxQ2 genetic neural lineage by a CRISPR/Cas9 induced enhancer trap
Orthologs of foxQ2 are involved in anterior-most patterning in animals including development of the apical organ (Marlow et al., 2014; Sinigaglia et al., 2013; Yaguchi et al., 2010). In insects, foxQ2 is exclusively expressed in protocerebral tissue and a function in protocerebrum-specific neuropils has been suggested (Kitzmann et al., 2017). However, foxQ2+ neurons had not been marked to follow their projections in any insect. Unfortunately, foxQ2 enhancer trap lines were neither available for Tribolium nor Drosophila. Hence, we used CRISPR/Cas9 genome editing (Gilles et al., 2015) for a non-homologous end joining strategy to generate an enhancer trap in the Tc-foxQ2 locus that drives EGFP (see Materials and methods; Supplementary file 1-tables 2–4; Figure 3—figure supplement 1, (Farnworth et al., 2019). By double immunohistochemistry we confirmed that EGFP and Tc-FoxQ2 protein expression correlated quite well throughout embryogenesis (Figure 3). The observed differences appeared to be mainly due to different dynamics of maturation and degradation of the two proteins but we cannot exclude that cells are single positive for either EGFP or Tc-FoxQ2. We called this line foxQ2-5’-line and used it for all subsequent analyses of Tc-foxQ2+ neurons.
Figure 3 with 1 supplement see all
Tc-foxQ2 positive cells marked by antibody and the foxQ2-5’-line.
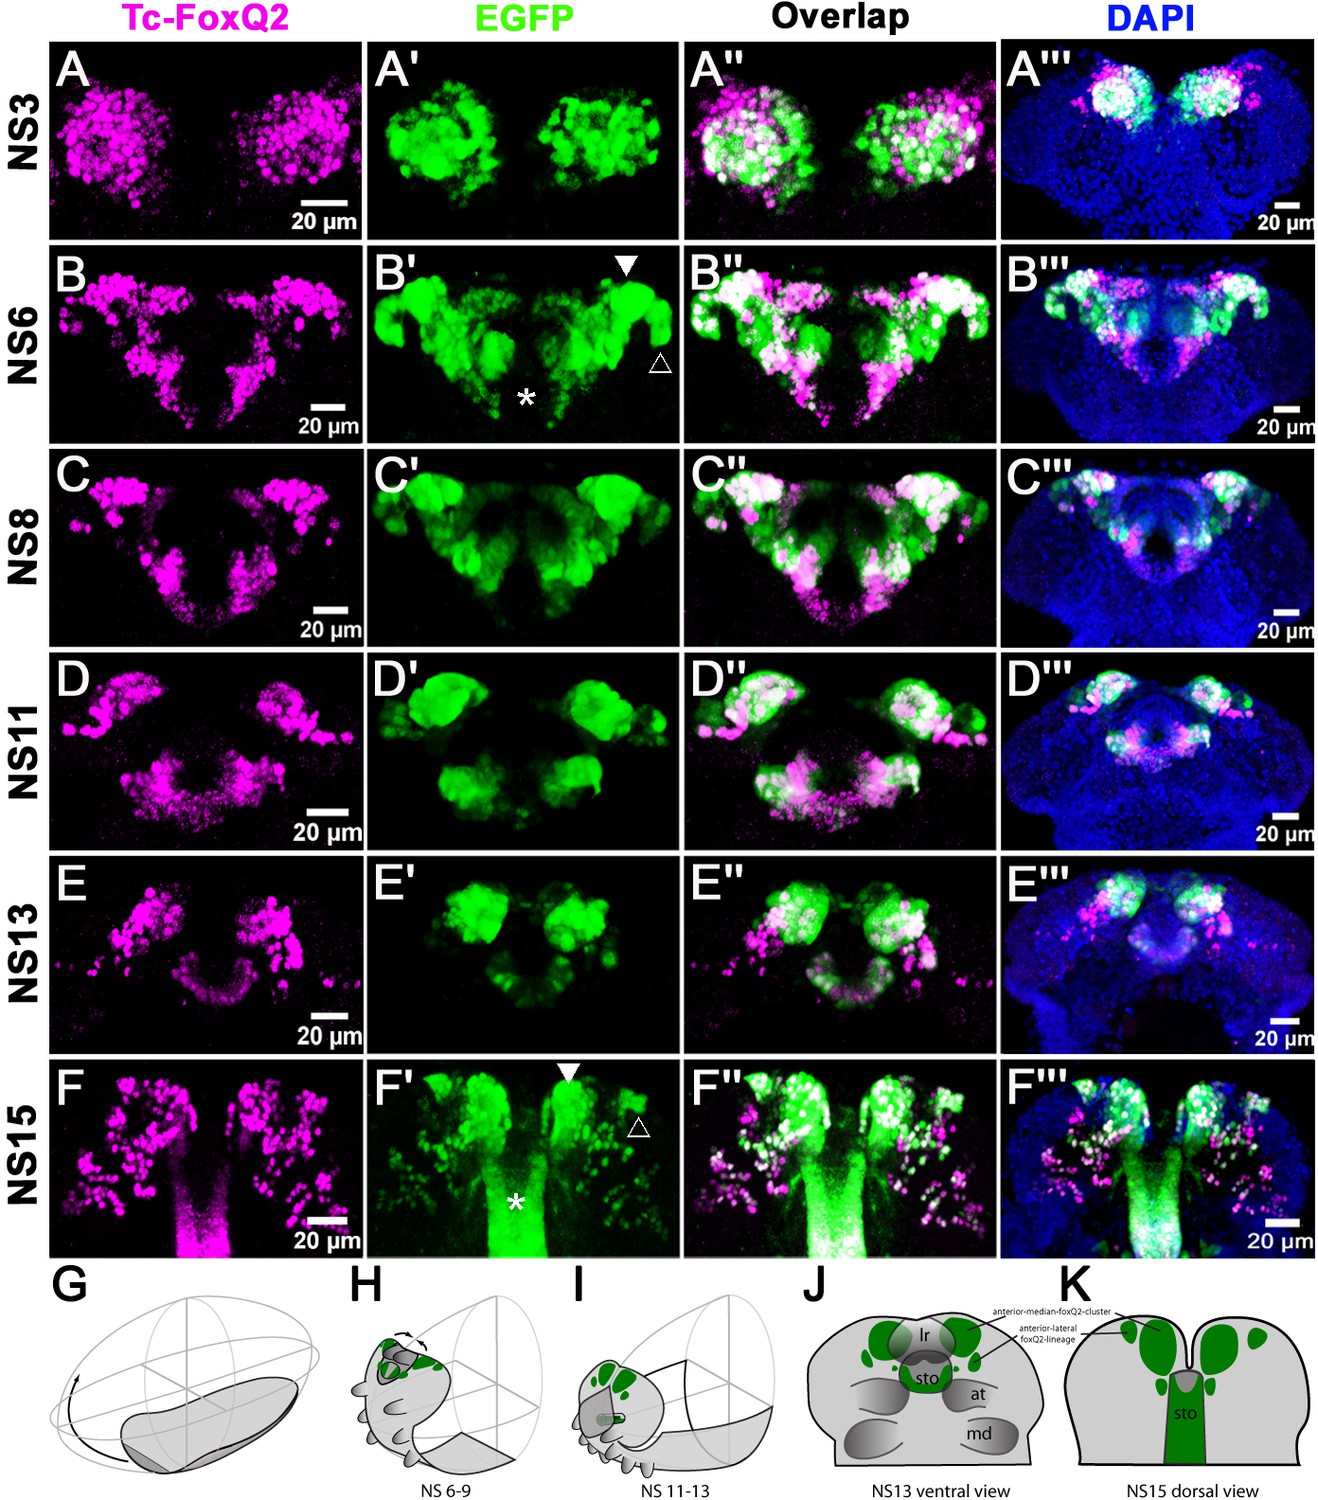
The expression of EGFP (green) derived from the foxQ2-5’-line and Tc-FoxQ2 protein (magenta) correlate closely throughout embryogenesis. The morphology of the anterior neuroectoderm is visualized with DAPI staining (blue, right column). Shown are heads of embryos dissected out of the egg and flattened to reveal the staining within the neuroectoderm (A’’’–C’’’) and the developing brain (D’’’–F’’’). Some differences between EGFP and Tc-FoxQ2 expression are observed, which may be due to either different dynamics of maturation and degradation of these proteins or to divergence of the enhancer trap signal from the endogenous expression. (A–A’’’) At NS3, Tc-foxQ2 expression shows two bilateral domains within the anterior median region. (B–F’’’) Later, the expression domains split into a stomodeal (asterisk), a median (white arrowhead) and lateral domain (open arrowhead). At NS15, two clusters of cells are observed: The large anterior-median-foxQ2-cluster (white arrowhead in F’) and a smaller anterior-lateral-foxQ2-lineage (open arrowhead in F’). (G–I) The general movements of the head tissue areshown from the germ rudiment (G) to an elongating (H) and a retracting stage (I). The approximate positions of the Tc-foxQ2 marked cells underlying the head epidermis are shown. (J,K) Flat preparations of heads of stage NS13 (J) and NS15 (K) are shown with the approximate positions of the underlying Tc-foxQ2 marked cells shown in green. (G–I) are redrawn from Posnien and Bucher (2010).
During embryogenesis from NS3 to NS13, the Tc-FoxQ2 antibody and EGFP stainings closely matched the in situ hybridization patterns (Kitzmann et al., 2017). Essentially, Tc-FoxQ2 was initially expressed in two bilateral anterior-median expression domains (Figure 3A). Later, these resolved into a stomodeal (asterisk in Figure 3B’ and F’) and an anterior domain, which was further subdivided into a median (white arrowhead) and lateral domain (open arrowhead). The P-fox-v NPCs were located in the stomodeal domain while the other types emerged from within the anterior domains. Towards the end of embryogenesis (NS15) two clusters of cells reminiscent of neural lineages were observed: A large anterior median group (white arrowhead in Figure 3F’) and a smaller lateral group (open arrowhead). In addition, scattered cells were observed more posteriorly in the brain and strong staining in the stomodeum persisted (asterisk).
Three Tc-FoxQ2 positive cell clusters contribute to brain midline structures including the central body
We characterized the contribution of Tc-foxQ2+ cells to the embryonic brain. We found no Tc-foxQ2+ glia based on immunohistochemistry in our transgenic glia reporter line glia-blue (Koniszewski et al., 2016) (not shown). In order to study the development of the projection patterns of Tc-foxQ2+ neurons we performed double-immunohistochemistry visualizing the EGFP derived from the foxQ2-5’-line combined with ß-acetylated tubulin (acTub), which marks axonal projections (Piperno and Fuller, 1985). We detected at least three clusters of Tc-foxQ2+ cells with properties of neural lineages (Figure 4, please find entire stacks and videos on figshare project 62939).
Figure 4 with 1 supplement see all
Anterior-median-foxQ2-cluster contributes to the central brain primordium.
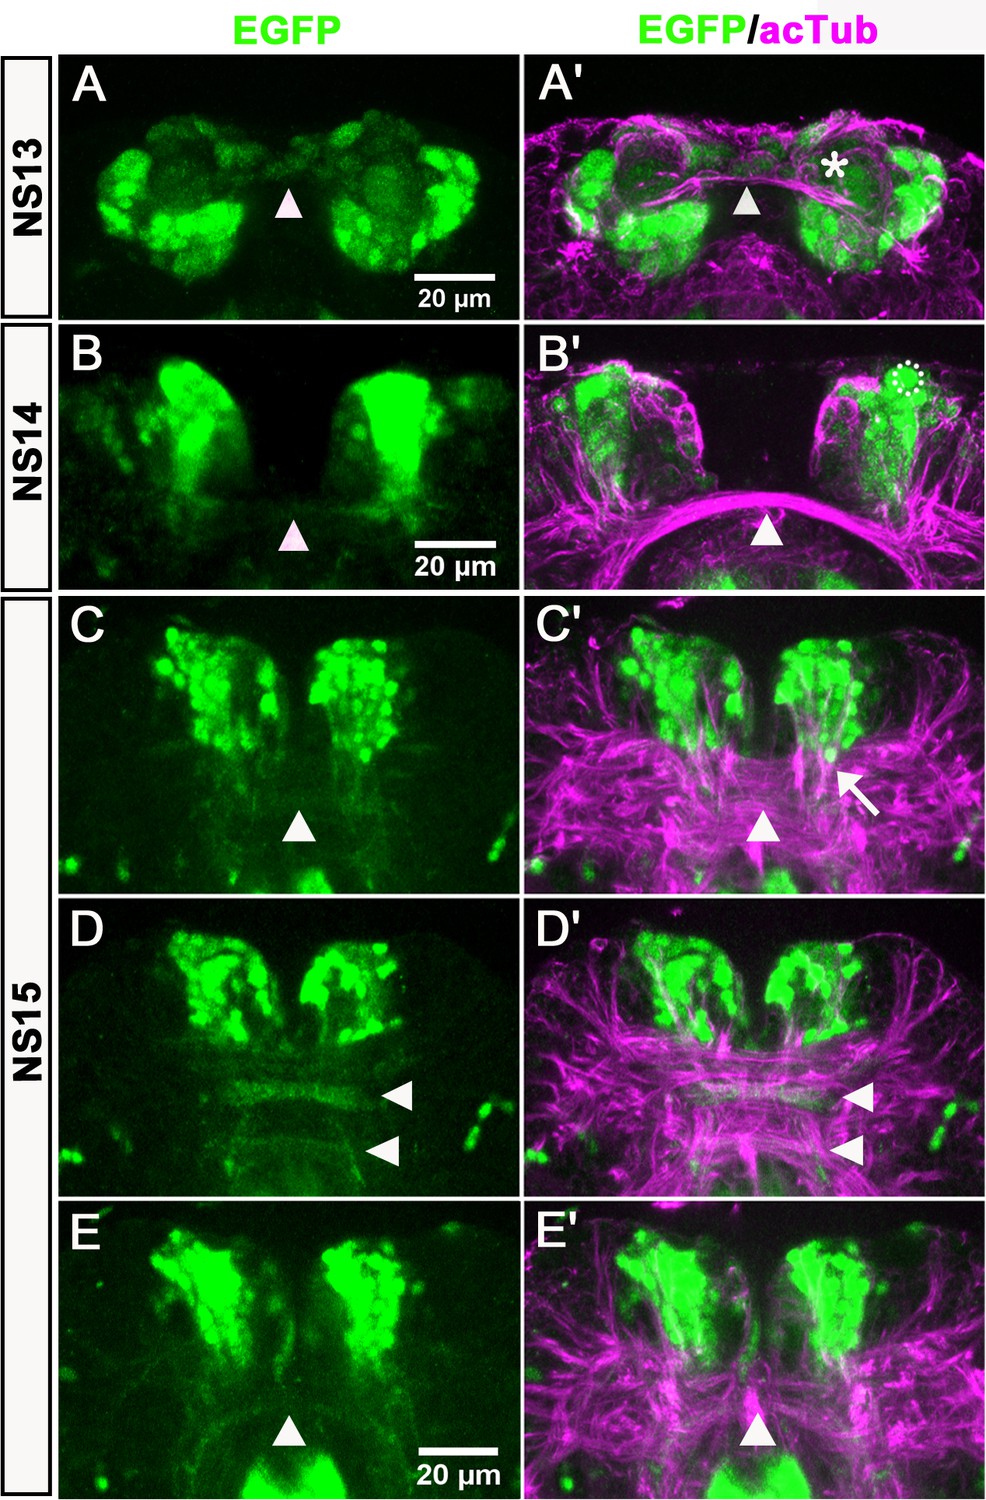
Double-immunohistochemistry visualizes the EGFP (green) derived from the foxQ2-5’-line and acTub (magenta) which marks axonal projections – neuraxis anterior is up. (A–A’) At NS13, the first brain commissure marked by acTub appears (white arrowhead in A’). The cell bodies of the anterior-median-foxQ2-cluster are located around this commissure but do not yet project into it. A few weakly stained cells closely attached to the commissure are not Tc-FoxQ2 protein positive (asterisk in A’). (B–B’) At NS14, projections within the brain commissure become visible but have not yet reached the midline (white arrowhead in B). One Tc-FoxQ2 positive NPC is recognized by its morphology and position (hatched circle in B’). (B) and (B’) are not the same embryo but from the same developmental stage. (C–E) At NS15, at least three brain commissures are marked by the anterior-median-foxQ2-cluster: One in the circumesophageal commissure (white arrowhead in E), and two commissures within the central brain primordium (white arrowheads in D). The anterior-median-foxQ2-cluster produces more cells at this stage. (C’–E’) acTub marked brain commissures expand into many fascicles and increase in size. 6–7 axon bundles emanating from the anterior-median-foxQ2-cluster separately join this midline brain primordium (one of them marked by an arrow in C’).
At stage NS13, the first brain commissure became visible in the acTub staining (white arrowhead in Figure 4A’). One large continuous cluster of about 89 Tc-foxQ2+ cells was situated around this primary commissure and was located in the anterior median part of the forming brain (n = 5; Figure 4A; Supplementary file 1-table 5). About 12 marked cells had the nuclear morphology of NPCs (n = 5; Figure 4A; Supplementary file 1-table 5). We termed this group of adjacent cells the anterior-median-foxQ2-cluster. Based on the number of observed NPCs within the cluster and the number of projections that emerge from it we assume that it could be composed of several neural lineages. During subsequent development, these cells stayed together but along with general morphogenetic movements they approached each other towards the midline (compare distance in Figure 4B with E; see Videos 1 and 2).
Video 1
Shown are a dorsal (left) and lateral (right) view on a developing embryo with Tc-foxQ2 positive cells marked in green and glial cells marked in red in 10X magnification.
Anterior is up. The development is shown over the time of 80 hr. From 0–20 hr the head lobes and the brain anlagen approach each other at the midline. Subsequently, the labrum is seen to elongate towards anterior until 60 hr. Finally, the head undergoes an overall change of position by a rotation towards the ventral side.
Video 2
Shown is the dorsal view on a developing embryo with Tc-foxQ2 positive cells marked by EGFP at higher magnification (40X).
The movements towards the midline of the marked cell clusters are shown.
At NS14 the cell number in the anterior-median-foxQ2-cluster had increased to about 150 (n = 5; Figure 4B; Supplementary file 1-table 5) and 14 Tc-FoxQ2+ NPCs were still discernable (e.g. hatched circle in Figure 4B’). At that stage, the first EGFP positive projections became visible. They projected towards the brain commissure and joined it. However, at that stage, the EGFP+ projections had not yet reached the midline of the commissure (white arrowhead in Figure 4B).
By NS15 the cell number of the anterior-median-foxQ2-cluster had increased to approximately 210–240 cells (n = 5; Figure 4C–E; Supplementary file 1-table 5) but NPCs were no longer distinguishable by morphological means. The brain commissure had split and expanded significantly by additional projections from other lineages (Figure 4C’–E’). Likewise, the projections of the anterior-median-foxQ2-cluster became more complex. About 6–7 axon bundles emanated from that cluster to separately join the central brain primordium (arrow in Figure 4C’) to cross the midline. EGFP signal distinguished at least three major sites of midline structures with Tc-foxQ2+ contribution: One in the half-ring-like circumesophageal commissure (white arrowhead in Figure 4E), and two separate fascicles within the central brain primordium (white arrowheads in Figure 4D and Figure 4D’).
In order to assign the anterior-median-foxQ2-cluster to characterized NPCs we traced back the EGFP signal from NS15 to the embryonic neuroectoderm. Based on continuous expression from NS3 to NS15 and in vivo imaging data on its development (Videos 1 and 2) we suggest that it is derived from P-fox-am type of NPCs. By crossing with the transgenic glia marker line glia-red (Koniszewski et al., 2016) we found that most cells of the cluster were surrounded by one glial sheet indicating that they formed one large neural lineage (white arrowhead in Figure 4—figure supplement 1). A second glia sheet appeared to surround the medial-most cells marked with lower levels of EGFP (open arrowhead in Figure 4—figure supplement 1).
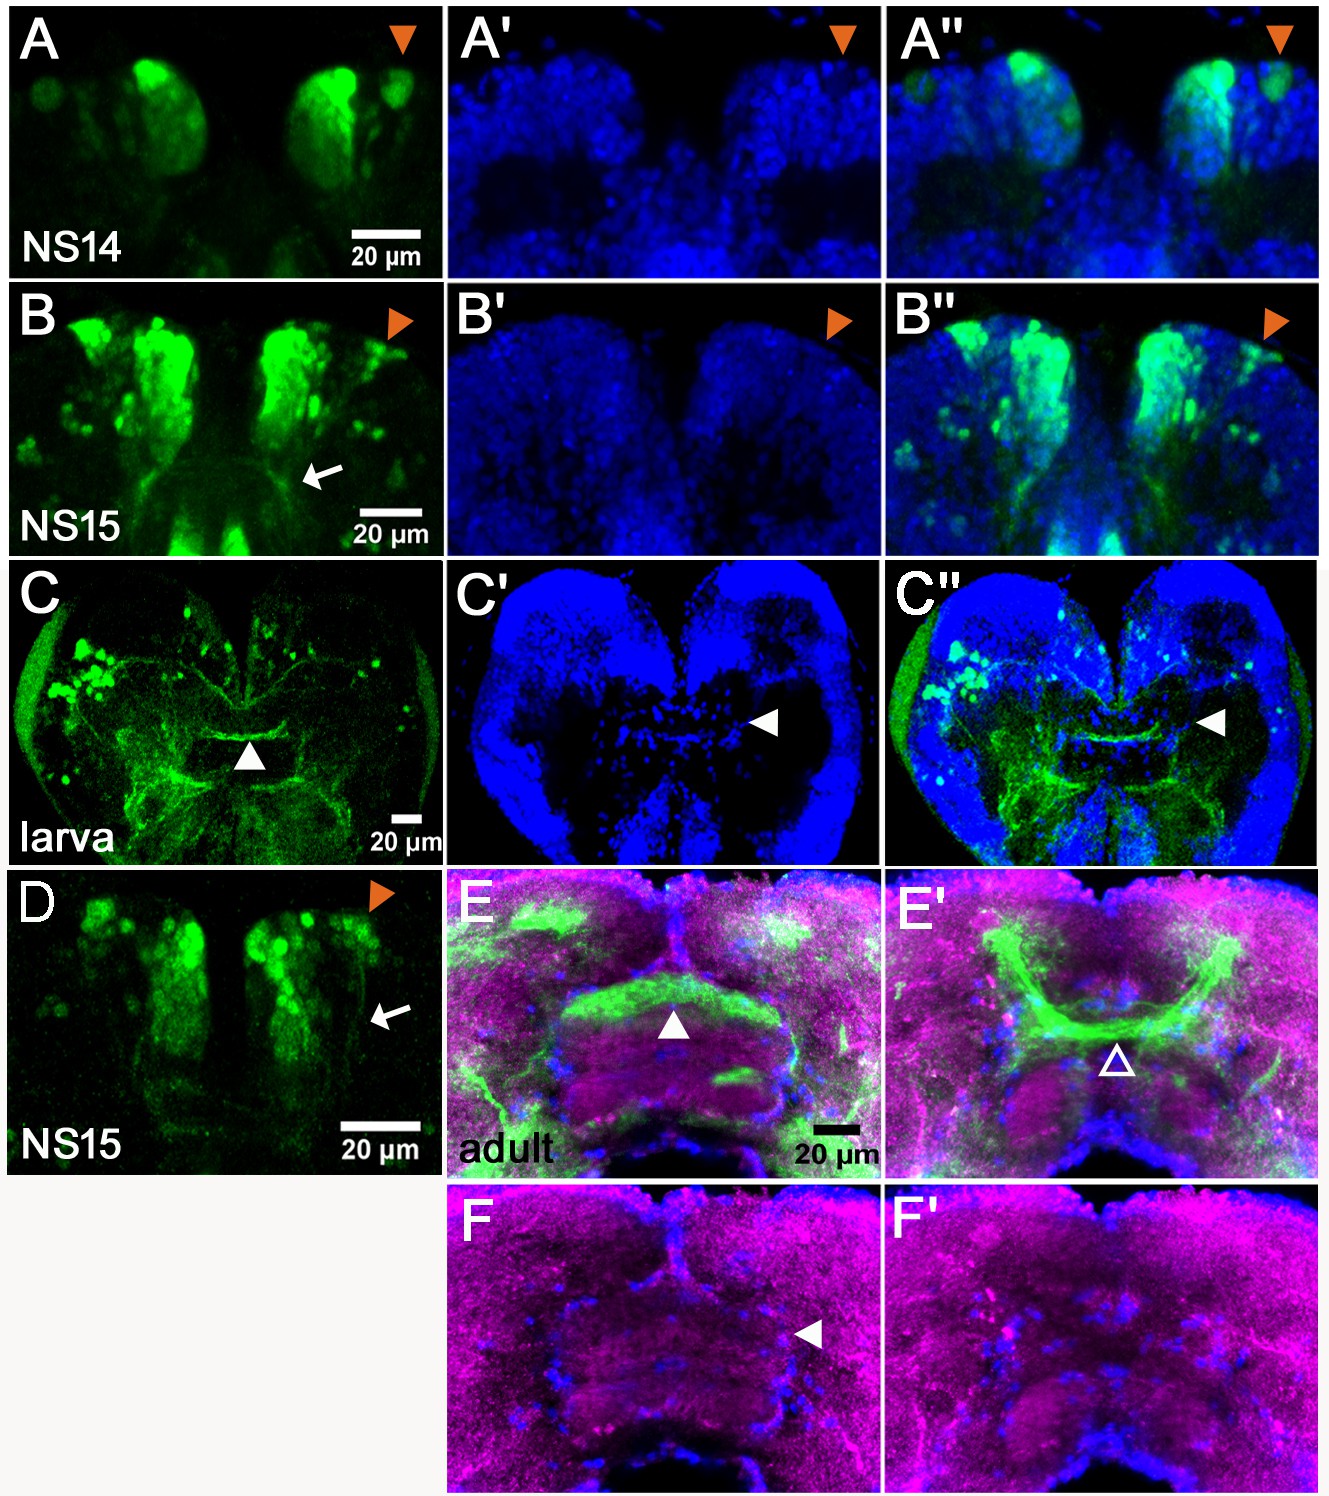
A second group of EGFP positive cells emerged laterally to that cluster after NS13 (anterior-lateral-foxQ2-lineage). At NS14 one NPC and a very small group of cells (6-8) were marked by EGFP (n = 4; orange arrowhead in Figure 5A; Supplementary file 1-table 6). At NS15 approximately 15–20 cells were marked (n = 4; Supplementary file 1-table 6). They formed a column-like cluster lateral to the anterior-median-foxQ2-cluster (orange arrowheads in Figure 5B,D) and their projections joined the established Tc-foxQ2 positive neurites at a lateral position (white arrows in Figure 5B,D). Because this cluster contained only one NB and all cells were within one glia sheath (orange arrowhead in Figure 4—figure supplement 1) we hypothesize that they form one neural lineage. By tracing back this lineage to the embryonic ectoderm we found that it most likely derived from the P-fox-l NPC (Figure 2I’).
Figure 5 with 2 supplements see all
Tc-foxQ2 positive cells project through the central brain primordium and contribute to the central complex.
Immunohistochemistry visualizes EGFP (green) derived from the foxQ2-5’-line. Synapsin visualizes adult brain morphology (magenta in E,F) while nuclei are visualized by DAPI (blue in A’-C’’). (A–A’’) At NS14, the anterior-lateral-foxQ2-cluster consists of one NPC and a small number of progeny (orange arrowheads). (B–B’’, D) At NS15, more cells are marked by EGFP (orange arrowheads) and their projections join a Tc-foxQ2 positive axon bundle (white arrows in B, (D). (C–C’’) EGFP marked projections contribute to the central body in L5 larval brain, which is visualized by its surrounding glia cells (white arrowhead in C’). (E–F) EGFP marked projections contribute to the upper unit of the central body in the adult brain (white arrowhead in E) visualized by synapsin and surrounding glia (white arrowhead in F). (E’–F’) Another fascicle projects across the midline directly posterior of the central body (open arrowhead).
The lineages of anterior median NBs are known to contribute to the CX in other insects (Boone and Doe, 2008; Bowman et al., 2008; Boyan et al., 2010; Walsh and Doe, 2017). We showed that some NPCs are Tc-foxQ2 positive and after RNAi-knock-down of Tc-foxQ2, the CX is disturbed (Kitzmann et al., 2017). Therefore, we hypothesized that the Tc-foxQ2 might mark cells contributing to the CX. In order to test this we analyzed larval (L5) and adult brains, where the CB is marked by a glia sheet (white arrowheads in Figure 5C’, F). Indeed, EGFP marked projections contributed to the upper division (fan shaped body) of the CB (white arrowheads in Figure 5C,E) while another fascicle crossed the midline directly dorsal of the CB (dorsal with respect to neuraxis; open arrowhead in Figure 5E’).
In summary, we found that Tc-foxQ2 positive cells formed three cell clusters in the protocerebrum that projected through the early brain commissure. Later, they marked specific subsets of midline fascicles of the developing central brain and eventually contributed to the upper unit of the CB and to subsets of brain commissures.
Some additional Tc-foxQ2+ cells merit mentioning although they were not neural or did not contribute to the central brain. Firstly, cells of the stomodeum except for the dorsal roof were marked at all stages (Figure 3 and white arrowheads in Figure 5—figure supplement 1). The domain appeared to be continuous with an expression in the lateral parts of the labrum from stage NS14 onwards (open arrowheads in Figure 5—figure supplement 1). Secondly, several Tc-foxQ2+ cells lateral to the stomodeum were observed at NS13 (open arrowhead in Figure 5—figure supplement 2A). From NS14 onwards they had expanded to a group of cells adjacent to the stomodeum, which sent projections into the posterior circumesophageal commissure (open arrowhead in Figure 5—figure supplement 2B). Thirdly, about 12 weakly stained cells were closely attached to the developing commissure at the midline (n = 5; star in Figure 4A’). These cells were Tc-FoxQ2 protein negative at NS13 but could have retained EGFP signal from median cells marked at a previous stage (e.g. dorsal to the stomodeum at NS6; see Figure 3B’).
In vivo imaging reveals complex morphogenetic movements of the developing brain
In order to confirm our view on the morphogenetic behavior of the marked cell clusters we used light-sheet based fluorescence microscopy for in vivo imaging (Strobl et al., 2015). We imaged a cross of the foxQ2-5’-line with the AGOC #6 reporter, which marks glia cells via the 3XP3 promoter (Koniszewski et al., 2016; Strobl et al., 2018). Three prominent morphogenetic movements were revealed: Initially, both brain and stomodeum EGFP signals started out in close vicinity at the dorsal side (Figure 6A white arrowhead and white arrow, respectively, Video 1). Shortly later, the stomodeum became elongated and bent away towards the ventral side such that the initially adjacent expression domains came to lie on opposite sides of the brain (Figure 6B–C). At the same time a second movement was observed, where the bilateral Tc-foxQ2+ cell clusters converged from lateral positions towards the midline until they made contact at the medial brain (white arrowheads in Figure 6E–J, Video 2). The third movement consisted of an overall ventral bending of the head and brain where the relative positions of the expression domains remained similar (compare white lines in Figure 6C and D). These movements reflected the movements described by the ‘bend and zipper’ model of head development (Figure 6K–N) (Posnien and Bucher, 2010; Posnien et al., 2010). Both the anterior-median-foxQ2-cluster (white arrowheads in Figure 6E–J) and the anterior-lateral-foxQ2-lineage (orange arrowheads) could be followed throughout development confirming our results in fixed specimen. The full datasets and metadata are available at Zenodo (see Materials and methods).
Figure 6
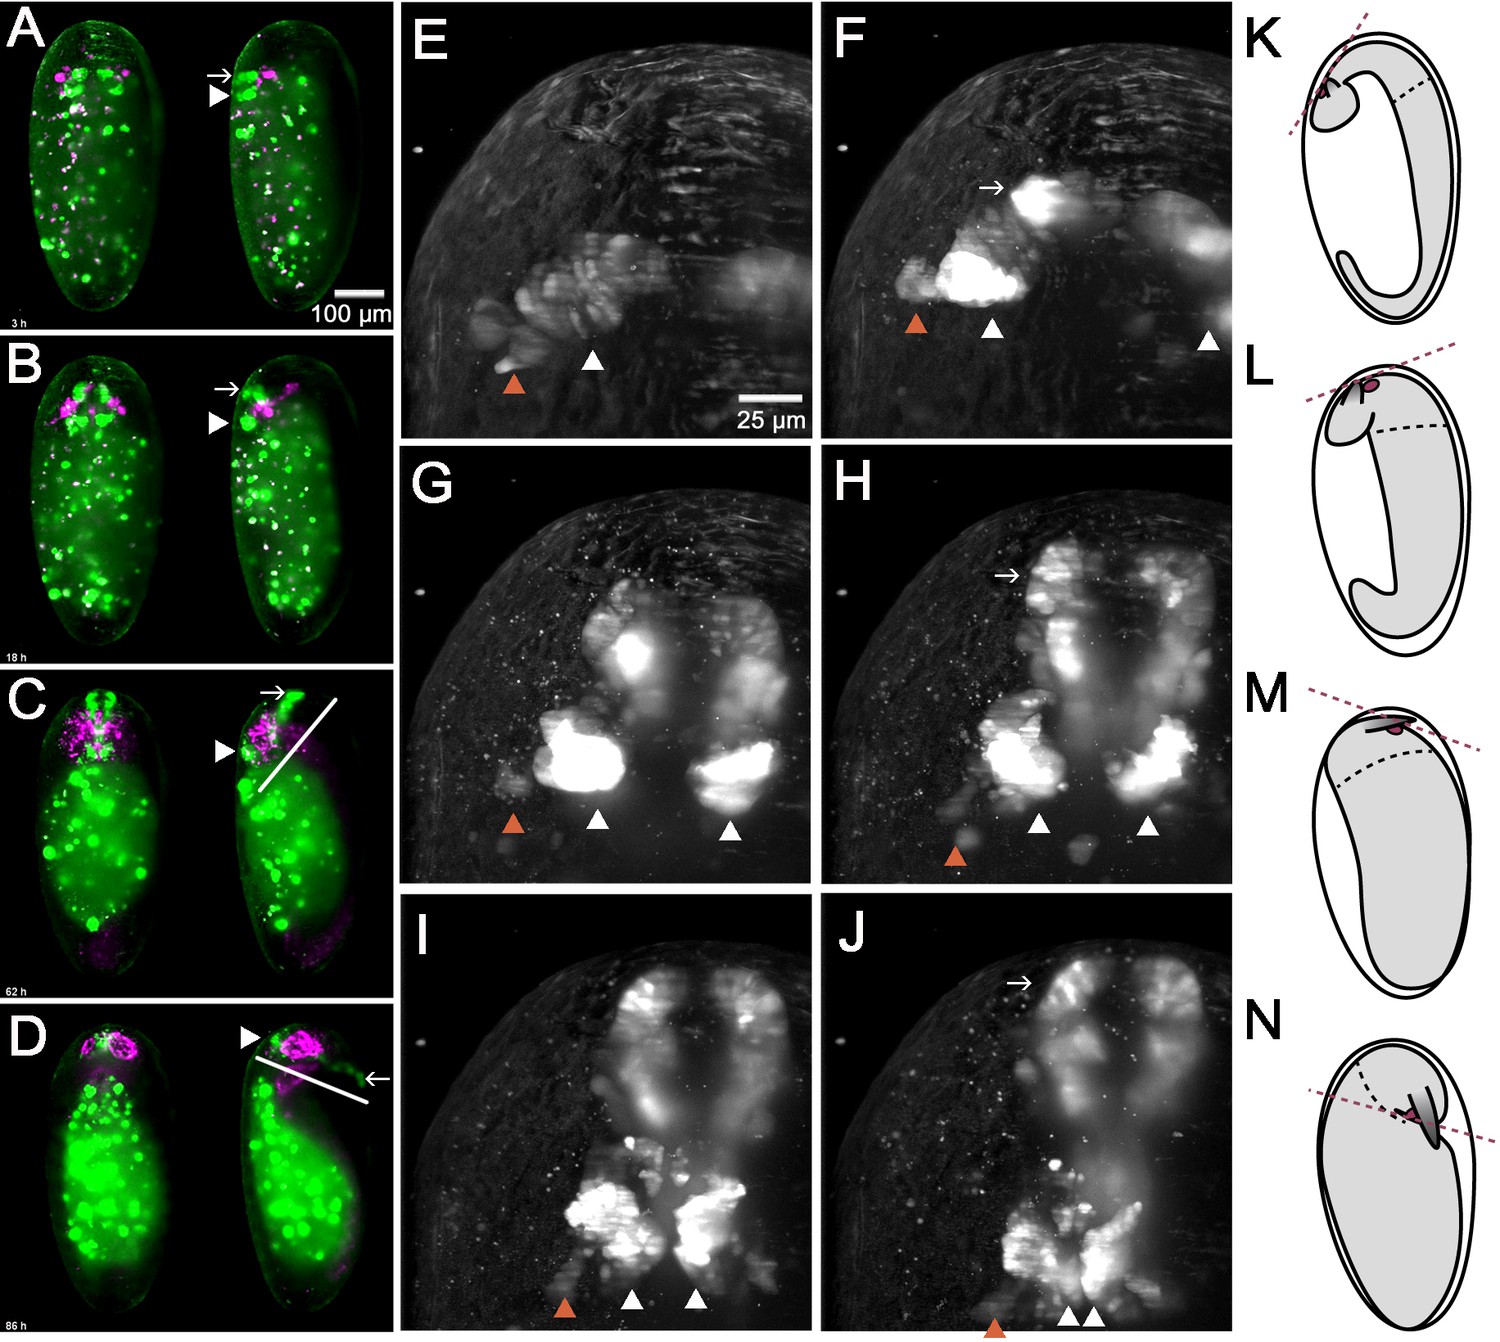
In vivo imaging reveals morphogenetic movements during brain development.
A cross of the foxQ2-5’-line (green) with the AGOC #6 glia reporter line (magenta) was imaged. (A–D) Shown are dorsal views (left specimen) and lateral views with dorsal to the left (right specimen) (A) EGFP signals in brain and stomodeum start out at the dorsal side (white arrowhead and white arrow, respectively). (B–C) Later, the stomodeum becomes elongated and bends away towards the ventral side. (C–D) An overall ventral bending of the head and brain follows, where the relative positions within the head remain similar (compare white lines in C and D). (E–J) Shown is one specimen from the dorsal side with anterior to the top. At the same time, the bilateral Tc-foxQ2 positive cell clusters approach each other towards the midline (white arrowheads). Both the anterior-median-foxQ2-cluster (white arrowheads in E-J) and the anterior-lateral-foxQ2-cluster (orange arrowheads in E-J) can be distinguished throughout development. Note that a small group of marked cells detach from the cluster and fuse at the midline. However, these cells are not Tc-FoxQ2 positive and are, hence, not further considered. (K–N) The overall morphogenetic movements of embryos aredepicted schematically with the embryo highlighted in gray. Marked are the stomodeum (red circle) and the antennae. The black hatched line marks the boundary between thorax and head segments while the red hatched line indicates the plane to which the mouth opens. The embryos are redrawn from Strobl and Stelzer (2014) and do not exactly match the stages shown in A-D.
Arrest of central brain formation in Tc-foxQ2 RNAi embryos
Development of the protocerebral brain commissures starts with the midline crossing of the primary commissure pioneer neurons. By subsequent joining of additional neurites from the DM1-4 and other lineages one compact commissure develops. This primary brain commissure later splits and expands into the mature brain commissure, which consists of many midline crossing fascicles (Boyan et al., 1993; Therianos et al., 1995; Williams and Boyan, 2008). Subsequently, formation of the CB by de- and re-fasciculation of axon tracts from a subset of these commissures occurs in grasshopper and Drosophila (Boyan et al., 2017). Given the contribution of Tc-foxQ2+ cells to the primary commissure and other midline spanning structures, we asked whether it was required for splitting of the primary brain commissure. In order to test this, we knocked down Tc-foxQ2 function by RNAi and stained the knock-down embryos with acetylated tubulin (acTub). We found that the primary brain commissure formed but was slightly irregular at NS13 (compare white arrowheads in Figure 7A and B). This was in line with our finding that Tc-foxQ2 positive neurons do not pioneer the commissure but project into it shortly after its formation. Some anterior aberrations stemmed from the previously described loss of the labrum (white arrows in Figure 7A,B) (Kitzmann et al., 2017). In wildtype NS15 embryos, the brain primordium had increased in size by additional fascicles, the primary commissure had split and first chiasmata had formed (white arrowhead in Figure 7C). Strikingly, this process was not observed in Tc-foxQ2 RNAi animals with strong phenotype. Here, the primary commissure remained compact without signs of splitting (white arrowhead in Figure 7D). As a consequence, the brain neuropil remained extremely narrow (compare the space between the cell bodies in Figure 7C’ and D’, open arrowheads). Lateral to the central body, the basic architecture of fascicles emanating from the commissure was mostly intact (e.g. the formation of three main branches emanating from the central brain (arrows in Figure 7D)) although it appeared to be built by fewer neurons. Indeed, the number of neurons marked in two imaging lines was reduced (see below). As a consequence, the lateral neuropil area was reduced as well (open arrowheads in Figure 7D’, E’). In weak phenotypes, commissure splitting had occurred to some degree but the arrangement of fascicles was clearly abnormal (white arrowhead in Figure 7E). In summary, Tc-foxQ2 function is essential for splitting of the brain commissure and for the expansion of the protocerebral neuropil, which together constitute the central brain anlagen. As a consequence, CB development was abolished. Hence, crucial steps of protocerebrum specific features depend on Tc-foxQ2 function.
Figure 7
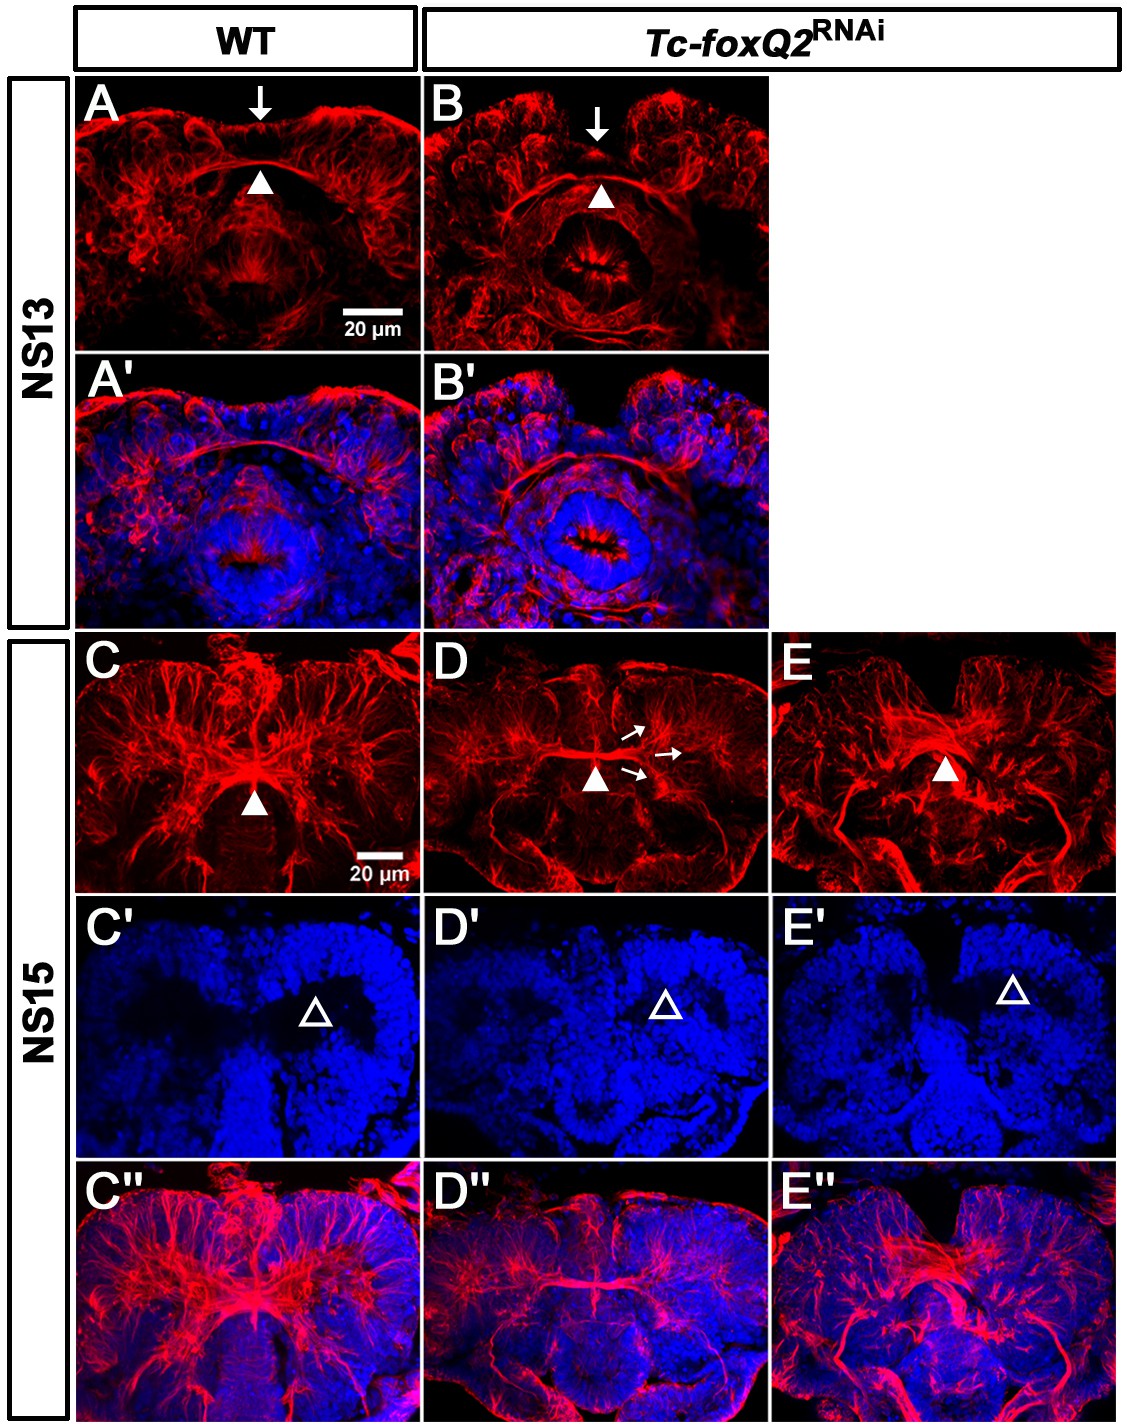
Loss of Tc-foxQ2 function leads to arrest of development of brain midline structures in the embryo.
Axonal projections are marked by acTub (red) and cell bodies are visualized by DAPI (blue). (A, A’) In WT, the primary brain commissure forms at NS13 (white arrowhead in A). (B, B’) In RNAi embryos, the primary brain commissure is slightly irregular (white arrowhead in B). The anterior epidermal aberrations reflect the loss of the labrum (compare white arrows in A and B; Kitzmann et al., 2017). (C–C’’) In WT NS15 embryo, the central brain primordium increases in size and contains more fascicles, some of which form chiasmata at the midline (white arrowhead in C). (D–D’’) In strong phenotypes, the primary commissure remains detectable along with three main branches (arrows in D). However, the structures do not expand and commissure splitting does not occur. At the same time, the brain neuropil volume is strongly reduced (compare black space between the cell bodies in C’ and D’, open arrowheads (arrows in D). (E–E’’). Weak phenotypes show some degree of splitting of the brain commissure but axonal projections are disarranged (white arrowhead in E).
Analyses in novel brain imaging lines reveal a role for Tc-foxQ2 for different lineages
We wondered, in how far different neural lineages would be affected by Tc-foxQ2 knock-down. To that end, we established two novel transgenic imaging lines that mark subsets of neurons. E035004 is an enhancer trap line generated in the GEKU screen (Trauner et al., 2009). We found that the insertion was intragenic in the Tribolium Teneurin-a locus (Ten-a; TC032747; Drosophila synonym: Tenascin accessory; CG42338). The EGFP signal overlapped with the cross-reacting Drosophila anti-Ten-a antibody staining (Fascetti and Baumgartner, 2002). In Tribolium embryos, the first midline crossing fascicle was marked while later several fascicles interconnecting the two brain lobes were Ten-a positive (Figure 8—figure supplement 1), which is similar to Drosophila (Fascetti and Baumgartner, 2002). We call this line Ten-a-green. In wildtype NS15 embryos three groups of cells were marked. The anterior group contained approximately 39 cells (n = 4; white circle in Figure 8A; Supplementary file 1-table 7), the posterior-lateral group around 32 cells (n = 4; open arrowhead in Figure 8A; Supplementary file 1-table 7) and the posterior-median group comprised about 27 cells (n = 4; dashed circle in Figure 8A; Supplementary file 1-table 7). Importantly for this work, the line marked the central brain primordium. Two Ten-a positive fascicles projected across the midline (white arrow in Figure 8A marks one of them). These fascicles represented a subset of the acTub positive commissures (compare to Figure 8A’). Among other patterns circumesophageal projections were found.
Figure 8 with 1 supplement see all
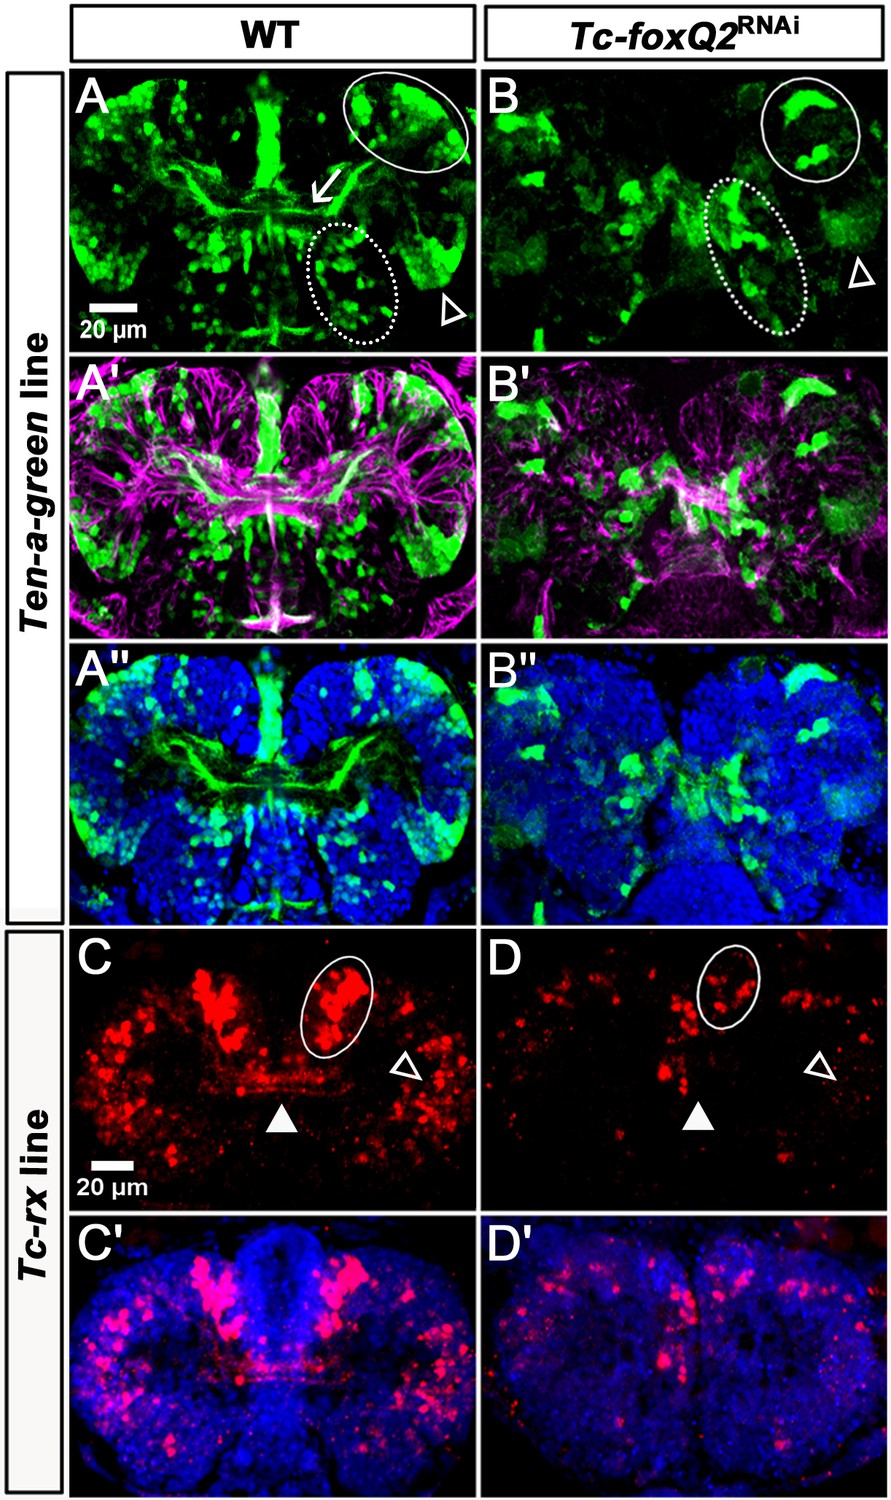
Loss of Tc-foxQ2 function in novel imaging lines confirms the midline phenotype.
(A–A’’) In WT Ten-a-green embryos, three groups of cells are marked by EGFP: An anterior group (white circle), a posterior-lateral group (open arrowhead) and a posterior-median group (dashed circle). The central brain primordium is marked with Ten-a positive fascicles projecting across the midline (white arrow in A). (B–B’’) In Tc-foxQ2 RNAi, the Ten-a positive projections and the number of the marked cells is reduced (n = 4). (C–C’) In WT Tc-rx-5’-up line, the anterior median group of cells marked by DsRed project into the central brain (white circle and white arrowhead). (D–D’) In Tc-foxQ2 RNAi, the cell number in the anterior median group is strongly reduced (n = 6; white circle) and the marked brain commissures are absent (white arrowhead). The peripheral cells are reduced in number as well (n = 6; compare open arrowheads in C,D).
In Tc-foxQ2 RNAi embryos at NS15, the Ten-a positive commissure was highly reduced while the circumesophageal projection was still found. The cell clusters were still discernable but the number of the cells was reduced by half (Figure 8B; Supplementary file 1-table 7).
Next we generated an enhancer construct by fusing the upstream regulatory region of Tc-rx to dsRedexpress (rx-5’-up line; see Supplementary Materials and methods for details). This line marked an anterior median group of cells, which projected into the central brain (white circle and arrowhead in Figure 8C). In addition, a number of peripheral cells without projections into the central brain was marked (open arrowhead in Figure 8C). A subset of the marked cells was Tc-Rx positive but a significant number was not (see Supplementary Materials and methods and Figure 8—figure supplement 1). Knock-down of Tc-foxQ2 led to a strong decrease of median cell number at NS15 to about 25% of wildtype (n = 6; Supplementary file 1-table 8) and to the complete loss of the marked brain commissures (white circle and arrowhead in Figure 8D). The number of peripheral marked cells was reduced as well. In summary, Tc-foxQ2 knock-down in our imaging lines confirmed the phenotype found in our acTub staining and showed that different neural lineages were affected.
Tc-foxQ2 function is required for survival of neural cells
Finally, we asked in how far EGFP expression of the foxQ2-5’-line would be affected by knocking down Tc-foxQ2. Indeed, at NS13 we found strongly reduced number of cells (less than half; n = 4; Supplementary file 1-table 9) in the anterior-median-foxQ2-cluster (white arrowheads in Figure 9A,B) while the anterior-lateral-foxQ2-lineage was either absent or fused to the other cluster. The cells close to the stomodeum were lost completely (not shown). The stomodeal expression, in contrast, appeared unaffected (stars in Figure 9A,B). At NS15 the number of neural cells remained less than half of wildtype (n = 4; Supplementary file 1-table 9) but the remaining cells always formed connections across the midline. However, these fascicles were thinner and followed an abnormal rounded path instead of the straight line found in wildtype (compare white arrows in Figure 9E and F). These data indicated that Tc-foxQ2 was required for either survival or specification of neural cells and that upon RNAi these cells were lost or changed their identity. Indeed, increased cell death had been observed after Tc-foxQ2 RNAi at NS13 (Kitzmann et al., 2017). The reduced number of Tc-foxQ2+ cells was likely the reason for the thinner commissure while its altered path might be a secondary effect due to general misspecification in the central brain after Tc-foxQ2 RNAi (see below). The reduction of cell number could be due to apoptosis after misspecification of cells due to lack of Tc-foxQ2. Alternatively, Tc-foxQ2 could be involved in an autoregulatory loop, which would lead to EGFP reduction in an RNAi background.
Figure 9

RNAi in the foxQ2-5’-line indicates self-regulation.
(A–B’) At NS13, Tc-foxQ2 RNAi shows the strongly reduced number of marked cells in the anterior-median-foxQ2-cluster (n = 4; white arrowheads) while the signal in the stomodeum appears to be unaffected (stars). (C–F’) In Tc-foxQ2 RNAi, the number of marked cells decreased significantly (n = 4; white arrowhead). The fascicles are reduced and follow an abnormal rounded path instead of the straight line in WT (compare white arrows in E and F). Legends figure supplements.
Discussion
Does Tc-foxQ2 mark neuroblasts of both type I and II?
Our data is in line with the hypothesis that type I and type II neuroblasts are present in Tribolium and that both types of lineages express Tc-foxQ2. Type II neuroblasts were discovered and described recently in Drosophila (Boone and Doe, 2008; Bowman et al., 2008; Izergina et al., 2009) and subsequently, lineages with similar properties were described in the grasshopper Schistocerca gregaria, which represents the basal hemimetabolan clade of insects (Boyan et al., 2010). Therefore, we assume that both types of neuroblasts exist in Tribolium as well although this remains to be shown. Type I NBs divide asymmetrically to form ganglion mother cells, which divide once more to form two postmitotic neural cells (Technau et al., 2006). All neuroblasts of the ventral nerve cord and most neuroblasts of the brain belong to the type I. Type II neuroblasts, in contrast, give rise to intermediate neural progenitors (INPs), which themselves divide in a stem cell-like fashion to form ganglion mother cells (GMCs) (Boone and Doe, 2008; Bowman et al., 2008; Boyan et al., 2010). This division mode leads to an increased number of cells stemming from one neuroblast. Interestingly, most of the columnar neurons of the central complex derive from type II neural lineages (Boyan et al., 2010; Pereanu et al., 2011; Walsh and Doe, 2017). Unfortunately, molecular markers for reliably distinguishing type I from type II neuroblasts remain to be established in insects outside Drosophila. Nevertheless, we suggest that Tc-foxQ2 marks both types of neuroblasts. The anterior-lateral-foxQ2-lineage might be a type I lineage. First, it is located in a lateral region in the neuroectoderm while type II neuroblasts were found in the anterior median brain in other insects (Boyan and Williams, 2011; Walsh and Doe, 2017). Second, within this cluster we see only one Tc-ase marked cell with neuroblast typical morphology throughout several stages of development and the cluster eventually comprises a moderate number of neurons (15-20), which is in the range typical of type I NBs. Finally, this group of cells is surrounded by one glial sheet, which is indicative for neural lineages (Younossi-Hartenstein et al., 1996). Using both the location and Tc-ase staining pattern as criteria, we assume that this type I lineage might derive from the P-fox-l neuroblast (number 3 in Figure 2I’).
The anterior-median-foxQ2-cluster, by contrast, is likely built by one or more type II neuroblasts. First, the number of Tc-ase positive cells in that region decreased over time (P-fox-am and P-fox-amp in Figure 2). This would be rather unusual for neuroblasts but would be expected for INPs and GMCs of a type II lineage, which express asense as well (Álvarez and Díaz-Benjumea, 2018; Walsh and Doe, 2017). Further, the number of Tc-foxQ2 positive neurons within the single glia niche was much larger (>200 cells), which would be in line with type II mode of division. Moreover, the projection patterns into the CX are reminiscent of the one found in embryonic type II neuroblast lineages in Drosophila (Álvarez and Díaz-Benjumea, 2018). However, we were not able to unequivocally show a contribution of Tc-foxQ2 positive cells to the WXYZ tracts, which were described for DM1-4 type II lineages in Drosophila and Schistocerca (Boyan and Reichert, 2011). Hence, this hypothesis needs to be further tested once reliable markers for type II neuroblasts are developed. It would be intriguing to find one regulatory gene contributing to the specification of different types of neuroblasts, which both contribute to the central complex.
The ventrally located group of Tc-foxQ2 positive NPCs probably contributed to a cell cluster close to the stomodeum, which projected into the circumesophageal commissure but not to the central brain (Figure 5—figure supplement 2). Due to our focus on central brain development, we did not study this group in detail.
How does Tc-foxQ2 function in CX development?
Tc-foxQ2 positive cells are contributing to the CX and Tc-foxQ2 is essential for its development. The contribution could affect several stages of CX development. First, the effect could be a consequence of the failure of commissural splitting. In normal development, the primary brain commissure splits into several fascicles, which is the prerequisite for subsequent central body formation. Some neurites undergo fascicle switching, that is they leave their commissure (de-fasciculation) and bridge to another commissure, which they join (re-fasciculation). As consequence, these neurites form X-shaped crossings prefiguring the columns of the central body (Boyan and Williams, 2011; Boyan et al., 2008; Boyan et al., 2017). In the absence of commissural splitting, this process and central body formation cannot take place. A putative second contribution of Tc-foxQ2 could be to specify the points of fascicle switching. In the late embryonic brain, Tc-foxQ2 marks commissures that are located in the region where this process will occur. In this model, Tc-foxQ2 positive neurites could either be the ones that de-fasciculate or they could be required to provide the signal for other neurites to do so. Indeed, we find Tc-foxQ2 positive fascicles closely associated with the larval central body. Due to the arrest of development after the first phenotype, the subsequent processes cannot be observed and remain to be tested. Scrutinizing the development of individual Tc-foxQ2 positive cells would be helpful. Actually, we have designed our enhancer trap line to expresses Cre along with EGFP. Therefore, once a transgenic Tribolium line with a functional brainbow construct is developed, single neurons within the Tc-foxQ2 positive clusters can be traced (Livet et al., 2007).
Making the protocerebrum different from segmental ganglia
Our results show that Tc-foxQ2 is one of the regulatory genes required for the development of structures that distinguish the protocerebrum from segmental ganglia. Specifically, it is involved in the unique development of the brain commissures and the midline spanning neuropils of the central complex. We found several protocerebrum-specific functions. First, Tc-foxQ2 is expressed in neural progenitors of the protocerebrum but not in the more posterior ganglia. Hence, Tc-foxQ2 has indeed the potential of contributing to developmental programs that are specific to this brain part. Therefore, this gene adds to the list of co-expressed genes assumed to specify NB identity in the Drosophila brain (Urbach and Technau, 2003a). A second protocerebrum-specific role is the contribution of Tc-foxQ2 positive neurons to the CX, which is a strictly protocerebral neuropil. Third, Tc-foxQ2 positive neurons mark subsets of axons within the early brain commissure ending up in different commissural fascicles after the split of the primary commissure.
Evolutionary relationship of apical organ and the central complex
foxQ2 together with six3 and other genes are part of the anterior gene regulatory network (aGRN) in animals and they contribute to the development of anterior-most neural structures. Specifically, they are involved in patterning the apical organ/apical tuft including serotonergic and neurosecretory cells in marine larvae, cnidarians, annelids and sea urchins (Leclère et al., 2016; Marlow et al., 2014; Yaguchi et al., 2008). However, apical organs are usually lost during metamorphosis and clear morphological homologs were not found in neither insects nor vertebrates (Nielsen, 2005). However, correlation of the aGRN with neuroendocrine cells was found in animals of all phyla including arthropods (Hunnekuhl and Akam, 2014; Oliver et al., 1995; Posnien et al., 2011b; Steinmetz et al., 2010). It has been proposed, that this aGRN derives from an ancestral apical brain (with neuroendocrine and non-visual light detection functions), which fused with a more posterior blastoporal brain (with sensory-contractile function) to form the ‘chimeric’ anterior brain of bilaterians (Tosches and Arendt, 2013). Unfortunately, the lack of a clear apical organ homolog in insects has hampered the comparison of the respective brain parts based on morphology. Hence, molecular similarity has to be interrogated instead for such analyses. Indeed, it was found before that six3 and rx are required for the formation of central brain structures with respect to the expected neuroendocrine cells but also for other protocerebral structures like mushroom bodies and central complex (Davis et al., 2003; de Velasco et al., 2007; Eggert et al., 1998; Kraft et al., 2016; Kunz et al., 2012; Posnien et al., 2011b; Steinmetz et al., 2010). The role of Tc-six3 and Tc-foxQ2 in Tribolium brain development had been noted but a detailed analysis of the respective brain phenotypes had not been performed and importantly, the projection patterns of these cells had not been studied in any insect (Kitzmann et al., 2017; Posnien et al., 2011b).
In this work we used Tc-foxQ2 as a very specific marker for a subset of cells deriving from the aGRN region (Kitzmann et al., 2017). Based on its limited and highly conserved expression throughout bilaterian and its functional interconnection with six3, foxQ2 is likely to represent a specific marker for the hypothetical apical brain. As expected, the cell bodies of Tc-foxQ2 positive cells are located in the pars intercerebralis, which is one of the neuroendocrine parts of the brain, being marked by six3 expression (Steinmetz et al., 2010). Hence, this is another piece of evidence supporting the ancestral neuroendocrine function of the apical region. Unexpectedly, our data revealed for the first time a contribution of these cells to the brain commissure and to the CX. These represent important non-neuroendocrine structures required for motor control, which would be indicative for an origin from the suggested blastoporal brain with its sensory-contractile origin (Tosches and Arendt, 2013). This was unexpected given that cells derived from the apical brain were thought to be mainly involved in neuroendocrine control and non-visual photoperception.
There are two evolutionary scenarios for the involvement of an apical neural cell to motor control. The chimeric brain hypothesis states that apical and the anterior part of the blastoporal brain fused to form the anterior brain of bilaterians. In the light of this hypothesis, these cells could represent the predicted chimeric cells combining features from both the neuroendocrine apical brain and the motor control function of the blastoporal brain (Tosches and Arendt, 2013).
Alternatively, this result could indicate that foxQ2 positive cells evolved novel functions after the apical organ became reduced in the lineage leading to arthropods. In this model, the reduction of the apical organ made the foxQ2 positive cells free to evolve and they integrated into the evolving CX. Actually, a canonical CX is found only in crustaceans while homology of brain midline structures of other arthropods with the CX remain equivocal (Hanström, 1928; Holmgren, 1916; Loesel et al., 2002; Loesel et al., 2011; Strausfeld, 2012). A contribution of the apical organ to brain development has been suggested in the annelid Platynereis dumerilii, where the apical organ may provide an initial scaffold for the developing anterior brain (Marlow et al., 2014). In the millipede Strigamia maritima, foxQ2 positive cells located at the brain midline build an early axonal scaffold forming a midline brain structure from which longitudinal tracts project bilaterally into the trunk (Hunnekuhl and Akam, 2014). Based on these findings, we suggest a model, where in a bilaterian arthropod ancestor the apical organ provided a scaffold for subsequent neural development of the anterior brain. In basal arthropods like myriapods, the initially simple midline structure with contribution from the apical organ expanded to form a prominent midline structure, which was still of low complexity. The respective neurons provided a more prominent scaffold for subsequent neural development. In crustaceans, this simple architecture was further developed to build a more elaborate CX, which in stomatopods and insects reached its most complex realization (Thoen et al., 2017). A comparison of the molecular signatures of foxQ2 positive cells in animals might be helpful to trace back their evolutionary trajectories.
Outlook
foxQ2 is one of several genes with an almost exclusive anterior expression in animals. We show its crucial contribution to protocerebrum-specific development. Based on this, it seems imperative that other highly conserved and protocerebrum-specific genes be considered when investigating brain development (e.g. rx, six3, chx, fez1, etc.; Kitzmann et al., 2017; Posnien et al., 2011b). An approach focusing on genes known from the ventral nerve cord might fall short of important insights. Given the rather exclusive contribution of foxQ2 positive neurons, it will be important to determine their individual projection patterns in both Drosophila and Tribolium in order to map them with identified neurons from existing resources and to determine the degree of conservation. Importantly, our concept of genetic neural lineages turned out to work quite well and opens the way for comparative studies (Koniszewski et al., 2016). As a basis it will be necessary to systematically compare cell types and markers between Drosophila and other insects in order to ascertain that orthologous genes mark homologous cell types. Finally, the evolution of foxQ2 positive neurons provide an interesting study case for neural evolution: From a role in patterning a rather simple structure, the apical organ, they expanded their role in arthropods contributing to one of the most intricate insect brain structures. On the other hand, foxQ2 was lost in amphibians and mammalians, which is astonishing regarding the usually high degree of conservation of anterior regulators.
Materials and methods
Key resources table
| Reagent type (species) or resource | Designation | Source or reference | Identifiers | Additional information |
|---|---|---|---|---|
| Gene(Tribolium castaneum) | foxQ2 | iBeetle-Base http://ibeetle-base.uni-goettingen.de/ | TC004761 | Drosophila Ortholog: fd102, CG11152 |
| Strain, strain background (Tribolium castaneum) | San Bernardino | SB | NCBI:txid7070 | |
| Strain, strain background (Tribolium castaneum) | vermillionwhite | vw | NCBI:txid7070 for transgenesis, mutant eye color (white) is rescued to black by 3XP3-vw | |
| Genetic reagent (Tribolium castaneum) | foxQ2-5’-line | this publication | marks Tc-foxQ2 positive cells with EGFP; maintained by Bucher-Lab | |
| Genetic reagent (Tribolium castaneum) | Ten-a-green-line | this publication | marks Ten-a positive cells with EGFP; maintained by Bucher-Lab | |
| Genetic reagent (Tribolium castaneum) | rx-5’-up-line | this publication | marks a subset of Tc-rx positive cells with dsRedexpress; maintained by Bucher-Lab | |
| Recombinant DNA reagent | [3xP3:Tc’v-SV40-Cre-2A-EGFP:bhsp68-eb] | this publication Addgene plasmid #124068 | repair template for NHEJ mediated enhancer traps in Tribolium castaneum EGFP and Cre under the control of the Tribolium core heat-shock promoter, which is not heat-shock responsive but takes up enhancer traps. | |
| Recombinant DNA reagent | bhsp68-Cas9 | Gilles et al., 2015 Addgene plasmid #65959 | Cas9 gene for co-injection | |
| Antibody | anti-GFP (chicken polyclonal) | Abcam | RRID:AB_300798 | 1:1000 |
| Antibody | anti-acetylated Tubulin (mouse monogclonal) | Sigma Aldrich | RRID:AB_609894 | 1:50 |
| Antibody | anti-SYNORF1 (synonym: anti synapsin) (mouse monoclonal) | DHSB Hybridoma Bank (University of Iowa) | RRID:AB_2313867 3C11 (DSHB ID) | 1:40 |
| Antibody | anti-RFP (rabbit polyclonal) | Abcam, ab62341 | RRID: AB_945213 | 1:1000 |
| Antibody | anti-Tenascin (Teneurin)-a (rabbit polyclonal) | Fascetti and Baumgartner, 2002 | 1:1000 | |
| Antibody | Secondary antibodies coupled with Alexa Fluor 488 or Alexa Fluor 555 (goat anti mouse or goat anti chicken, polyclonal) | Thermo Fisher Scientific Cat # A32723 Cat # A32727 Cat # A-11039 Cat # A-21437 | RRID:AB_2633275 RRID:AB_2633276 RRID:AB_142924 RRID:AB_2535858 | 1:1000. |
| Commercial assay or kit | MEGAscript T7 Transcription Kit | Thermo Fisher Scientific | production of dsRNA | |
| Sequence-based reagent | Tc-foxQ2RNAi_a-L | Kitzmann et al., 2017 | Primer for dsRNA template production: GAATTGTAATACGACTCAC TATAGGCTTACTTCAGGACCCGG | |
| Sequence-based reagent | Tc-foxQ2RNAi_a-R | Kitzmann et al., 2017 | Primer for dsRNA template production: GAATTGTAATACGACTCACTATAGGTCGCTTGTAACAATGCTTGA |
Animals
Tribolium castaneum NCBI:txid7070 animals were reared under standard conditions at 32°C. The San Bernadino (SB) wild-type strain was used for fluorescent in situ hybridization, antibody staining and RNAi experiments. The Tc-vermillionwhite (Tc-vw) strain (Lorenzen et al., 2002) was used for transgenesis.
Generation of a tc‐foxq2 polyclonal antibody
Request a detailed protocolThe C‐terminus (amino acids 202–286) was amplified from cDNA by PCR using primer pairs with BsaI restriction site forward and reverse (For primer sequences see Supplementary file 1-table 10) and cloned into pET SUMO vector generating a fusion protein with a His‐SUMO tag using golden gate cloning (modified from Thermo Fischer). The protein was expressed in BL21‐DE3 Rosetta cells at 37°C. Cells were fractionated (50 mM TRIS‐HCl pH 7.8, 500 mM NaCl, 10 mM Imidazole) using Fluidizer (mechanical lysis by high pressure‐80 psi). The protein was purified via Ni2+ chelate affinity chromatography using a gradient with 200 mM imidazole in lysis buffer. Dialysis (50 mM Tris‐HCl pH 7.8, 500 mM NaCl) and SUMO protease digestion for cleavage of the His‐SUMO tag were performed simultaneously overnight. The His‐SUMO tag was removed from the Tc-FoxQ2 via Re‐Ni2+ chelate affinity chromatography. Gel-filtration chromatography (Superdex G-30 Healthcare) was performed to remove the remaining contaminations and finally the purified Tc-FoxQ2 was stored in phosphate‐buffered saline (PBS). All the steps for purification were done at 4°C. Antibodies were produced in guinea pigs by Eurogentec (Liège, Belgium). The final serum was used straight as the Tc-FoxQ2 antibody with the dilution of 1:1000. Before antibody staining, pre-absorption of anti-FoxQ2 was performed for eliminating non-specific binding.
Generation of imaging lines and stocks
foxQ2-5’-line
Request a detailed protocolThe guide RNAs (gRNAs) were designed with the aid of the flyCRISPR Optimal Target Finder (http://tools.flycrispr.molbio.wisc.edu/targetFinder/; Gratz et al., 2014). The TriGenes gRNA oligo design tool was used for generating the sequences of the oligos to order. The annealed oligos were cloned into the gRNA expression vector p(TcU6b-BsaI) via the BsaI restriction sites. The detailed annealing and ligation are following the protocol described previously (Gilles et al., 2015). [3xP3:Tc’v-SV40-Cre-2A-EGFP:bhsp68-eb] was designed as a repair template for NHEJ-mediate knock-in by CRISPR/Cas9. For linearizing the plasmid, Dm-ebony target site (gRNA-eb) was cloned into this construct (Addgene plasmid # 124068). Each fragment of the construct was amplified by PCR from plasmids available in the laboratory’s plasmid library (Supplementary file 1-table 3) by using primers with overhangs that are complements of two adjacent fragments (Supplementary file 1-table 10). The 2A-peptide and the target sequences for cleavage were completely added by primers. Overlap extension PCR was performed to assemble all fragments together. In addition, an ApaI and a XbaI restriction sites were added in end primers for the following ligation. The entire construct was finally cloned into pJET1.2 vector. The helpler plasmid p(bhsp68-Cas9) expressing Cas9 was a gift from Michalis Averof (Addgene plasmid # 65959).
Embryonic injection was performed in Tc-vermillionwhite (Tc-vw) according to standard procedure (Berghammer et al., 1999; Schinko et al., 2012). Two gRNAs (gRNA1 and gRNA2) targeting the upstream region of Tc-foxQ2 together with the repair plasmid, Cas9 expression plasmid and gRNA-eb were injected. The final concentration of Cas9 plasmid and the repair plasmid is 500 ng/μl each, and gRNA is 125 ng/μl each. The injected animals were separated into male and female during pupal stage. Each animal was crossed to three Tc-vw wild type beetles of the opposite sex. The G1 offspring were screened for black eyes. The transgenic beetle was outcrossed with Tc-vw wild type and kept as a new stock.
rx-5’-up line
Request a detailed protocolThe regulatory region including the endogenous promoter sequence of the gene Tc-rx was amplified from genomic DNA by PCR using primer pairs with restriction sites BamHI and NheI (for primer sequences see Supplementary file 1-table 10) and cloned into the Dual Promoter pCRII vector by using the TA Cloning Kit (Invitrogen). The final construct was designed with the following sections from 5´ to 3´: (1) regulatory regions, (2) endogenous promoter, (3) reporter gene. The reporter gene DsRedExpress was amplified from the other construct by using according primers (Supplementary file 1-table 10). The construct was designed and created in the vector pslfa1180fa. Afterwards, the cassette [rx-5’up:DsRedEx-SV40] including the regulatory region, promoter, reporter gene, and SV40 was transferred into the piggyBac[3xP3:Tc’v-SV40]fa transformation vector by using the restriction enzymes AscI and FseI (New England BioLabs). Further steps and treatments for embryonic transgenesis were performed as described (Berghammer et al., 1999; Schinko et al., 2012).
RNAi
Request a detailed protocolBoth dsRNA fragment and parental injection was performed as in Kitzmann et al. (2017), where off target controls had been performed. The injected dsRNA concentrations were 1.5 µg/µl and 3.0 µg/µl. 250–300 pupae were injected and >50 offspring embryos were fixed and stained, respectively. In larval and adult experiments, we stained >5 brains. 4–6 brains were analyzed by LSM imaging. We only considered phenotypes that we saw in several independent specimen.
Immunhistochemistry and FISH
Request a detailed protocolImmunostaining of embryonic, larval and adult brains were performed according to the described protocol (Büscher et al., 2019; Hunnekuhl et al., 2019). FISH was performed using a horseradish peroxidase (POD) mediated tyramide signal amplification (TSA). Primary antibodies: chicken anti-GFP (1:1000, Abcam; RRID:AB_300798), mouse anti-acetylated Tubulin (1:50, Sigma; RRID:AB_609894), mouse anti-Synapsin (1:40, DHSB Hybridoma Bank; RRID:AB_2313867), rabbit anti-RFP (1:1000, Abcam; RRID: AB_945213), polyclonal rabbit anti-Tenascin (Teneurin)-a (Fascetti and Baumgartner, 2002). Secondary antibodies coupled with Alexa Fluor 488 or Alexa Fluor 555 (Thermo Fisher Scientific, RRID:AB_2633275 RRID:AB_2633276 RRID:AB_142924 RRID:AB_2535858) were used at 1:1000.
In vivo imaging
Request a detailed protocolLong-term live imaging was performed with digitally scanned laser light sheet-based fluorescence microscopy (DSLM, LSFM) as described previously for Tribolium (Strobl et al., 2015; Strobl et al., 2017). In brief, embryos were collected either (i) from a homozygous foxQ2-5’ culture or (ii) from two hybrid cultures that consisted either of homozygous foxQ2-5’ females mated with (mO-mC/mO-mC) homozygous AGOC #6 males or of (mO-mC/mO-mC) homozygous AGOC #6 females mated with homozygous foxQ2-5’ females. After one hour of collection at 25°C, embryos were incubated for 20 hr at 32°C. Sample preparation took approximately one hour at room temperature (23 ± 1°C), so that embryos were at the beginning of germband retraction. Embryos were recorded either (i) only along the dorsal axis or (ii) along the dorsal and lateral axis with an interval of 60 min. All shown embryos survived the imaging procedure, developed to healthy and fertile adults, and when mated either (i) with a homozygous foxQ2-5’ sibling or (ii) with a (mO-mC/mO-mC) homozygous AGOC #6 sibling, produced progeny that was also fertile. Each setup for imaging this process (both 40X and 10X) was done twice summing up to four independent documentations. Metadata of the three datasets is provided with the Zenodo dataset.
Image processing and documentation
Request a detailed protocolImmunohistochemistry and FISH were imaged using a ZEISS laser scanning microscope LSM510. Stacks were processed using ImageJ (v.1.47). Images were level-adjusted for brightness and contrast and assembled in Photoshop CS (Adobe). The stacks are available in both original Zeiss LSM format and as avi on figshare (https://figshare.com/account/home#/projects/62939).
Data availability
All LSM stacks can be downloaded from the figshare repository (https://figshare.com/projects/Additional_Data_for_He_et_al_foxQ2_is_required_for_protocerebrum_specific_brain_development_and_marks_cells_of_the_central_complex_in_the_beetle_Tribolium_castaneum_/62939). The construct used for generating the enhancer trap is available from AddGene (#124068). The in vivo imaging data is accessible at Zenodo (http://doi.org/10.5281/zenodo.2645645; http://doi.org/10.5281/zenodo.2645657; http://doi.org/10.5281/zenodo.2645665).
-
ZenodoIn vivo imaging of foxQ2 postitive neurons in the beetle Tribolium castaneum (10X).https://doi.org/10.5281/zenodo.2645645
-
ZenodoIn vivo imaging of foxQ2 postitive neurons in the beetle Tribolium castaneum (40X).https://doi.org/10.5281/zenodo.2645657
-
ZenodoIn vivo imaging of foxQ2 postitive neurons in the beetle Tribolium castaneum.https://doi.org/10.5281/zenodo.2645665
-
figshareAdditional Data for He et al. "foxQ2 is required for protocerebrum specific brain development and marks cells of the central complex in the beetle Tribolium castaneum".
References
-
Murine Otx1 and Drosophila otd genes share conserved genetic functions required in invertebrate and vertebrate brain developmentDevelopment 125:1691–1702.
-
The evolution of nervous system centralizationPhilosophical Transactions of the Royal Society B: Biological Sciences 363:1523–1528.https://doi.org/10.1098/rstb.2007.2242
-
Conservation and evolutionary modifications of neuroblast expression patterns in insectsDevelopmental Biology 388:103–116.https://doi.org/10.1016/j.ydbio.2014.01.028
-
Identification of Drosophila type II neuroblast lineages containing transit amplifying ganglion mother cellsDevelopmental Neurobiology 68:1185–1195.https://doi.org/10.1002/dneu.20648
-
Organization of the commissural fibers in the adult brain of the locustThe Journal of Comparative Neurology 332:358–377.https://doi.org/10.1002/cne.903320308
-
Fascicle switching generates a chiasmal neuroarchitecture in the embryonic central body of the grasshopper Schistocerca gregariaArthropod Structure & Development 37:539–544.https://doi.org/10.1016/j.asd.2008.07.005
-
A conserved plan for wiring up the fan-shaped body in the grasshopper and DrosophilaDevelopment Genes and Evolution 227:253–269.https://doi.org/10.1007/s00427-017-0587-2
-
Mechanisms for complexity in the brain: generating the insect central complexTrends in Neurosciences 34:247–257.https://doi.org/10.1016/j.tins.2011.02.002
-
Embryonic development of the insect central complex: insights from lineages in the grasshopper and DrosophilaArthropod Structure & Development 40:334–348.https://doi.org/10.1016/j.asd.2011.02.005
-
Parental RNAi in tribolium (Coleoptera)Current Biology 12:R85–R86.https://doi.org/10.1016/S0960-9822(02)00666-8
-
BookA protocol for double fluorescent in situ hybridization and immunohistochemistry for the study of embryonic brain development in Tribolium castaneumIn: Sprecher S. G, editors. Brain Development: Methods and Protocols. New York: Humana. pp. 219–232.https://doi.org/10.1007/978-1-4939-9732-9_12
-
Expanded and updated data and a query pipeline for iBeetle-BaseNucleic Acids Research 46:D831–D835.https://doi.org/10.1093/nar/gkx984
-
BookThe red flour beetle as model for comparative neural development: Genome editing to mark neural cells in Tribolium brain developmentIn: Sprecher S. G, editors. Brain Development: Methods and Protocols. New York: Springer. pp. 191–217.https://doi.org/10.1007/978-1-4939-9732-9_11
-
Expression of Drosophila Ten-a, a dimeric receptor during embryonic developmentMechanisms of Development 114:197–200.https://doi.org/10.1016/S0925-4773(02)00055-2
-
BookVergleichende Anatomie Des Nervensystems Der Wirbellosen Tiere Unter Berücksichtigung Seiner FunktionBerlin: Springer-Verlag.
-
The evolution of early neurogenesisDevelopmental Cell 32:390–407.https://doi.org/10.1016/j.devcel.2015.02.004
-
Zur Vergleichenden anatomie des gehirns von polychaeten, onychophoren, xiphosuren, arachniden, crustaceen, Myriapoden, und insekten. Vorstudien Zu einer Phylogenie der arthropodenK. Sven. Vetenskapsakad Handl 56:1–303.
-
BookImmunohistochemistry and fluorescent whole mount RNA in situ hybridization in larval and adult brains of TriboliumIn: Sprecher S. G, editors. Brain Development: Methods and Protocols. New York: Springer. pp. 233–251.https://doi.org/10.1007/978-1-4939-9732-9_13
-
Changes in anterior head patterning underlie the evolution of long germ embryogenesisDevelopmental Biology 374:174–184.https://doi.org/10.1016/j.ydbio.2012.11.026
-
A key role for foxQ2 in anterior head and central brain patterning in insectsDev. Camb. Engl 144:2969–2981.https://doi.org/10.1242/dev.147637
-
The insect central complex as model for heterochronic brain development-background, concepts, and toolsDevelopment Genes and Evolution 226:209–219.https://doi.org/10.1007/s00427-016-0542-7
-
Common design in a unique midline neuropil in the brains of arthropodsArthropod Structure & Development 31:77–91.https://doi.org/10.1016/S1467-8039(02)00017-8
-
Cloning and characterization of the tribolium castaneum eye-color genes encoding tryptophan oxygenase and kynurenine 3-monooxygenaseGenetics 160:225–234.
-
Larval and adult brainsEvolution Development 7:483–489.https://doi.org/10.1111/j.1525-142X.2005.05051.x
-
Six3, a murine homologue of the sine oculis gene, demarcates the most anterior border of the developing neural plate and is expressed during eye developmentDevelopment 121:4045–4055.
-
Structure of the insect brain at successive stages of postembryonic development. II. the central bodyEntomological Review 38:276–283.
-
Lineage-based analysis of the development of the central complex of the Drosophila brainThe Journal of Comparative Neurology 519:661–689.https://doi.org/10.1002/cne.22542
-
Organization and functional roles of the central complex in the insect brainAnnual Review of Entomology 59:165–184.https://doi.org/10.1146/annurev-ento-011613-162031
-
Genetics, development and composition of the insect head--a beetle's viewArthropod Structure & Development 39:399–410.https://doi.org/10.1016/j.asd.2010.08.002
-
Insect Tc-six4 marks a unit with similarity to vertebrate placodesDevelopmental Biology 350:208–216.https://doi.org/10.1016/j.ydbio.2010.10.024
-
Heat shock-mediated misexpression of genes in the beetle tribolium castaneumDevelopment Genes and Evolution 222:287–298.https://doi.org/10.1007/s00427-012-0412-x
-
The evolution of arthropod heads: reconciling morphological, developmental and palaeontological evidenceDevelopment Genes and Evolution 216:395–415.https://doi.org/10.1007/s00427-006-0085-4
-
BookArthropod Brains - Evolution, Functional Elegance, and Historical SignificanceNew Cambridge, Mass: Harvard University Press.
-
Light Sheet-based fluorescence microscopy of living or fixed and stained Tribolium castaneum embryosJournal of Visualized Experiments 122:e55629.https://doi.org/10.3791/55629
-
Embryonic development of the Drosophila brain: formation of commissural and descending pathwaysDevelopment 121:3849–3860.
-
Insect-Like organization of the stomatopod central complex: functional and phylogenetic implicationsFrontiers in Behavioral Neuroscience 11:12.https://doi.org/10.3389/fnbeh.2017.00012
-
Larval RNAi in tribolium (Coleoptera) for analyzing adult developmentDevelopment Genes and Evolution 214:575–578.https://doi.org/10.1007/s00427-004-0434-0
-
The bilaterian forebrain: an evolutionary ChimaeraCurrent Opinion in Neurobiology 23:1080–1089.https://doi.org/10.1016/j.conb.2013.09.005
-
Early neurogenesis of the Drosophila brainThe Journal of Comparative Neurology 370:313–329.https://doi.org/10.1002/(SICI)1096-9861(19960701)370:3<313::AID-CNE3>3.0.CO;2-7
-
AmphiFoxQ2, a novel winged Helix/forkhead gene, exclusively marks the anterior end of the amphioxus embryoDevelopment Genes and Evolution 213:102–105.https://doi.org/10.1007/s00427-003-0302-3
Article and author information
Author details
Max Stephen Farnworth

Funding
Deutsche Forschungsgemeinschaft (BU1443/10)
- Gregor Bucher
China Scholarship Council (201406350036)
- Bicheng He
The funders had no role in study design, data collection and interpretation, or the decision to submit the work for publication.
Acknowledgements
We thank Natalia Carolina García Pérez and Rebekka Wallrafen for mapping and initial characterization of the Ten-a line and Achim Dickmanns’ (GZMB) help with the purification of the protein. Kolja Eckermann for providing the SUMO plasmid and Vera Hunnekuhl for valuable comments on the manuscript. In vivo imaging was performed with the infrastructure provided by Ernst Stelzer. Elke Küster helped identifying and keeping the transgenic stocks. The Ten-a antibody was kindly provided by Stefan Baumgartner. Themonoclonal antibody anti SYNORF1 was obtained from the Developmental Studies Hybridoma Bank, created by the NICHD of the NIH and maintained at The University of Iowa, Department of Biology, Iowa City, IA 52242. We acknowledge support by the Open Access Publication Funds of the Göttingen University.
Copyright
© 2019, He et al.
This article is distributed under the terms of the Creative Commons Attribution License, which permits unrestricted use and redistribution provided that the original author and source are credited.
Metrics
-
- 1,774
- views
-
- 248
- downloads
-
- 43
- citations
Views, downloads and citations are aggregated across all versions of this paper published by eLife.
Citations by DOI
-
- 43
- citations for umbrella DOI https://doi.org/10.7554/eLife.49065
Download links
A two-part list of links to download the article, or parts of the article, in various formats.
Downloads (link to download the article as PDF)
Open citations (links to open the citations from this article in various online reference manager services)
Cite this article (links to download the citations from this article in formats compatible with various reference manager tools)
An ancestral apical brain region contributes to the central complex under the control of foxQ2 in the beetle Tribolium
eLife 8:e49065.
https://doi.org/10.7554/eLife.49065


