Kv2.1 mediates spatial and functional coupling of L-type calcium channels and ryanodine receptors in mammalian neurons
- School of Medicine, University of California, Davis, United States
- University of California, Davis, United States
Figures
Figure 1
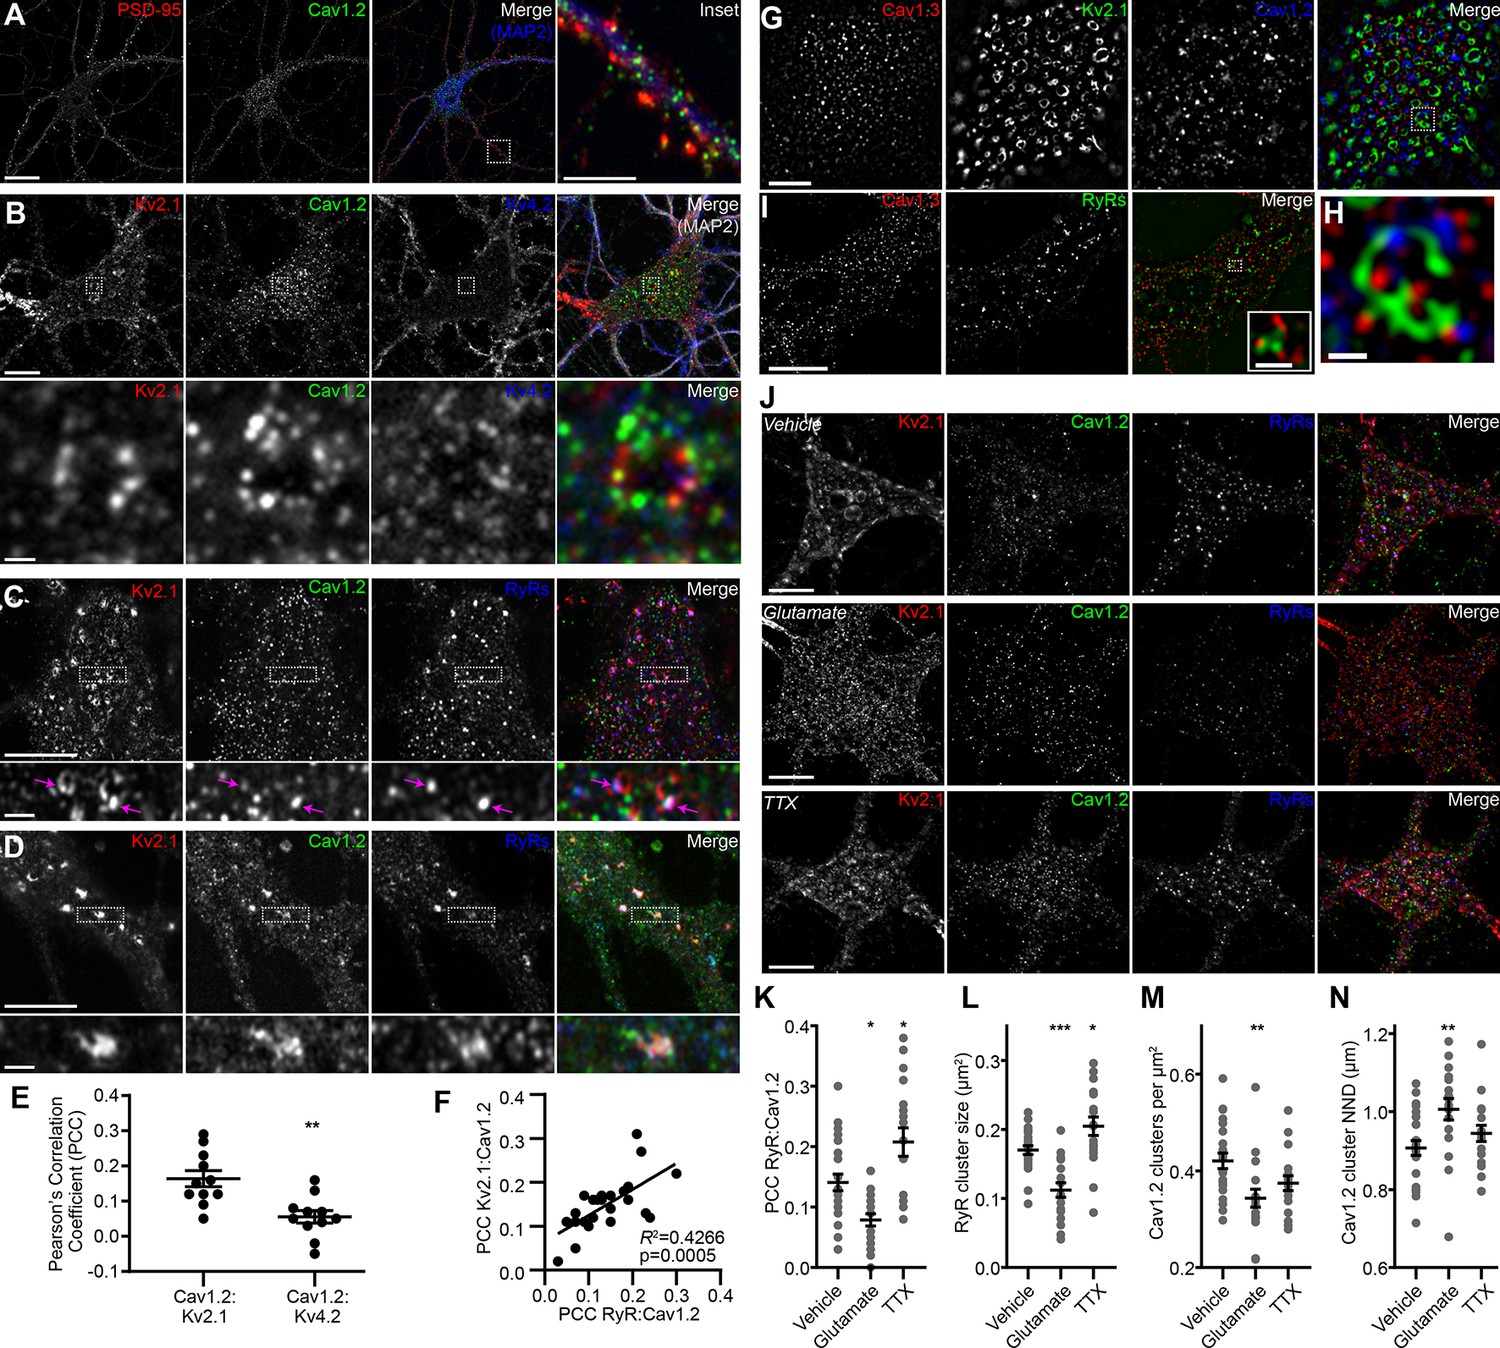
Kv2.1 reversibly associates with Cav1.2 and RyRs in cultured hippocampal neurons.
(A) Single optical section image of a rat CHN immunolabeled for PSD-95, Cav1.2, and MAP2 (scale bar: 20 μm). Note large population of somatic Cav1.2 channels distinct from excitatory synapses located primarily on more distal dendrites. Inset of merged panel shows expanded view of dendritic PSD-95 and Cav1.2 immunolabeling marked by box (inset scale bar: 5 μm). (B) Single optical section of the soma of rat CHN immunolabeled for Kv2.1, Cav1.2, and Kv4.2 (scale bar: 10 μm). The row of panels below the main panels shows an expanded view of somatic immunolabeling in the region marked by the box in the main panels (scale bar: 1 μm). (C) Single confocal optical section of the soma of rat CHN immunolabeled for Kv2.1, Cav1.2, and RyRs (scale bar: 5 μm). The row of panels below the main panels shows an expanded view of somatic immunolabeling in the region marked by the box in the main panels; arrows indicate selected regions of colocalized Kv2.1, Cav1.2, and RyR immunolabeling (inset scale bar: 1 μm). (D) As in E, but in a CHN displaying more prominent colocalization of clustered Kv2.1, Cav1.2, and RyRs. (E) Pearson’s correlation coefficient (PCC) values of somatic Cav1.2 and Kv2.1 or Kv4.2 immunolabeling (each point represents a single neuron; **p=0.0013; two-tailed t-test). (F) Scatter plot demonstrating the positive correlation of paired measurements of the PCC values of Kv2.1 vs. Cav1.2 and RyRs vs. Cav1.2 immunolabeling in rat CHNs. (G) Super resolution (N-SIM) image of the basal membrane of the soma of a rat CHN immunolabeled for Kv2.1, Cav1.2, and Cav1.3 (scale bar: 5 μm). (H) Expanded view of the boxed region in the merged image of G (scale bar: 1.25 μm). (I) Super resolution (N-SIM) image of the basal membrane of the soma of a rat CHN immunolabeled for Cav1.3 and RyRs (scale bar: 5 μm). Inset in merged panel shows a higher magnification view of the boxed area (inset scale bar: 0.625 μm). (J) Single optical sections of representative rat CHNs treated with vehicle (control), 10 µM glutamate, or 500 nM tetrodotoxin (TTX), and immunolabeled for Kv2.1, Cav1.2, and RyRs (scale bar: 10 µm). (K–N) Morphology and spatial distribution of the indicated parameters determined from rat CHNs treated with vehicle, glutamate, or TTX (each point represents one cell; one-way ANOVA followed by Tukey’s post-hoc test). (K) *p=0.0239 (vhl. vs. glut.); *p=0.0134 (vhl. vs. TTX). (L) ***p=0.003 (vhl. vs. glut.); *p=0.0407 (vhl. vs. TTX). (M) **p=0.0045 (vhl. vs. glut.). (N) **p=0.0062 (vhl. vs. glut.).
Figure 2 with 1 supplement
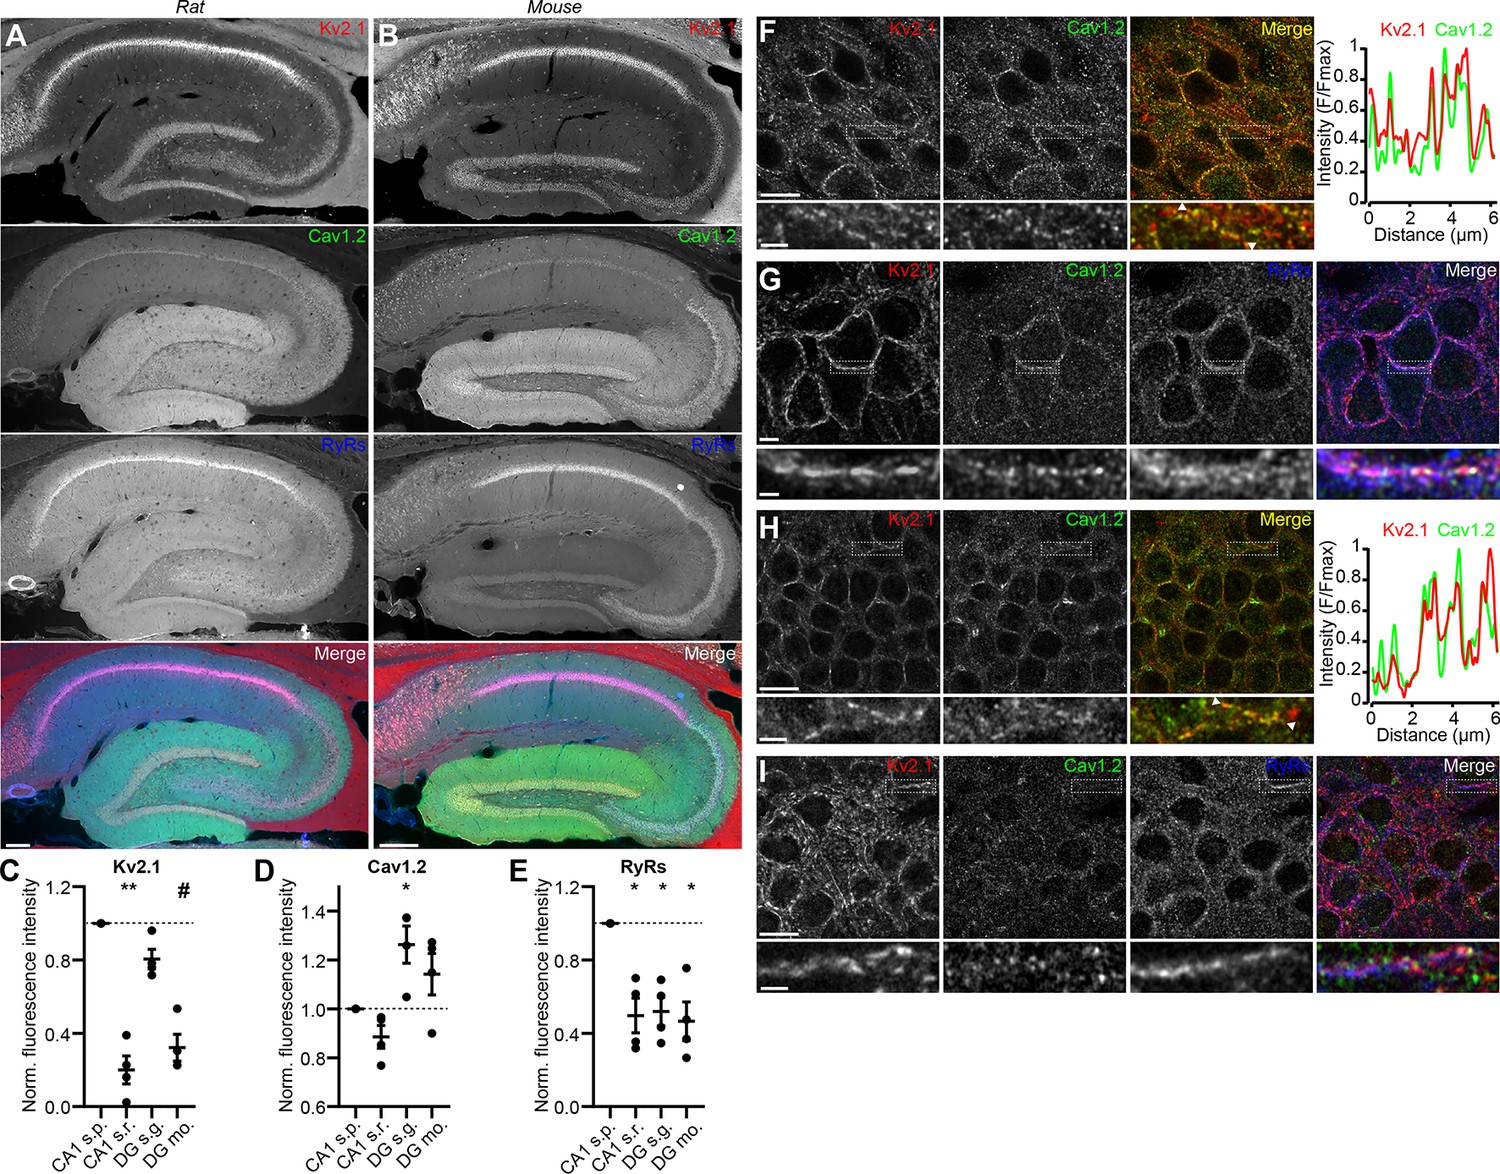
Kv2.1 spatially associates with Cav1.2 and RyRs in brain neurons.
(A) Panels show exemplar images of the hippocampus acquired from a brain section from an adult rat immunolabeled for Kv2.1 (red), Cav1.2, (green) and RyRs (blue), and the merged image (scale bar: 200 μm). (B) As in A but acquired from an adult mouse brain section. (C–E) Summary graphs of normalized mean fluorescence intensity of Kv2.1, Cav1.2, and RyR immunolabeling from ROIs from various laminae within CA1 (s.p.: stratum pyramidale; s.r.: stratum radiatum) and DG (s.g.: stratum granulosum; mo: molecular layer) in WT mouse brain sections. Fluorescence intensity values were normalized to CA1 s.p. for each mouse. Each point corresponds to an individual mouse (one-way ANOVA followed by Dunnett’s post-hoc test vs. CA1 s.p.). (C) **p=0.0025, #p=0.0573 (D) *p=0.0408 (E) *p=0.0198 (CA1 s.r.), *p=0.0324 (DG s.g.), *p=0.0107 (DG s.m.) (F) Confocal optical section obtained from the dentate gyrus of a rat brain section immunolabeled for Kv2.1 (red) and Cav1.2 (green) (scale bar: 10 μm). The row below the main panels shows expanded views of immunolabeling in the region marked by the box in the main panels; arrowheads indicate region selected for intensity profile line scan (scale bar: 2 μm). Line scan obtained from inset is shown to the right. (G) Confocal optical section obtained from the pyramidal cell layer of hippocampal area CA1 in a rat brain section immunolabeled for Kv2.1 (red), Cav1.2 (green), and RyRs (blue) (scale bar: 10 μm). The row below the main panels shows expanded view of immunolabeling in the region marked by the box in the main panels (scale bar: 2 μm). (H) As in F but acquired from a mouse brain section. (I) As in G but acquired from a mouse brain section.
Figure 2—figure supplement 1
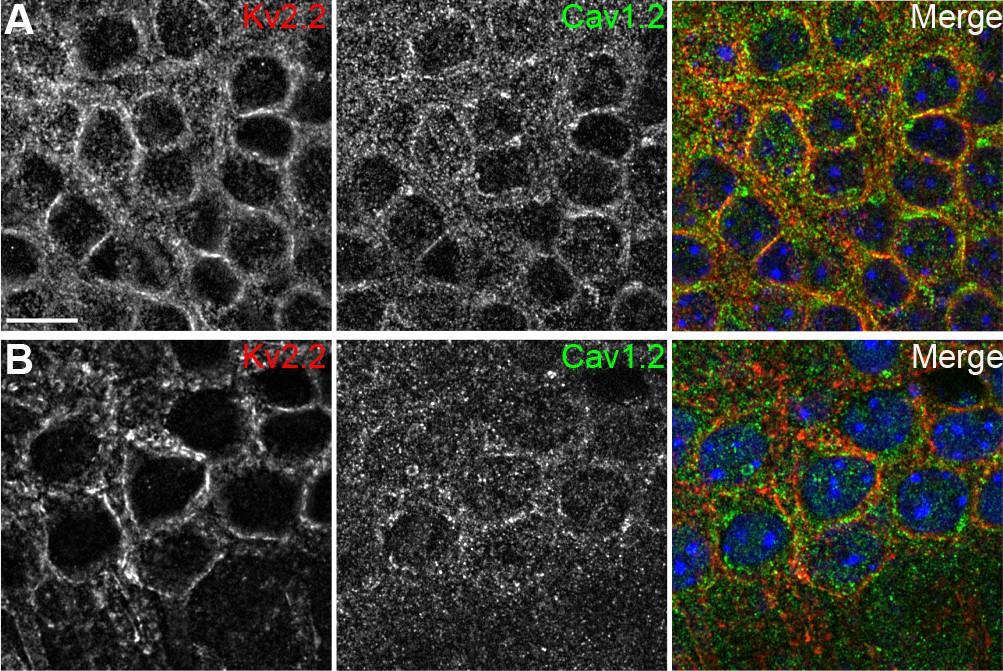
Cav1.2 spatially associates with Kv2.2 in brain neurons.
(A) Confocal optical section obtained from the dentate gyrus of a rat brain section immunolabeled for Kv2.2 (red) and Cav1.2 (green). Nuclei are shown in blue (scale bar: 10 μm). (B) Confocal optical section obtained from the pyramidal cell layer of hippocampal area CA1 in a rat brain section immunolabeled for Kv2.2 (red) and Cav1.2 (green). Nuclei are shown in blue.
Figure 3 with 2 supplements
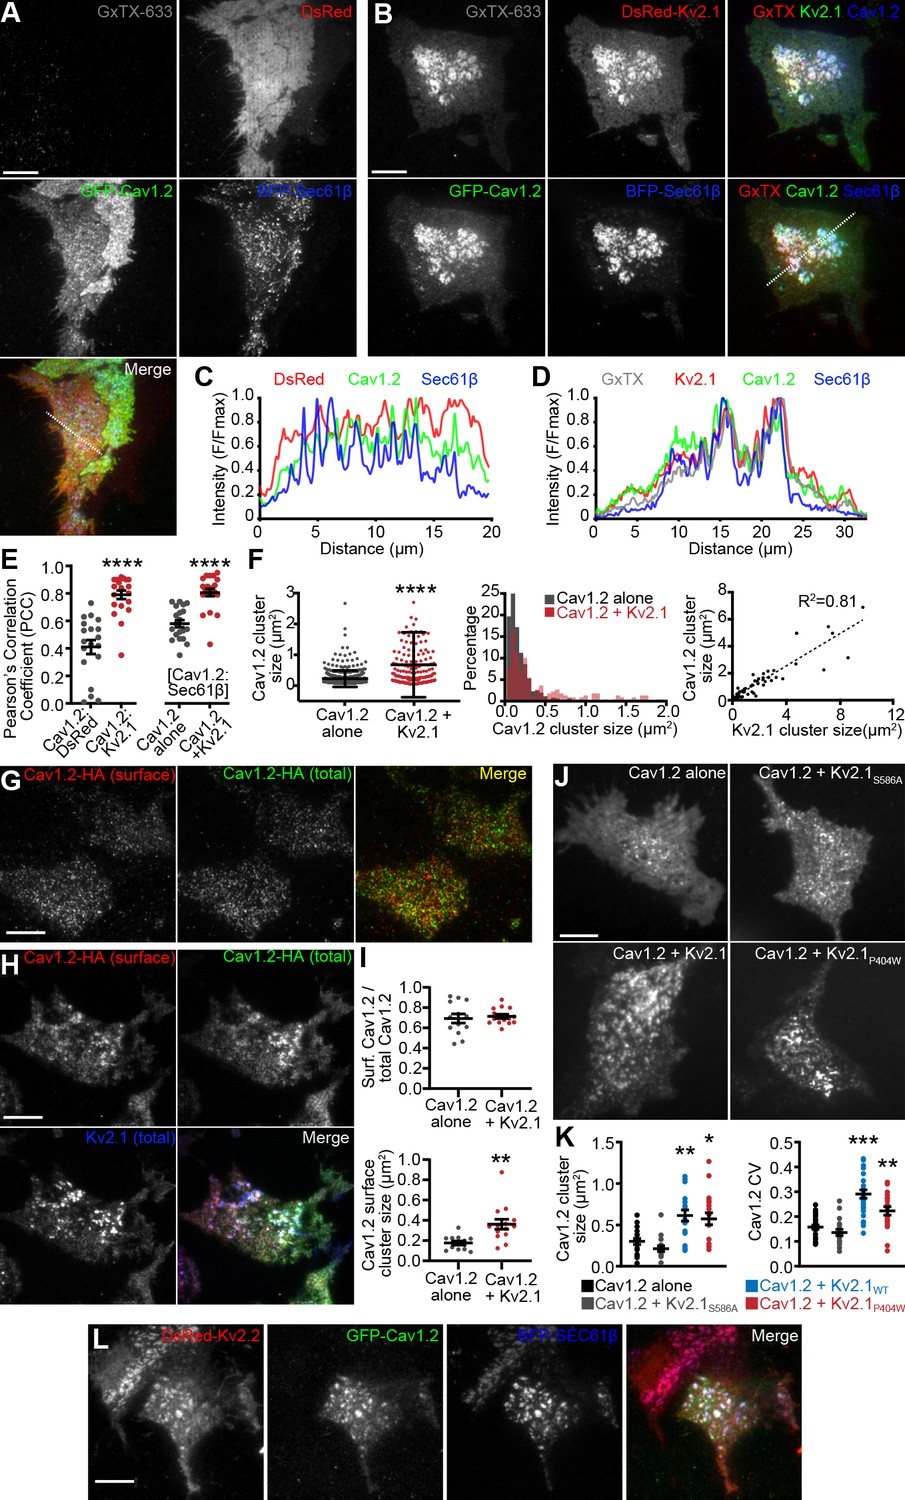
LTCCs are recruited to Kv2-induced EPJs.
(A) TIRF images of a HEK293T cell cotransfected with DsRed (red), GFP-Cav1.2 (green), BFP-SEC61β (blue) and LTCC auxiliary subunits Cavβ3 and Cavα2δ1 (not shown) and labeled with GxTX-633 (scale bar: 10 μm). (B) TIRF images of a HEK293T cell cotransfected with DsRed-Kv2.1 (red), GFP-Cav1.2 (green), BFP-SEC61β (blue) and LTCC auxiliary subunits Cavβ3 and Cavα2δ1 (not shown) and labeled with GxTX-633 (scale bar: 10 μm). (C) Line scan of pixel intensities from the ROI depicted in the merged image of panel A. (D) Line scan of pixel intensities from the ROI depicted in the merged image of panel B. (E) Pearson’s correlation coefficient (PCC) values of Cav1.2-GFP and DsRed or DsRed-Kv2.1 fluorescence (left) or Cav1.2-GFP and BFP-Sec61β with or without DsRed-Kv2.1 (right) (each point represents a single cell; ****p<0.0001; Mann-Whitney test). (F) Summary graphs of Cav1.2 cluster size (left panel), the cluster size frequency distribution (center panel), and a scatter plot of paired measurements of Kv2.1 and Cav1.2 cluster sizes (left panel) measured from HEK293T cells transfected with GFP-Cav1.2, Cavβ3, and Cavα2δ1 alone (black) or additionally cotransfected with DsRed-Kv2.1 (red). Bars are mean ± SD (****p<10−15, two-tailed t-test, n = 3 cells). (G) TIRF images of a HEK293T cell transfected with Cav1.2-HA, Cavβ3, and Cavα2δ1, and immunolabeled for cell surface Cav1.2-HA (red) and total Cav1.2-HA (green) (scale bar: 10 μm). (H) TIRF images of a HEK293T cell transfected with Cav1.2-HA, Kv2.1-GFP, Cavβ3, and Cavα2δ1, and immunolabeled for cell surface Cav1.2-HA (red) and total Cav1.2-HA (green) (scale bar: 10 μm). (I) Upper panel: ratio of cell surface Cav1.2-HA cluster area versus total Cav1.2-HA cluster area present in the TIRF field obtained from cells expressing Cav1.2-HA and auxiliary subunits with or without Kv2.1 (each point represents one cell; p=0.6755, two-tailed t-test). Lower panel: mean area of Cav1.2-HA clusters present in the TIRF field measured from cells expressing Cav1.2-HA and auxiliary subunits with or without Kv2.1 (each point represents one cell; **p=0.0020, two-tailed t-test). (J) TIRF images GFP-Cav1.2 in HEK293T cells cotransfected with GFP-Cav1.2, Cavβ3 and Cavα2δ1, either alone or with the non-clustered Kv2.1S586A point mutant, Kv2.1WT, or the nonconducting Kv2.1P404W point mutant (scale bar: 10 μm and holds for all panels). (K) Summary graph of Cav1.2 cluster size (left) and coefficient of variation (CV) values of GFP-Cav1.2 fluorescent signal intensity (right) measured from HEK293T cells cotransfected with GFP-Cav1.2 and the indicated Kv2.1 isoforms. Each point corresponds to a single cell. (cluster size: **p=0.0004, *p=0.0017 vs. Cav1.2 alone; CV: ***p<0.0001, **p=0.0040 vs. Cav1.2 alone; one-way ANOVA followed by Dunnett’s post-hoc test). (L) TIRF images of a HEK293T cell cotransfected with DsRed-Kv2.2 (red), GFP-Cav1.2 (green), BFP-SEC61β (blue) and Cavβ3 and Cavα2δ1 (not shown) (scale bar: 10 μm).
Figure 3—figure supplement 1
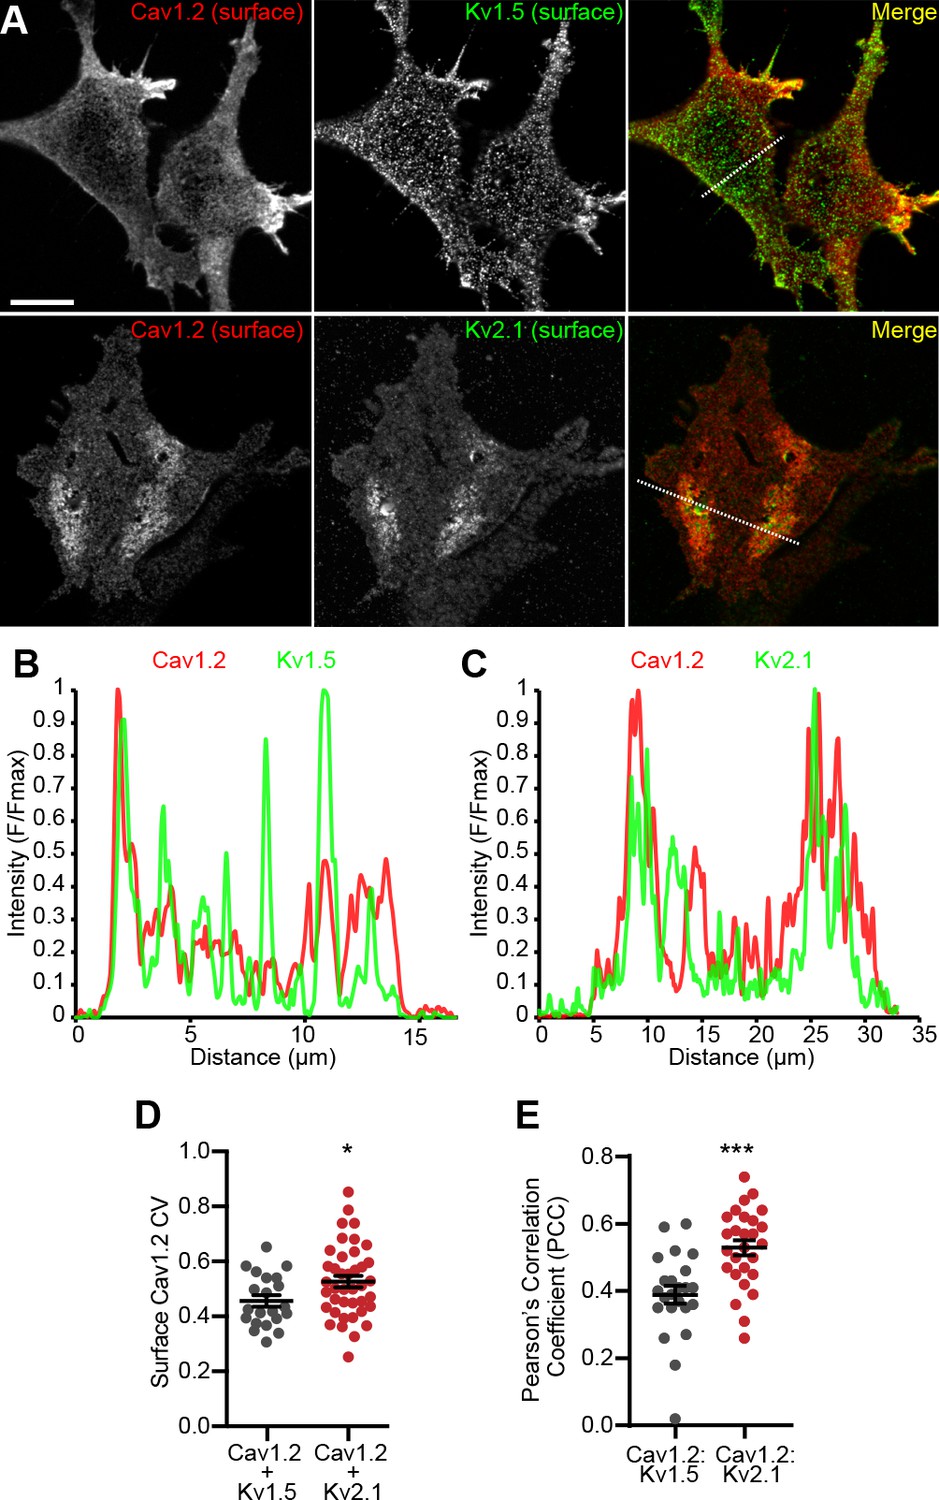
Kv2.1 increases clustering of surface Cav1.2 channels.
(A) Optical sections of HEK293T cells transfected with and immunolabeled for cell surface Cav1.2-HA and Kv1.5 (upper panels) or Kv2.1 (lower panels) (scale bar: 10 μm and holds for all panels). (B) Line scan of pixel intensities from the ROI depicted in the merged image of the upper images in panel A. (C) Line scan of pixel intensities from the ROI depicted in the merged image of the lower images in panel A. (D) Summary graph of CV values of Cav1.2-HA fluorescent signal intensity measured from HEK293T cells cotransfected with Kv1.5 or Kv2.1. Each point corresponds to a single cell (*p=0.0348 versus Kv1.5, two-tailed t-test). (E) Pearson’s correlation coefficient (PCC) values of cell surface Cav1.2 and Kv1.5 or Kv2.1 immunolabeling (each point represents a single cell; ***p=0.0002; Student’s t-test).
Figure 3—figure supplement 2
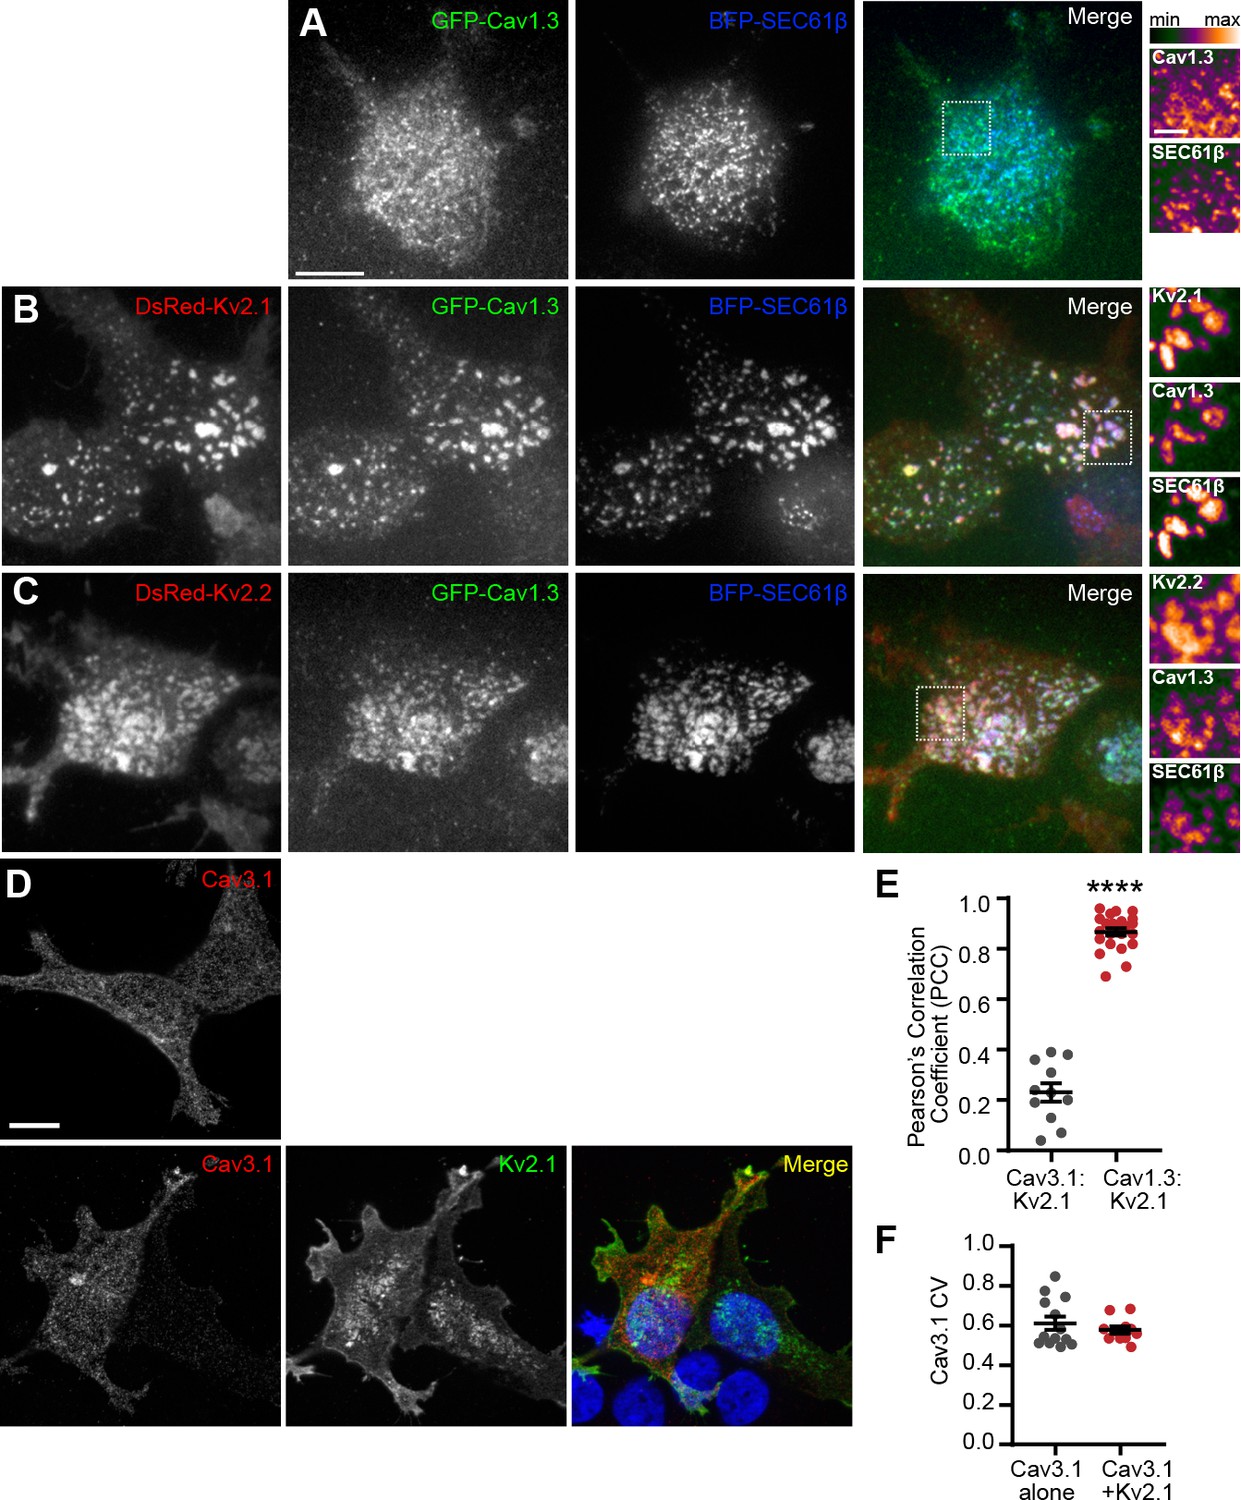
Cav1.3s is recruited to Kv2-induced EPJs.
(A) TIRF images of a HEK293T cell cotransfected with the short isoform of Cav1.3 (GFP-Cav1.3 (green), BFP-SEC61β (blue) and auxiliary subunits Cavβ3 and Cavα2δ (not shown). Scalebar is 10 μm and holds for all large panels in figure. Pseudocolored intensity profiles of GFP-Cav1.3 and BFP-SEC61β, from the boxed area in the merged image, are shown to the right of merged image. (scale bar: 2.5 μm and holds for all pseudocolored intensity profiles in figure). (B) TIRF images of HEK293T cells cotransfected with DsRed-Kv2.1 (red), GFP-Cav1.3 (green), BFP-SEC61β (blue) and auxiliary subunits Cavβ3 and Cavα2δ (not shown). Pseudocolored intensity profiles of DsRed-Kv2.1, GFP-Cav1.3 and BFP-SEC61β, from the boxed area in the merged image, are shown to the right of merged image. (C) TIRF images of a HEK293T cell cotransfected with DsRed-Kv2.2 (red), GFP-Cav1.3 (green), BFP-SEC61β (blue) and auxiliary subunits Cavβ3 and Cavα2δ (not shown). Pseudocolored intensity profiles of DsRed-Kv2.2, GFP-Cav1.3 and BFP-SEC61β from the boxed area in the merged image, are shown to the right of merged image. (D) Optical sections of HEK293T cells transfected with and immunolabeled for Cav3.1 alone (upper panel) or with Kv2.1 (lower panels) (scale bar: 10 μm and holds for all panels). (E) Pearson’s correlation coefficient (PCC) values of Cav3.1 and Kv2.1 immunolabeling or Cav1.3-GFP and DsRed-Kv2.1 fluorescence (each point represents a single cell; ****p<0.0001; Student’s t-test). (F) Summary graph of CV values of Cav3.1 fluorescent signal intensity measured from HEK293T cells described in H. Each point corresponds to a single cell (p=0.4027, two-tailed t-test).
Figure 4 with 2 supplements
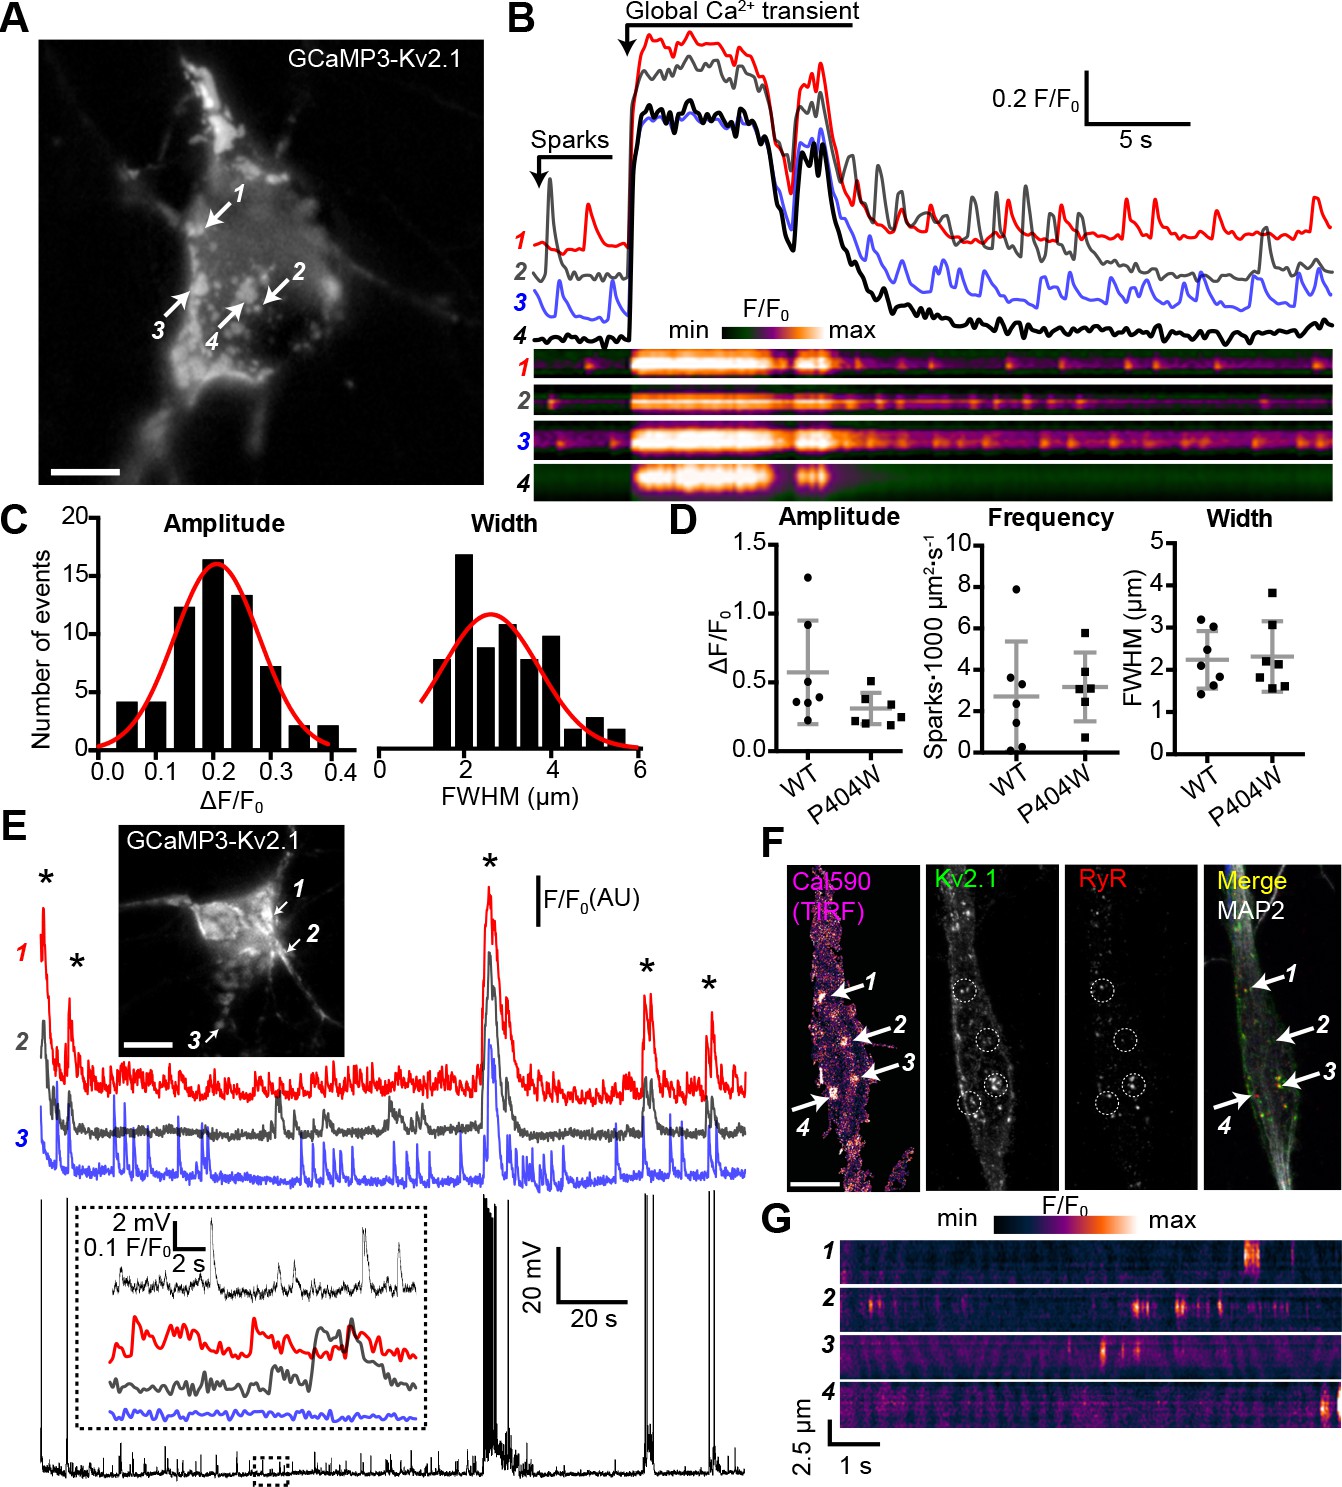
Spontaneous Ca2+ signals are generated at Kv2.1-associated EPJs.
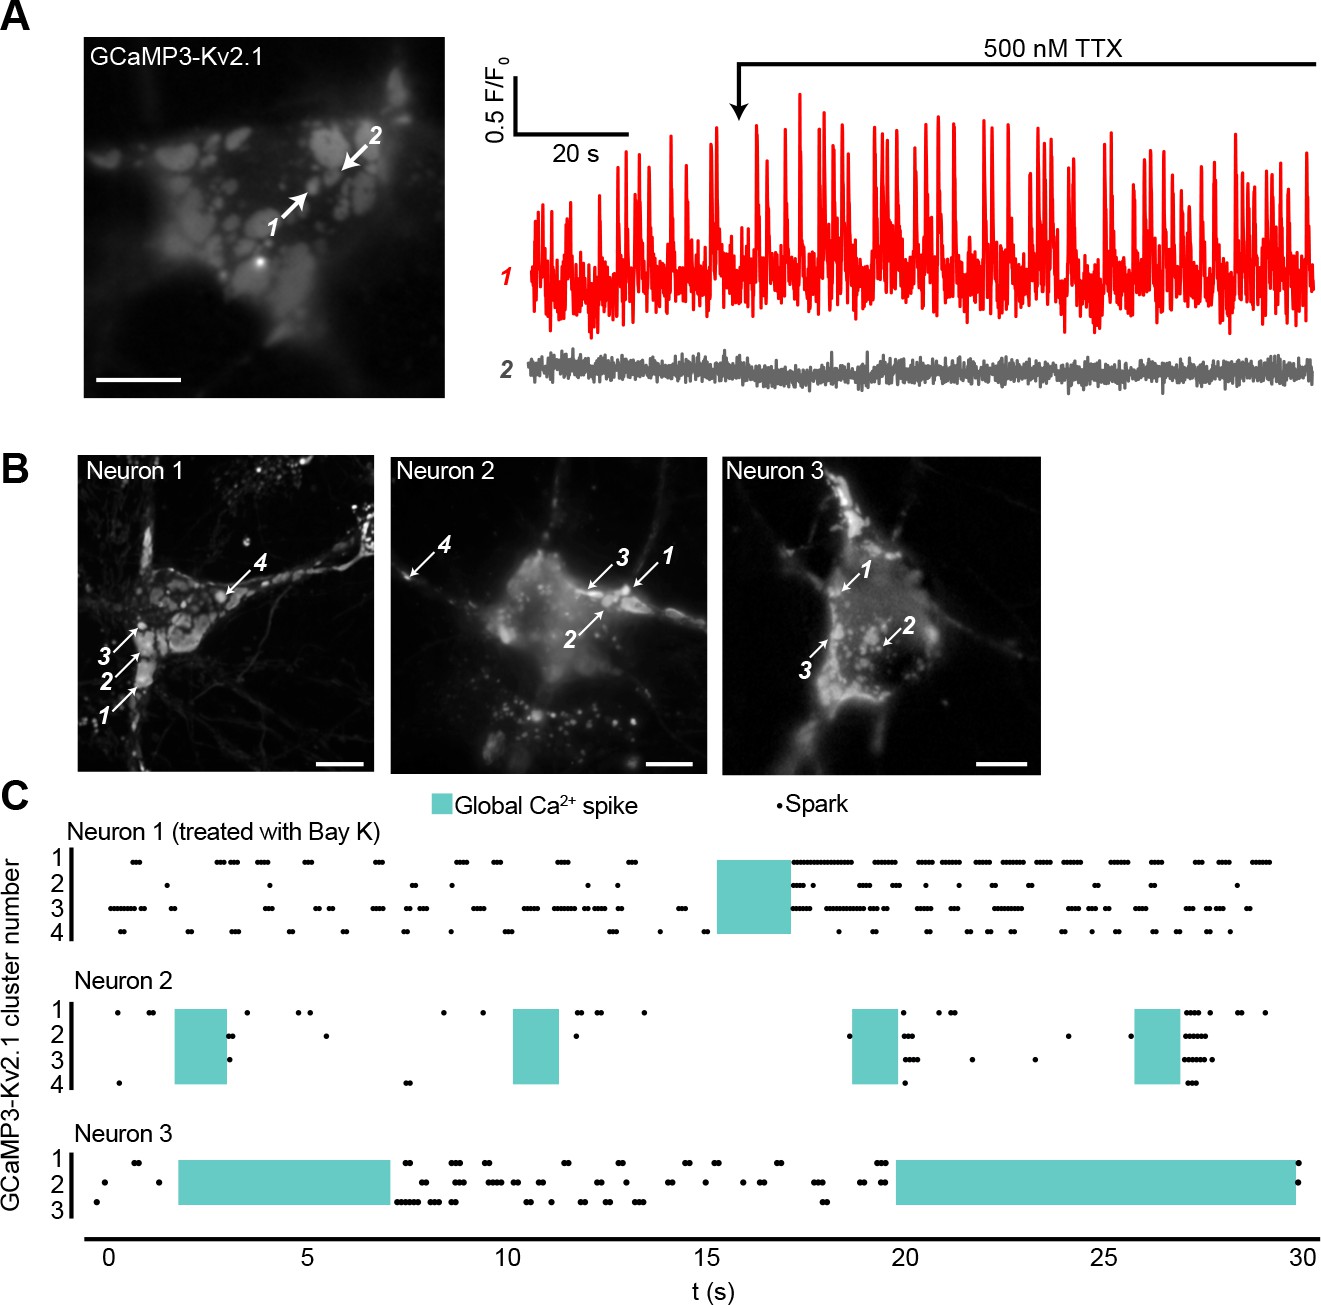
(A) Widefield image of a rat CHN transfected with GCaMP3-Kv2.1 (also see Video 1). Arrows indicate selected Kv2.1 clusters whose fluorescent intensity profiles are plotted in panel B (scale bar: 10 µm). (B) Fluorescence intensity traces (upper panels) and kymographs (lower panels) corresponding to the four ROIs indicated in panel A. Note spontaneous Ca2+ signals occurring at ROI 2 that are not detected at the adjacent ROI 4. (C) Amplitude (ΔF/F0) and spatial spread (full width at half maximum, FWHM; µm) of all spatially distinct localized Ca2+ signals recorded from the neuron in panel A over a period of 90 s. (D) Summary data of the amplitude, frequency and spatial spread (width) of all spatially distinct localized Ca2+ signals recorded from CHNs expressing GCaMP3-Kv2.1 or GCaMP3-Kv2.1P404W. Each point corresponds to a single cell. No significant differences were detected. Bars are mean ± SD (Student’s t -test). (E) Image of a rat CHN transfected with GCaMP3-Kv2.1 from which simultaneous GCaMP3-Kv2.1 fluorescence and membrane potential values were acquired (scale bar: 10 μm). Numbered arrows correspond to ROIs whose fluorescence intensity traces are depicted below image. Membrane potential measurements are provided in the bottom trace. The inset shows and expanded view of ROI Ca2+ traces and membrane potential values from region of the time course indicated by the dashed box in the membrane potential trace. Asterisks correspond to global Ca2+ spikes. (F) Representative rat CHN loaded with Cal590 and imaged with TIRF microscopy, followed by post-hoc immunolabeling for Kv2.1, RyRs, and MAP2. Arrows indicate ROIs where spontaneous Ca2+ signals were detected; dashed circles indicate approximate regions where immunolabeling for Kv2.1 and RyRs was detectable (scale bar: 10 μm). (G) Kymograph showing the localized Ca2+ release events detected at ROIs depicted in F.
Figure 4—figure supplement 1
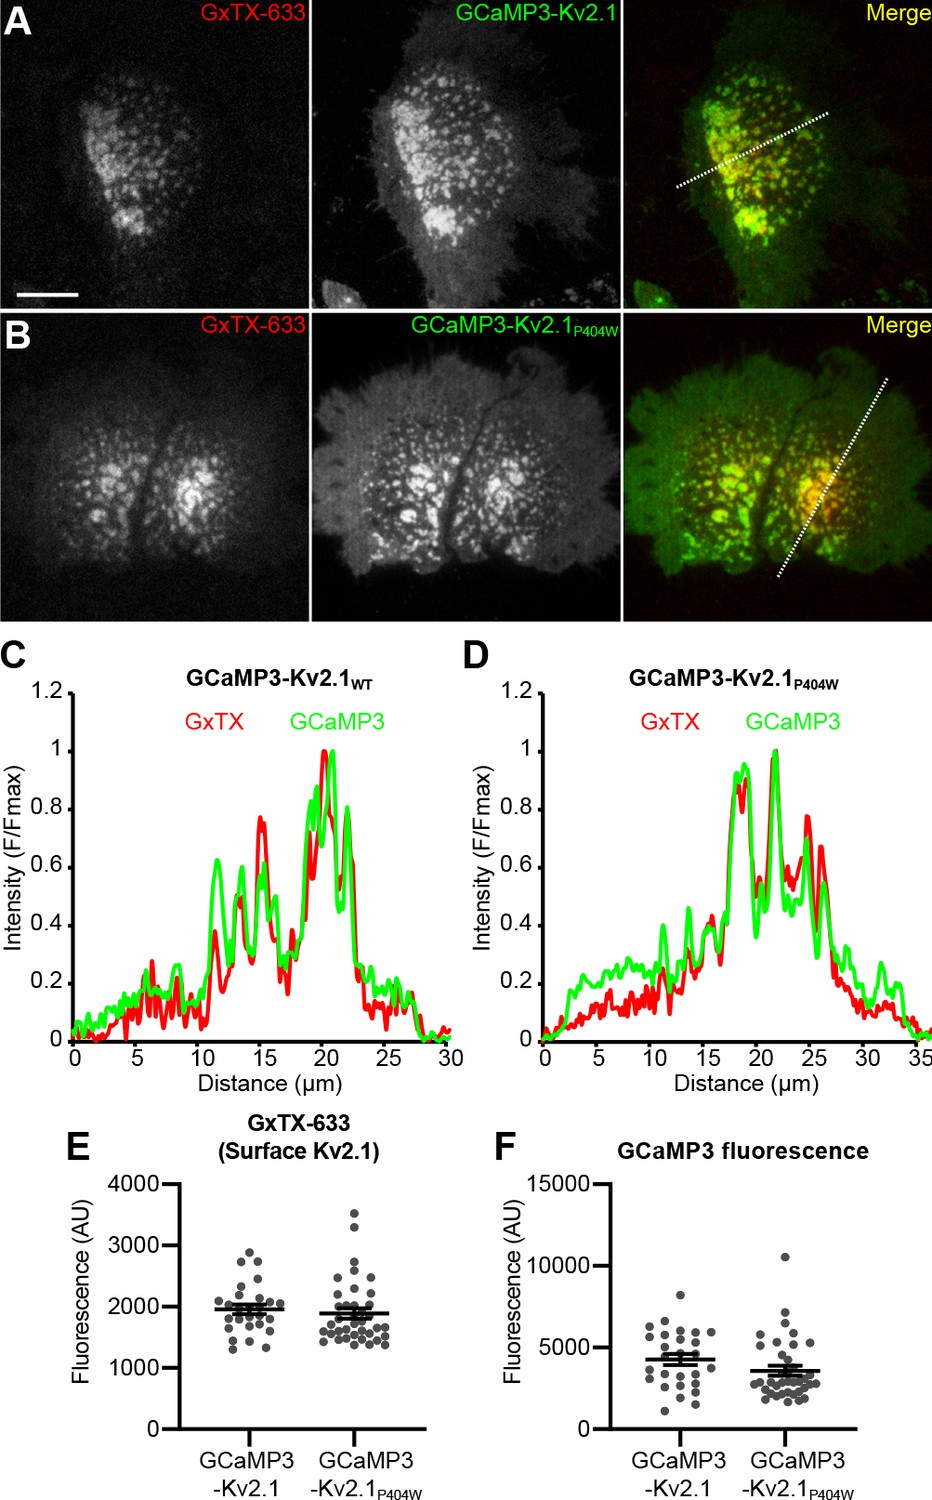
GCaMP3-Kv2.1WT and GCaMP3-Kv2.1P404W show comparable PM expression in HEK293T cells.
(A) TIRF images of a HEK293T cell transfected with GCaMP3-Kv2.1WT. GxTX-633 labeling is shown in red and GCaMP3 fluorescence is shown in green in the merge panel (scale bar: 10 µm). (B) As in A but obtained from cells expressing GCaMP3-Kv2.1P404W. (C) Line scan of pixel intensities from the ROI depicted in the merged image in panel A. (D) Line scan of pixel intensities from the ROI depicted in the merged image in panel B. (E) Mean fluorescence intensity of GxTX-633 surface labeling obtained from cells expressing GCaMP3-Kv2.1WT or -Kv2.1P404W. Each point represents a single cell (AU: arbitrary units; p=0.2353, Mann-Whitney test). (F) Mean fluorescence intensity of GCaMP3 obtained from cells expressing GCaMP3-Kv2.1WT or -Kv2.1P404W. Each point represents a single cell (p=0.0575, Mann-Whitney test).
Figure 4—figure supplement 2
Relationship of Ca2+ sparks to global Ca2+ spikes.
(A) Neuron expressing GCaMP3-Kv2.1 and exhibiting Ca2+ sparks at the cluster indicated by ROI 1 (note that Ca2+ sparks were undetectable at the adjacent cluster indicated by ROI 2) (scale bar: 10 µm). 500 nM TTX was added at the indicated time point. (B) Images of neurons transfected with GCaMP3-Kv2.1 showing numbered ROIs whose fluorescence intensity profiles are plotted in the raster plots in panel B (scale bar: 10 µm). (C) Temporal Ca2+ spark raster plot depicting Ca2+ sparks (black dots) at selected ROIs and their relationship to global Ca2+ influx events whose duration is indicated by the turquoise rectangles. Note that the neurons in panels A and B correspond to those shown in Videos, with Neuron one shown in Video 4, Neuron two shown in Video 3, and Neuron three shown in Video 1.
Figure 5
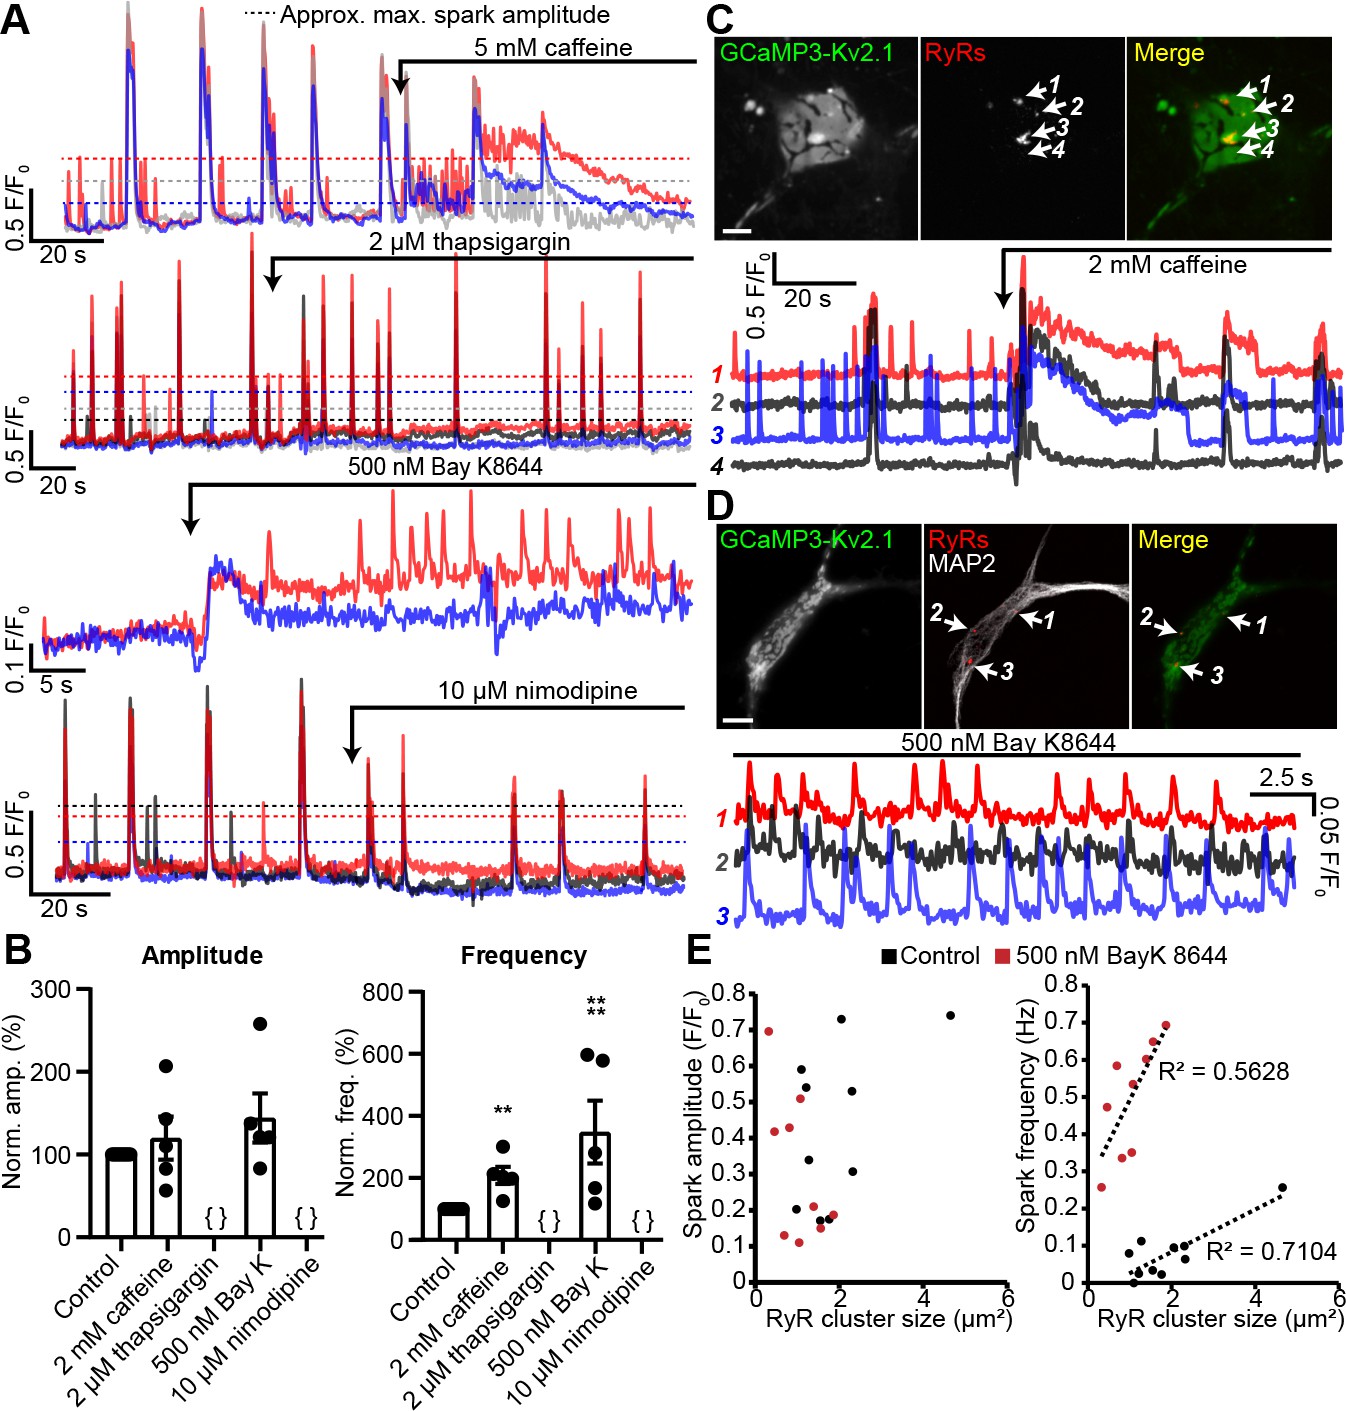
Spontaneous Ca2+ signals at Kv2.1-associated EPJs are produced by RyR- and LTCC-mediated CICR.
(A) Representative GCaMP3-Kv2.1 fluorescence traces from CHNs treated with pharmacological probes of CICR. Different colors indicate spatially distinct ROIs within the same neuron. Dashed lines indicate approximate maximum amplitude for localized Ca2+ signals as opposed to the larger amplitude, synchronized global Ca2+ transients that exceed the dashed lines. (B) Summary data of the amplitude and frequency of all sparks recorded from CHNs treated with pharmacological probes of CICR. Each point corresponds to a single cell (**p=0.0013 vs. control; ****p<0.0001 vs. control; {}: no Ca2+ sparks detected; one-way ANOVA followed by Dunnett’s test). (C) Image of rat CHN transfected with GCaMP3-Kv2.1 and treated with caffeine, followed by post-hoc immunolabeling for RyRs (scale bar: 10 μm). Numbered arrows indicate ROIs where localized Ca2+ signals were detected (ROIs 1–3) or not detected (ROI 4). ROI fluorescence traces are shown in lower panel; note lack of spontaneous Ca2+ signals at ROI 4 despite its proximity to ROI 3, which displays prominent spontaneous Ca2+ release. (D) As in panel A, except CHN was treated with 500 nM Bay K8644 to induce spontaneous Ca2+ signals (scale bar: 10 μm). (E) Plot of individual RyR cluster size (determined from post-hoc immunolabeling) versus its spark amplitude (left panel) or frequency (right panel) reported by GCaMP3-Kv2.1 fluorescence in control (black symbols) or Bay K8644-treated (red symbols) cells. Each point corresponds to an individual RyR cluster (n = data from 4 cells [control] or 5 cells [Bay K8644]).
Figure 6 with 1 supplement
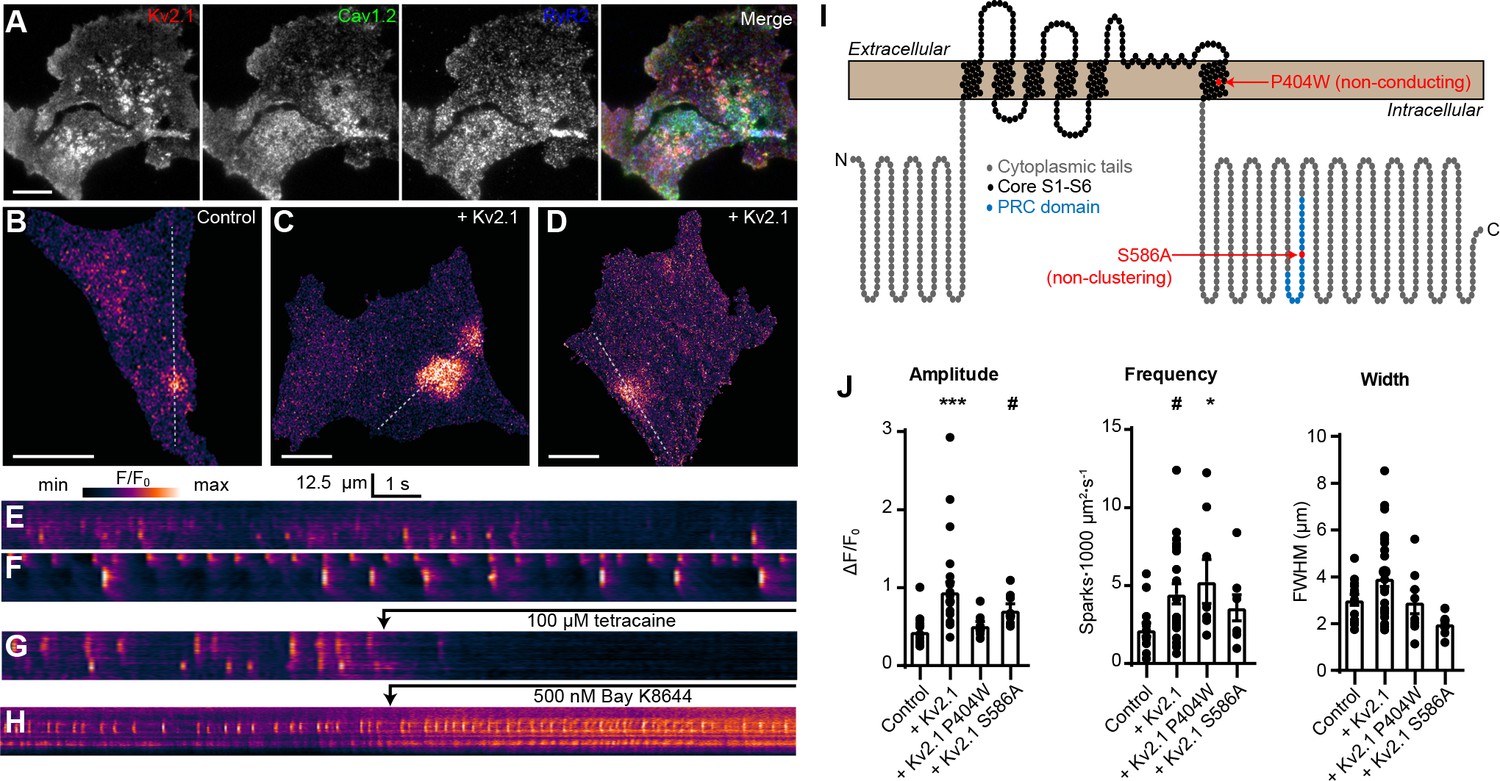
Kv2.1 expression increases the frequency of LTCC- and RyR-mediated sparks reconstituted in HEK293T cells.
(A) TIRF images of a HEK293T cell cotransfected with DsRed-Kv2.1 (red), Cav1.2 (green), YFP-RyR2 (blue), and auxiliary subunits Cavβ3, Cavα2δ1, and STAC1 (not shown) (scale bar: 10 μm). (B) TIRF image of a HEK293T cell expressing Cav1.2, RyR2, STAC1, and the LTCC auxiliary subunits β3 and α2δ1, and loaded with Cal-590 AM. (C–D) TIRF images of HEK293T cells additionally coexpressing Kv2.1. Dashed line indicates ROI depicted in corresponding kymographs (scale bar in panels B-D: 10 µm). (E–G) Kymograph showing the localized Ca2+ release events detected in the ROI on the cell in panels B-D, respectively. In (G), 100 µM tetracaine was added at the indicated time point. (H) Kymograph showing the localized Ca2+ release events detected in a cell treated with 500 nM Bay K8644 at the indicated time point. (I) Illustration of the membrane topology of a single Kv2.1 α subunit depicting the locations of the P404W and S586A point mutations. (J) Summary data of the amplitude, frequency and spatial spread (width) of all sparks recorded from HEK293T cells expressing Cav1.2, RyR2, and auxiliary subunits, without (control) or with addition of the indicated Kv2.1 isoforms. Each point corresponds to a single cell (amplitude: ***p=0.0001, #p=0.051; frequency: #p=0.055, *p=0.047; one-way ANOVA followed by Dunnett’s post-hoc test vs. control).
Figure 6—figure supplement 1
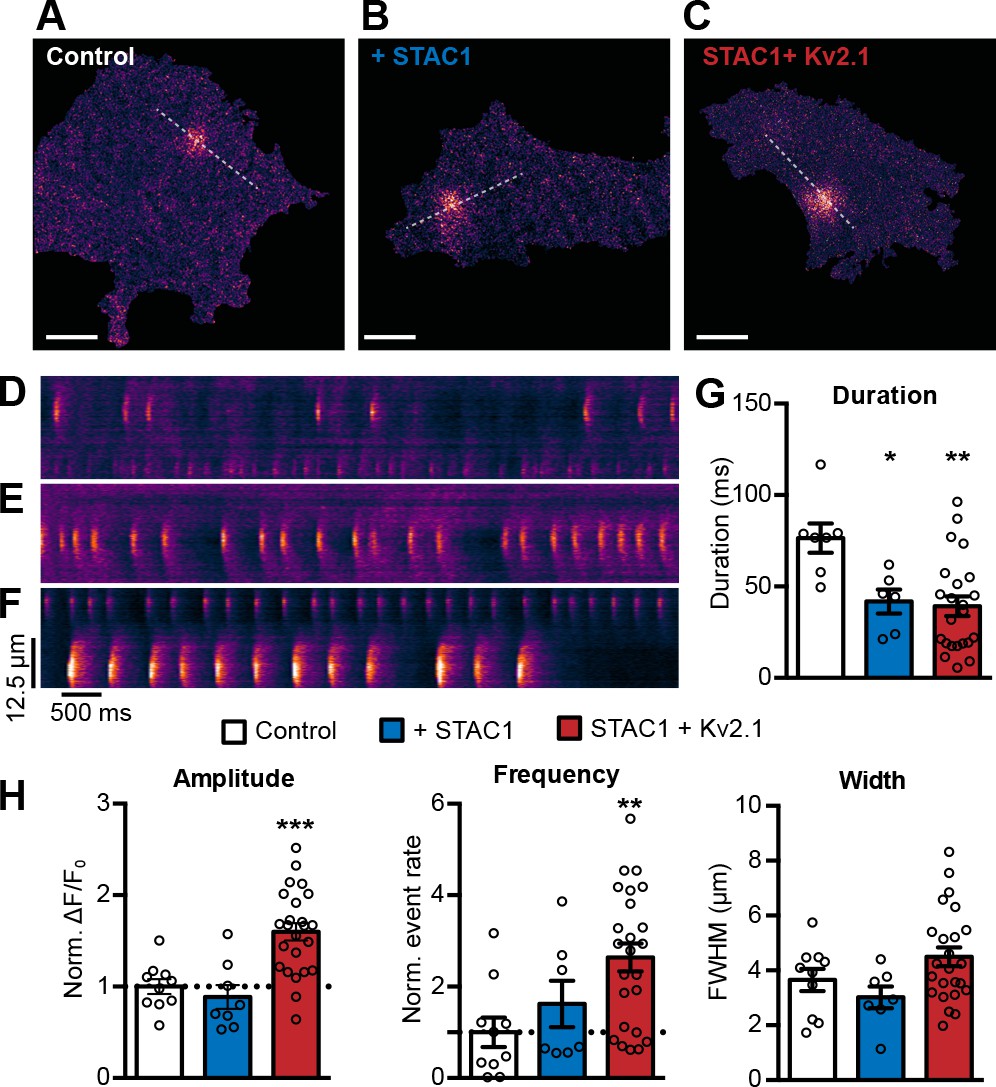
Kv2.1 increases the frequency of Cav1.3s and RyR-mediated sparks reconstituted in HEK293T cells.
(A) TIRF image of HEK293T cell expressing the short isoform of Cav1.3 (Cav1.3s), RyR2, STAC1, and the LTCC auxiliary subunits β3 and α2δ1, and loaded with Cal-590 AM (scale bar: 10 µm and holds for panels A-C). (B) TIRF images of HEK293T cells additionally coexpressing STAC1. (C) TIRF images of HEK293T cells additionally coexpressing STAC1 and Kv2.1. (D–F) Kymographs showing the localized Ca2+ release events detected in the ROI on the cell in panels A-C, respectively. (G–H) Data from cells expressing Cav1.3, RyR2 and auxiliary subunits without (white bars) or with coexpression of STAC1 (blue bars) or STAC1 + Kv2.1 (red bars). (G) Expression of STAC1 reduces the duration of Cav1.3s- and RyR2-mediated CICR events reconstituted in HEK293T cells. (*p=0.0339; **p=0.0026; ANOVA followed by Dunnett’s test). (H) Summary data of the amplitude, frequency, and spatial spread (width) of all sparks recorded. Each point corresponds to a single cell (**p=0.0081; ***p=0.0001; one-way ANOVA followed by Dunnett’s post-hoc test vs. control).
Figure 7 with 1 supplement

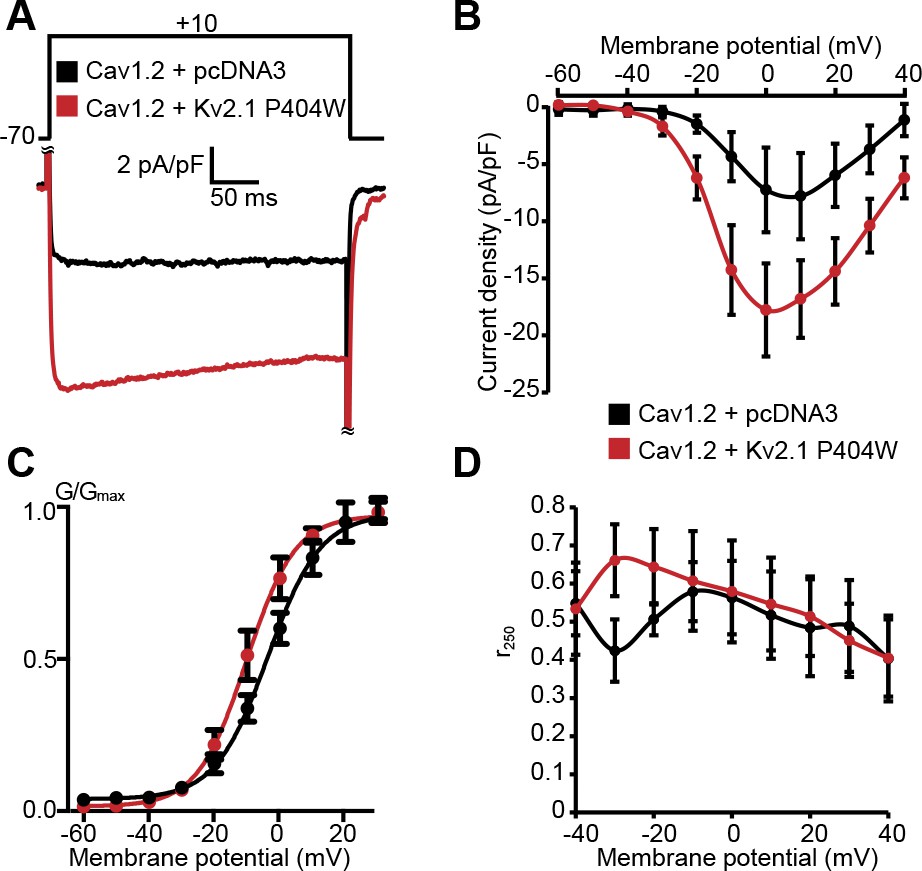
Cav1.2 channel activity is increased by coexpression with Kv2.1P404W.
(A) Representative Ca2+ current trace families recorded from HEK293T cells transfected with Cav1.2-GFP and auxiliary subunits Cavβ3 and Cavα2δ1, without (+ pcDNA3 empty vector) with cotransfection of DsRed-Kv2.1P404W. For panels B-D, H, and I, data are from cells without (+ pcDNA3 empty vector, in black) or with coexpression of Kv2.1P404W (in red). (B) Normalized current-voltage (I–V) relationship of whole-cell ICa recorded from n = 17 (Cav1.2 + pcDNA3) and n = 10 (Cav1.2 + Kv2.1P404W) cells. (C) Voltage-dependence of whole-cell Cav1.2 conductance G/Gmax and steady-state inactivation I/Imax. For the conductance-voltage relationships, the half-maximal activation voltage V1/2=-8.9±0.8 [pcDNA3] vs. −13.9 ± 1.6 [+Kv2.1P404W] mV, p=0.0045; slope factor k = 6.9 ± 0.3 [pcDNA3] vs. 4.5 ± 0.7 [+Kv2.1P404W], p=0.0025; Student’s t-test. (D) Comparison of r250 values (fraction of peak current remaining after 250 ms of depolarization) at the indicated potentials. (E) Average Rhod-2 fluorescence intensity measurements obtained from cells held at different membrane potentials during voltage clamp experiments (n = 4 cells per condition). (F) Average fluorescence intensity measurements from Fluo4-loaded HEK293T cells transfected with Cav1.2-RFP, auxiliary subunits Cavβ3 and Cavα2δ, without (+ pcDNA3 empty vector, in black) or with cotransfection of Kv2.1WT (in blue) or Kv2.1P404W (in red). Ca2+ influx was stimulated by depolarization with high extracellular K+ (45 mM) as indicated on the graph. (G) Average peak fluorescence values obtained during high-K+ depolarization of HEK293T cells expressing Cav1.2 and Kv2.1WT or Kv2.1P404W as in F. Each point represents a single cell. Bars are mean ± SD (**p<0.0001, *p=0.0047 versus control; Student’s t-test). (H) Representative nitrendipine-sensitive Cav1.2 gating and tail currents recorded from control (pcDNA3) cells and cells coexpressing Kv2.1P404W. (I) Quantification of nitrendipine-sensitive Cav1.2 Qon (left, p=0.3931, Student’s t-test), Itail (center, *p=0.0195, Student’s t-test), and Qon vs.Itail (right). Each point corresponds to a single cell.
Figure 7—figure supplement 1
Cav1.2 channel activity is increased in cells coexpressing STAC1 upon coexpression with Kv2.1P404W.
(A-D) Data recorded from HEK293T cells transfected with Cav1.2-GFP and auxiliary subunits Cavβ3, Cavα2δ1, and STAC1, without (+pCDNA3, in black) or with Kv2.1P404W (in red). (A) Representative Ca2+ current traces at +10 mV. (B) Normalized I-V relationship of whole-cell ICa recorded from n = 8 (Cav1.2 + pcDNA3) and n = 9 (Cav1.2 + Kv2.1P404W) cells. (C) Voltage-dependence of whole-cell Cav1.2 conductance G/Gmax. For the conductance-voltage relationships, the half-maximal activation voltage V1/2=1.6±2.0 [pcDNA3] vs. −9.5 ± 2.9 [+Kv2.1P404W] mV, p=0.0166; slope factor k = 8.8 ± 1.2 [pcDNA3] vs. 6.1 ± 0.6 [+Kv2.1P404W], p=0.0490; Student’s t-test). (D) Comparison of r250 values (fraction of peak current remaining after 250 ms of depolarization) at the indicated potentials.
Figure 8
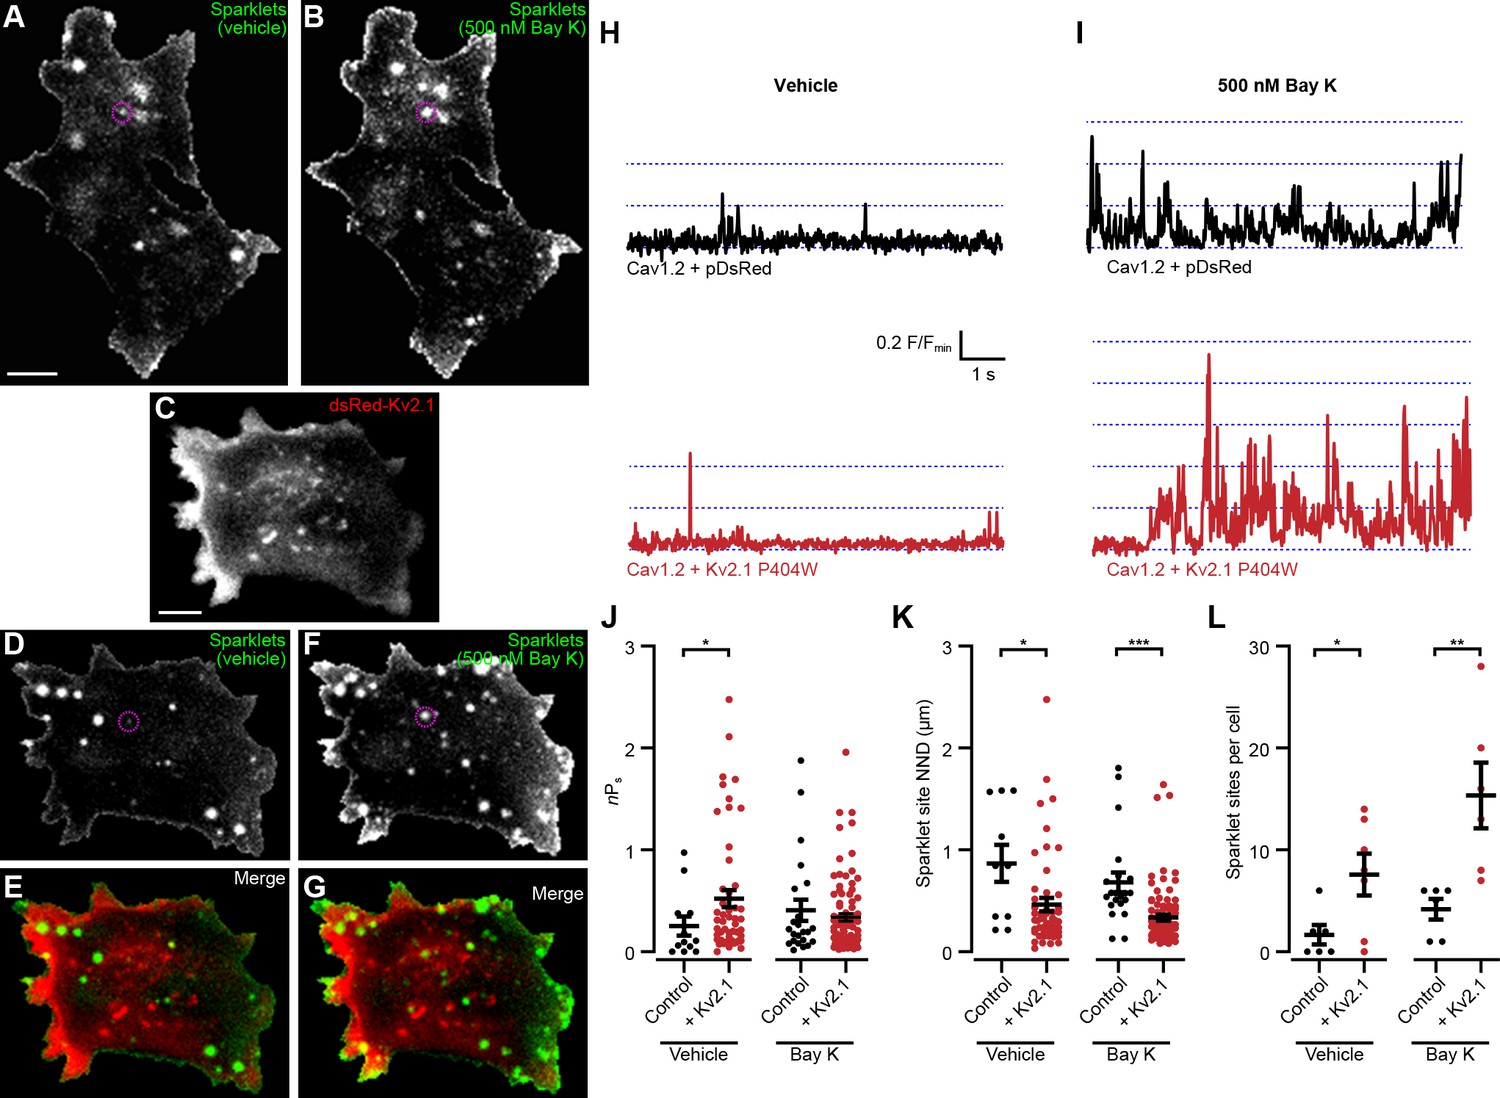
Kv2.1P404W increases Cav1.2 single channel activity.
(A, B) Maximum z-projections of TIRF images of Cav1.2-mediated Ca2+ sparklets in a representative HEK293T cell transfected with Cav1.2 and auxiliary subunits and loaded with Fluo-5F via the patch pipette, before (A) and after (B) treatment with 500 nM Bay K8644 (scale bar: 5 µm). (C) Maximum z-projection of TIRF images of DsRed-Kv2.1 in a representative HEK293T cell cotransfected with Cav1.2 and auxiliary subunits (scale bar: 5 µm). (D, F) Maximum z-projections of TIRF images of sparklets in a representative HEK293T cell transfected with DsRed-Kv2.1, Cav1.2, and auxiliary subunits and loaded with Fluo-5F via the patch pipette, before (D) and after (F) treatment with 500 nM Bay K8644. (E, G) Merged images of panels C and D (E), or panels C and F (G). (H) Fluorescence intensity profiles of representative sparklets recorded in 20 mM external Ca2+ in a control cell (upper panel, ROI depicted in A) or in a cell additionally expressing Kv2.1 (lower panel, ROI depicted in D). (I) Fluorescence intensity profiles of representative sparklets recorded in 20 mM external Ca2+ and treated with Bay K8644 in a control cell (upper panel, ROI depicted in B) or in a cell additionally expressing Kv2.1 (lower panel, ROI depicted in F). (J) Summary data of sparklet site nPs measured from n = 6 cells expressing Cav1.2 alone and n = 7 cells coexpressing Cav1.2 and Kv2.1. Each point represents a single sparklet site (vehicle: *p=0.0367; Bay K: p=0.9224; two-tailed Mann-Whitney test). (K) Summary data of sparklet site nearest neighbor distance (NND) measured from n = 6 cells expressing Cav1.2 alone and n = 7 cells coexpressing Cav1.2 and Kv2.1. Each point represents a single sparklet site (vehicle: *p=0.0214; Bay K: p<0.0001; two-tailed Mann-Whitney test). (L) Summary data of the number of sparklet sites in n = 6 cells expressing Cav1.2 alone and n = 7 cells coexpressing Cav1.2 and Kv2.1. Each point represents a single cell (vehicle: *p=0.0318; Bay K: **p=0.0079; two-tailed t-test).
Figure 9
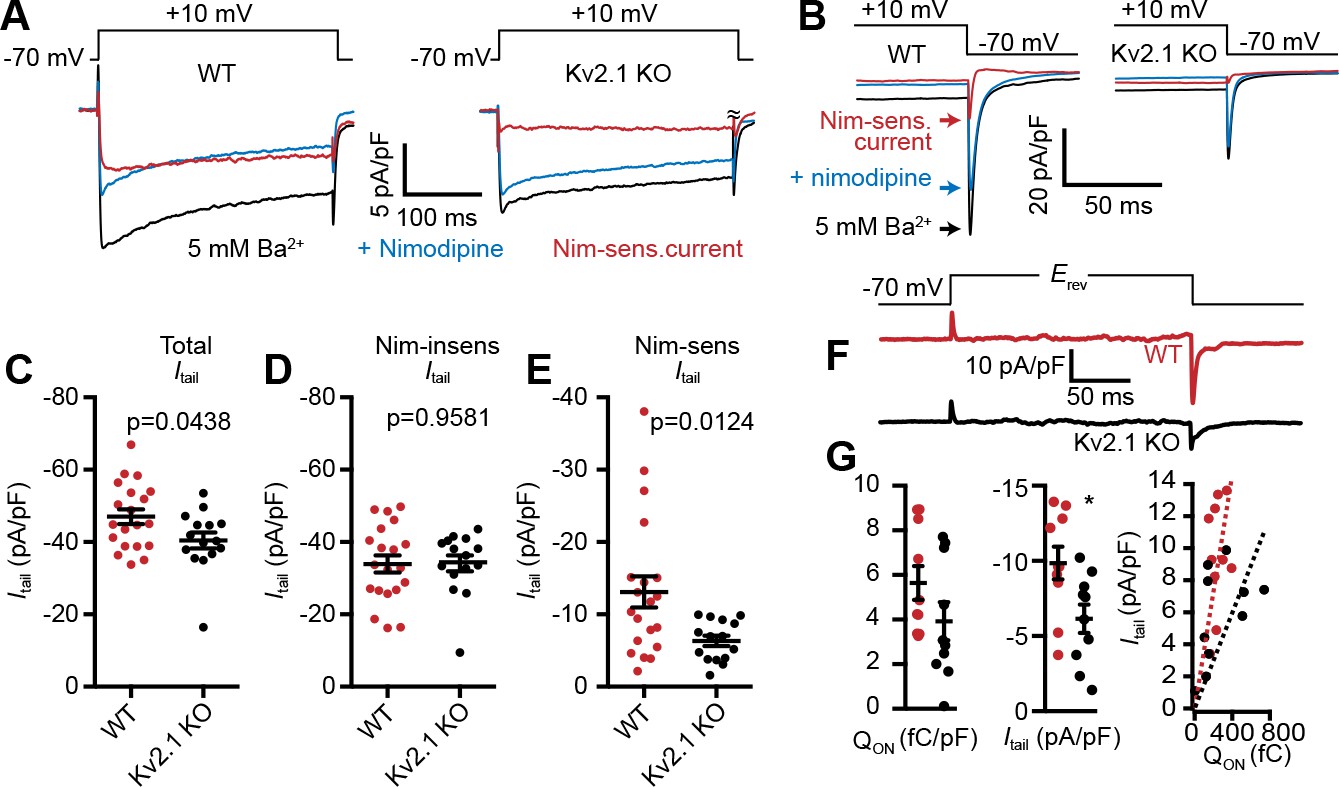
LTCC activity is reduced in Kv2.1 KO hippocampal neurons.
(A) Representative Ba2+ current traces recorded from WT (left) and Kv2.1 KO CHNs (right) recorded at +10 mV in vehicle or in the presence of the LTCC inhibitor nimodipine (10 µM). (B) Representative raw tail current records from a WT (left) and Kv2.1 KO (right) CHN induced by a step to −70 mV from a 10 mV prepulse, recorded in vehicle or in the presence of 10 µM nimodipine. C-F. Comparison of WT (red) and Kv2.1 KO (black) CHNs. (C) Maximum tail current amplitudes measured at −70 mV from a 10 mV prepulse. Each point represents one cell. (D) As in C but recorded in the presence of 10 µM nimodipine. (E) Maximum nimodipine-sensitive tail current amplitudes obtained from each cell by subtracting maximum tail current amplitudes measured in vehicle from those measured in the presence of nimodipine. (F) Representative nimodipine-sensitive LTCC gating and tail currents recorded from WT and Kv2.1 KO CHNs. (G) Quantification of nimodipine-sensitive LTCC Qon (left), Itail (center), and Qon vs.Itail (right) recorded from WT and Kv2.1 KO CHNs. Each point corresponds to a single cell (*p=0.019, Student’s t-test).
Figure 10
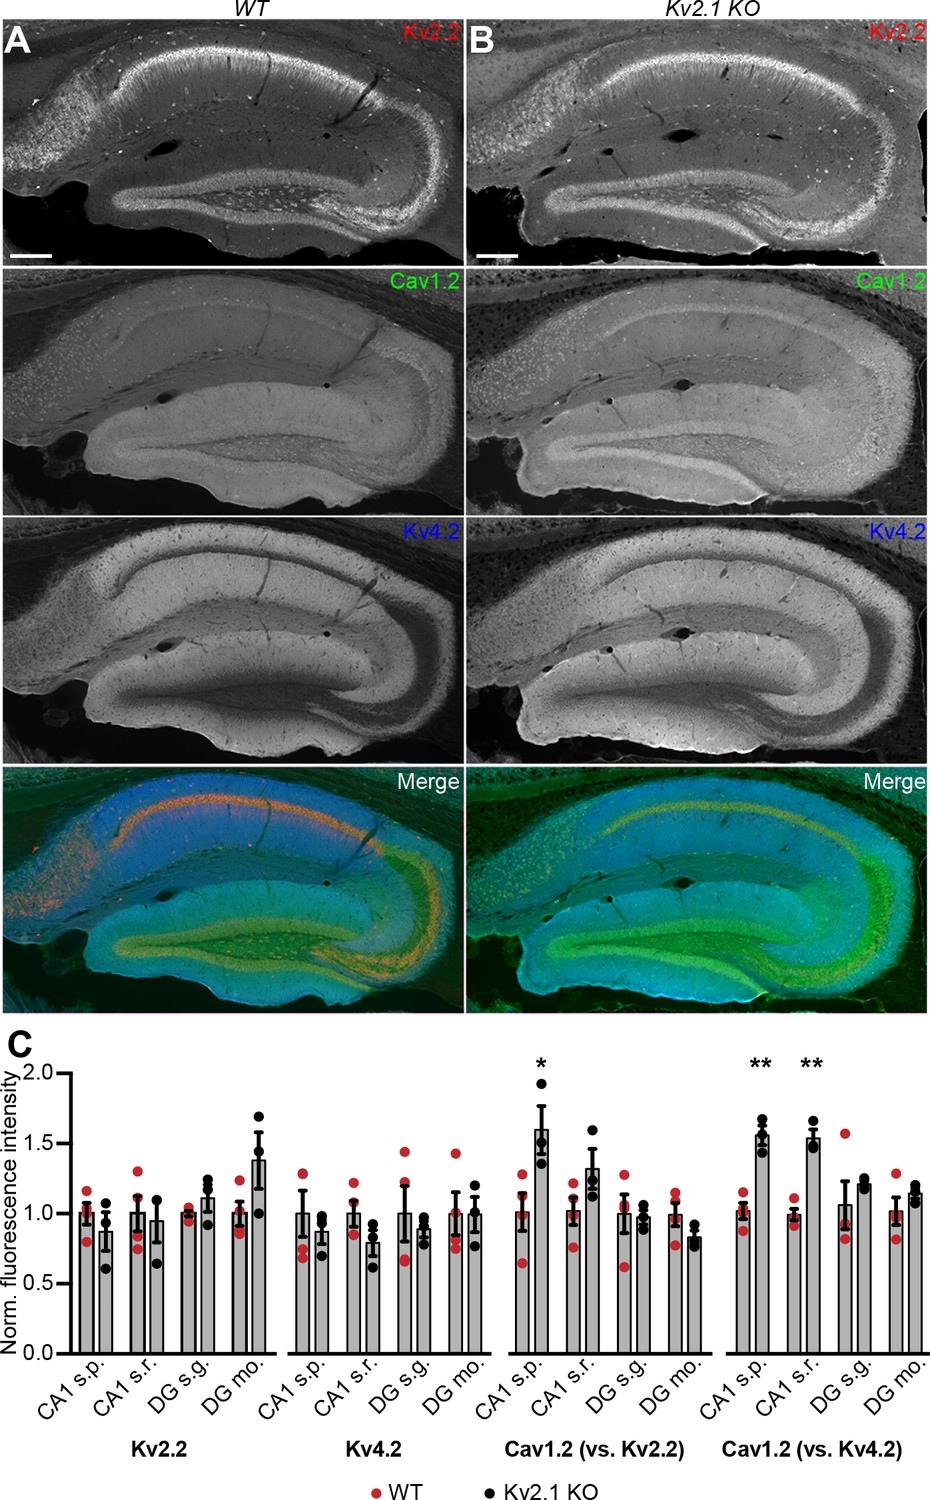
Increased immunolabeling for Cav1.2 in Kv2.1 KO brain sections.
(A) Column shows exemplar images of the hippocampus acquired from brain sections of adult WT mice immunolabeled for Kv2.2 (red), Cav1.2 (green) and Kv4.2 (blue) (scale bar: 200 μm). (B) As in A but acquired from Kv2.1 KO mice. (C) Summary graphs of normalized mean fluorescence intensity of Kv2.2, Kv4.2, and Cav1.2 immunolabeling from ROIs from various laminae within CA1 (s.p.: stratum pyramidale; s.r.: stratum radiatum) and DG (s.g.: stratum granulosum; mo: molecular layer) in brain sections from adult WT (red) and Kv2.1 KO (black) mice. Each point corresponds to an individual mouse (Cav1.2 vs. Kv2.2: *p=0.0408; Cav1.2 vs. Kv4.2: **p=0.0018, ***p=0.0007).
Figure 11

Reduced association of Cav1.2 and RyRs and decreased spark frequency in Kv2.1 KO CHNs.
(A) A single optical section image of a WT mouse CHN immunolabeled for Kv2.1, Cav1.2, and RyRs (scale bar: 10 μm). (B) As in D but acquired from a Kv2.1 KO mouse CHN. (C–F) Morphology and spatial distribution of the indicated parameters determined from WT and Kv2.1 KO CHNs (each point represents one cell; Student’s t-test). (C) *p=0.02255. (D) **p=0.0014. (E) p=0.1126. (F) *p=0.0173. (G) Representative WT mouse CHN loaded with Cal590 and imaged with TIRF microscopy, followed by post-hoc immunolabeling for RyRs, Kv2.1, and Cav1.2. Arrows indicate ROIs where spontaneous Ca2+ signals were detected; dashed circles indicate approximate regions where immunolabeling for Kv2.1, Cav1.2, and RyRs was detectable. Kymograph showing the localized Ca2+ release events detected at ROIs are depicted to the right. (H) Summary data of the amplitude, frequency and spatial spread (width) of all sparks recorded from WT and Kv2.1 KO mouse CHNs. Each point corresponds to a single cell (***p=0.0042; Student’s t-test). (I) Diagram illustrates a model for the molecular architecture of Kv2.1-associated EPJs.
Videos
Video 1
Spontaneous somatic Ca2+ signals detected at GCaMP3-Kv2.1 clusters in rat CHNs.
Stack of widefield images of a rat CHN transfected with GCaMP3-Kv2.1 and imaged at 10 Hz.
Video 2
Spontaneous somatic Ca2+ signals detected by TIRF microscopy in rat CHNs loaded with Cal-590 AM.
Stack of TIRF images of rat CHNs loaded with Cal-590 AM and imaged at 30 Hz. Regular wave-like signals are a TIRF imaging artifact. Images have been normalized to the first image without detectable Ca2+ signals (i.e., F/Fmin).
Video 3
Caffeine increases the frequency of somatic Ca2+ sparks in CHNs.
Images of a rat CHN transfected with GCaMP3-Kv2.1 acquired at 5 Hz. Neuron is treated with 5 mM caffeine at t = 84 s; the increased Ca2+ spark frequency is apparent from t = 87 s-101s. Images have been normalized to the first image without detectable Ca2+ signals (i.e., F/Fmin).
Video 4
Bay K8644 increases the frequency of somatic Ca2+ sparks in CHNs.
Rat CHN transfected with GCaMP3-Kv2.1 and imaged in the presence of 500 nM Bay K8644. Images were acquired at 11.3 Hz and have been normalized to the first image without detectable Ca2+ signals (i.e., F/Fmin).
Video 5
Video depicting increase in Ca2+ spark frequency upon addition of Bay K8644.
Rat CHN transfected with GCaMP3-Kv2.1 and imaged at 20 Hz. 500 nM Bay K 8644 is added starting at approximately t = 25 s. Non-normalized GCaMP3-Kv2.1 images are shown on the left, images normalized to the first image without detectable Ca2+ signals (i.e., F/Fmin) are shown in the center, and the same cell following fixation and immunolabeling for RyRs (red) and MAP2 (gray) is shown on the right.
Video 6
Tetracaine blocks Ca2+ sparks reconstituted in HEK293T cells.
Stack of TIRF images acquired at 20 Hz of a single HEK293T cell transfected with RyR2, Cav1.2, and auxiliary subunits and loaded with Cal-590 AM. 100 µM tetracaine was added at t = 7000 ms. Regular wave-like signals are a TIRF imaging artifact. Images have been normalized to the first image without detectable Ca2+ signals (i.e., F/Fmin).
Video 7
Ca2+ sparklets in a control HEK293T cell expressing Cav1.2.
Stack of TIRF images acquired at approximately 100 Hz of a single HEK293T cell transfected with Cav1.2, PKCα, and auxiliary subunits and loaded with Fluo-5F via the patch pipette, before (left) and after (right) application of 500 nM Bay K8644. Each pixel has been normalized to its minimum pixel intensity (i.e., F/Fmin).
Video 8
Ca2+ sparklets in a HEK293T cell coexpressing Cav1.2 and Kv2.1.
Stack of TIRF images acquired at approximately 33 Hz of a single HEK293T cell transfected with Cav1.2, DsRed-Kv2.1P404W, PKCα, and auxiliary subunits and loaded with Fluo-5F via the patch pipette, before (left) and after (right) application of 500 nM Bay K8644. Each pixel has been normalized to its minimum pixel intensity (i.e., F/Fmin).
Tables
Table 1
LTCC subunits and other Ca2+ signaling proteins specifically copurifying with Kv2.1
https://doi.org/10.7554/eLife.49953.005| Protein | Rank | Mean | SEM (n = 3) |
|---|---|---|---|
| Kv2.1 | 1 | 100.000 | NA |
| Kv2.2 | 3 | 31.638 | 0.518 |
| VAPA | 5 | 25.344 | 1.733 |
| RyR3 | 10 | 12.477 | 0.881 |
| Cavβ4 | 12 | 11.133 | 1.411 |
| VAPB | 15 | 7.600 | 1.393 |
| Cavβ2 | 18 | 5.623 | 0.79 |
| Cav1.3 | 19 | 5.730 | 1.652 |
| Cavβ3 | 23 | 5.070 | 1.033 |
| Hippocalcin | 24 | 4.583 | 0.831 |
| Neurocalcin-delta | 25 | 4.590 | 0.856 |
| SR/ER calcium ATPase 2 | 28 | 4.226 | 2.4 |
| Hippocalcin-like protein 1 | 29 | 4.360 | 0.288 |
| Cavβ1 | 33 | 3.800 | 0.697 |
| Calcineurin catalytic subunit γ | 35 | 3.583 | 0.718 |
| RyR2 | 36 | 3.140 | 0.903 |
| Calcineurin subunit B | 37 | 3.197 | 0.469 |
| Calcium-transporting ATPase | 39 | 2.873 | 0.447 |
| SR/ER calcium ATPase 1 | 40 | 2.530 | 1.21 |
| Cav1.2 | 43 | 2.427 | 0.766 |
-
Values in table are spectral counts normalized to Kv2.1 over three independent experiments.
Key resources table
| Reagent type (species) or resource | Designation | Source or reference | Identifiers | Additional information |
|---|---|---|---|---|
| Cell line (Human) | HEK293T | ATCC Cat # CRL-3216 | RRID:CVCL_0063 | |
| Strain (R. norvegicus) | Sprague Dawley | Charles River | ||
| Strain (M. musculus) | C57/BL6J mice | The Jackson Laboratory | RRID:IMSR_JAX:000664 | |
| Strain (M. musculus) | Kcnb1-/- mice | PMID: 17767909; PMID: 24494598 | RRID:MGI:3806050 | maintained on the C57BL/6J background |
| Antibody | numerous | See Table 2 | ||
| Recombinant DNA reagent | GCaMP3-Kv2.1 | This paper | ||
| Recombinant DNA reagent | GCaMP3-Kv2.1P404W | This paper | ||
| Recombinant DNA reagent | DsRed-Kv2.1 | PMID: 30012696 | ||
| Recombinant DNA reagent | DsRed-Kv2.1P404W | PMID: 30012696 | ||
| Recombinant DNA reagent | DsRed-Kv2.2 | PMID: 30012696 | ||
| Recombinant DNA reagent | Kv2.1S586A | PMID: 10719893 | ||
| Recombinant DNA reagent | Kv1.5 | PMID: 8636142 | ||
| Recombinant DNA reagent | BFP-Sec61β | Addgene | Plasmid #49154 | |
| Recombinant DNA reagent | Cav1.2-eGFP | PMID: 25714924 | ||
| Recombinant DNA reagent | Cav1.2-tagRFP | PMID: 25714924 | ||
| Recombinant DNA reagent | Cav1.3S-GFP | PMID: 27187148 | ||
| Recombinant DNA reagent | Cav1.2 | Addgene | Plasmid #26572 | |
| Recombinant DNA reagent | Cav1.2-HA | PMID: 15090038 | Gift from Dr. Valentina Di Biase | |
| Recombinant DNA reagent | Cavα2δ1 | Addgene | Plasmid #26575 | |
| Recombinant DNA reagent | Cavβ3 | Addgene | Plasmid #26574 | |
| Recombinant DNA reagent | YFP-RyR2 | PMID: 17452324 PMID: 20427316 | Gift from Dr. S.R. Wayne Chen | |
| Recombinant DNA reagent | STAC1 | DNASU | Plasmid # HsCD00445396 | |
| Chemical compound | Cal-590 AM | AAT Bioquest | Cat# 20510 | |
| Chemical compound | Rhod-2 | AAT Bioquest | Cat# 21068 | |
| Chemical compound | Fluo-4 AM | Invitrogen | Cat# F14201 | |
| Chemical compound | Fluo-5F | Invitrogen | Cat# F14221 | |
| Chemical compound | Caffeine | Sigma | Cat# C0750 | |
| Chemical compound | Thapsigargin | Millipore | Cat# 586005 | |
| Chemical compound | Nimodipine | Alomone | Cat# N-150 | |
| Chemical compound | Nitrendipine | Alomone | Cat# N-155 | |
| Chemical compound | Bay K8644 | Alomone | Cat# B-350 | |
| Chemical compound | Tetracaine | Sigma | Cat# T7508 | |
| Chemical compound | Tetrodotoxin | Alomone | Cat #T-550 | |
| Chemical compound | Amphotericin B | Millipore | Cat# 171375 | |
| Software | Photoshop | Adobe Systems | RRID:SCR_014199 | |
| Software | Axiovision | Carl Zeiss MicroImaging | RRID:SCR_002677 | |
| Software | pClamp | Molecular Devices | RRID:SCR_011323 | |
| Software | TILLvisION | TILL Photonics | ||
| Software | Fiji | PMID: 22743772 | RRID:SCR_002285 | |
| Software | Prism | GraphPad Software | RRID:SCR_002798 |
Table 2
Antibody information.
https://doi.org/10.7554/eLife.49953.029| Antigen and antibody name | Immunogen | Manufacturer information | Concentration used | Figures |
|---|---|---|---|---|
| PSD-95 (K28/43) | Fusion protein aa77–299 of human PSD-95 | Mouse IgG2a mAb, NeuroMab, RRID:AB_10807979 | Tissue culture supernatant (1:5) | Figure 1 |
| Cav1.2 (N263/31) | Fusion protein aa 808–874 of rat Cav1.2 | Mouse IgG2b mAb, NeuroMab, RRID:AB_11001554 | Tissue culture supernatant (1:5) | Figure 1, Figure 2, Figure 2—figure supplement 1, Figure 6, Figure 10, Figure 11 |
| Cav1.2 (L57/23) | Fusion protein aa1507–1733 of rabbit Cav1.2 | Mouse IgG2a mAb, In-house (Trimmer Laboratory) RRID:AB_2802123 | Tissue culture supernatant, neat | Figure 1, Figure 3 |
| Cav1.3 (ACC-005) | Synthetic peptide aa 859–875 of rat Cav1.3 | Rabbit pAb, Alomone catalog # ACC-005, RRID:AB_2039775 | Affinity purified, 10 μg/mL | Figure 1 |
| Kv2.1 (KC) | Synthetic peptide aa 837–853 of rat Kv2.1 | Rabbit pAb, In-house (Trimmer Laboratory), RRID:AB_2315767 | Affinity purified, 1:100 | Table 1 (immunopurifications) |
| Kv2.1 (K89/34R) | Synthetic peptide aa 837–853 of rat Kv2.1 | Recombinant mouse IgG2a mAb, In-house (Trimmer Laboratory), RRID:AB_2750677 | Tissue culture supernatant (1:5) | Figure 1, Figure 2, Figure 3, Figure 3—figure supplement 2, Figure 4, Figure 11 |
| Kv2.1 (K39/25R) | Synthetic peptide aa 211–229 of human Kv2.1 | Recombinant mouse IgG2a mAb, In-house (Trimmer Laboratory), RRID:AB_2750663 | Tissue culture supernatant (1:5) | Figure 3—figure supplement 1 |
| MAP2 (AB5622-I) | KLH-conjugated three peptides from N-and C-terminal regions of rat MAP2 | Rabbit pAb, Millipore catalog # AB5622-I, RRID: AB_2800501 | Affinity purified, 1:1000 | Figure 1, Figure 4, Figure 5 |
| RyRs (34C) | Partially purified chicken pectoral muscle ryanodine receptor | Mouse IgG1 mAb, Developmental Studies Hybridoma RRID:AB_528457 | Concentrated tissue culture supernatant, 3 μg/ml | Figure 1, Figure 2, Figure 4, Figure 5, Figure 6, Figure 11 |
| Cav3.1 (N178A/9) | Fusion protein aa 2052–2172 of mouse Cav3.1 | Mouse IgG1 mAb, NeuroMab, RRID:AB_10673097 | Tissue culture supernatant (1:5) | Figure 3—figure supplement 2 |
| Kv1.5 (Kv1.5e) | Synthetic peptide aa 271–284 of rat Kv1.5 | Rabbit pAb, in-house (Trimmer Laboratory), RRID:AB_2722698 | Affinity purified, 5 μg /ml | Figure 3—figure supplement 1 |
| Kv2.2 (Kv2.2C) | Fusion protein aa 717–907 of rat Kv2.2 | Rabbit pAb, in-house (Trimmer Laboratory), RRID:AB_2801484 | Affinity purified, 1:100 | Figure 2—figure supplement 1, Figure 10 |
| Kv4.2 (K57/41) | Synthetic peptide aa 209–225 of human Kv4.2 | Mouse IgG1 mAb, In-house (Trimmer Laboratory), RRID:AB_2802124 | Affinity purified, 10 μg /ml | Figure 1, Figure 10 |
| Anti-HA (12CA5) | Amino acids 98–106 of the human influenza virus hemagglutinin protein | Mouse IgG2b mAb, In-house (Trimmer Laboratory) RRID: AB_2532070 | Pure, 5 μg/mL | Figure 3 |
| Anti-HA (2–2.2.14-647) | HA peptide YPYDVPDYA | Mouse IgG1 mAb, Thermo Fisher Scientific catalog # 26183-A647, RRID: AB_2610626 | Affinity purified, 1 μg /ml | Figure 3—figure supplement 1 |
Additional files
-
Transparent reporting form
- https://doi.org/10.7554/eLife.49953.030
Download links
A two-part list of links to download the article, or parts of the article, in various formats.
Downloads (link to download the article as PDF)
Open citations (links to open the citations from this article in various online reference manager services)
Cite this article (links to download the citations from this article in formats compatible with various reference manager tools)
Kv2.1 mediates spatial and functional coupling of L-type calcium channels and ryanodine receptors in mammalian neurons
eLife 8:e49953.
https://doi.org/10.7554/eLife.49953


