Coopted temporal patterning governs cellular hierarchy, heterogeneity and metabolism in Drosophila neuroblast tumors
- Aix Marseille Univ, CNRS, IBDM, Equipe Labellisée LIGUE Contre le Cancer, France
- Université Côte d’Azur, CNRS, Inserm, Institut de Biologie Valrose, France
Figures
Figure 1 with 5 supplements
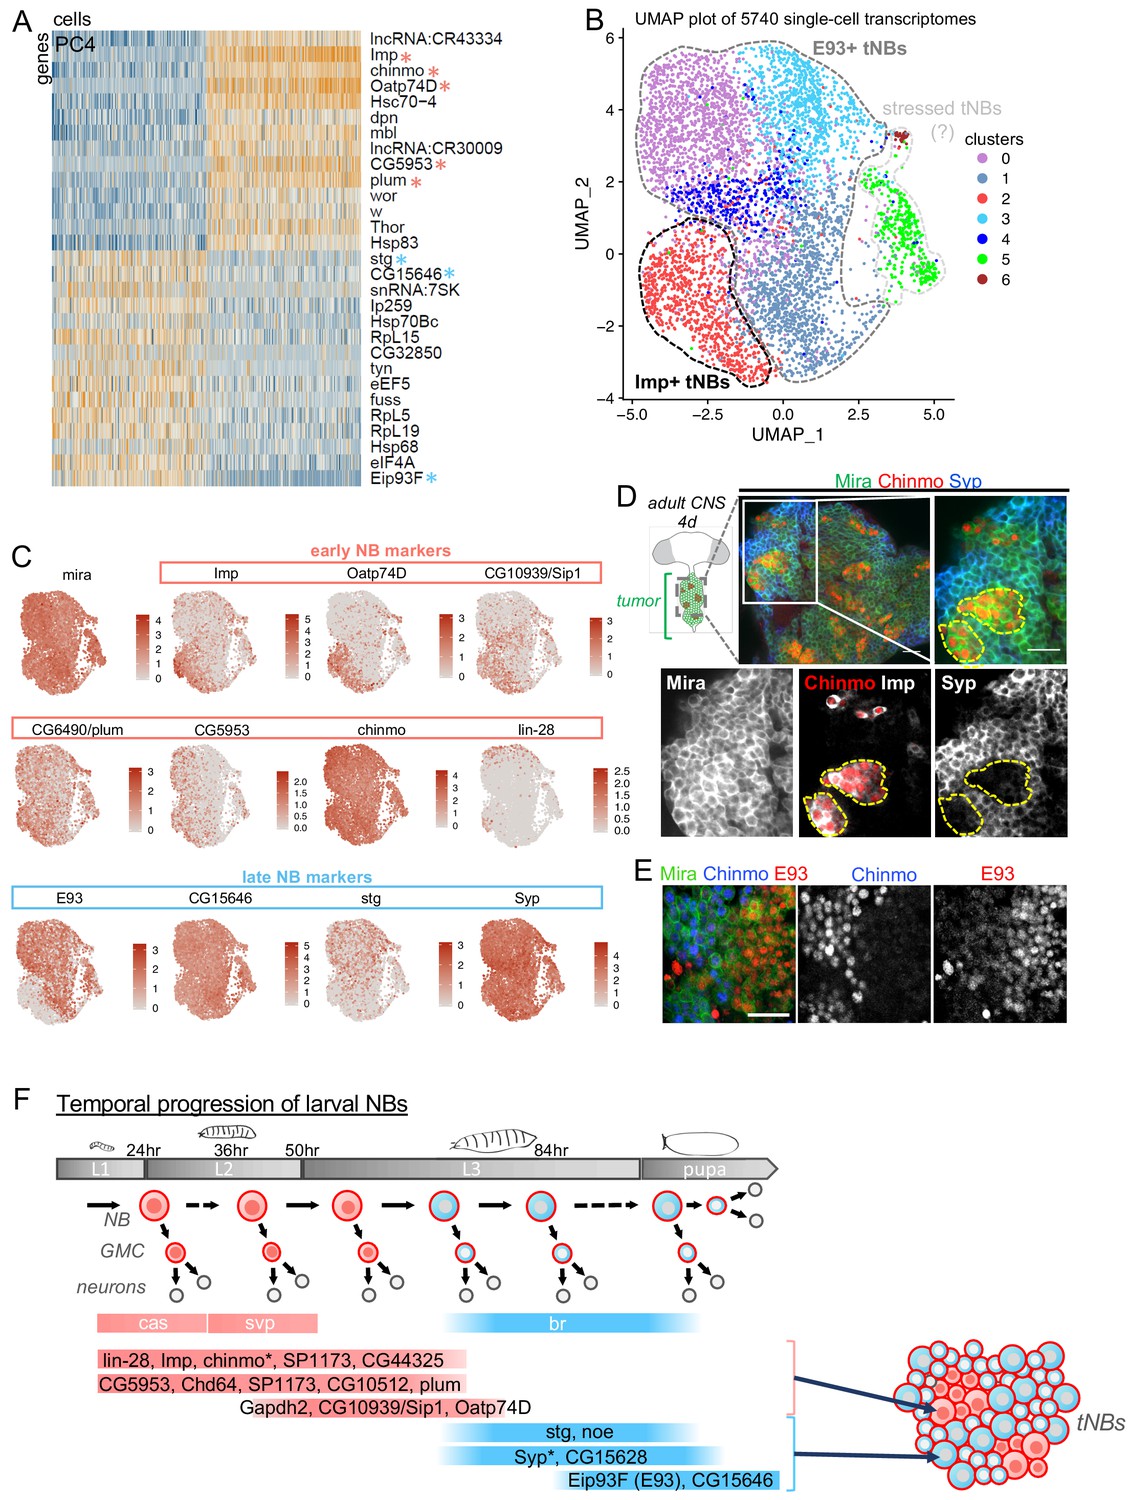
Single-cell RNA-seq identifies a subset of temporal patterning genes that are redeployed in NB tumors defining heterogeneity in NB states.
(A) PCA was performed on single-cell tNB transcriptomes to reduce the dimensions of the data for further analysis. Genes (rows) and cells (columns) are ordered by their PCA scores, and the 500 most extreme cells and 30 most extreme genes on both sides of the distribution are shown in the heatmap. PC4 reveals that tNBs can be discriminated by the expression of early (light red asterisks) vs late (light blue asterisks) larval NB temporal patterning genes. Other larval temporal genes are found in PC3 and PC7 (Figure 1—figure supplement 1C). (B) The UMAP representation of all single cells included in our analysis shows the separation of different clusters. We used a k-nearest neighbor algorithm to call seven clusters, which are shown in different colors on the UMAP plot. (C) Expression of Mira, early and late temporal markers on the UMAP map shown in B. (D) Cartoon representing a ventral view of an adult CNS containing a NB tumor induced during larval stages in the VNC. Green circles are tNBs. Green circles colored in red represent Chinmo+Imp+ tNBs. Immunostainings with anti-Chinmo, anti-Imp and anti-Syp, indicating that Imp/Chinmo and Syp are expressed in a complementary pattern in poxn > prosRNAi tumors found in 4-day-old adults. tNBs are labeled with Mira. Scale bar 20 µm. (E) Immunostainings with anti-Chinmo and anti-E93 indicating that these two transcription factors are expressed in a complementary pattern in poxn > prosRNAi tumors found in 4-day-old adults. tNBs are marked with anti-Mira. Scale bar 20 µm. (F) The light red and blue colors respectively designate ‘early’ and ‘late’ larval NB genes as determined by Liu et al. (2015), Syed et al. (2017) and Ren et al. (2017). A subset of these genes are redeployed in tumors to define distinct tNB states. Asterisks mark temporal patterning genes regulated at the post-transcriptional level in tNBs. Note that cas and svp transcription is associated with early Imp+ NBs, while br transcription is associated with late E93+ NBs during larval stages. In contrast, cas, svp and br transcription do not distinguish Imp+ and E93+ tNBs.
Figure 1—figure supplement 1
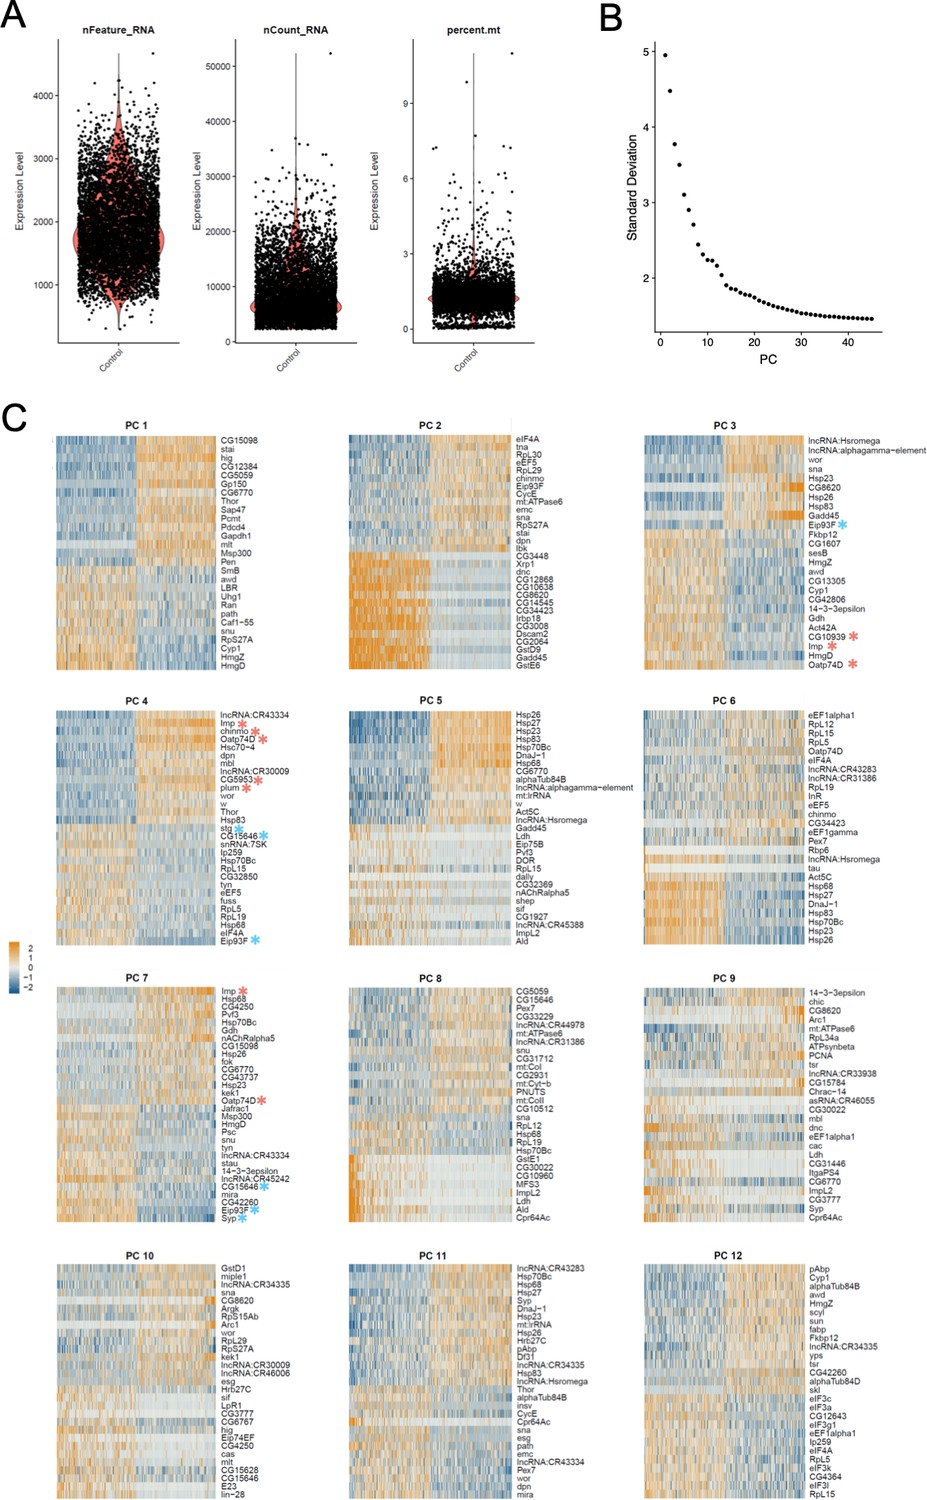
Seurat analysis of the single-cell transcriptomic data, with regression of cell-cycle genes.
(A) Plots depicting the number of genes detected in each cell (nFeature_RNA), the number of unique RNA molecules detected in each cells (nCount-RNA), and the percentage of reads mapping to the mitochondrial genome (percent.mt). (B) Plot of the standard deviations of PCs used to determine the number of PCs to include in downstream analyses of the RNA-seq analysis. (C) Heatmaps depicting the composition of the first 12 PCs. Light red asterisks mark early larval temporal patterning genes. Blue asterisks mark late larval temporal patterning genes.
Figure 1—figure supplement 2
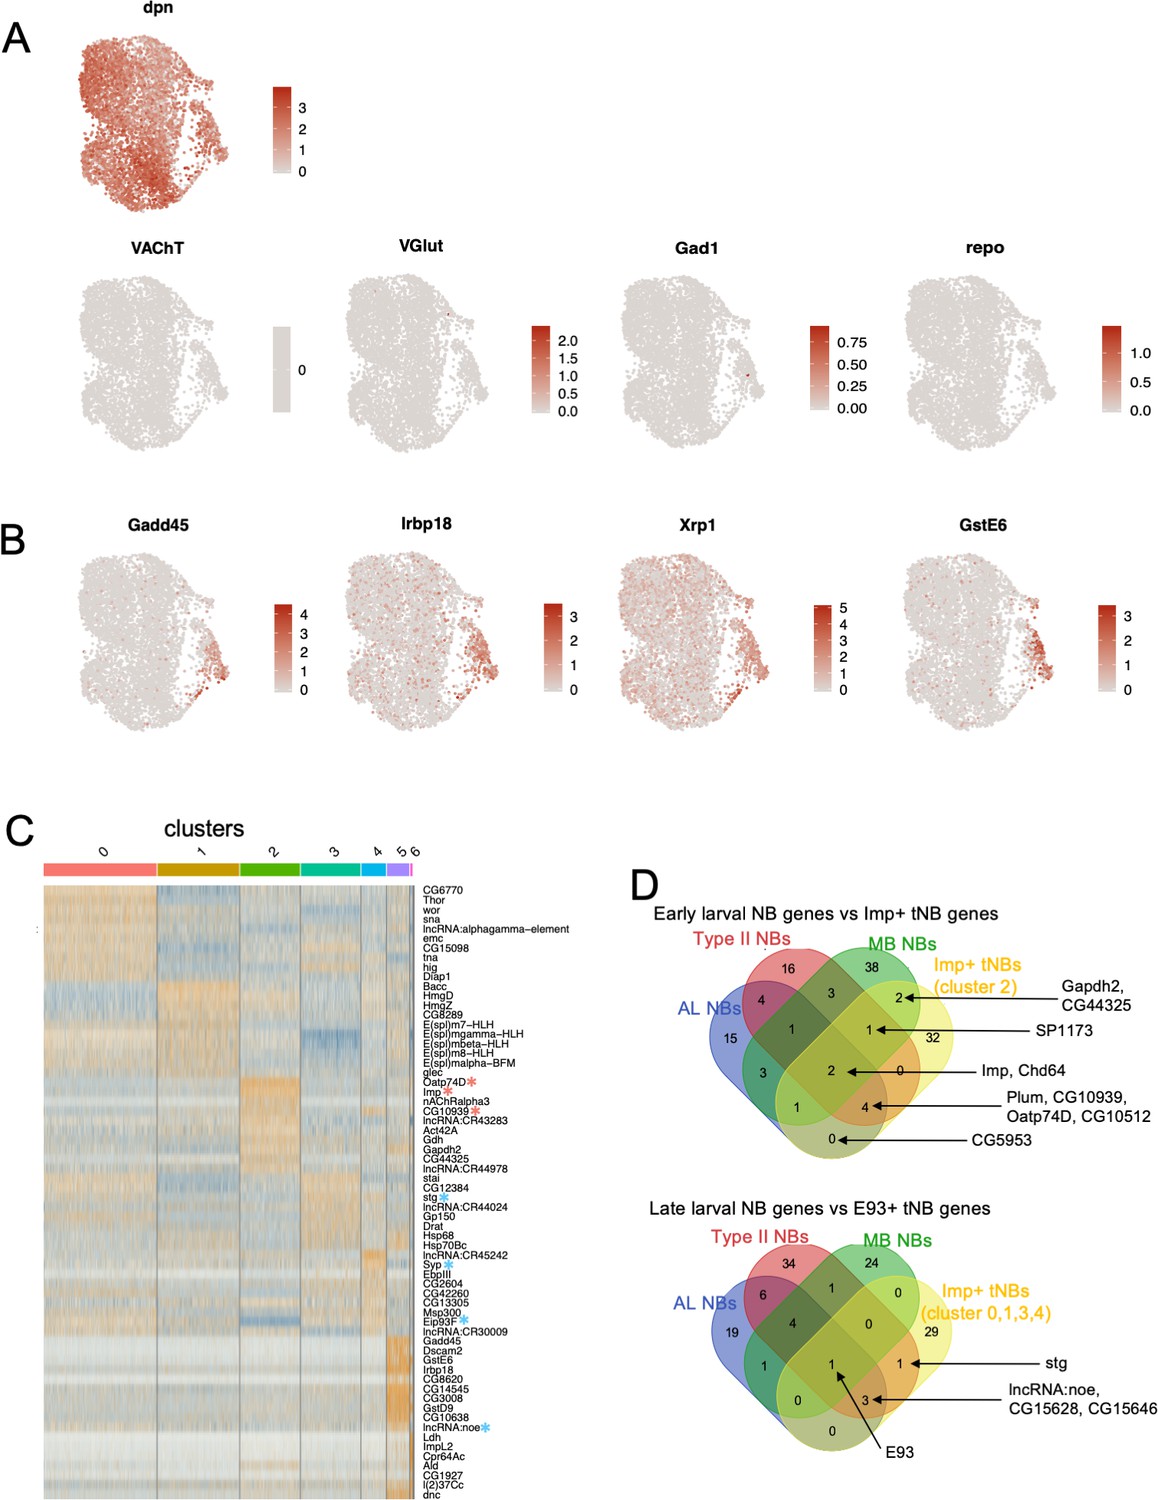
Characterizing tNBs by their transcriptome.
(A) Expression levels of various marker genes for NBs (dpn); cholinergic, glutamatergic and GABAergic neurons (VAChT, VGlut and Gad1 respectively); and glia (repo); on the UMAP map. (B) Expression levels of genes enriched in the small clusters 5 and 6. (C) Heatmap depicting the top 10 most highly expressed genes in each cluster compared to all other clusters. Cluster three is highly enriched in early larval NB markers (red asterisks). (D) Upper Venn diagram depicts overlaps between genes, the expression of which is enriched in early NBs of various lineages (Mushroom Body (MB), Antennal Lobe (LB), Type II)) and in cluster 2 of tNBs. Lower Venn diagram depicts overlaps between genes enriched in late NBs of various lineages (MB, AL, Type II) and in cluster 0,1,3,4 of tNBs. Early or late temporal NB genes overlapping with tumor genes are indicated.
Figure 1—figure supplement 3
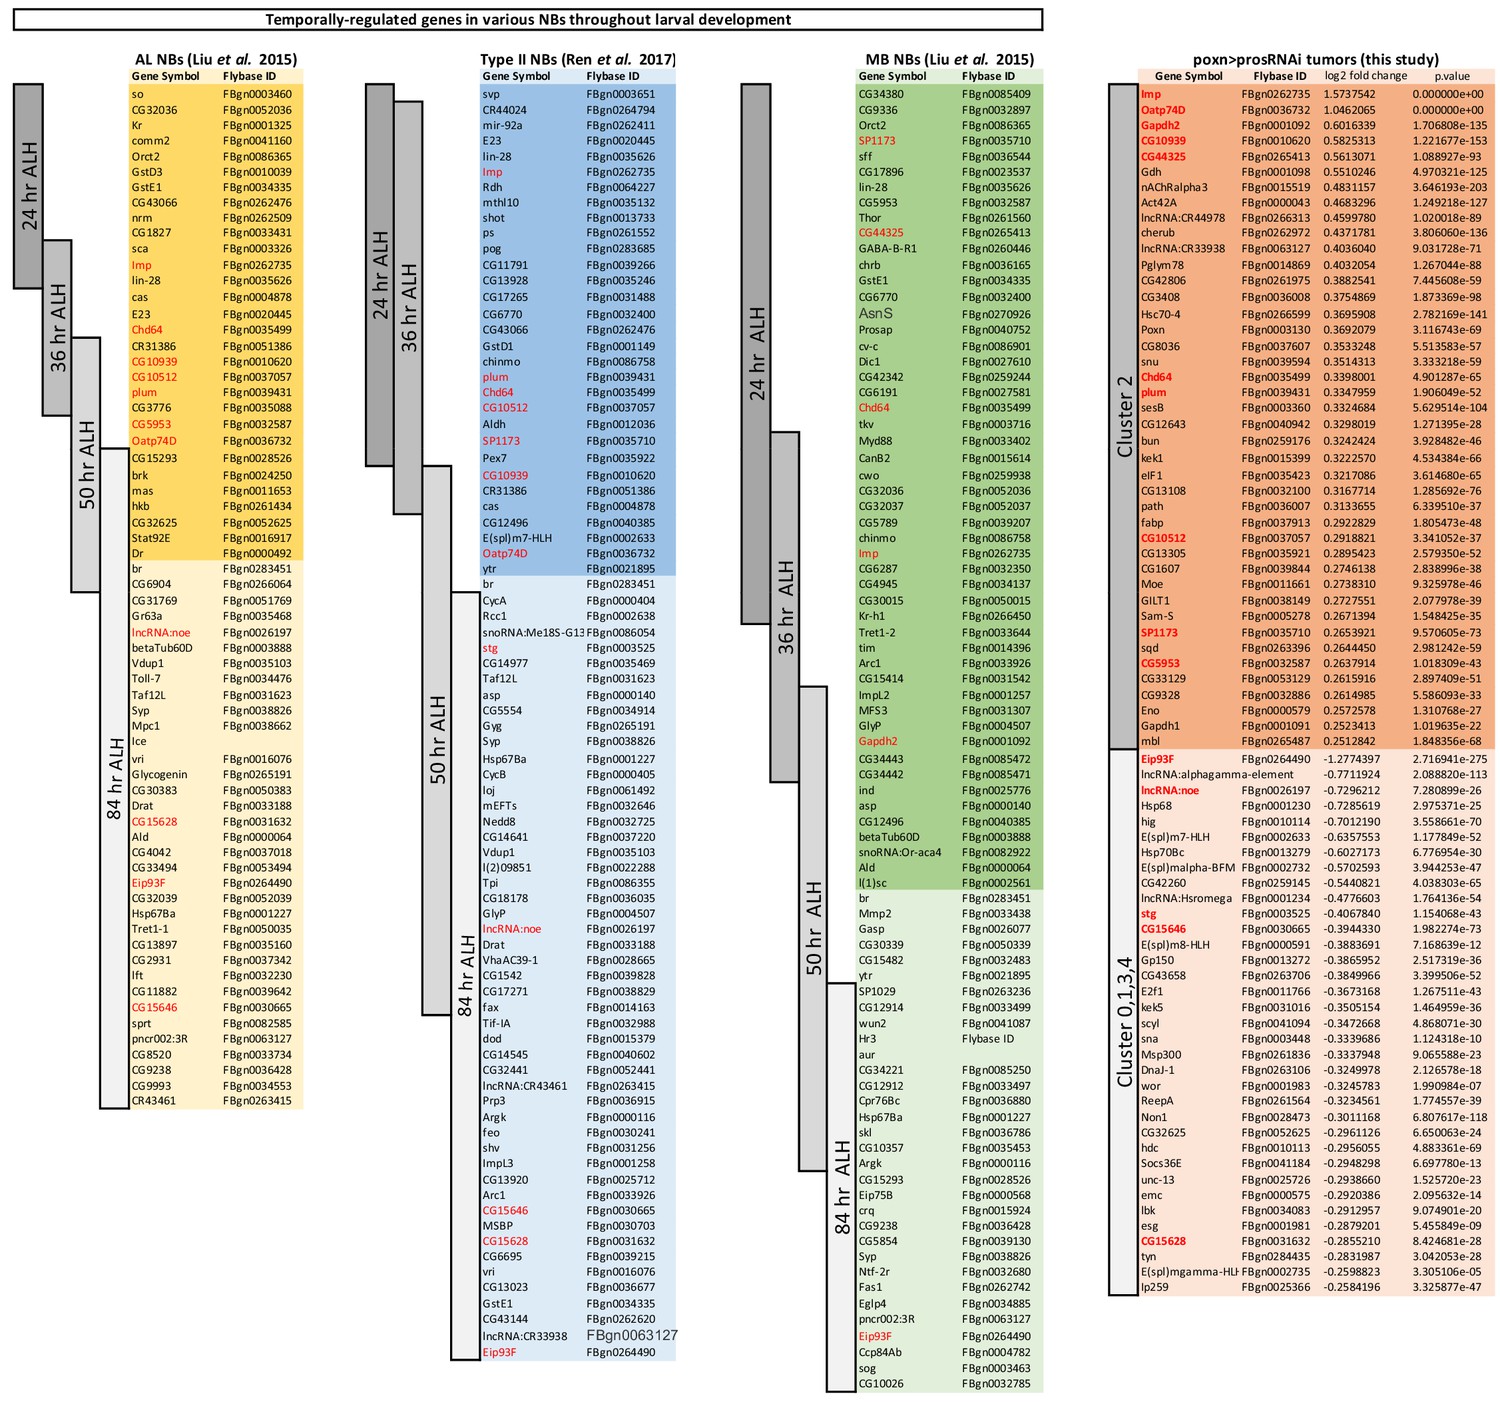
Comparison of genes that are temporally regulated genes in various larval NBs with genes defining clusters in the UMAP representation of the NB tumor.
Lists of genes enriched in NBs at various timepoints during larval development (24 hr after larval hatching (ALH), 36 hr, 50 hr, 84 hr). Lists have been extracted for Mushroom body (MB) NBs, antennal lobe (AL) NBs and type Liu et al. (2015) and Ren et al. (2017). Darks backgrounds encompass early genes, while light backgrounds encompass late larval genes. Expression of the gene br, a well-known marker for late NBs, has been chosen as the transition time from an early to late stage. Dark and light orange backgrounds represent genes that distinguish the Imp+ Cluster two from the E93+ Clusters 0,1,3,4 in the UMAP representation of tumor cells. A subset of temporal patterning genes highlighted in red distinguish Imp+ or E93+ clusters in the tumors.
Figure 1—figure supplement 4
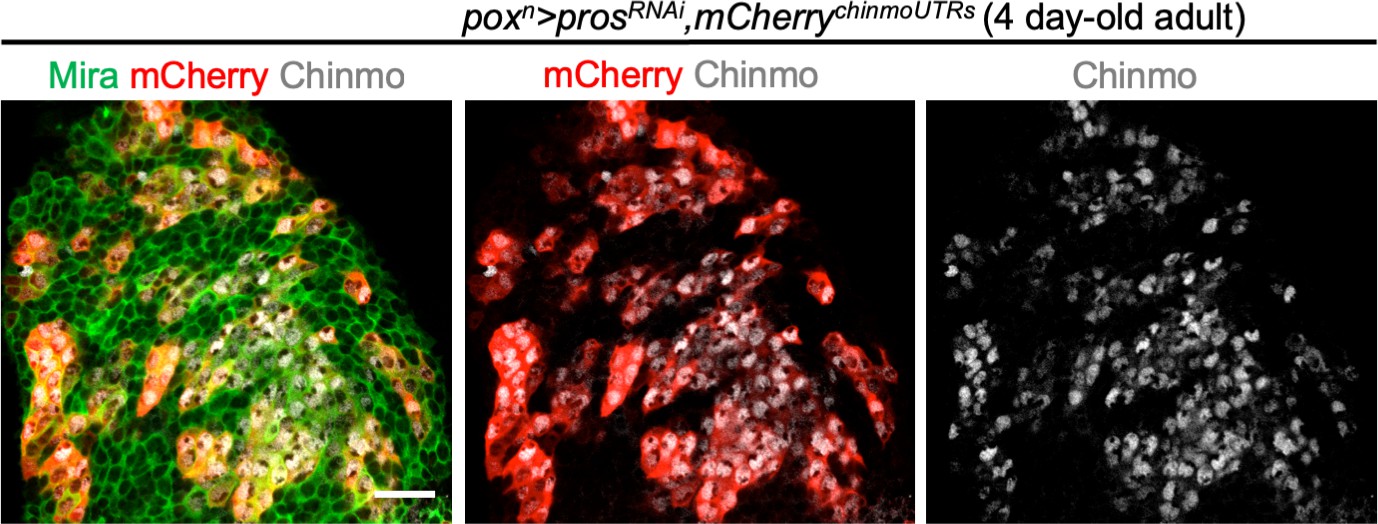
Post-transcriptional regulation of chinmo in poxn > prosRNAi NB tumors.
The UAS-mCherrychinmoUTRs transgene (Dillard et al., 2018) is transcribed in all tNBs using the poxn-GAL4 driver. However, the mCherry protein (anti-RFP immunostaining in red) is only present in tNBs that express endogenous Chinmo (anti-Chinmo immunostaining in grey). This demonstrates post-transcriptional regulation via the chinmo UTRs in tNBs. This is consistent with the ubiquitous presence of chinmo mRNA in all tNBs as detected with the single-cell RNA-seq protocol.
Figure 1—figure supplement 5
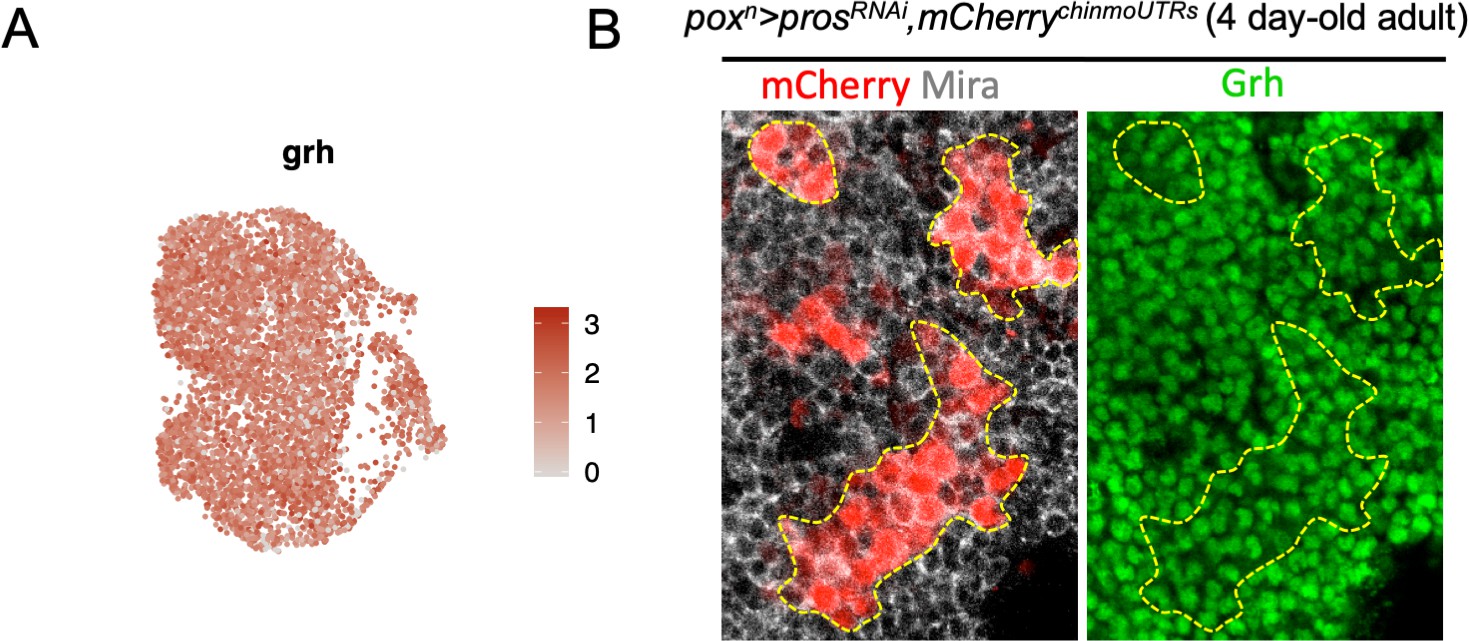
Grh is expressed in all tNBs.
(A) grh mRNA is detected in most if not all tNBs throughout the UMAP representation. (B) All tNBs in 4 day-old adult express grh as shown by immunostainings.
Figure 2 with 1 supplement

Dynamics of cell heterogeneity in poxn > prosRNAi NB tumors.
(A,B) Cartoons represent a ventral view of the Drosophila CNS at late L2 and late L3. Gray circles represent normal NBs. Green circles are prosRNAi tNBs. Red tNBs express chinmo. Tumors were induced by knocking down pros in six NBs located in the VNC, throughout larval development, using the poxn-Gal4, UAS-prosRNAi, UAS-GFP, UAS-dicer2 system (poxn > prosRNAi). Because chinmo is always co-expressed with Imp in NBs, we use either anti-Chinmo or anti-Imp to label Chinmo+Imp+ tNBs. We also used Syp to label Syp+E93+ tNBs. (A) poxn > prosRNAi initially induces pools of tNBs all expressing Chinmo in early larvae (L2). tNBs are marked with anti-Mira and anti-GFP. (B) In late larvae (L3), poxn > prosRNAi tumors are composed by two distinct populations of tNBs respectively expressing Chinmo and Syp. Tumors are marked with anti-GFP and delineated by dashed lines. (C) Mitotic Imp+ tNBs and Syp+tNBs are marked with anti-PH3 in poxn > prosRNAi tumors persisting in 4-day-old adults. (D) Quantification of the mitotic index of Chinmo+Imp+ tNBs (n = 7 VNCs) and Syp+E93+ tNBs (n = 7 VNCs) in poxn > prosRNAi tumors of 4-day-old adults. p=0.0006. (E) Proportion of Chinmo+Imp+ tNBs over all tNBs composing tumors (volumes of each population are measured) at 8 days (8d) (n = 5), 10d (n = 6), 11d (n = 6) and 15d (n = 6) after tumor induction. Each dot represents the % for one tumor. (F) Scheme depicting the dynamics of tumor composition: from a homogeneous pool of Chinmo+Imp+ tNBs in early larvae to a heterogeneous tumor with a minor population of Chinmo+Imp+ and a majority of Syp+E93+ tNBs. Scale bars, 20 µm.
Figure 2—figure supplement 1

poxn > prosRNAi tumors exhibit low levels of neuronal differentiation in adults.
The G-TRACE system allows the permanent GFP labeling of neurons generated by poxn > prosRNAi tNBs. Tumor neurons, marked with anti-GFP and anti-Elav, are usually grouped and represent a minor population of cells poorly contributing to tumor mass in 4-day-old poxn > prosRNAi adult tumors. Tumor neurons localize outside the Chinmo+Imp+ tNB clusters marked with anti-GFP and anti-Imp.
Figure 3 with 1 supplement

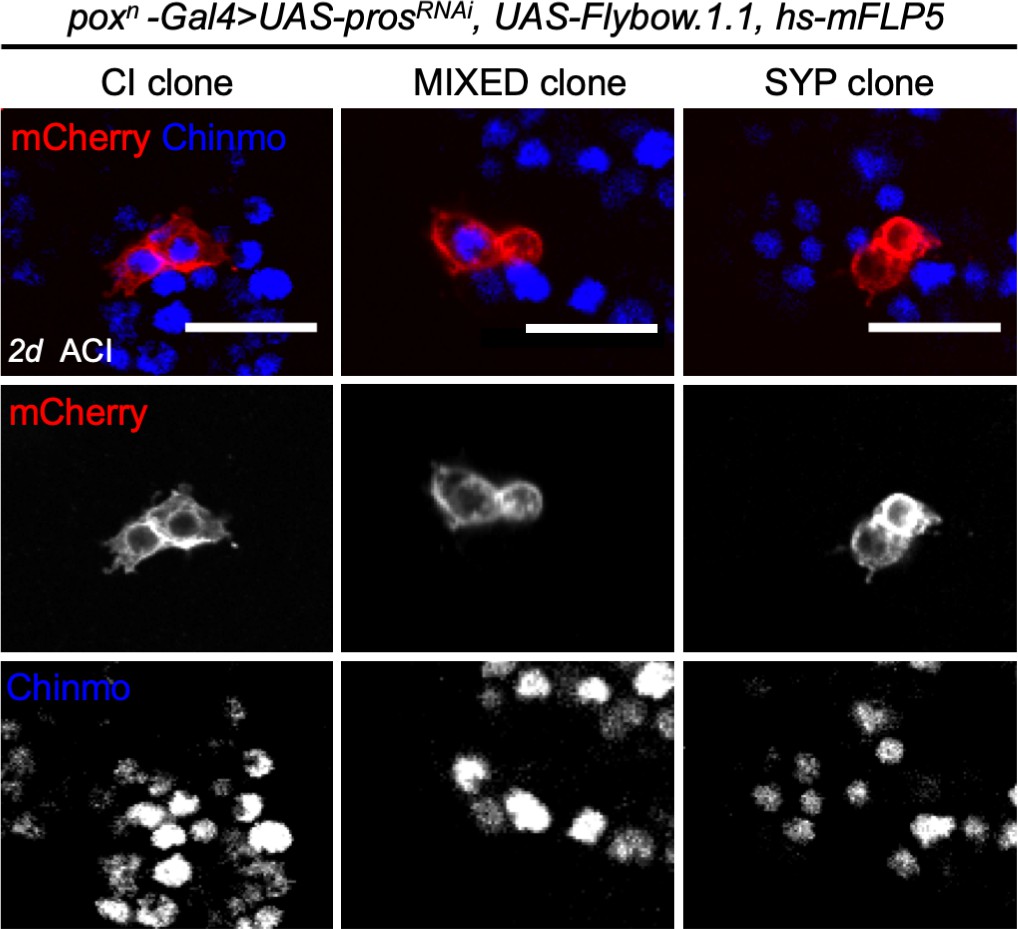
Clonal analysis in poxn > prosRNAi NB tumors.
(A) Clones are labeled with mCherry and observed 8 hours (8h), 2 days (2d), 4 days (4d) and 8 days (8d) after clonal induction (ACI) in poxn > prosRNAi tumors. mCherry- tNBs are GFP+. Images represent one confocal section. (B) 3D projections of clones 8 hr, 2d, 4d and 8d ACI. The color-code labels clones according to their volume. (C) Three categories of clones can be identified in poxn > prosRNAi tumors: clones composed of Chinmo+Imp+ tNBs only (CI clones), clones composed of both Chinmo+Imp+ and Syp+E93+ tNBs (MIXED clones), and clones composed of Syp+E93+ tNBs only (SYP clones). Chinmo+Imp+ tNBs are identified by the presence of Chinmo. Syp+ tNBs are identified by the absence of Chinmo. (D) Proportion of CI (red), MIXED (gray) and SYP (blue) clones 8h, 2d, 4d and 8d ACI. Proportion of CI clones 8h ACI (n = 117 clones from 4 VNCs); 2d ACI (n = 75 clones from 4 VNCs); 4d ACI (n = 13 clones from 5 VNCs); 8d ACI (n = 17 clones from 5 VNCs). P between CI clones at 8h and 2d ACI -> PCI8h/2d = 0.2; PCI2d/4d = 0.016; PCI4d/8d = 0.88. Proportion of MIXED clones 8h ACI (n = 8 clones from 4 VNCs); 2d ACI (n = 28 clones from 4 VNCs); 4d ACI (n = 57 clones from 5 VNCs); 8d ACI (n = 66 clones from 5 VNCs). PMIXED8h/2d = 0.029; PMIXED2d/4d = 0.016; PMIXED4d/8d = 0.31. Proportion of SYP clones 8h ACI (n = 181 clones from 4 VNCs); 2d ACI (n = 196 clones from 4 VNCs); 4d ACI (n = 200 clones from 5 VNCs); 8d ACI (n = 255 clones from 5 VNCs). PSYP8h/8d = 0.016. Scale bars, 20 µm.
Figure 3—figure supplement 1
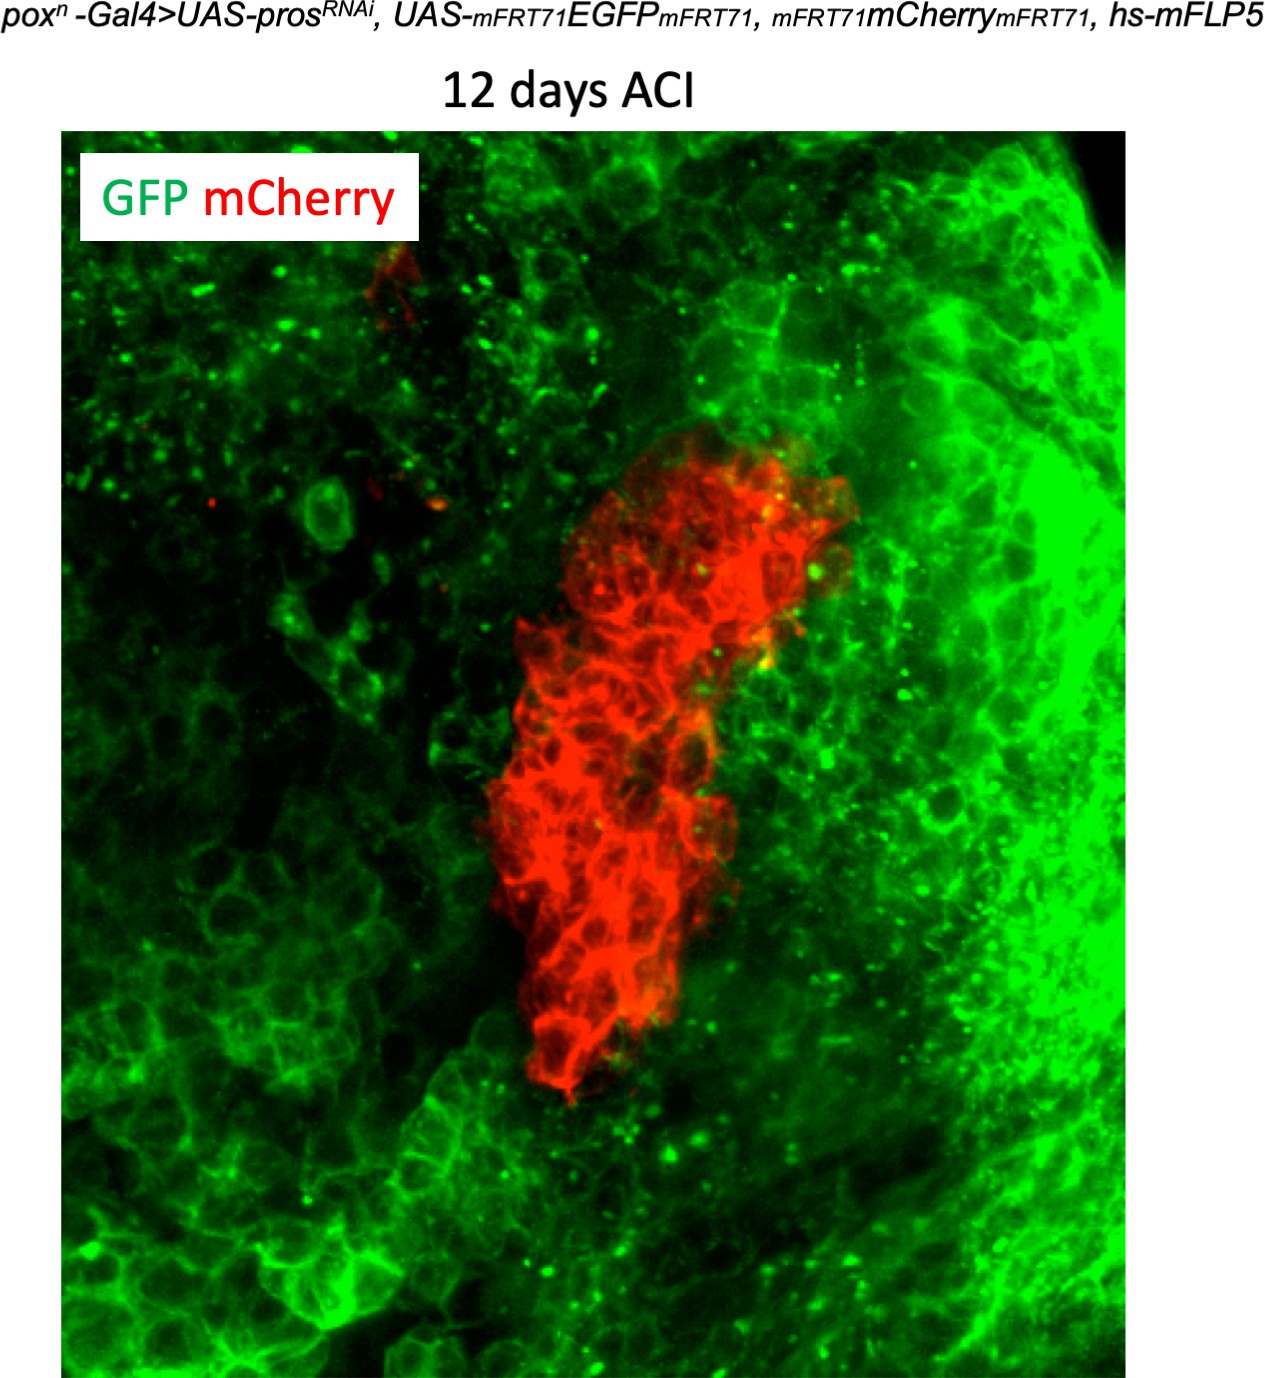
tNBs within a clone do not disperse.
The picture depicts a large mCherry+ clones within an adult poxn > prosRNAi tumor 12 days after clonal induction. Clones were induced using the Flybow technique in tumors from 2 day-old adults. mCherry+ clone cells do not disperse allowing the tracking and examination of individual clones over long periods of time.
Figure 4 with 2 supplements
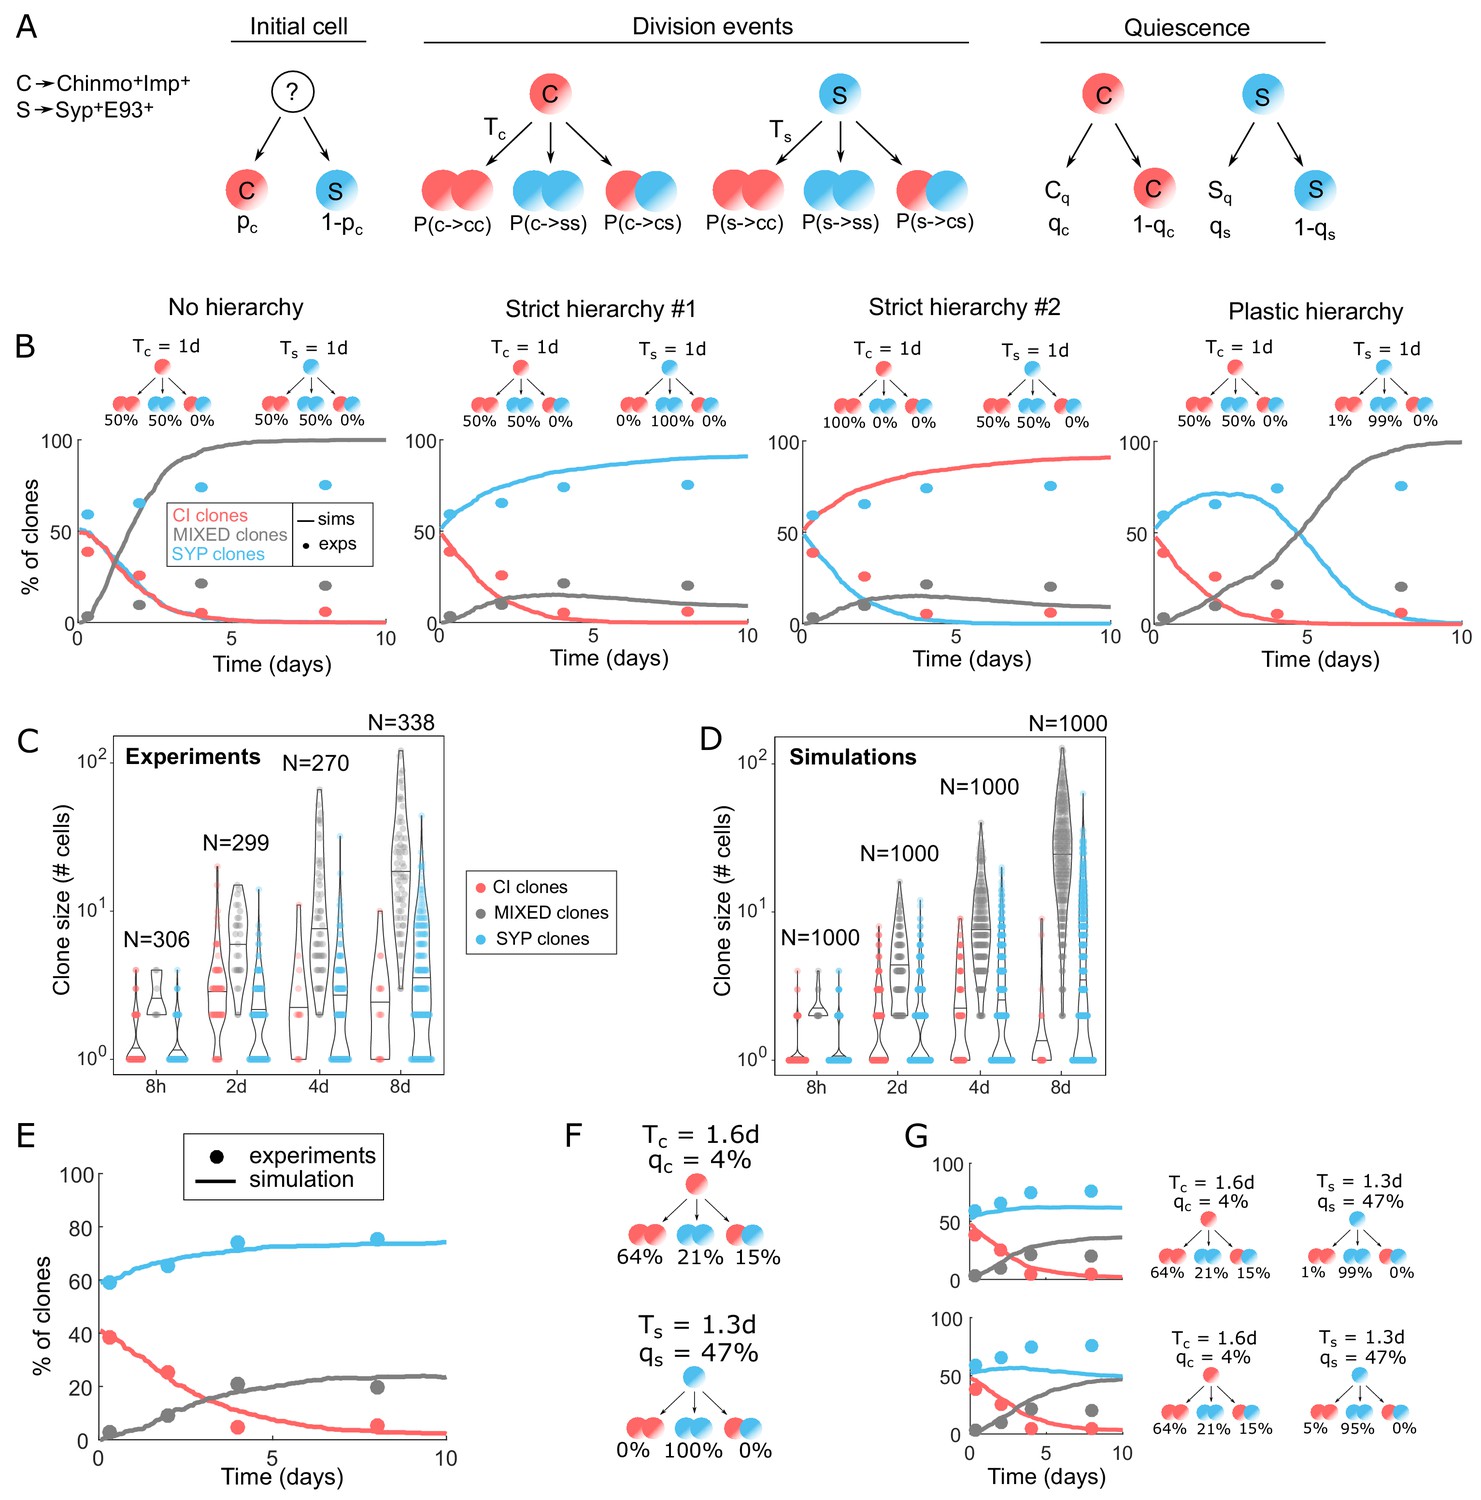
Modeling tumor hierarchy and the dynamics of cellular heterogeneity.
(A) Cartoon of the stochastic clone model. C stands for Chinmo+Imp+ tNBs, S stands for Syp+E93+ tNBs. Tc means ‘division time of Chinmo+Imp+ tNBs’, Ts means ‘division time of Syp+E93+ tNBs’. Cq stands for quiescent Chinmo+Imp+ tNB, Sq stands for quiescent Syp+E93+ tNB. qc and qs are the probabilities for Chinmo+Imp+ and Syp+E93+ tNBs to be quiescent after being generated. (B) Dynamics of proportion for each clone category in four extreme model scenarios: No hierarchy, Strict hierarchy #1, Strict hierarchy #2, Plastic hierarchy. Solid lines represent the simulations (n = 1000 clones), dots represent experimental measurements. Cartoons above graphs represent the division probabilities used to generate each graph. (C) Violin plots depicting distributions of clone sizes (number of cells) for each category calculated from the experiments. (D) Violin plots depicting distributions of clone sizes (number of cells) for each category of clones after simulation, using the set of parameters minimizing the error. Center lines of boxes show the medians. (E) Proportion of clones over time in each category using the set of parameters minimizing the error. Solid lines represent the simulations (n = 1000 clones), dots represent experimental measurements. (F) Hierarchical scheme able to recapitulate the dynamics of clone growth and composition, with the parameters measured from the experimental data and defined by the fit. (G) Proportion of clones in each category using the set of parameters minimizing the error while allowing a small chance of reverse division from S to C (top: 1%, bottom: 5%).
Figure 4—figure supplement 1
Three categories of two-cell clones in poxn > prosRNAi NB tumors suggesting that tNBs can undergo fate symmetric and fate asymmetric divisions .
Clones within tumors are labeled with mCherry and observed 2 days (2d) after clonal induction (ACI) in poxn > prosRNAi tumors. Three categories of two-cell clones can be identified in poxn > prosRNAi tumors: clones composed of two Chinmo+Imp+ tNBs (CI clones), clones composed of one Chinmo+Imp+ tNB and one Syp+E93+ tNB (MIXED clones), and clones composed of two Syp+E93+ tNBs (SYP clones). Chinmo+Imp+ tNBs are marked by the presence of Chinmo. Syp+ tNBs are identified by the absence of Chinmo. Images represent one confocal section. Scale bars, 20 µm.
Figure 4—figure supplement 2
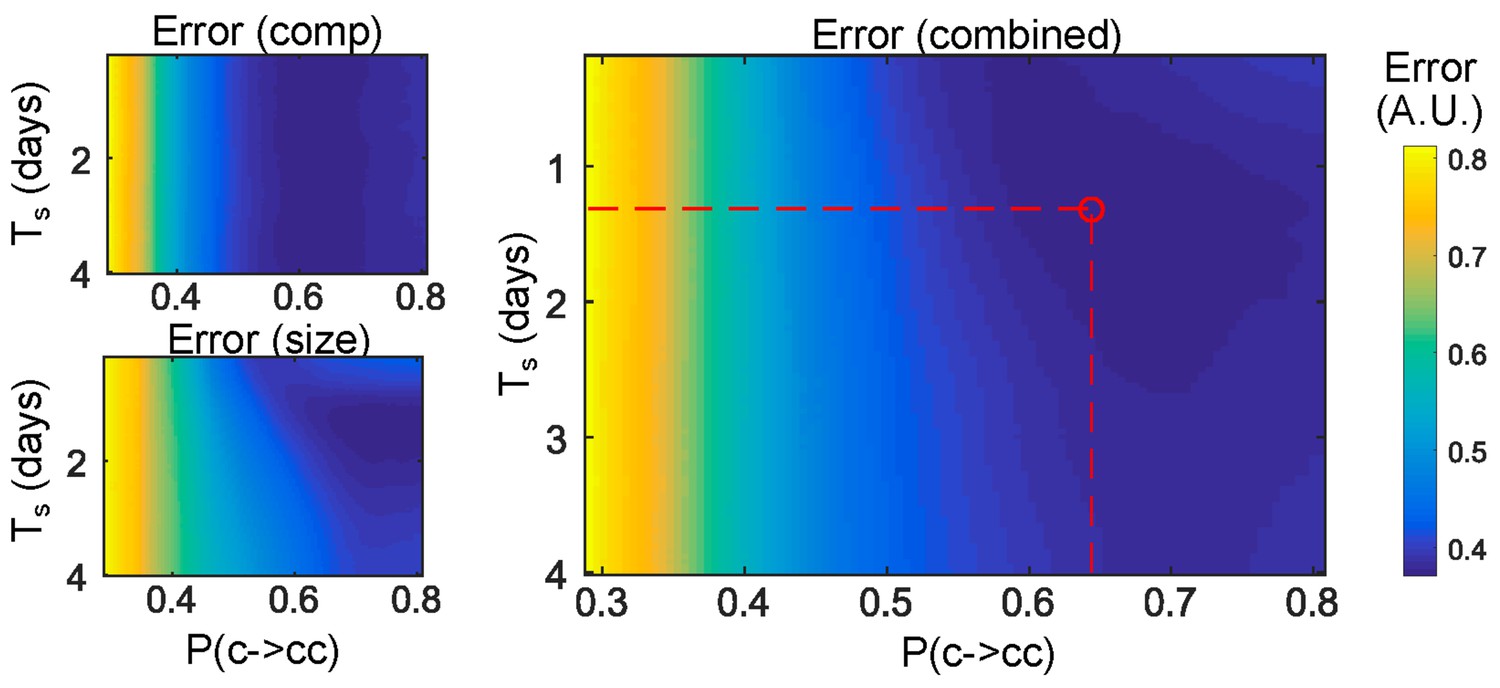
Error maps Normalized error maps in the (Ts,P(c->cc)) space.
Top left: error on clone compositions; bottom left: error on clone sizes; right: combined error.
Figure 5
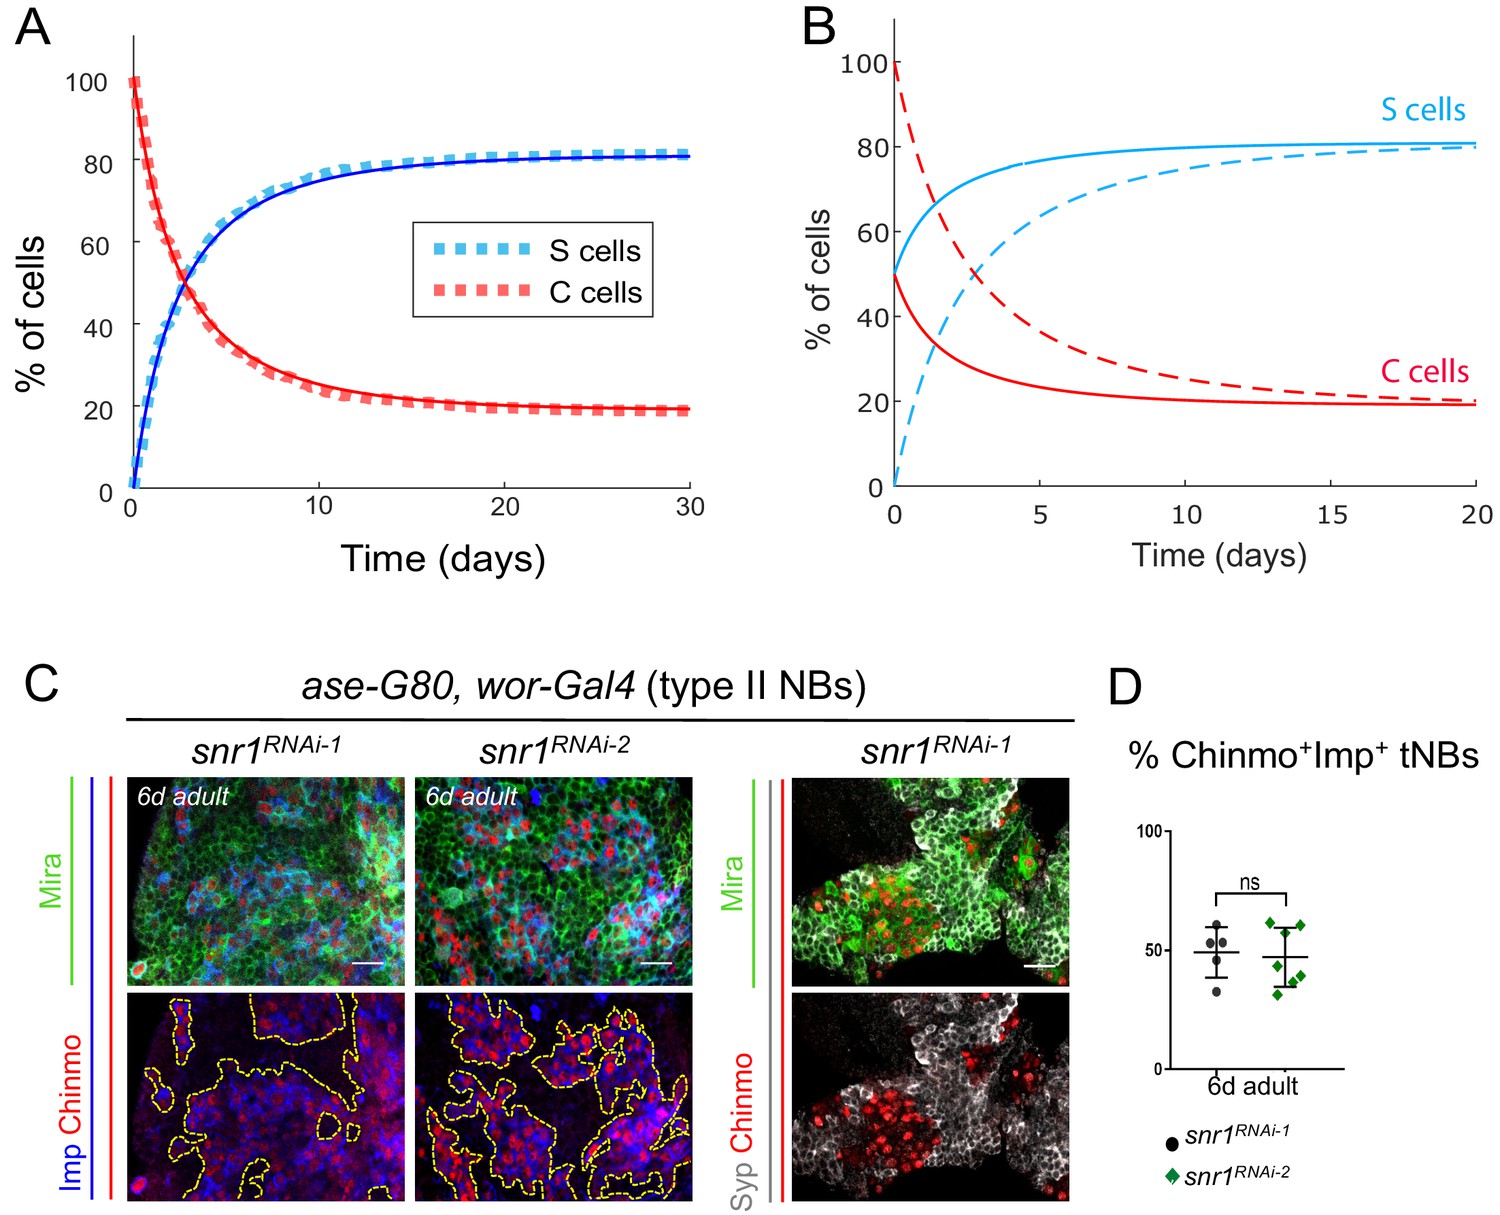
The final proportions of Chinmo+Imp+ and Syp+E93+ tNBs are not influenced by their initial proportions and depend on the tumor type.
(A) Proportion of Syp+E93+ (blue) and Chinmo+Imp+ (red) tNBs over time using the set of parameter values determined by the error minimization and starting from 100% of Chinmo+Imp+ tNBs. Dashed lines represent a stochastic simulation (clone model), thin lines represent the prediction of the deterministic model. An equilibrium is rapidly reached were Chinmo+Imp+ tNBs represent about 20% of all tNBs. (B) Dashed curves: evolution of the proportions of Syp+E93+ (blue) and Chinmo+Imp+ (red) tNBs, as predicted by the deterministic model, when starting with 100% of Chinmo+Imp+. Plain curves: evolution of the proportions of Syp+E93+ (blue) and Chinmo+Imp+ (red) tNBs, as predicted by the deterministic model, when starting with 50% of Chinmo+Imp+ and 50% of Syp+E93+ tNBs. In both scenarios, the same equilibrium is reached. (C) UAS-snr1RNAi transgenes are expressed in type II NBs using the ase-Gal80, wor-Gal4, UAS-dicer2 system causing NB tumors that persist in the CB of adult flies. tNBs in 6-day-old adults are marked with Mira, Imp, Chinmo and Syp. (D) Proportion of Chinmo+Imp+ tNBs in ase-G80, wor > snrRNAiRNAi-1 (n = 5 CB) and ase-G80, wor > snrRNAiRNAi-2 (n = 7 CB) tumors in 6-day-old adults (volume of Chinmo+Imp+ tNBs over volume of all tNBs x 100) . p=0.0061. Scale bars, 20 µm.
Figure 6 with 2 supplements
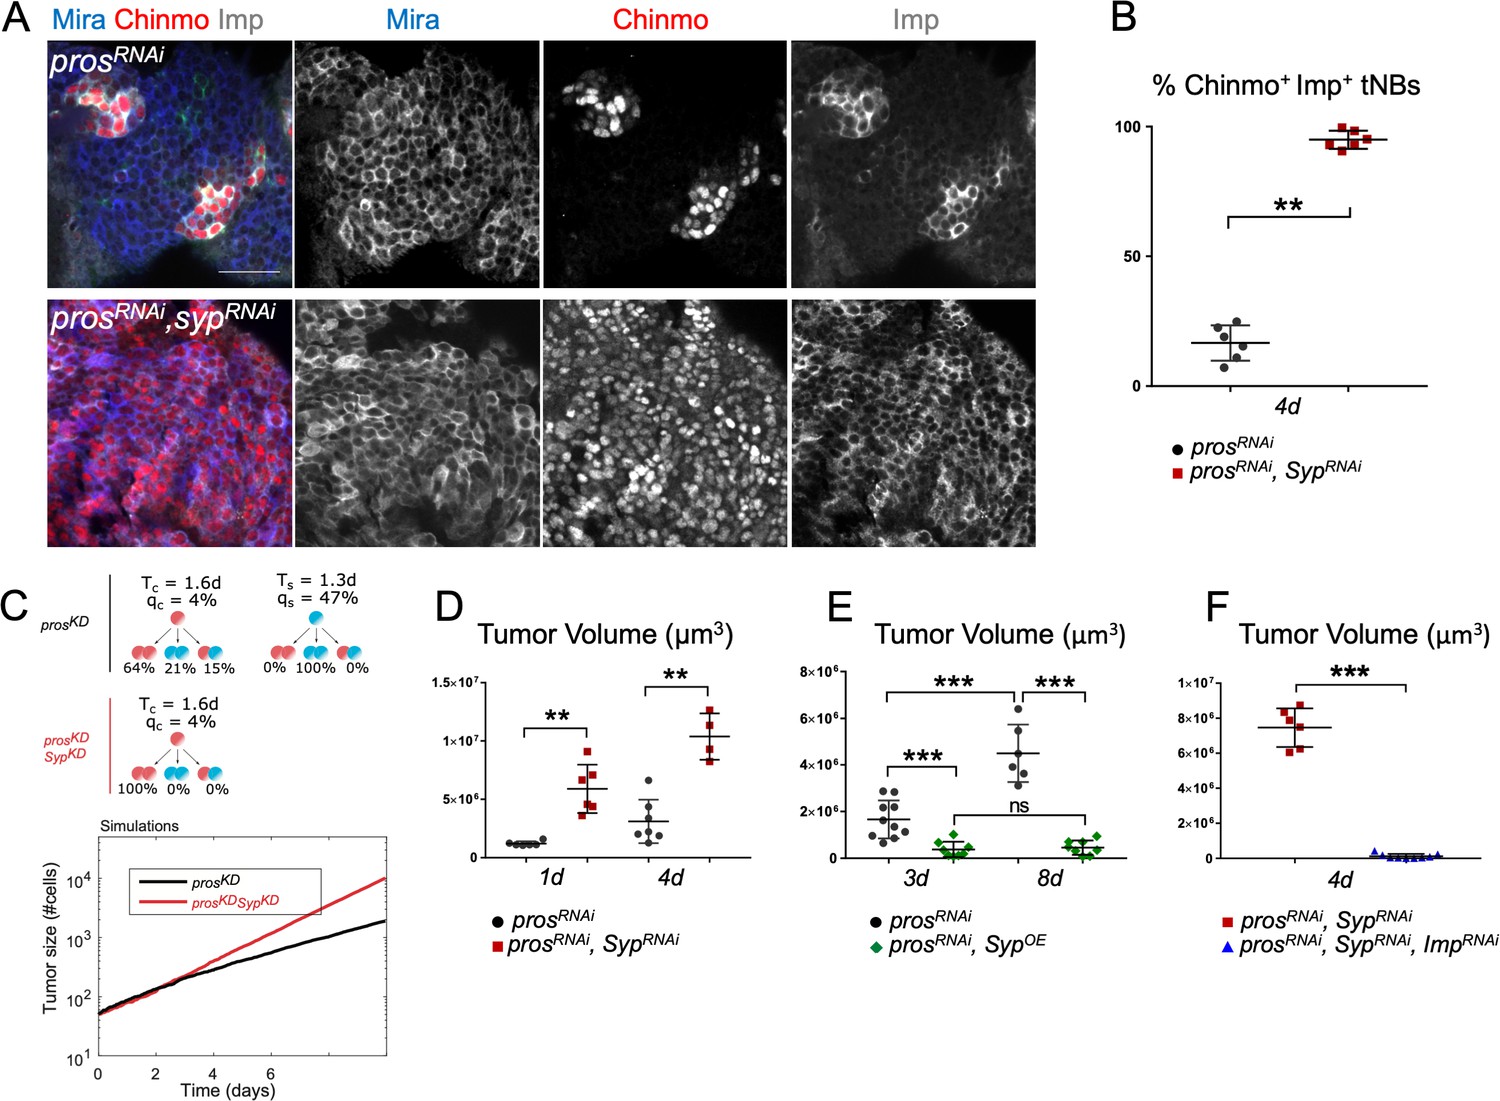
Imp and Syp antagonistically regulate the growth and heterogeneity of prosRNAi tumors.
(A) Syp knockdown in poxn > prosRNAi tumors triggers a dramatic increase of Chinmo+Imp+ tNBs. tNBs are marked with an anti-Mira antibody. (B) Proportion of Chinmo+Imp+ tNBs in poxn > prosRNAi (n = 6 VNC) and poxn > prosRNAi, SypRNAi (n = 6 VNC) tumors in 4-day-old adults. p=0.0022. (C) Simulation of tumor growth (number of cells) in prosKD and prosKD, SypKD (red) tumors. Quiescence probabilities are those set by the error minimization. (D) Volume of poxn > prosRNAi (n = 6 VNC) and poxn > prosRNAi, SypRNAi (n = 6 VNC) tumors in 1-day-old adults. p=0.002. Volume of poxn > prosRNAi (n = 7 VNC) and poxn > prosRNAi, SypRNAi (n = 4 VNC) tumors in 4-day-old adults. p=0.0061. (E) Volume of poxn > prosRNAi tumors in 3-day-old (n = 10 VNC) and 8-day-old (n = 6 VNC) adults. p=0.00025. Volume of poxn > prosRNAi (n = 10 VNC) and poxn > prosRNAi, UAS-Syp (n = 8 VNC) tumors in 3-day-old adults. p=0.0005. Volume of poxn > prosRNAi (n = 6 VNC) and poxn > prosRNAi, UAS-Syp (n = 8 VNC) tumors in 8-day-old adults. p=0.00067. Volume of poxn > prosRNAi, SypOE tumors in 3-day-old (n = 8 VNC) and 8-day-old (n = 8 VNC) adults. p=0.7209. (F) Volume of poxn > prosRNAi, SypRNAi (n = 6 VNC) and poxn > prosRNAi, ImpRNAi, SypRNAi (n = 9 VNC) tumors in 4-day-old adults. p=0.0004.
Figure 6—figure supplement 1
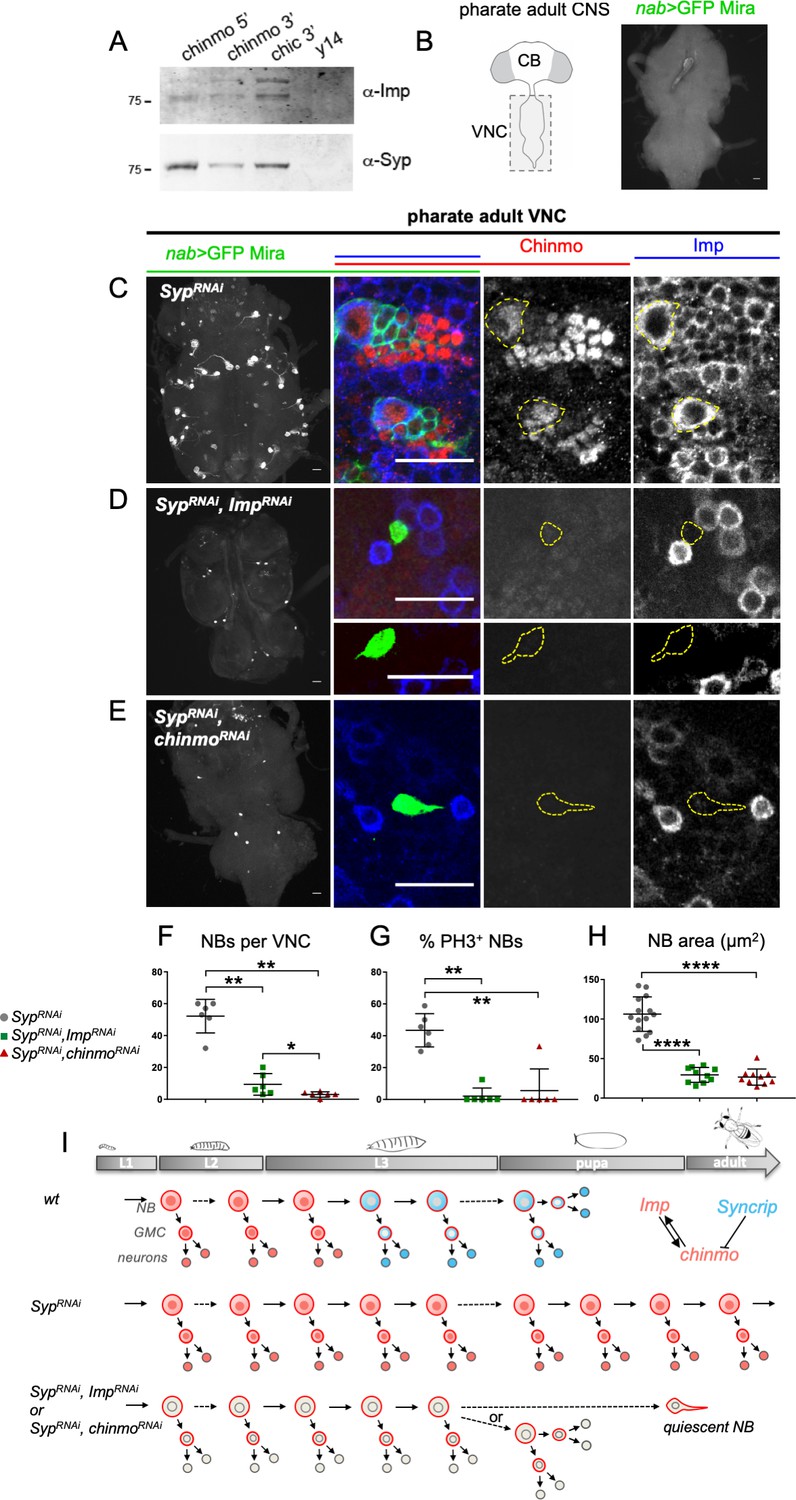
Syp silences Chinmo and Imp to limit NB self-renewal during development.
(A) RNA affinity pull-down assay using biotinylated RNAs incubated with wild-type adult brain extracts. Proteins recovered in the bound fractions were visualized by western blot analysis. The 3’ UTR of chickadee (chic) and the coding sequence of y14 were used as positive and negative controls respectively. (B) Cartoons represent a ventral view of the adult Drosophila CNS. The nab-GAL4 driver is active in all NBs located in the VNC. In nab-Gal4, UAS-dicer2, UAS-GFP (nab >GFP) GFP labels NBs and their recent progeny. NBs, marked with GFP and Miranda (Mira) are not present in the VNC of wt pharate adults. (C) Syp knock-down (nab >SypRNAi) from early larval stages induces the persistence of active Chinmo+Imp+ NBs in the VNC of pharate adults. (D) Most of the VNC NBs lacking both Syp and Imp (nab >SypRNAi, ImpRNAi) are eliminated before the pharate adult stage. The few persisting NBs exhibit a smaller size and cytoplasmic extensions. They don’t express Chinmo and Imp. (E) Most of the VNC NBs lacking both Syp and Chinmo (nab >SypRNAi, ChinmoRNAi) are eliminated before the pharate adult stage. The few persisting NBs exhibit a smaller size and cytoplasmic extensions. They don’t express Chinmo and Imp. (F) Quantification of the number of NBs per VNC in nab >SypRNAi (n = 6 VNC), nab >SypRNAi, ImpRNAi (n = 6 VNC) and nab >SypRNAi, chinmoRNAi (n = 6 VNC). PSypKD/SypKD,ImpKD = 0.002. PSypKD/SypKD,chinmoKD = 0.002. PSypKD,ImpKD/SypKD,chinmoKD = 0.039. (G) Quantification of proliferating NBs, marked with PH3, in nab >SypRNAi (n = 6 VNC), nab >SypRNAi, ImpRNAi (n = 6 VNC) and nab >SypRNAi, chinmoRNAi (n = 6 VNC). PSypKD/SypKD,ImpKD = 0.002. PSypKD/SypKD,chinmoKD = 0.004. (H) Quantification of the NB area in nab > SypRNAi (n = 14 NBs), nab > SypRNAi, ImpRNAi (n = 10 NBs) and nab > SypRNAi, chinmoRNAi (n = 10 NBs). PSypKD/SypKD,ImpKD=<0.0001. PSypKD/SypKD,chinmoKD=<0.0001. (I) Scheme depicting the asymmetric divisions of NBs throughout larval and pupal stages and recapitulating the above experiments. Scale bars, 20 µm.
Figure 6—figure supplement 2
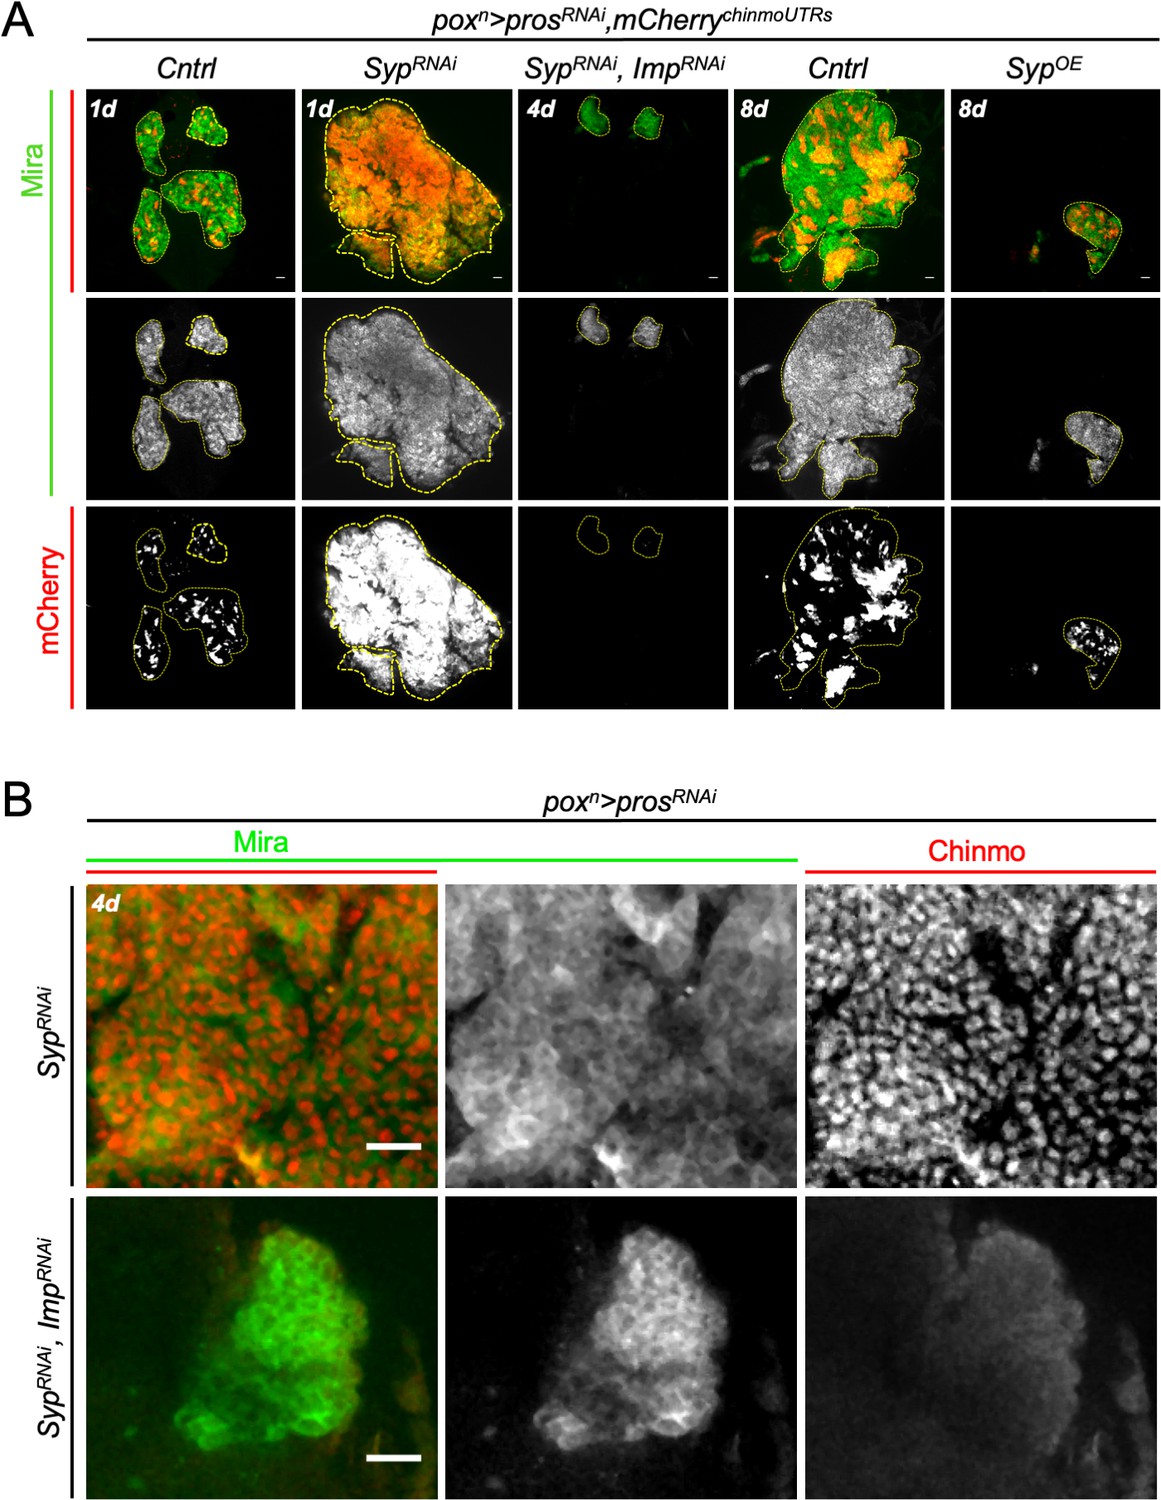
Imp and Syp antagonistically regulate tumor growth and chinmo expression in poxn > prosRNAi NB tumors.
(A) poxn > prosRNAi, SypRNAi tumors overgrow compared to control poxn > prosRNAi tumors (Cntrl) in 1-day-old adults (1d).Tumors fail to grow in poxn > prosRNAi, SypRNAi, ImpRNAitumors (4d). Overexpression of Syp in poxn > prosRNAi, SypOE tumors arrests tumor growth compared to control poxn > prosRNAi tumors (Cntrl) in 8-day-old adults (8d). Tumors are delimited by dashed lines. The UAS-mCherrychinmoUTRs is expressed in tumors where it is post-transcriptionally regulated, reflecting chinmo expression (Figure 1—figure supplement 4). (B) poxn > prosRNAi, SypRNAi tumors are mostly composed of Chinmo+ tNBs. Chinmo is absent in poxn > prosRNAi, SypRNAi, ImpRNAi tumors indicating that Imp is necessary to promote chinmo expression in poxn > prosRNAi, SypRNAi tumors. tNBs are marked with Mira. Scale bars, 20 µm.
Figure 7
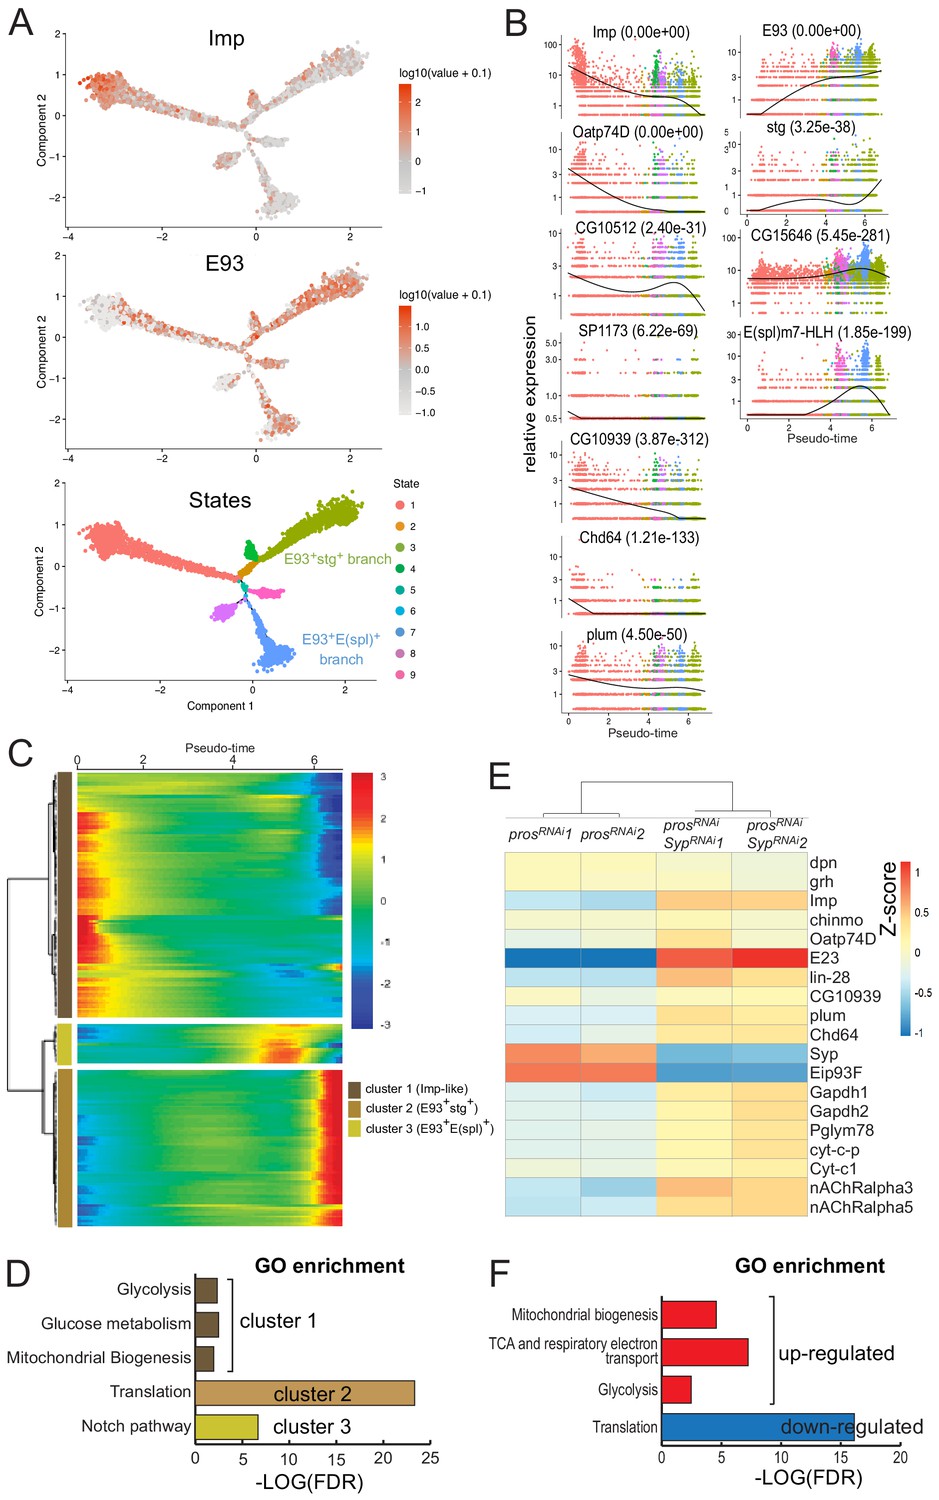
Redeployment of temporal patterning genes generates differentiation trajectories within NB tumors.
(A) Cell trajectory reconstructed from the population of tNBs using semi-supervised pseudotime ordering. Imp+ tNBs are enriched at the root of the trajectory while E93+ tNBs are enriched in the branches terminating the trajectories. tNBs are colored according to their State along the trajectory. (B) Dark spline indicates levels of gene expression along the pseudotime. Cells are colored according to their State along the trajectory in (A). p-values for differential expression along the pseudotime are indicated for each gene. (C) Kinetic heatmap depicting the expression of top 200 genes that vary as a function of pseudotime. Genes are grouped in three clusters based on expression kinetics. (D) Gene ontology (GO) enrichment analysis for each cluster identified in (C). (E) Heatmap depicting enrichment of various temporal patterning, metabolic and acetylcholine receptor genes when comparing poxn > prosRNAi tumors and poxn > prosRNAi, SypRNAi tumors. (F) Gene ontology (GO) enrichment analysis when comparing the transcriptome of poxn > prosRNAi, SypRNAi vs poxn > prosRNAi tumors.
Figure 8 with 3 supplements

The Imp-to-Syp transition triggers down-regulation of glutamine and glucose metabolism genes along the differentiation trajectory to reduce tNB growth and proliferative potential.
(A) Glucose metabolism pathways (glycolysis, TCA cycle and respiratory electron transport chain). Genes whose expression is enriched in poxn > prosRNAi, SypRNAi tumors compared to poxn > prosRNAi tumors are highlighted in blue. Log2 fold change is indicated in brackets. (B) Expression dynamics of various glycolytic, respiratory electron transport chain and glutamine metabolism genes along the tumor pseudotime. p-values for differential expression along the pseudotime are indicated for each gene. (C) poxn > prosRNAi NB tumors are marked with anti-Mira (green). Silencing of glycolytic (Gapdh-1RNAi, Pglym78RNAi) or respiratory genes (Cyt-c-pRNAi, Cyt-c1RNAi) leads to smaller poxn > prosRNAi tumors in late L3 larvae. Silencing of glycolytic or respiratory genes arrests tumor growth in 4-day-old and 7-day-old adults respectively. (D) Volumes of poxn > prosRNAi tumors (n = 5 VNC), poxn > prosRNAi, Gapdh-1RNAi tumors (n = 7 VNC); poxn > prosRNAi, Pglym78RNAi tumors (n = 5 VNC); poxn > prosRNAi,Cyt-c-pRNAi tumors (n = 5 VNC); and poxn > prosRNAi,Cyt-c1RNAi tumors (n = 5 VNC) in late L3. PCntrl/Gapdh-1RNAi = 0,002. PCntrl/Pglym78RNAi = 0,007. PCntrl/Cyt-c-pRNAi= 0,007. PCntrl/Cyt-c1RNAi = 0,007. Volumes of poxn > prosRNAi tumors (n = 6 VNC); poxn > prosRNAi, Gapdh-1RNAi tumors (n = 8 VNC); poxn > prosRNAi, Pglym78RNAi tumors (n = 9 VNC); poxn > prosRNAi, Cyt-c-pRNAi tumors (n = 10 VNC); and poxn > prosRNAi, Cyt-c1RNAi tumors (n = 6 VNC) in 4-day-old adults. PCntrl/Gapdh-1RNAi = 0,0007. PCntrl/Pglym78RNAi = 0,0002. PCntrl/Cyt-c-pRNAi = 0,0002. PCntrl/Cyt-c1RNAi = 0,002. Scale bars, 50 µm. (E) Each dot represents the average area of Chinmo+Imp+ tNBs over the average area of Syp+E93+ tNBs for a single confocal section of a poxn > prosRNAi NB tumor in a 4-day-old adult. (F) Schematic representation of the tumor hierarchy. Chinmo+Imp+ tNBs are proliferative and tend to self-renew. However, they can also engage in a differentiation process triggered by the Imp-to-Syp transition and involving a subset of larval temporal genes. Syp+E93+ tNBs can self-renew but also tend to exit the cell-cycle as they decrease expression of glucose/glutamine metabolism genes. Syp+E93+ tNBs, that have exited the cell-cycle, express genes of the E(spl) family. The mechanisms controlling the Imp-to-Syp transition in NB tumors, to determine the CSC proportion are unknown.
Figure 8—figure supplement 1
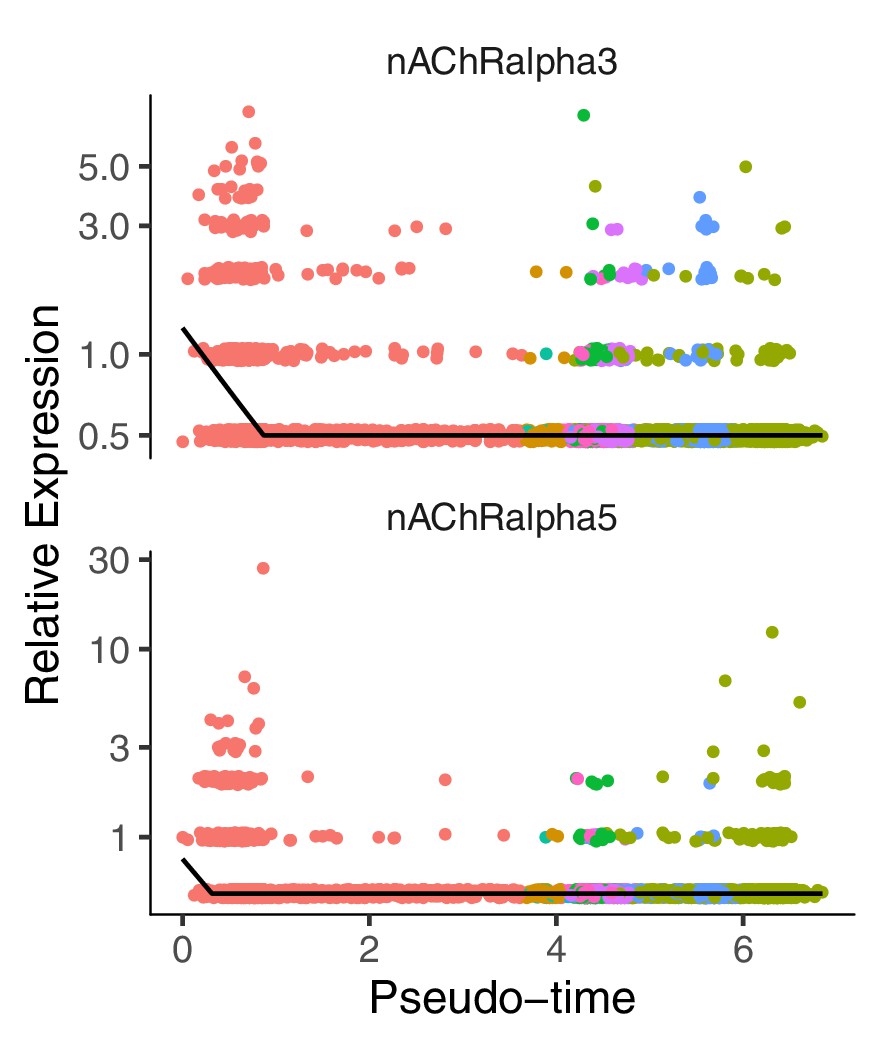
nAChRalpha3 and nAChRalpha5 are expressed in tNBs positioned at the beginning of the pseudotime.
https://doi.org/10.7554/eLife.50375.021
Figure 8—figure supplement 2
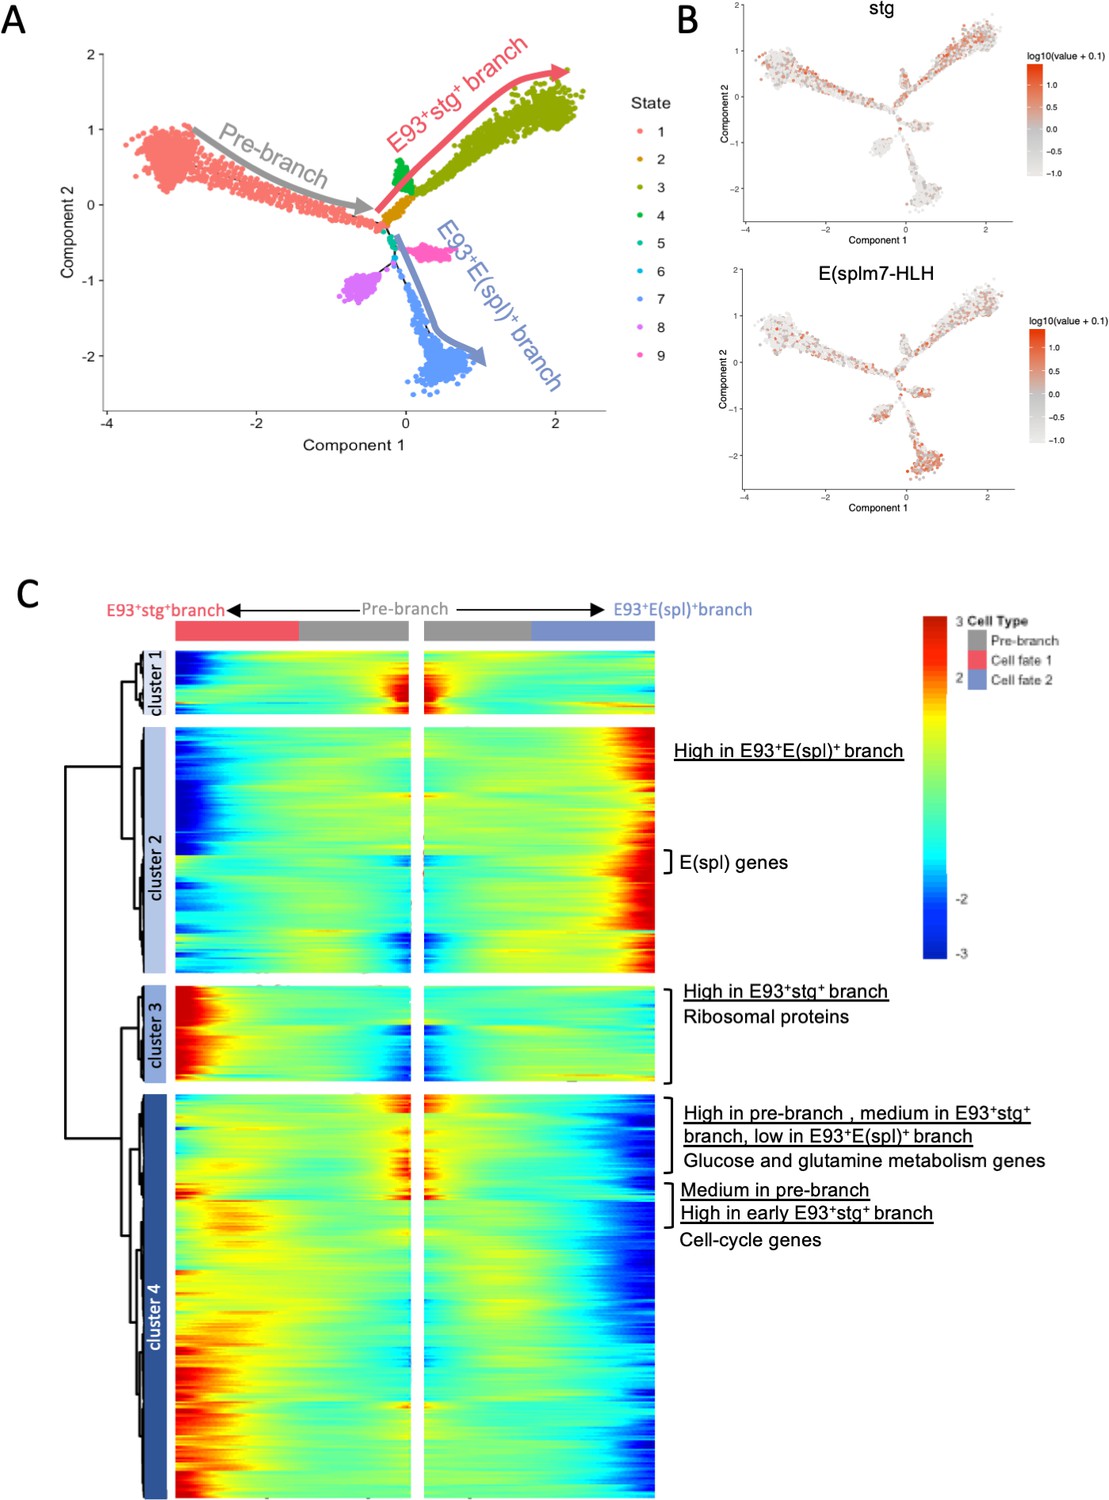
Branch analysis of the single-cell trajectory.
(A) Cell trajectory reconstructed from the population of tNBs using semi-supervised pseudotime ordering. Cells are colored by States. The three main branches of the tree are labeled as: Pre-branch, E93+stg+ branch and E93+E(spl)+ branch. (B) stg and E(spl)m7-HLH are enriched in distinct branches of the trajectory. (C) Kinetic heatmap depicting the expression of genes that are differentially expressed between the Pre-branch, the E93+stg+ branch and the E93+E(spl)+ branch (qval < 1e-20).
Figure 8—figure supplement 3
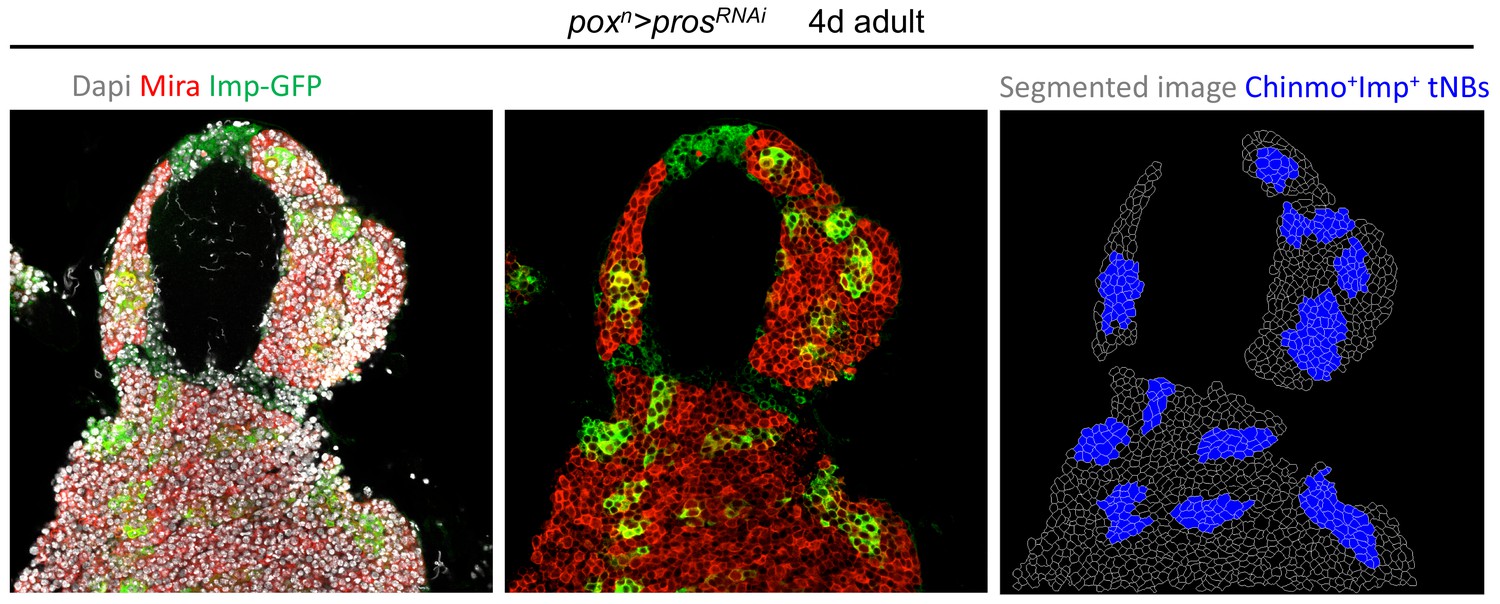
Segmentation of NB tumors Segmented confocal section of a tumor using Tissue Analyzer.
Anti-Mira staining was used as membrane reference. Accurate segmentation was manually double-checked using Dapi as nuclear marker. Imp-GFP+ cells represent Chinmo+Imp+ tNBs. GFP- tNBs represent Syp+E93+ tNBs.
Tables
Key resources table
| Reagent type (species) or resource | Designation | Source or reference | Identifiers | Additional information |
|---|---|---|---|---|
| Genetic reagent (D. melanogaster) | UAS-Flybow. 1.1 | Bloomington Drosophila Stock Center (Hadjieconomou et al., 2011) | RRID:BDSC_35537 | |
| Genetic reagent (D. melanogaster) | UAS-mCherrychinmoUTRs | Cédric Maurange (Dillard et al., 2018) | mCherry reflects the post-transcriptional regulation of chinmo. | |
| Genetic reagent (D. melanogaster) | UAS-SypRNAi1 | VDRC | 33011 | RNAi1 |
| Genetic reagent (D. melanogaster) | UAS-SypRNAi2 | VDRC | 33012 | RNAi2 |
| Genetic reagent (D. melanogaster) | UAS-Syp-RB-HA | Tzumin Lee (Liu et al., 2015) | ||
| Genetic reagent (D. melanogaster) | UAS-prosRNAi1 | Bloomington Drosophila Stock Center | RRID:BDSC_26745 | RNAi1 |
| Genetic reagent (D. melanogaster) | UAS-prosRNAi2 | VDRC | 101477 | RNAi2 |
| Genetic reagent (D. melanogaster) | UAS-ImpRNAi | VDRC | 20322 | |
| Genetic reagent (D. melanogaster) | UAS-chinmoRNAi | Bloomington Drosophila Stock Center | RRID:BDSC_33638 | |
| Genetic reagent (D. melanogaster) | UAS-dicer2 | Bloomington Drosophila Stock Center | RRID:BDSC_24650 RRID:BDSC_24651 | was used in combination with GAL4 lines in order to improve RNAi efficiency. |
| Genetic reagent (D. melanogaster) | UAS-mCD8::GFP | Bloomington Drosophila Stock Center | RRID:BDSC_5130 RRID:BDSC_32185 | |
| Genetic reagent (D. melanogaster) | UAS-myr::GFP | Bloomington Drosophila Stock Center | RRID:BDSC_32197 | |
| Genetic reagent (D. melanogaster) | UAS-mCherry.NLS | Bloomington Drosophila Stock Center | RRID:BDSC_38424 | |
| Genetic reagent (D. melanogaster) | UAS-Snr1RNAi1 | VDRC | 108599 | RNAi1 |
| Genetic reagent (D. melanogaster) | UAS-Snr1RNAi2 | VDRC | 32372 | RNAi2 |
| Genetic reagent (D. melanogaster) | UAS-Gapdh1RNAi | VDRC | 100596 | |
| Genetic reagent (D. melanogaster) | UAS-Pglym78 | VDRC | 106818 | |
| Genetic reagent (D. melanogaster) | UAS-Cyt-c1RNAi1 | VDRC | 9180 | RNAi1 |
| Genetic reagent (D. melanogaster) | UAS-Cyt-c1RNAi2 | VDRC | 109809 | RNAi2 |
| Genetic reagent (D. melanogaster) | UAS-Cyt-c-pRNAi1 | VDRC | 33019 | RNAi1 |
| Genetic reagent (D. melanogaster) | UAS-Cyt-c-pRNAi2 | VDRC | 106759 | RNAi2 |
| Genetic reagent (D. melanogaster) | w, tub-GAL4, UAS-nlsGFP::6xmyc::NLS, hsFLP122; FRT82B, tubP-GAL80/TM6B | Cédric Maurange (Narbonne-Reveau et al., 2016) | MARCM line | |
| Genetic reagent (D. melanogaster) | FRT82B snr16C hdac36C | Bloomington Drosophila Stock Center (Koe et al., 2014) | RRID:BDSC_34494 | |
| Genetic reagent (D. melanogaster) | Imp-GFP | Florence Besse | protein trap line | |
| Genetic reagent (D. melanogaster) | poxn-Gal4 | Bloomington Drosophila Stock Center (Boll and Noll, 2002) | RRID:BDSC_ 66685 | |
| Genetic reagent (D. melanogaster) | ase-Gal80, wor-GAL4, UAS-dcr2 | Juergen Knoblich (Eroglu et al., 2014) | ||
| Genetic reagent (D. melanogaster) | nab-GAL4 | Kyoto DGRC | 6190 | |
| Genetic reagent (D. melanogaster) | UAS-FLP, Ubi-p63EFRTstopFRTnEGFP | Bloomington Drosophila Stock Center (Evans et al., 2009) | RRID:BDSC_28282 | G-trace |
| Genetic reagent (D. melanogaster) | hs-mFLP5 | Bloomington Drosophila Stock Center (Hadjieconomou et al., 2011) | RRID:BDSC_35534 | Flipase for Flybow |
| Antibody | chicken polyclonal anti-GFP | Aves Labs #GFP-1020 | RRID:AB_10000240 | 1:1000 |
| Antibody | rabbit polyclonal anti-RFP | Rockland #600-401-379 | RRID:AB_2209751 | 1:500 |
| Antibody | rat monoclonal anti-RFP | Chromotek #5F8 | RRID:AB_2336064 | 1:500 |
| Antibody | mouse monoclonal anti-Miranda | Alex Gould | 1:50 | |
| Antibody | rabbit polyclonal anti-PH3 | Millipore #06–570 | RRID:AB_310177 | 1:500 |
| Antibody | rat monoclonal anti-PH3 | Abcam #AB10543 | RRID:AB_2295065 | 1:500 |
| Antibody | rat monoclonal anti-Elav | DSHB | #9F8A9 | 1:50 |
| Antibody | rabbit polyclonal anti-cleaved Dcp-1 | Cell Signaling #9578 | RRID:AB_2721060 | 1:500 |
| Antibody | rat polyclonal anti-Chinmo | Nick Sokol | 1:500 | |
| Antibody | rabbit polyclonal anti-Imp | Paul Macdonald | 1:500 | |
| Antibody | guinea pig polyclonal anti-Syp | Ilan Davis | 1:500 | |
| Antibody | Rabbit polyclonal anti-Syp | Ilan Davis | 1/200 | |
| Antibody | rabbit polyclonal anti-E93 | Daniel J. McKay | 1/2500 | |
| Antibody | guinea-pig polyclonal antibody | Bill McGinnis | 1/200 | |
| Chemical compound, drug | Dapi | Vector Laboratories Cat# H-1400 | RRID:AB_2336787 | |
| Recombinant DNA reagent | Chinmo cDNA clone | DGRC, EST Collection | #RE59755 | |
| Sequence-based reagent | Chin-5'UTR/pBS_Forward | This paper | PCR primers | Described in Affinity pull-down assays section in the Materials and methods |
| Sequenced-based reagent | Chin-5'UTR/pBS_Reverse | This paper | PCR primers | Described in Affinity pull-down assays section in the Materials andmethods |
| Sequenced-based reagent | Chin-3'UTR/pBS_Forward | This paper | PCR primers | Described in Affinity pull-down assays section in the Materials and methods |
| Sequenced-based reagent | Chin-3'UTR/pBS_Reverse | This paper | PCR primers | Described in Affinity pull-down assays section in the Materials andmethods |
| Software, algorithm | Seurat and Monocle codes used for single-cell RNA-seq data analysis | This paper | https://github.com/cedricmaurange/Genovese-et-al.-2019 | See the Single-cell mRNA sequencing and analysis section in the Materials and methods |
| Software, algorithm | Code used for numerical model | This paper | http://dx.doi.org/10.17632/j2j9gmyb6m.1 | See the Numerical model section in the Materials and methods |
Additional files
-
Supplementary file 1
Top200 genes dynamically regulated along the pseudotime.
- https://doi.org/10.7554/eLife.50375.024
-
Supplementary file 2
Differentially expressed genes between poxn > prosRNAi, SypRNAi tumors and poxn > prosRNAi tumors.
- https://doi.org/10.7554/eLife.50375.025
-
Supplementary file 3
Heatmap depicting dynamically expressed genes along the different branches of the trajectory in poxn > prosRNAi tumors.
Prebranch starts at the root of the trajectory. Cell fate one corresponds to the E93+stg+ branch. Cell fate two corresponds to the E93+E(spl)+ branch as labeled in Figure 7A.
- https://doi.org/10.7554/eLife.50375.026
-
Transparent reporting form
- https://doi.org/10.7554/eLife.50375.027
Download links
A two-part list of links to download the article, or parts of the article, in various formats.
Downloads (link to download the article as PDF)
Open citations (links to open the citations from this article in various online reference manager services)
Cite this article (links to download the citations from this article in formats compatible with various reference manager tools)
Coopted temporal patterning governs cellular hierarchy, heterogeneity and metabolism in Drosophila neuroblast tumors
eLife 8:e50375.
https://doi.org/10.7554/eLife.50375


