The transpeptidase PBP2 governs initial localization and activity of the major cell-wall synthesis machinery in E. coli
- Microbial Morphogenesis and Growth Lab, Institut Pasteur, France
- Université Paris Diderot, Sorbonne-Paris-Cité, France
- Synthetic Biology Lab, Institut Pasteur, France
- Université Paris Descartes, Sorbonne-Paris-Cité, France
- Proteomics Platform, Institut Pasteur, France
Figures
Figure 1 with 14 supplements

PBP2 molecules reside in diffusive, immobile, or persistently moving states.
(A) Representative trajectories of PAmCherry-PBP2 molecules (TKL130) obtained by high-frequency imaging (time interval 60 ms) reveals diffusive (blue) and bound (orange) molecules. (B) Probability distribution of single-molecule jump lengths (solid lines, colored) and fit (dashed, black) using a three-state-diffusion model for different time intervals. 78% of PBP2 move diffusively with <D> = 0.042 μm2/s while 22% are immobile. The shaded area indicates standard deviation between six biological replicates. (C–E) Low-frequency imaging (3.6 s with 1 s exposure time) reveals that bound PBP2 molecules are either persistently moving (C) or immobile (D), according to the instantaneous PBP2 velocity. PBP2 molecules show transitions between persistent and immobile states (E). (F–G) Persistently moving PBP2 and MreB filaments show similar speeds (F) and orientations of motion (orientation measured with respect to the cell centerline) (G). (H–I) Average fractions of bound, diffusive, persistently moving, and immobile PAmCherry-PBP2 at native levels (TKL130) (H) or if overexpressed (TKL130/pKC128) (I). Dots show biological replicates.
-
Figure 1—source data 1
Table containing all data presented in Figure 1 and Figure 1—figure supplements 1–10.
The file Dataset-Fig1.xlsx contains: Figure 1H-I Number of tracks, average diffusion constants, bound and persistent fractions for PAmCherry-PBP2 for native and overexpression conditions, including p-values for bound and persistent fractions. Figure 1F-G Numerical values of the distribution of speeds and orientations of PAmCherry-PBP2 and MreB-msfGFP tracks from low frequency imaging and number of tracks considered. Figure 1—figure supplement 1B-C. Width, length and doubling times obtained from OD600 measurements of MG1655, TKL130, and TKL130/pKC128 cells. Figure 1—figure supplement 1D Bocillin labeling, fluorescence and mass spectrometry measurements of MG1655, TKL130, and TKL130/pKC128 cells. Figure 1—figure supplement 2 Values of bound fractions, average diffusion constants, and sum of residuals of PAmCherry-PBP2 tracks from TKL130/pKC128 strain with high frequency imaging given by the Spot-On method using 2- or 3-state diffusion model. Figure 1—figure supplement 3 Values of bound fractions and diffusion constants of PAmCherry-PBP2 tracks from TKL130/pKC128 strain to compare the results from Spot-On with the Deff based method. Figure 1—figure supplement 5 Raw data for Figure 1F–G. List of velocity, orientation and goodness of fit (R2). Figure 1—figure supplement 7 Number of bound or active PBP2 molecules as a function of the number of PBP2 molecules per cell acquired from mass spectrometry and fluorescence measurements. Figure 1—figure supplement 8A) Shape and OD600 measurements of cells carrying the msfGFP-PBP2 fusion expressed from the native or PLac promoters with different induction levels of IPTG. Figure 1—figure supplement 8B Fluorescence and Western Blot quantifications and mass spectrometry (both DIA and PRM) of cells carrying the msfGFP-PBP2 fusion expressed from the native or PLac promoters with different induction levels of IPTG Figure 1—figure supplement 8C Values of number of tracks, average diffusion constants, and bound fractions for cells carrying the msfGFP-PBP2 fusion, including p-values for bound fractions. Figure 1—figure supplement 9 Shape and fluorescence measurements, number of tracks, average diffusion constants and bound fractions from high frequency imaging of cells carrying msfGFP-PBP2 fusion with induction levels of 5 and 25 uM IPTG after different times of growth, including p-values for bound fractions. Figure 1—figure supplement 10A Values of number of tracks, and persistent fractions for cells carrying msfGFP-PBP2 fusion expressed from the native or PLac promoters with different induction levels of IPTG, including p-values for persistent fractions. Figure 1—figure supplement 10B. List of velocity and goodness of fit (R2) values for cells carrying msfGFP-PBP2 fusion under different induction levels of IPTG.
- https://cdn.elifesciences.org/articles/50629/elife-50629-fig1-data1-v2.xlsx
Figure 1—figure supplement 1
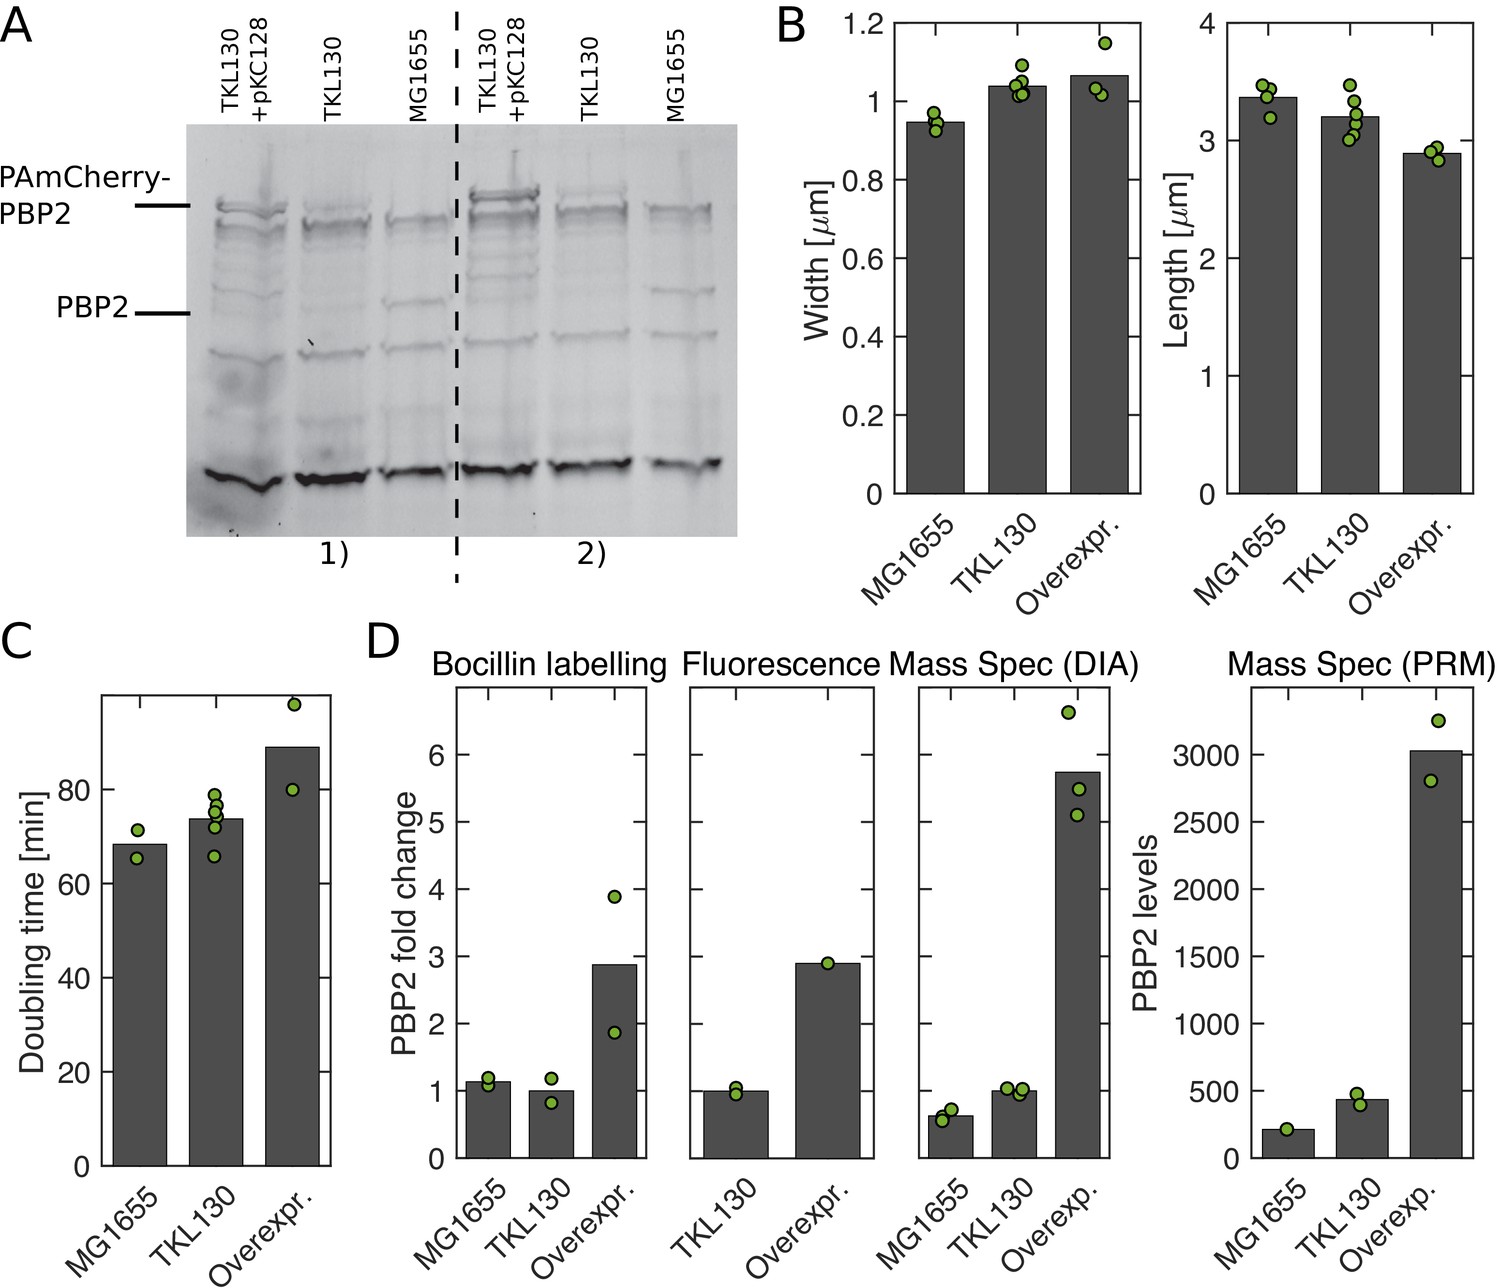
Comparison of PBP2-PAmCherry expressing cells and WT.
(A) Bocillin-binding assay to compare expression levels of PBP2 in the wild-type strain (MG1655), the strain expressing PBP2-PAmCherry from the native locus (TKL130), and the strain overexpressing PBP2-PAmCherry (TKL130/pKC128). Quantification in (D). (B) Average cell dimensions obtained by phase-contrast microscopy and computational image segmentation. (C) Average doubling times during steady-state exponential growth in batch culture (from OD600). (D) Different methods to compare PBP2 expression levels in different strains (from left to right): Bocillin labeling (from A), single-cell fluorescence levels measured in epi-fluorescence mode, mass spectrometry [Data Independent Acquisitions (DIA) and Parallel Reaction Monitoring (PRM)]. For the first three methods, PBP2 levels are normalized by the corresponding value in TKL130. For PRM, we obtained absolute numbers of proteins per cell by comparing to reference peptides and colony counting. With both mass spectrometry methods, we observe a higher fold-change than through the other methods. Dots represent biological replicates.
Figure 1—figure supplement 2
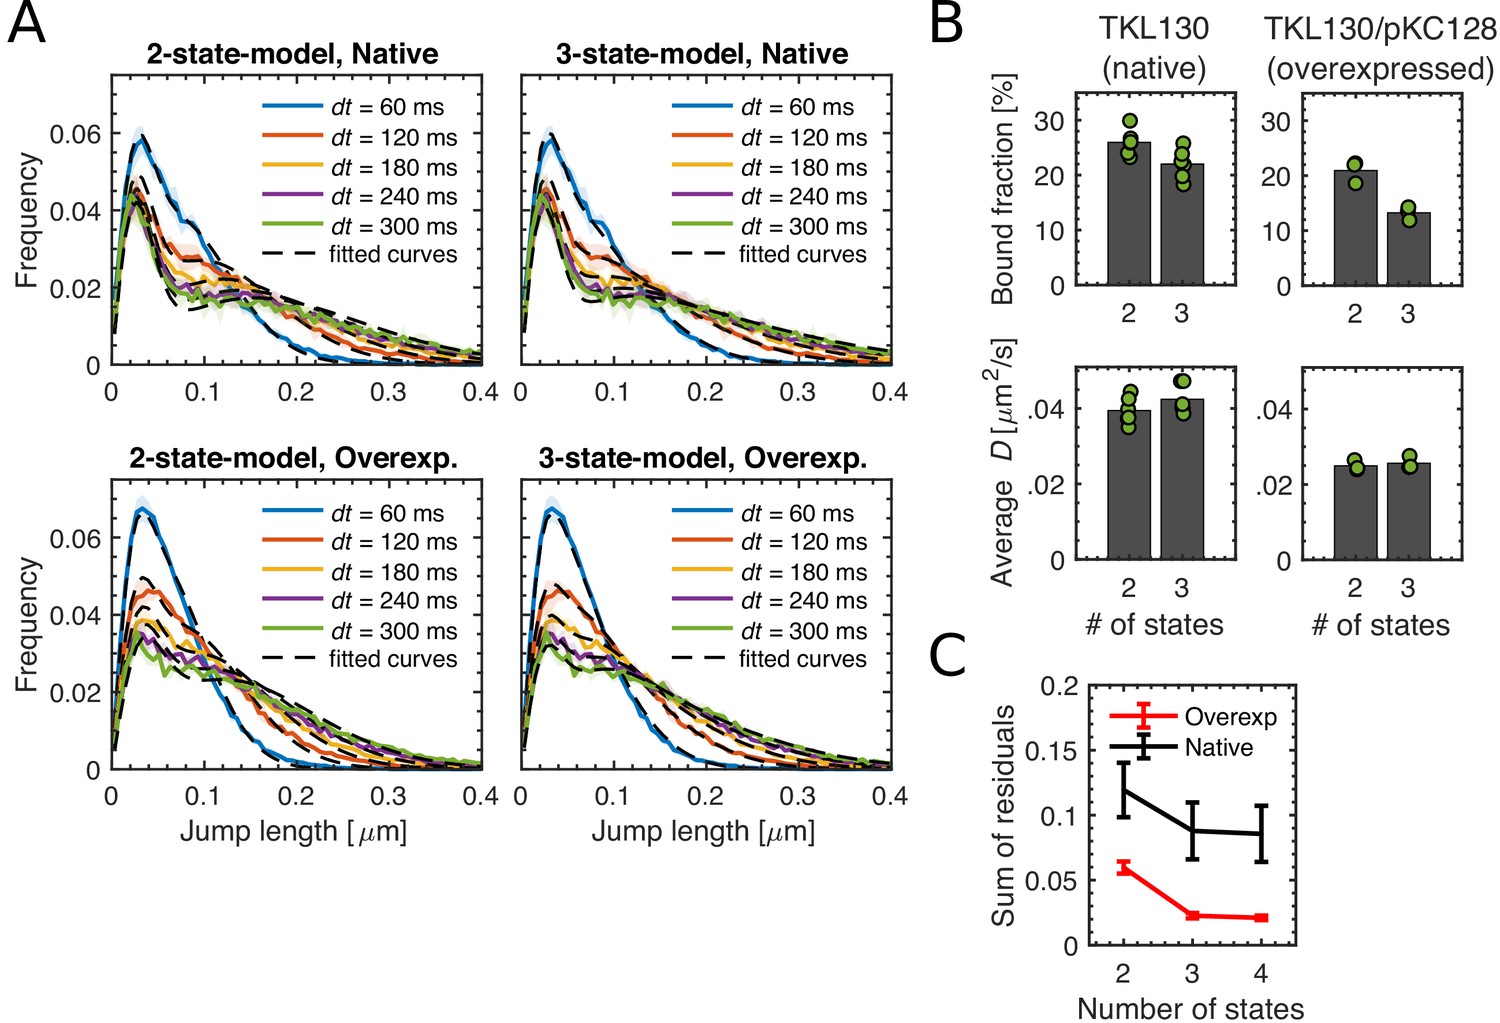
Comparing 2- and 3-state-diffusion models to fit experimental data through Spot-On.
(A) Probability distributions of single-molecule jump lengths (solid lines, colored) and fit (dashed, black) using a two-state (left) or three-state (right) diffusion model for different time intervals for native levels (TKL130) and for over-expression (TKL130/pKC128) of PBP2-PAmCherry. Shaded regions show standard deviations between biological replicates. (B) Comparison of bound fractions and average diffusion constants acquired by fitting two-state and three-state diffusion models shown in (A). Dots represent biological replicates. (C) Normalized sum of residuals found by using multi-state models with Spot-On. Error bars show standard error between biological replicates.
Figure 1—figure supplement 3

An alternative approach to fit a two-state diffusion model, based on the distribution of effective diffusion constants.
(A) Heat map of sum of squared differences (RSS) between the Deff distributions of single-track effective diffusion constants Deff obtained from experimental data or computational simulations of a two-state model, using different model parameters D (diffusion constant of the diffusive fraction) and σ (localization precision). Parameter sets giving the lowest 5 RSS values are shown with green diamonds. Best fit is given by D = 0.04 μm2/s and σ = 20 nm. (B) We verified that the non-diffusive population was indeed not diffusing, with Dbound = 0 μm2/s (left), while a finite diffusion constant Dbound > 0.002 um2/s gives poor agreement between simulation and experiment. Here, the experimental Deff distribution is the mean of 6 biological replicates. (C) We compared the results of our method with the Spot-On code (2-state model) in TKL130 (native levels) and TKL130/pKC128 (overexpression), respectively.
Figure 1—figure supplement 4
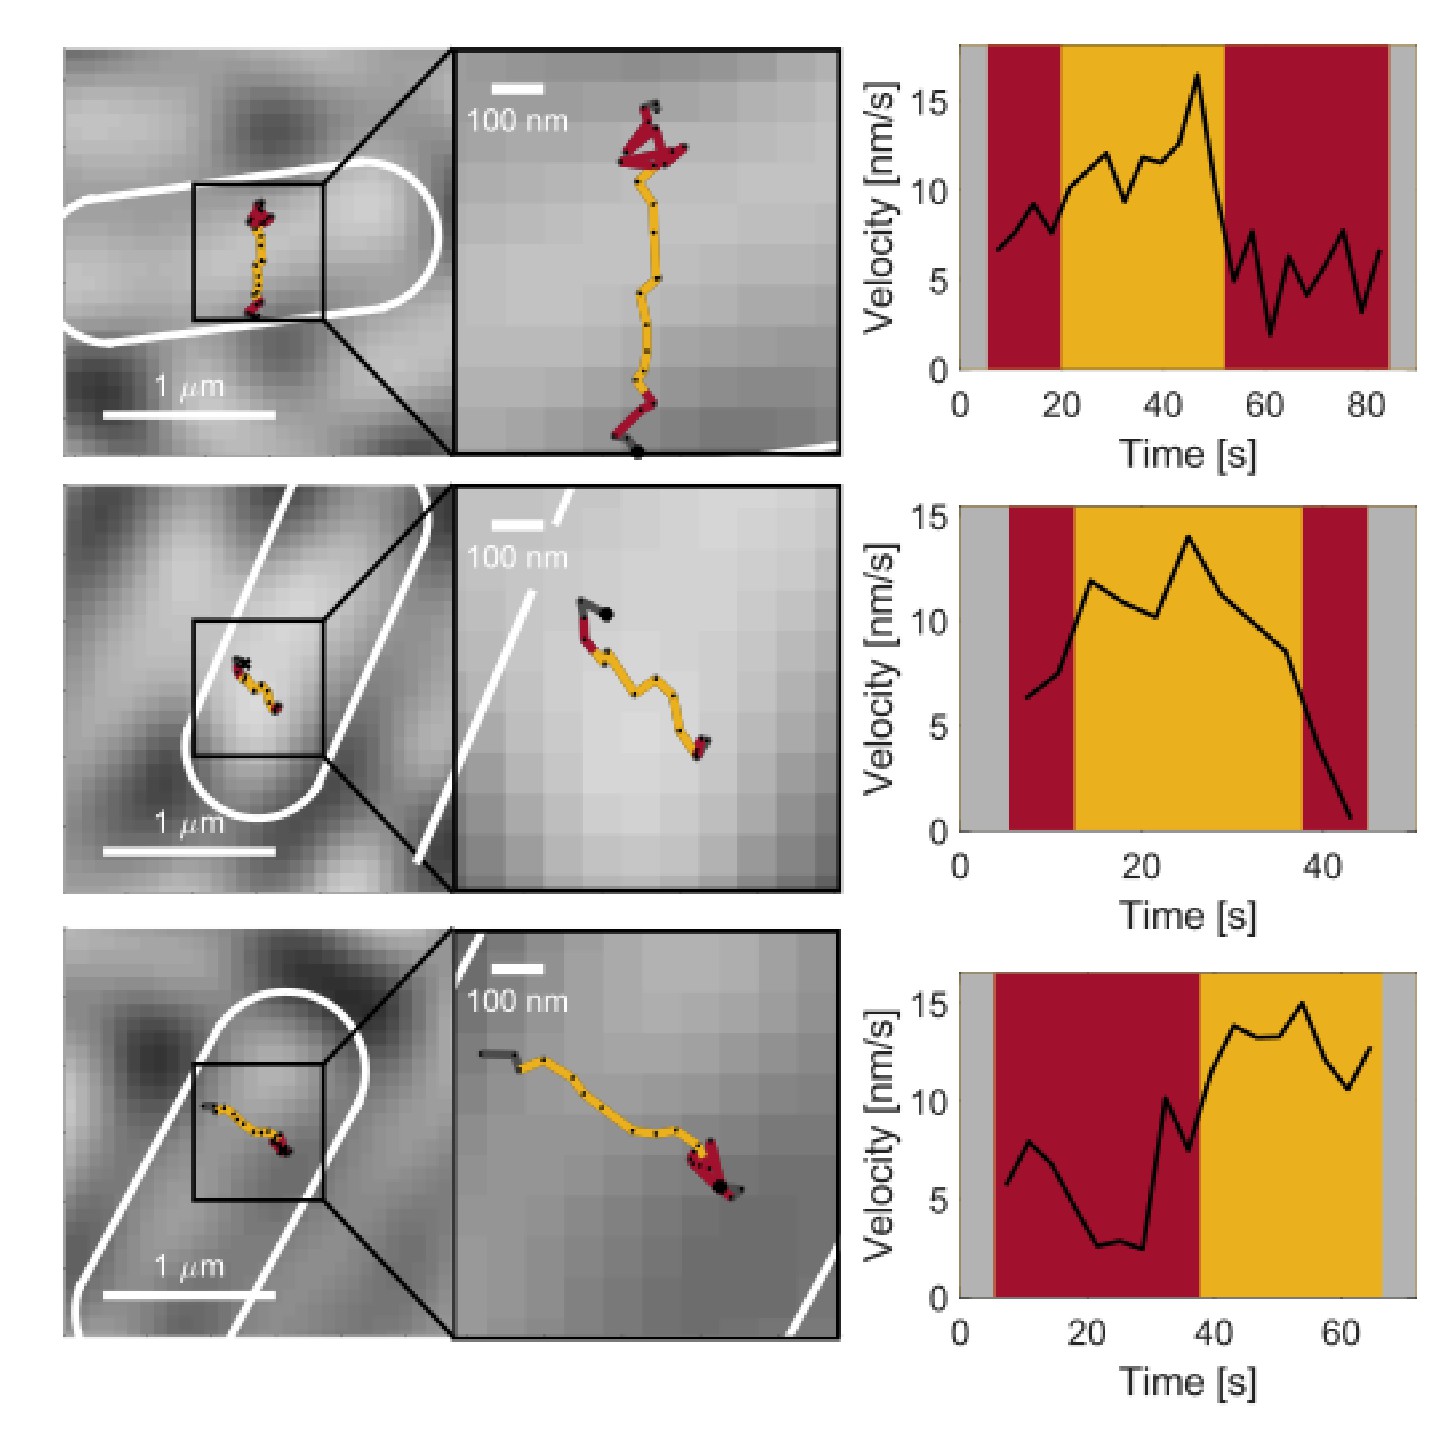
Transitions between immobile and persistent states.
Example tracks and velocity as a function of time for example tracks that show transitions between persistent and immobile states.
Figure 1—figure supplement 5
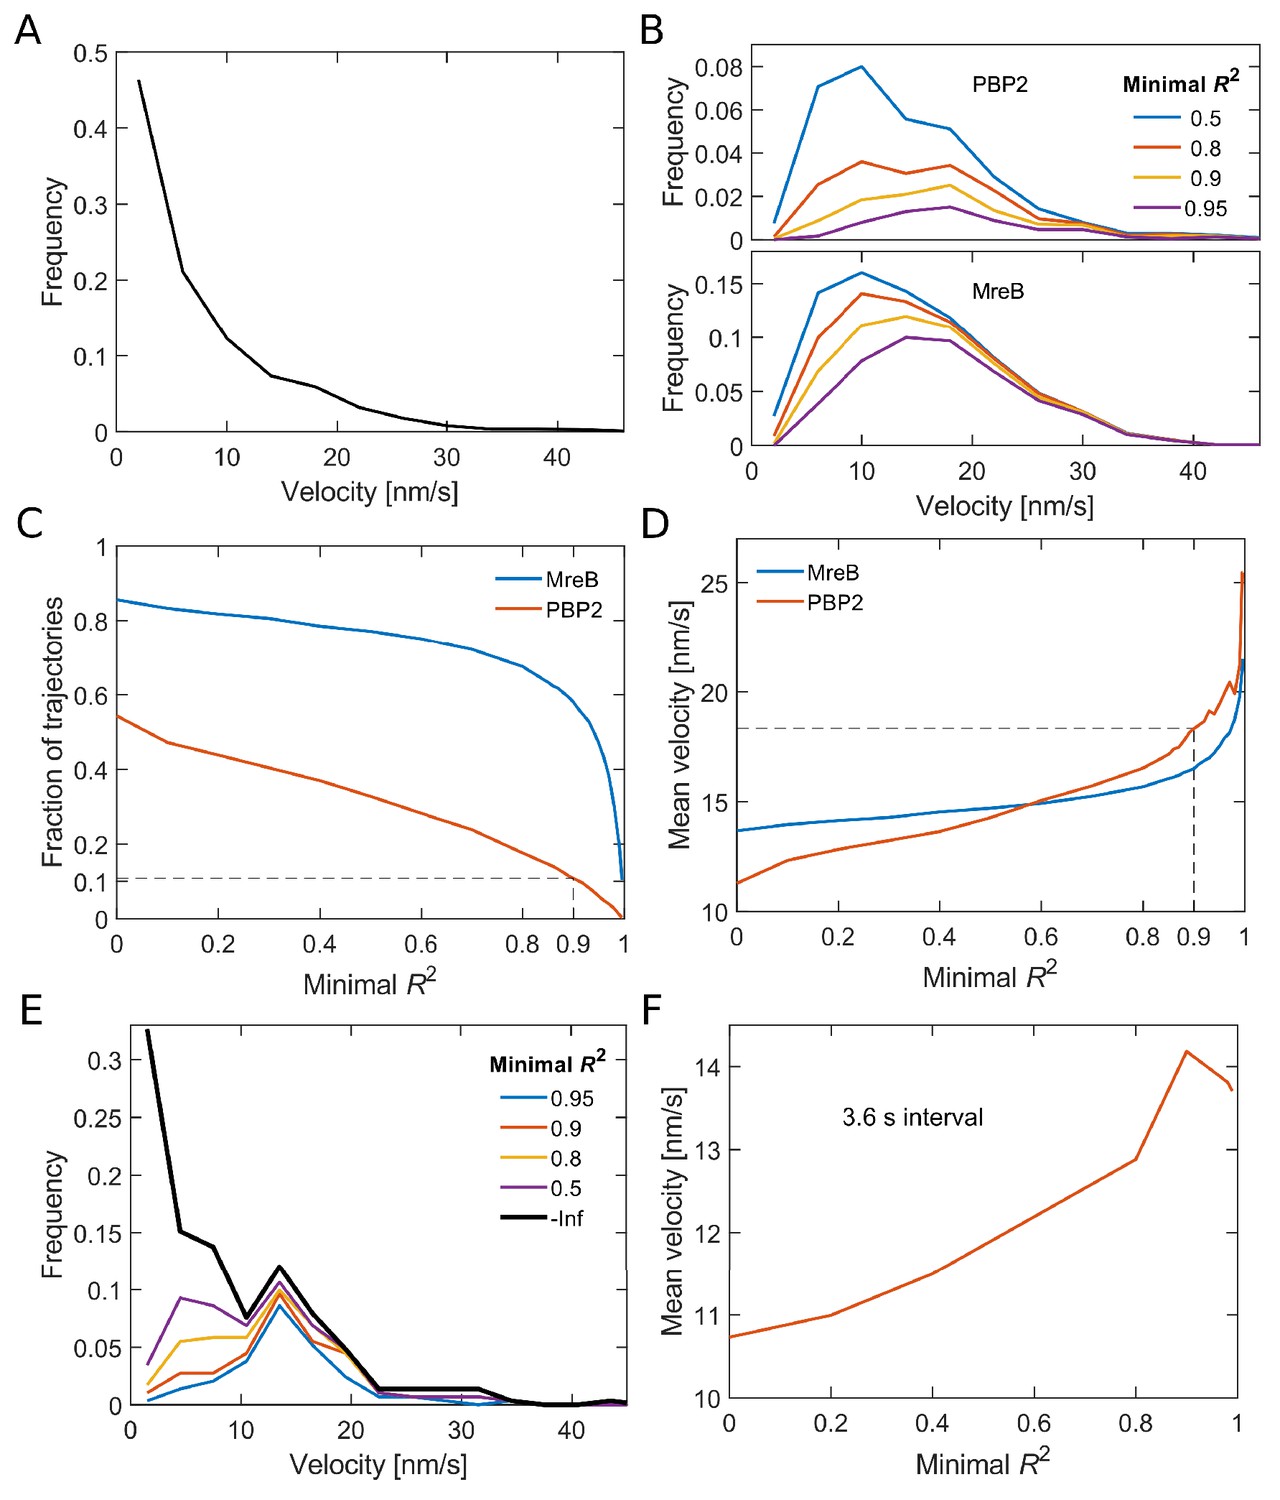
Analysis of bound PAmCherry-PBP2 molecules.
(A) Velocity distribution of all PBP2 tracks measured with 1 s intervals. The velocity of individual tracks was determined by fitting a quadratic function to the MSD. (B) Velocity distributions for directed trajectories of PBP2 and MreB as found by selecting for an increased goodness of fit measured by R2 of a quadratic function to the MSD. (C) The stricter the goodness of fit criterion (minimal R2) the less trajectories contribute to the mean track velocity. (D) The mean velocity increases with increasing minimum R2. The dashed line indicates the value chose for the distributions in Figure 1. (E–F) The same analysis applied on 4-step segments of trajectories measured with 3.6 s intervals delivers smaller mean velocities, likely because fast trajectories reside for a shorter amount of time in the field of view.
Figure 1—figure supplement 6
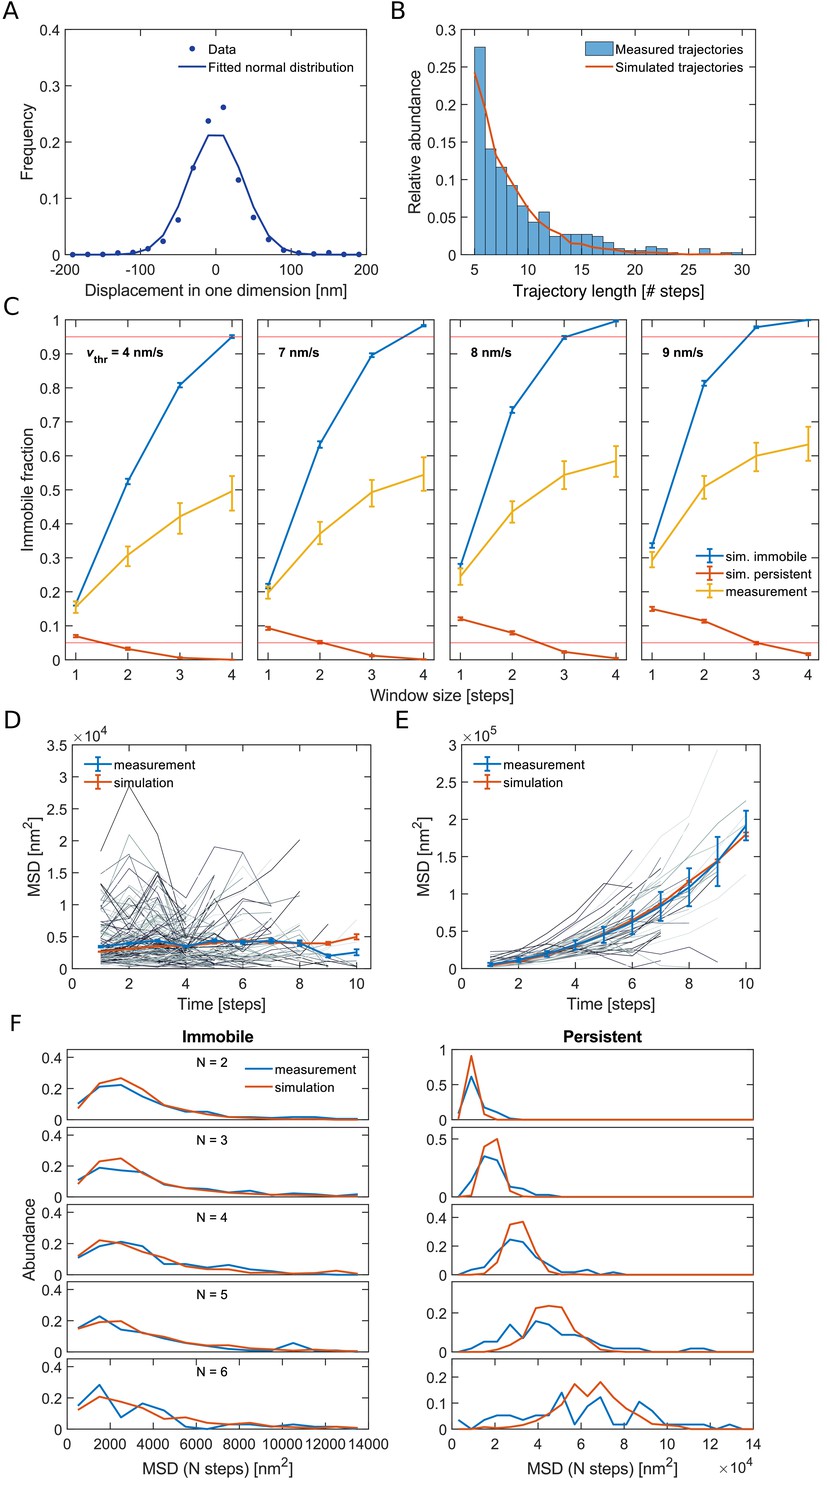
Quantitative analysis of persistent and immobile states based on computational simulations.
(A) Distribution of measured single-step displacements in one dimension. A fit of a normal distribution to the data delivers a standard deviation of 36 nm, which corresponds to a localization error of single localization events of 25 nm. (B) We computationally simulated trajectories such that the length distribution of the simulated trajectories resembles the one from measured trajectories. (C) Fraction of immobile segments measured in simulations of immobile (blue) or persistent (red) molecules and in experimentally measured tracks (yellow) as a function of the moving-average window size and for different velocity thresholds. The red horizontal lines signify 5% and 95% probability thresholds, respectively. Error bars are from bootstrapping. For a window size of 4 steps and a velocity threshold of 8 nm/s the rate of wrong annotation is smaller than 1% both in simulations of purely persistent or immobile molecules. For pairs of w and vthr that lead to high accuracy of the determination of immobile and persistent segments the immobile fraction of the experimental data shows similar results. (D–E) MSD’s of single-track segments (gray lines) classified as (D) immobile or (E) persistent compared to the MSD of all respective segments (blue line). For simulated trajectories that can switch between the immobile and the persistent state (simulated with v = 12 nm/s, kip = 0.015 s−1, kpi = 0.021 s−1) we find a similar behavior of the MSD curves (red line). (F) Distribution of MSD’s of immobile and persistent segments for different numbers of steps N.
Figure 1—figure supplement 7
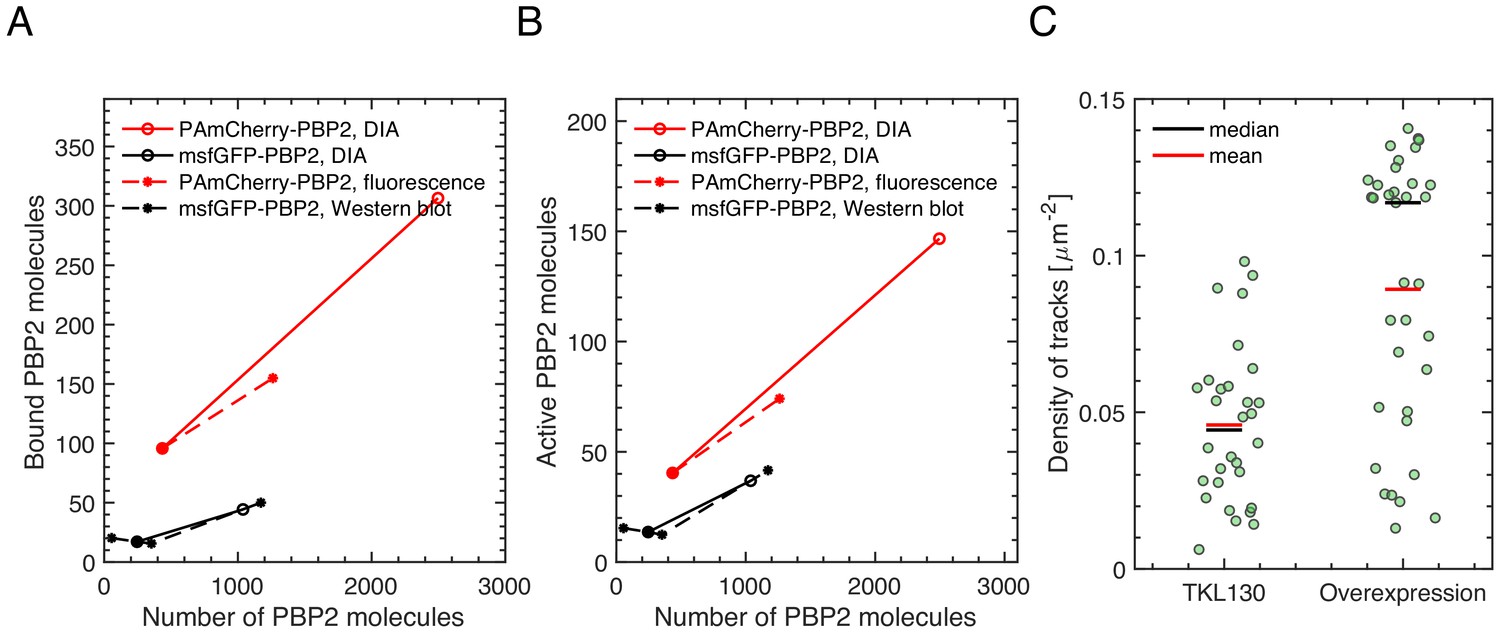
Number of bound PBP2 molecules increases with increasing PBP2 levels.
(A–B) Number of bound PBP2 molecules () (A) and active PBP2 molecules () (B) as a function of the number of PBP2 molecules per cell (NPBP2). b and p are the bound and persistent fractions of molecules, respectively. Since DIA, fluorescence, and Western Blot results only gave relative changes of PBP2 numbers, we used PRM values for TKL130 (for PAmCherry-PBP2) or for TU230(attLHC943) with 5 μM IPTG induction (for msfGFP-PBP2), respectively. (C) Density of tracks obtained by slow tracking for TKL130 and TKL130/pKC128, using same photo-activation and imaging conditions. Dots represent single fields of view (40 × 40 um). Despite variations between different fields of view, the fold-change of the median is of the same order as the relative change of bound molecules obtained in (A).
Figure 1—figure supplement 8

Comparison of AV127, msfGFP-PBP2 (TU230(attLHC943)), msfGFP-PBP2(L61R) (TU230(attLHC943)), and WT strains.
(A) Length (top left), width (bottom left), and growth curves (right) of the strains carrying msfGFP-PBP2 (AV127 or IPTG-inducible) and msfGFP-PBP2(L61R) (labeled 'Mut') for different induction levels in comparison to MG1655. Gray and blue bars show cell dimensions after 6 and 10 hr of growth, respectively (see also Figure 1—figure supplement 9). Doubling times are obtained from exponential fits (dashed lines) to three biological replicates (different colors). (B) PBP2 fold changes acquired from epi-fluorescence images, GFP-Western Blotting, and mass spectrometry measurements (DIA and PRM). The values are normalized by the value acquired from 5 μM IPTG induction except for PRM counts. PRM measurements combined with colony counting yield absolute numbers of proteins per cell. (C) Average diffusion constants and bound fractions. Gray bars show data after 6 hr of growth. Dots represent biological replicates.
Figure 1—figure supplement 9
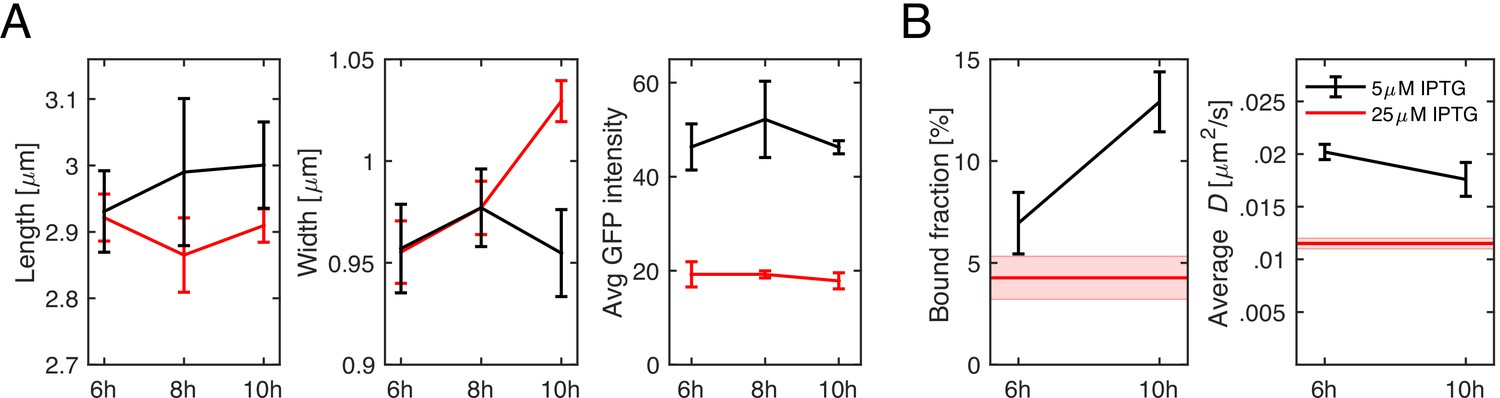
Time-dependent effect of low msfGFP-PBP2 expression.
(A) Cell length, width, and GFP intensity as a function of time of TU230(attLHC943) cells for two different induction levels of 5 μM IPTG (black) and 25 μM IPTG (red). (B) Bound fractions and average diffusion constants. Red lines in (B) indicate the values measured for 25 μM induction during steady-state growth. Shaded areas and error bars show standard deviation between at least three technical replicates.
Figure 1—figure supplement 10
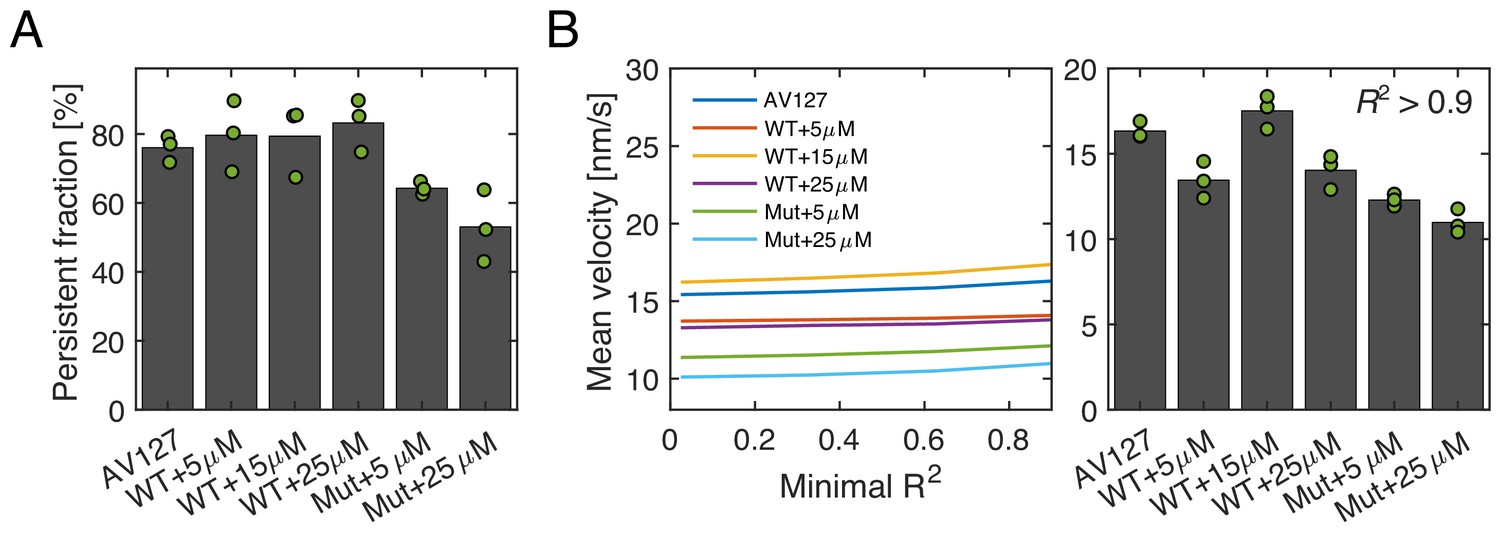
Low-frequency tracking of msfGFP-PBP2 and msfGFP-PBP2(L61R) cells under different induction levels.
(A) Persistent fractions for different expression levels of msfGFP-PBP2 and msfGFP-PBP2(L61R). (B) Left. Mean velocity as a function of minimal R2, which are obtained from a quadratic fit to single-track MSD’s of the form y = a + bx2. Right. Mean velocity of tracks, which satisfy R2 > 0.9. Dots represent biological replicates.
Figure 1—video 1
High-frequency imaging of PAmCherry-PBP2.
Left. Denoised bright-field image taken at the beginning of the video. Right. Raw images from high-frequency imaging (imaging interval 60 ms) of PAmCherry–PBP2 show diffusive and bound molecules. Blue circles and lines represent peaks and corresponding tracks considered for analysis.
Figure 1—video 2
Low-frequency imaging of PAmCherry-PBP2.
Left. Denoised bright field image Right. Raw images from low frequency imaging (imaging interval 3.5 s) of PAmCherry–PBP2 show immobile and persistently moving molecules. Blue circles and lines represent peaks and corresponding tracks considered for analysis.
Figure 1—video 3
High-frequency imaging of msfGFP-PBP2.
Left. Denoised bright field image taken at the beginning of the video. Right. Raw images from high frequency imaging (imaging interval 60 ms) of msfGFP–PBP2 (AV127) show diffusive and bound molecules. Blue circles and lines represent peaks and corresponding tracks considered for analysis.
Figure 1—video 4
Low-frequency imaging of msfGFP-PBP2.
Left. Denoised bright field image Right. Raw images from low frequency imaging (imaging interval 3.5 s) of msfGFP–PBP2 (AV127) show immobile and persistently moving molecules. Blue circles and lines represent peaks and corresponding tracks considered for analysis.
Figure 2 with 1 supplement
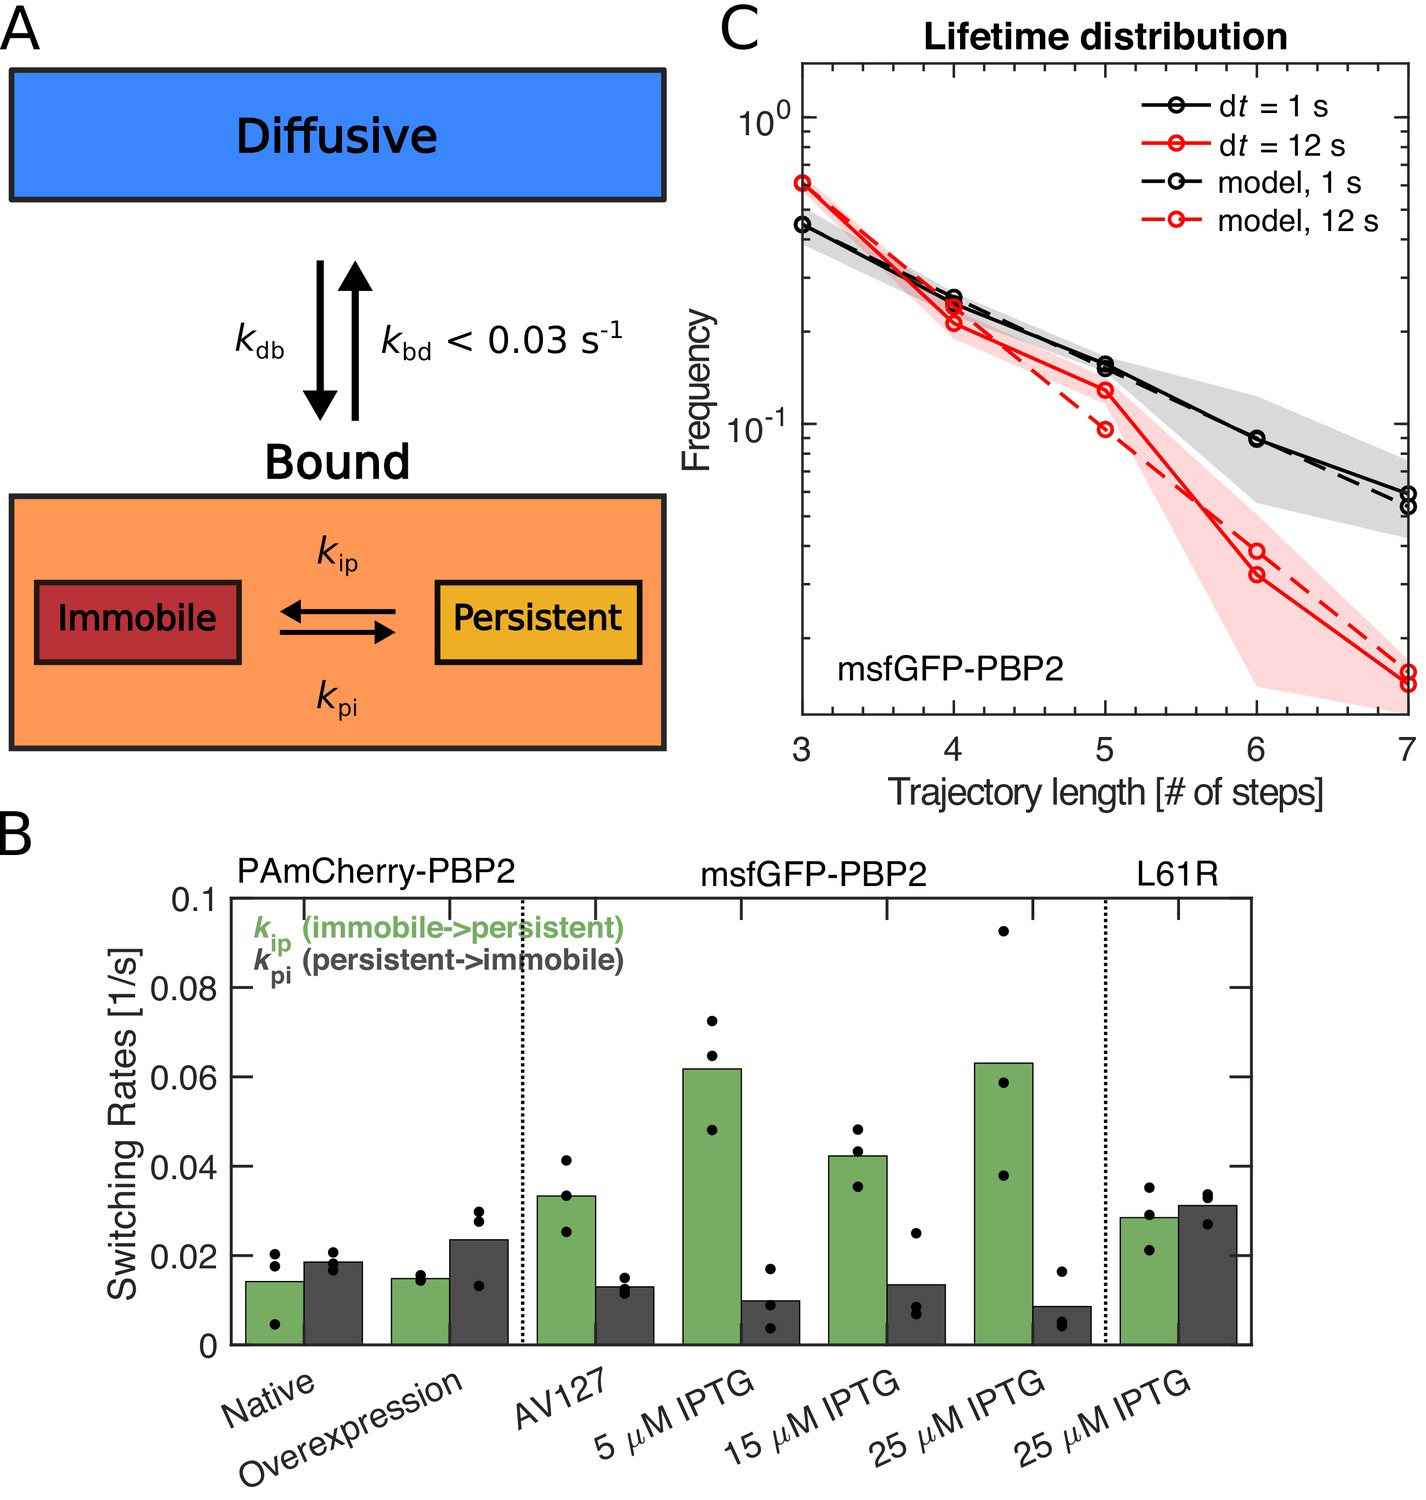
PBP2 molecules transition between different dynamic states.
(A) Diagram illustrating transition rates measured between different motion states. (B) Transition rates between immobile and persistently moving states for different protein fusions and expression levels. Circles: biological replicates. (C) Fluorescence-lifetime distributions of msfGFP-PBP2 trajectories with imaging intervals of 1 s (black solid line) and 12 s (red solid line). Dashed lines represent a joint fit of the two curves to a model of photobleaching and bleaching-independent track termination, the latter comprising unbinding and persistently molecules leaving the TIR field of view (bleaching probability per frame pb = 0.39 ± 0.08, apparent track termination rate ka = 0.035 ± 0.007 s−1). Based on a model for persistent motion, we obtained an upper limit of the unbinding rate of kbd <0.03/s (Figure 2—figure supplement 1). Shaded region: Standard deviation between at least three technical replicates.
-
Figure 2—source data 1
Table containing all data presented in Figure 2.
- https://cdn.elifesciences.org/articles/50629/elife-50629-fig2-data1-v2.xlsx
Figure 2—figure supplement 1
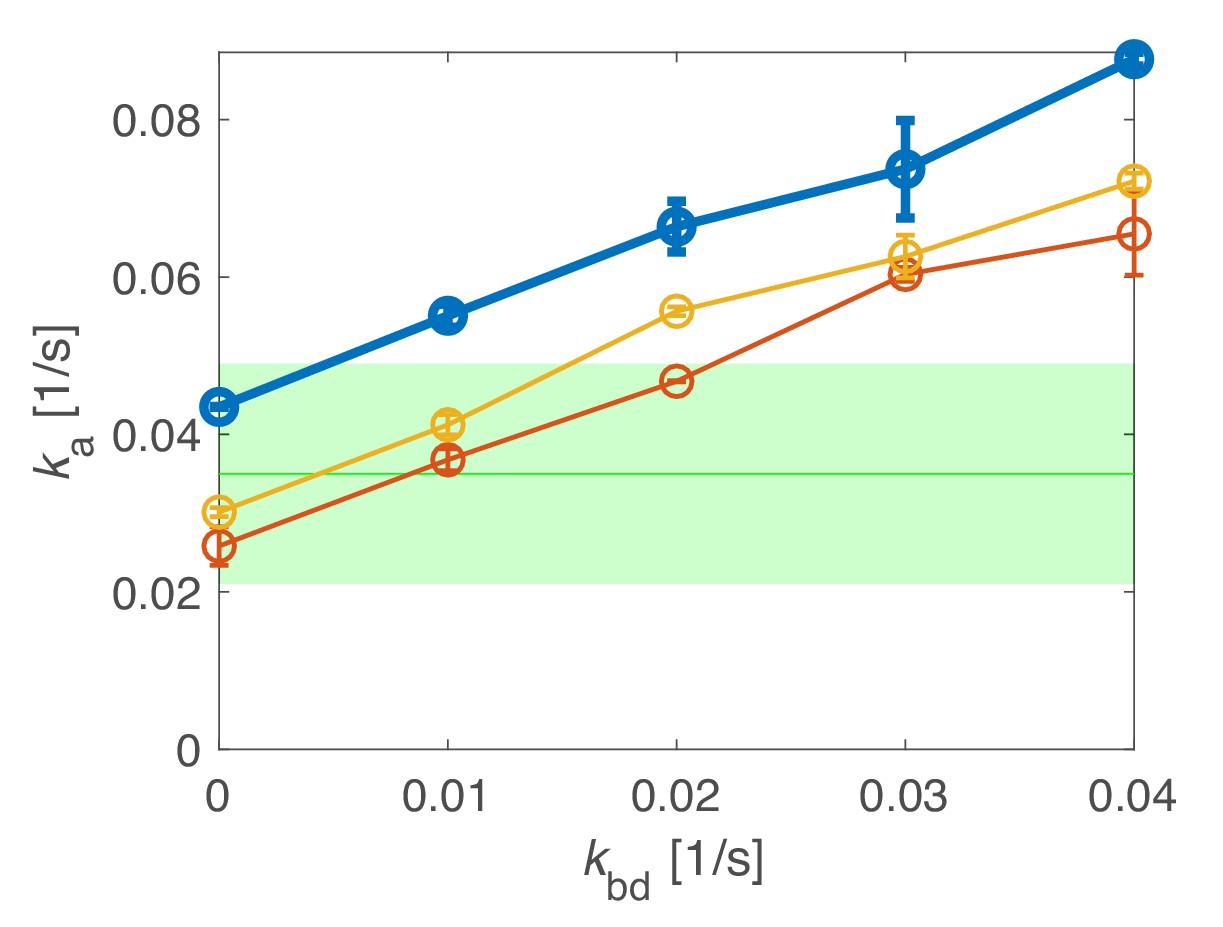
Determination of an upper limit of the unbinding rate kbd through simulations.
Simulations of track-length distributions reveal the apparent track termination rate ka as a function of the unbinding rate kbd for different transition simulated rates kip, kpi. Top: kip = 0.063/s, kpi = 0.0086/s (experimentally measured rates, leading to a bound fraction of 88%); middle and bottom (thin solid lines): kip = 0.063/s, kpi = 0.0158/s; kip = 0.033/s, kpi = 0.0086/s. For the thin solid lines, we adjusted either of the two rates to yield the experimentally measured bound fraction of 80%. Comparison with the experimentally measured apparent unbinding rate (green) allows us to infer an upper bound for the unbinding rate kbd < 0.03/s. Shaded area: 95% confidence interval.
Figure 3 with 6 supplements
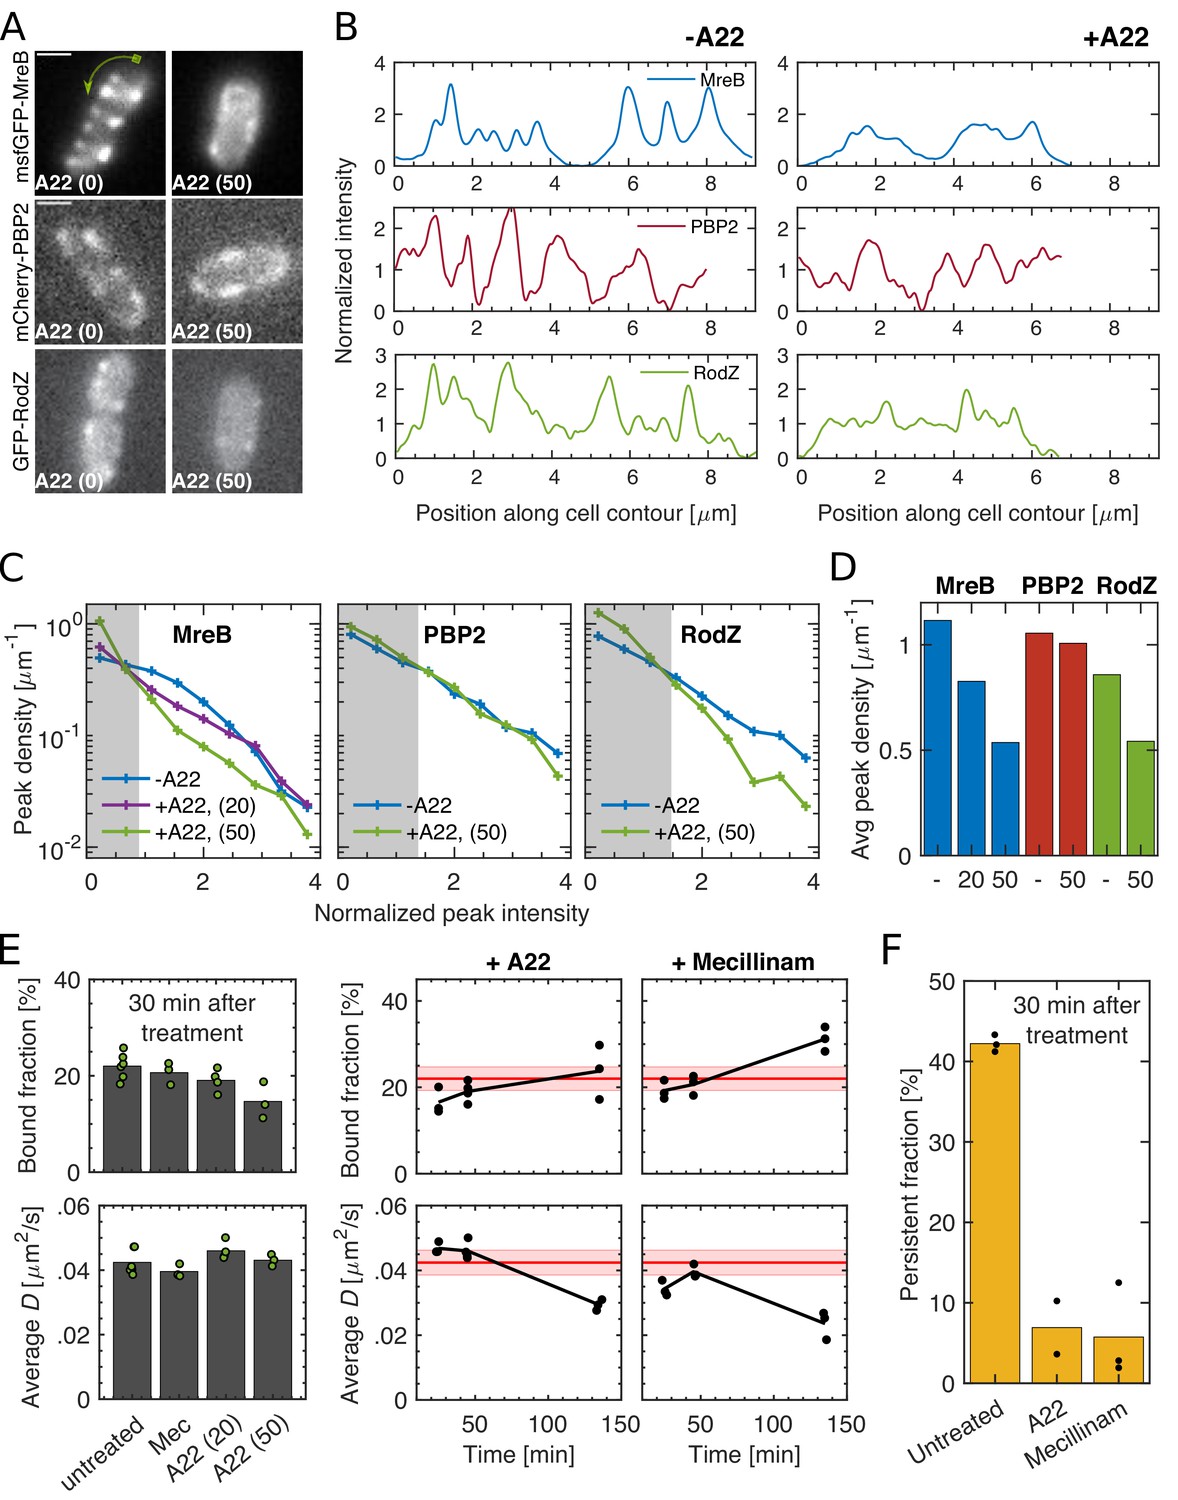
Spatial distribution and magnitude of PBP2 bound fraction are independent of MreB cytoskeleton.
(A–B) 30 min A22 treatment (50 μg/ml) visibly reduces peak number and intensity of MreB-msfGFP and GFP-RodZ but not of mCherry-PBP2 on cell boundaries, as seen in epi-fluorescence images (A) and in line profiles measured along the cell contour (B), starting from one cell pole at x = 0 as indicated by the green arrow in (A). Image exposure time 1 s. Scale bar 1 μm. (C) Peak density on the cell boundary [1/μm] as function of peak intensity for two A22 concentrations (20, 50 μg/ml). Intensities are normalized by median peak intensity in untreated cells. Gray regions: peaks within noise floor. (D) Density of all peaks above noise floor in (A) for untreated and A22-treated conditions. (E) Left. Bound fraction and diffusion constant of PAmCherry-PBP2 30 min after drug treatment with mecillinam (labeled ‘Mec’, 100 μg/ml) or A22 (20 or 50 μg/ml). Right. Bound fraction and diffusion constant over time after treatment with A22 (20 μg/ml) or mecillinam (100 μg/ml). Dots indicate technical replicates. Red lines and shaded areas: Average values and standard deviations between biological replicates from untreated cells. (F) Persistent fractions corresponding to the 30 min time point in (E).
-
Figure 3—source data 1
Table containing all data presented in Figure 3 and Figure 3—figure supplements 1–4.
The file Dataset-Fig3.xlsx contains: Figure 3C-D. Numerical values of the distribution of peak intensities, average peak density, pixel noise and number of cells considered for untreated and A22-treated cells carrying either mCherry-PBP2, MreB-msfGFP, or GFP-RodZ fusion. Figure 3E Number of tracks, average diffusion constants, and bound fractions from high frequency imaging for non-treated, A22- and Mecillinam- treated cells from TKL130, including p-values for bound fractions and diffusion constants. Figure 3F Number of tracks and persistent fractions from low frequency imaging for non-treated, A22- and Mecillinam- treated cells from TKL130, including p-values for persistent fractions. Figure 3—figure supplement 2 Numerical values of the distribution of peak intensities, average peak density, pixel noise and number of cells considered for untreated and A22-treated cells carrying either mCherry-PBP2, MreB-msfGFP, or GFP-RodZ fusion. Figure 3—figure supplement 3 Number of tracks, average diffusion constants, and bound fractions from high frequency imaging for non-treated and A22-treated cells from AV127, including p-values for bound fractions and diffusion constants. Figure 3—figure supplement 4 Width, length and doubling time from OD600 measurements for non-treated, A22- treated and Mecillinam- treated cells from TKL130.
- https://cdn.elifesciences.org/articles/50629/elife-50629-fig3-data1-v2.xlsx
Figure 3—figure supplement 1

Sample fluorescence profiles on cell boundaries as in Figure 3B.
Fluorescence profiles along contours of different cells carrying mCherry-PBP2, MreB-msfGFP, or GFP-RodZ fusions for untreated (left) or A22 treated cells (50 μg/ml) (right), obtained in the same way as in Figure 3A,B. Intensities are normalized by the median value and smoothened with a Gauss filter with standard deviation of 33 nm (0.5 pixel).
Figure 3—figure supplement 2

Spotty patterns of MreB, RodZ and PBP2 in TIRF microscopy.
(A) Sample TIRF images with cell centerline plotted in cyan. Scale bar 1 um. (B–C). In analogy to Figure 3C–D, TIRF microscopy shows that A22 (30 min; 50 μg/ml) visibly reduces peak number and intensity of MreB-msfGFP and GFP-RodZ but not of mCherry-PBP2.
Figure 3—figure supplement 3

Verification of bound fraction measurements with A22 treated cells carrying the msfGFP-PBP2 fusion.
Bound fractions and average diffusion constants for untreated and A22-treated (for 30 min) cells carrying the msfGFP-PBP2 fusion (AV127). Dots represent biological replicates.
Figure 3—figure supplement 4
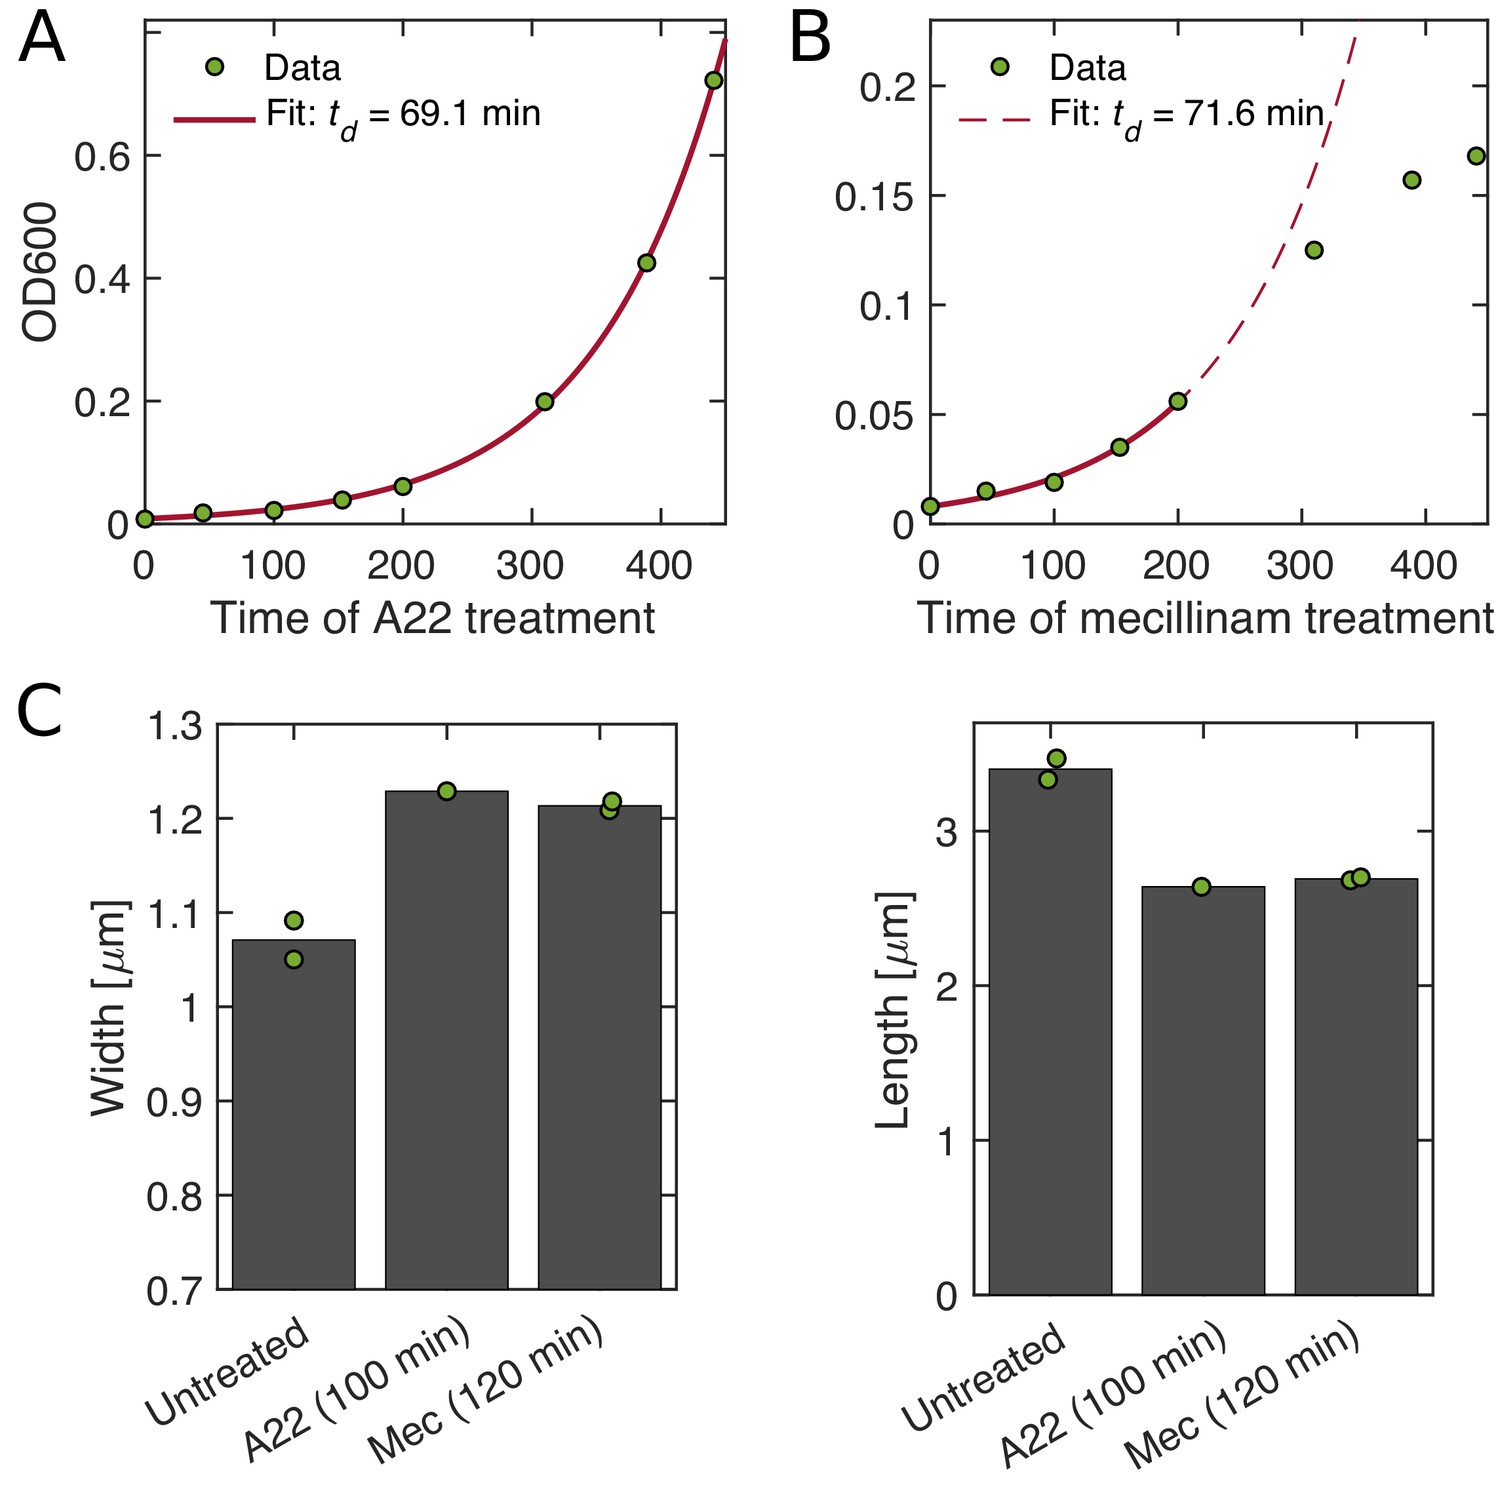
Growth and shape of A22- and mecillinam-treated cells.
(A–B) A22-treated cells grow unperturbed for six generations (A), while cells treated with mecillinam show a reduced growth rates after around three generations (B). (C) Cell shape of cells treated with A22 (A) and mecillinam (B). In both cases, cells become wider and shorter. Dots represent technical replicates.
Figure 3—video 1
MreB-msfGFP imaging.
Left. Phase contrast image taken at the beginning of the video. Right. Raw images of MreB-msfGFP motion (imaging interval 1 s) of NO53 cells. Blue circles and lines represent peaks and corresponding tracks considered for analysis.
Figure 3—video 2
MreB-msfGFP imaging of A22 treated cells.
Left. Phase contrast image taken at the beginning of the video. Right. Raw images of MreB-msfGFP motion (imaging interval 2 s) of NO53 cells treated with 20 μg/ml A22 for a duration of 30 min. Blue circles and lines represent peaks and corresponding tracks considered for analysis.
Figure 4 with 1 supplement

PBP2 slowly transitions between diffusive and bound states.
(A) Bound-Molecule-FRAP reveals rate of PAmCherry-PBP2 binding kdb: (i) Diffusive (stars) and bound (hexagons) molecules are activated at bottom of cell through TIR illumination. (ii) Most activated diffusive molecules (purple) leave the field of view. (iii) Remaining molecules are bleached (red). (iv) Activated diffusive molecules partially return into the field of view, where they can bind (black arrow). (v) Measurement of bound fraction. (B) Bound fraction of PAmCherry-PBP2 in A22-treated (20 μg/ml) cells according to (A) at different lag times. Black horizontal line and shaded area: bound fraction without bleaching and standard deviation from technical replicates. An exponential fit in the form b(t) = a1 - a2 exp[-kdb t] (red line) yields binding rate kdb = (4.3 ± 2)*10−3 s−1. Dots represent technical replicates. Shaded area shows standard deviation between six biological replicates. (C) Fluorescence-lifetime distributions of msfGFP-PBP2 tracks in A22-treated cells with imaging intervals of 1 s (black solid line) and 12 s (red solid line) yields unbinding rate kbd = 0.02 ± 0.01 s−1. Shaded area shows standard deviation between at least three technical replicates. (D) Cartoon of suggested Rod-complex initiation: PBP2 (blue) binds to a target site in the cell envelope (white circle) independently of MreB filaments or PBP2 activity. PBP2 or the target site then recruits an MreB filament through diffusion and capture (green) or through nucleation, and also recruits other rod-complex components (magenta).
-
Figure 4—source data 1
Table containing all data presented in Figure 4 and Figure 4—figure supplement 1 .
The file Dataset-Fig4.xlsx contains: Figure 4B Number of tracks and bound fractions from Bound-molecule-FRAP measurements at different time lags with A22-treated cells from TKL130. Figure 4C Values of histogram counts of track lengths of msfGFP-PBP2 tracks from A22-treated cells for lifetime measurements. Figure 4—figure supplement 1 Number of tracks and bound fractions from bound-molecule-FRAP measurements at different time lags with non-treated cells from TKL130.
- https://cdn.elifesciences.org/articles/50629/elife-50629-fig4-data1-v2.xlsx
Figure 4—figure supplement 1
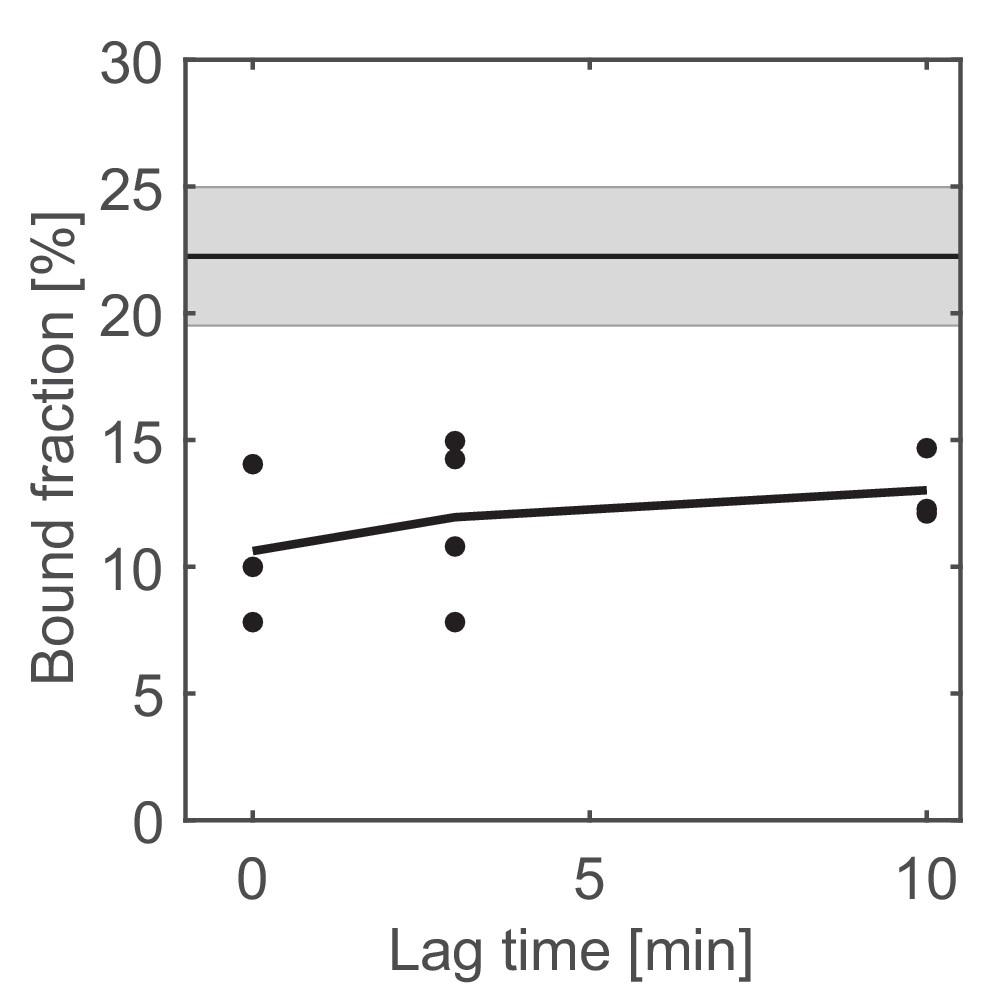
Change in the bound fraction after photobleaching of untreated cells.
The horizontal line corresponds to the mean bound fractions obtained from unbleached cells (see Figure 3). Error bars and shaded area show standard deviations between at least three technical replicates.
Figure 5 with 3 supplements
The effect of the depletion of Rod-complex components on PBP2 binding and activity.
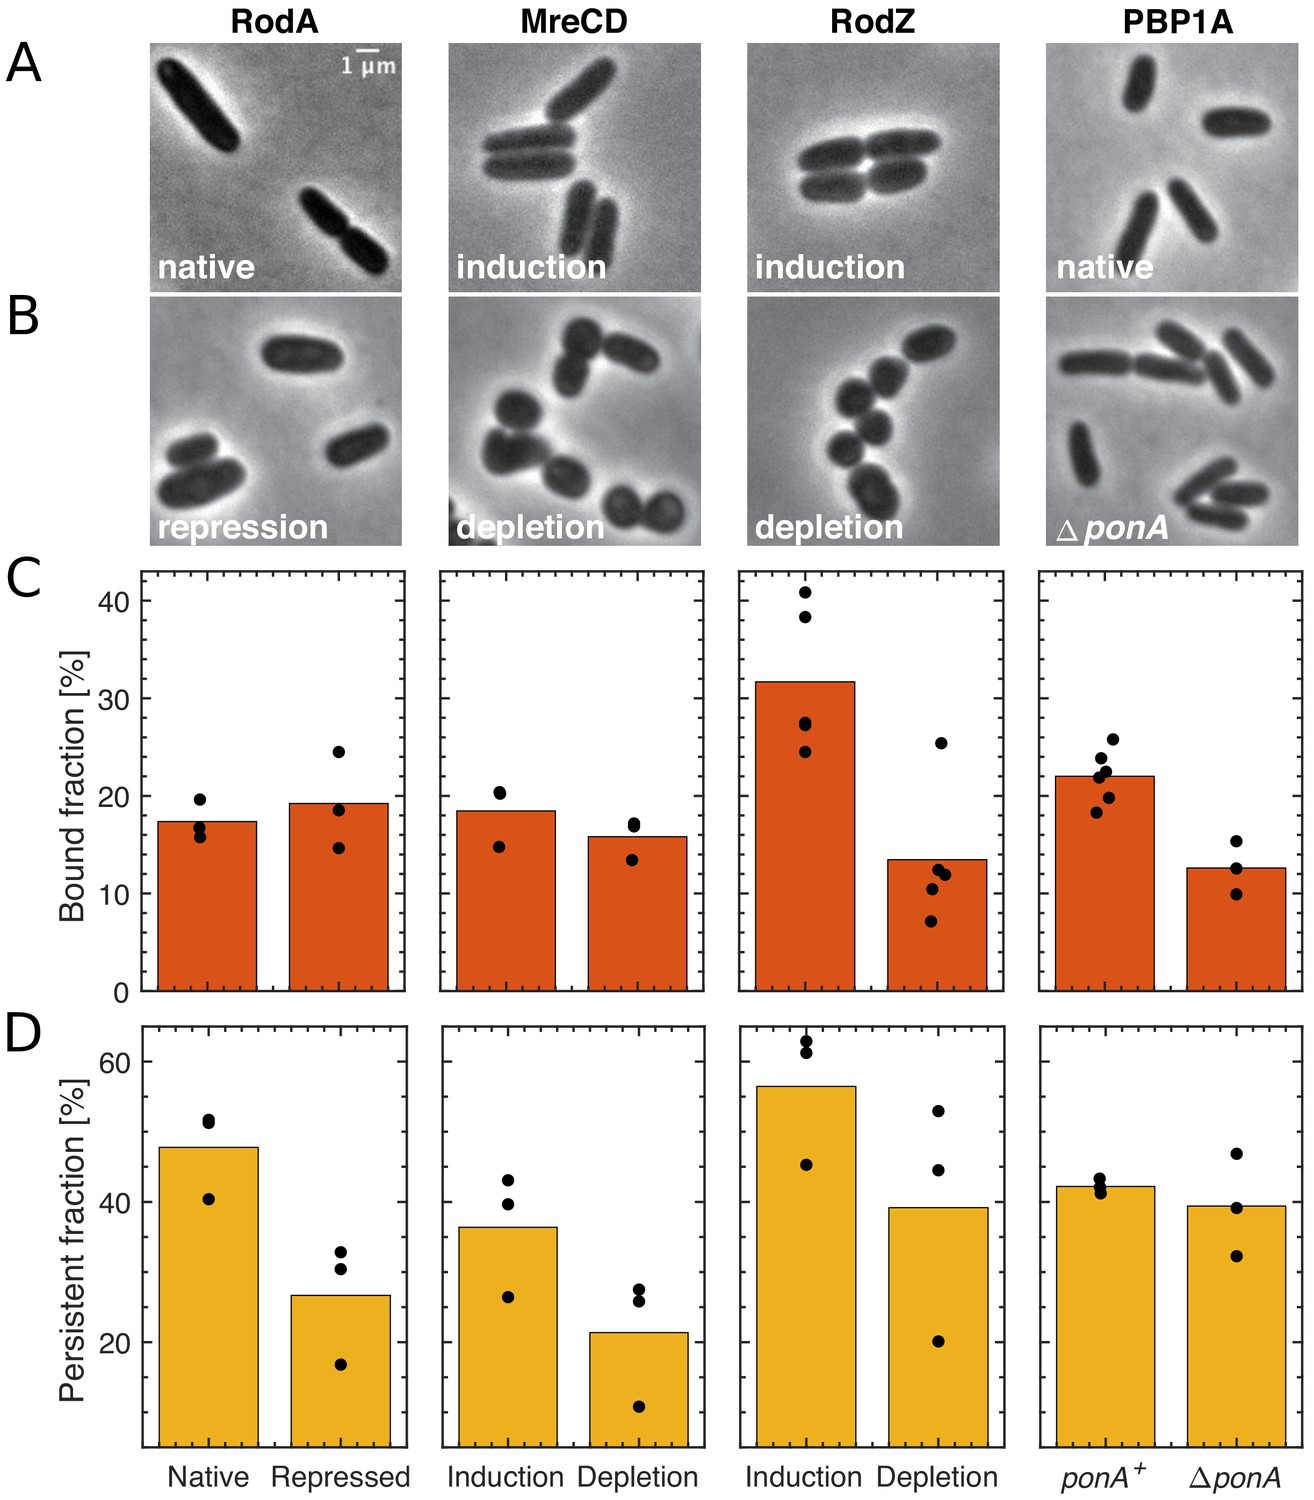
(A–B) Cell shape upon near-native expression (A) or long-time depletion (B) of RodA, MreCD, RodZ, or PBP1a. RodA was repressed for 9 hr through CRISPRi against mrdAB operon (coding for PBP2 and RodA) in AV48/pKC128 [PmrdA::PAmCherry-PBP2]. Here, PBP2 was 2–5-fold overexpressed from plasmid pKC128 to avoid PBP2 depletion upon mrdAB repression. MreCD was depleted for 6 hr in TKL130 ΔmreCD/pFB121 [Plac::mreCD]. RodZ was depleted for 6 hr in TKL130 ΔrodZ/pFB290 [Plac::rodZ]. PBP1a is not essential and was deleted. In all cases except for PBP1A, cells loose rod-like cell shape. (C–D) Bound fractions (C) and persistent fractions (D) of PAmCherry-PBP2 upon expression or depletion of proteins indicated above (A). Dots represent biological replicates.
-
Figure 5—source data 1
Table containing all data presented in Figure 5 and Figure 5—figure supplements 1–3.
The file Dataset-Fig5.xlsx contains: Figure 5C Number of tracks, average diffusion constants and bound fractions of PAmCherry-PBP2 tracks from high frequency imaging during depletion of Rod-complex components, including p-values for bound fractions and diffusion constants. Figure 5D Number of tracks and persistent fractions of PAmCherry-PBP2 tracks from low frequency imaging during depletion of Rod-complex components, including p-values for persistent fractions. Figure 5—figure supplement 1 OD600 measurements during depletion of Rod-complex components. Figure 5—figure supplement 2A-B Shape measurements during depletion of Rod-complex components. Figure 5—figure supplement 2C-D Mass spectrometry measurements (DIA method) of MreC, RodA, RodZ, and PBP2 during depletion of Rod-complex components. Protein levels are normalized by the mean of the corresponding protein level in MG1655. Figure 5—figure supplement 2E see data for Figure 5C. Figure 5—figure supplement 2F Number of tracks, average diffusion constants, and bound fractions of PAmCherry-PBP2 tracks from high frequency imaging at different times of RodZ depletion, including p-values for diffusion constants and bound fractions. Figure 5—figure supplement 3D Pearson correlation coefficients between (i) mCherry-PBP2 and GFP-RodZ or (ii) MreB-mCherry and GFP-RodZ signals for each cell.
- https://cdn.elifesciences.org/articles/50629/elife-50629-fig5-data1-v2.xlsx
Figure 5—figure supplement 1
Depletion of Rod-complex components shows no effect on growth.
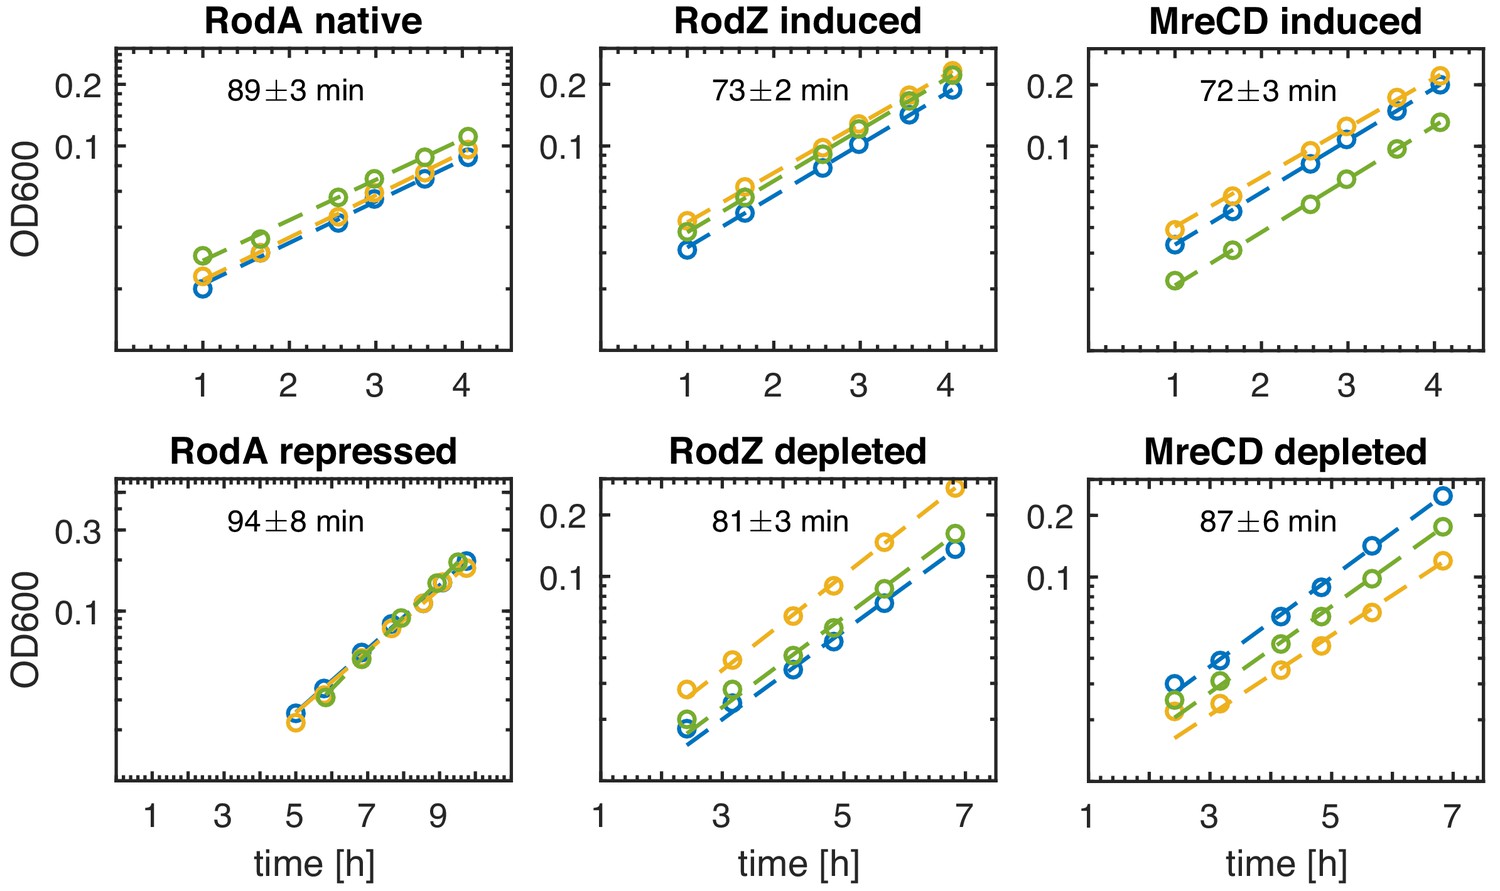
Growth curves for the different depletion strains in induced and depleted conditions as a function of time after initiating protein depletion. The doubling time is obtained from an exponential fit. three biological replicates for each condition. Y-axis is shown in log-scale.
Figure 5—figure supplement 2
Depletion of Rod-complex components.
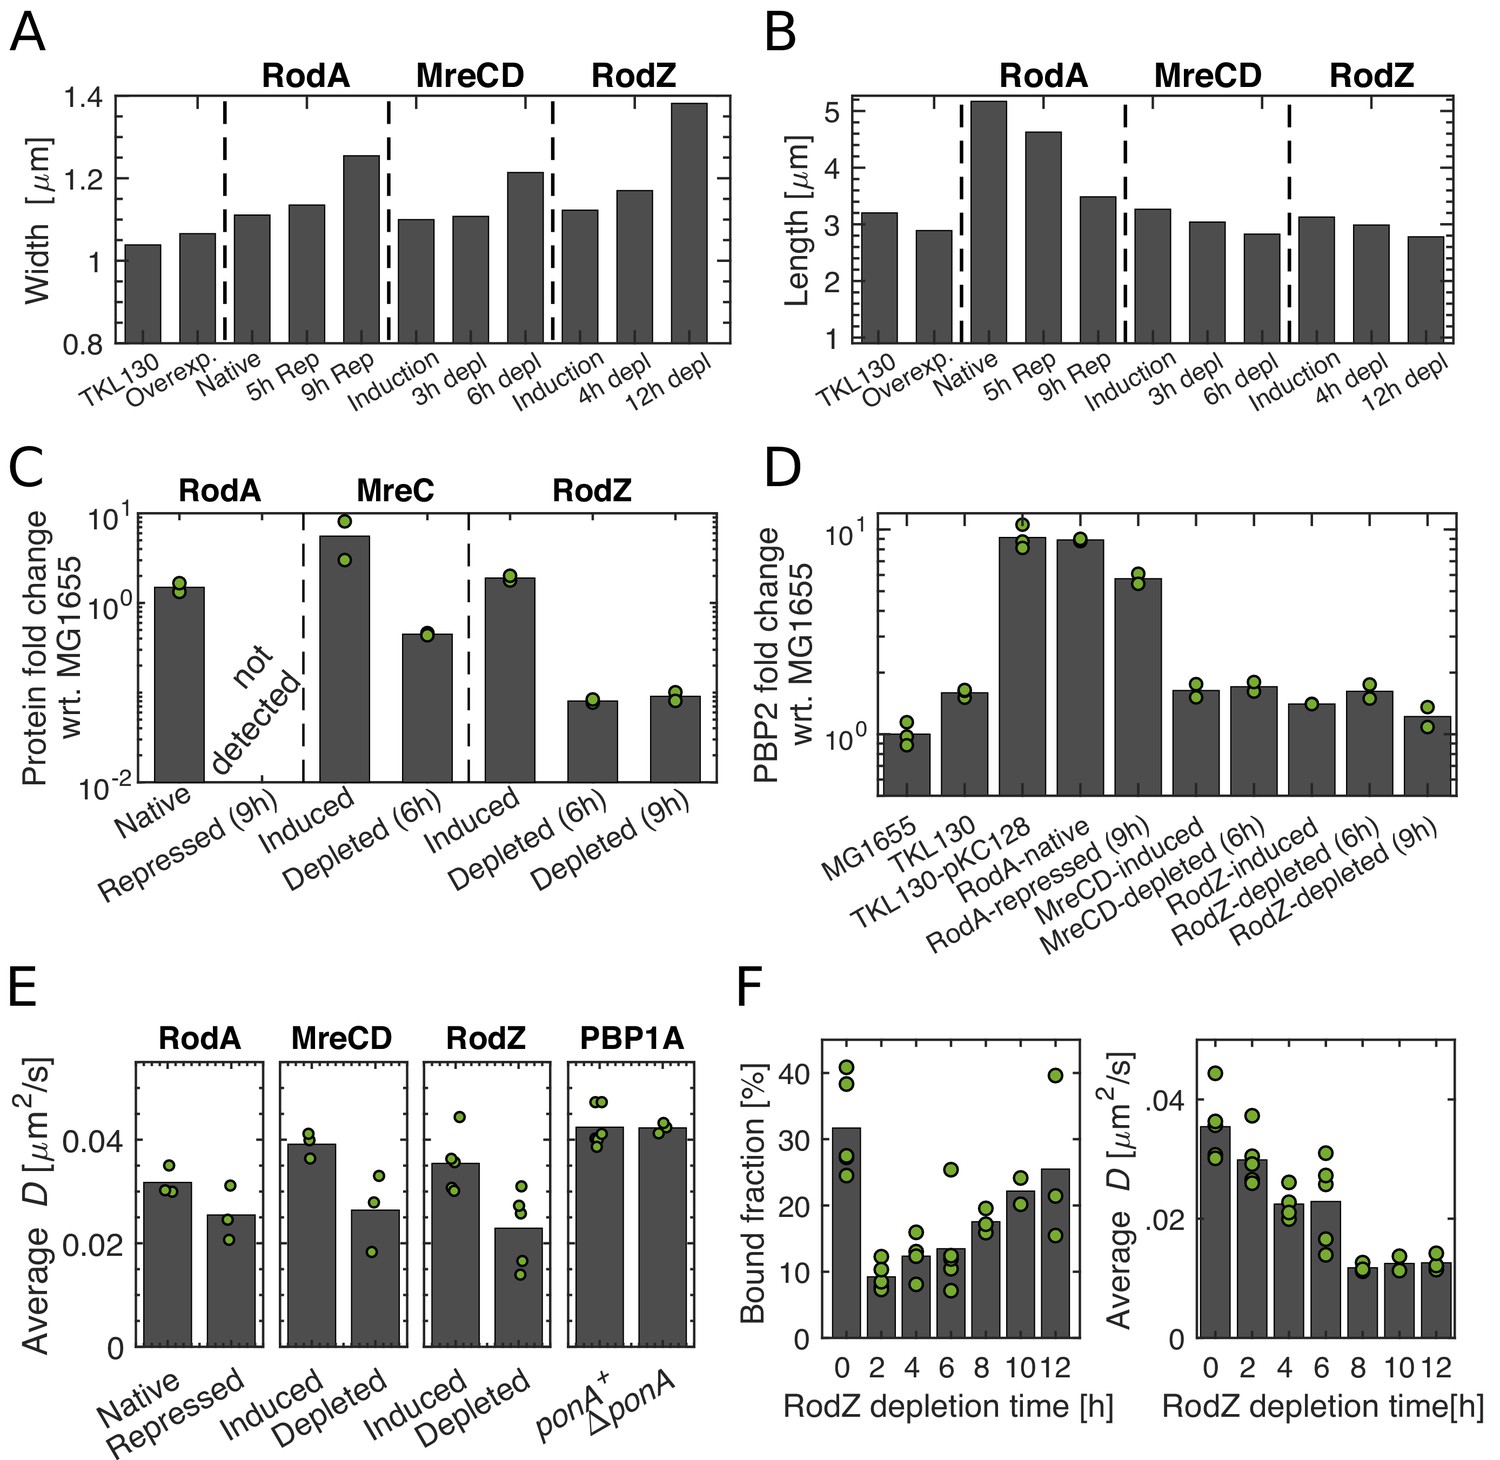
(A–B) Cell length and width upon repression of RodA, and depletion of MreCD or RodZ at different time points after initiating protein depletion. (C–D) Levels of RodA, MreC, and RodZ (C) and levels of PBP2 (D) acquired by mass spectrometry (DIA). Protein levels are normalized by the mean of the corresponding protein level in MG1655. Dots represent two biological replicates for each condition. (E) Average diffusion constants drop upon repression of potential members of the Rod complex. Dots represent biological replicates. (F) Bound fraction and average diffusion constant of PBP2-PAmCherry at different time points during RodZ depletion. Dots represent biological replicates.
Figure 5—figure supplement 3
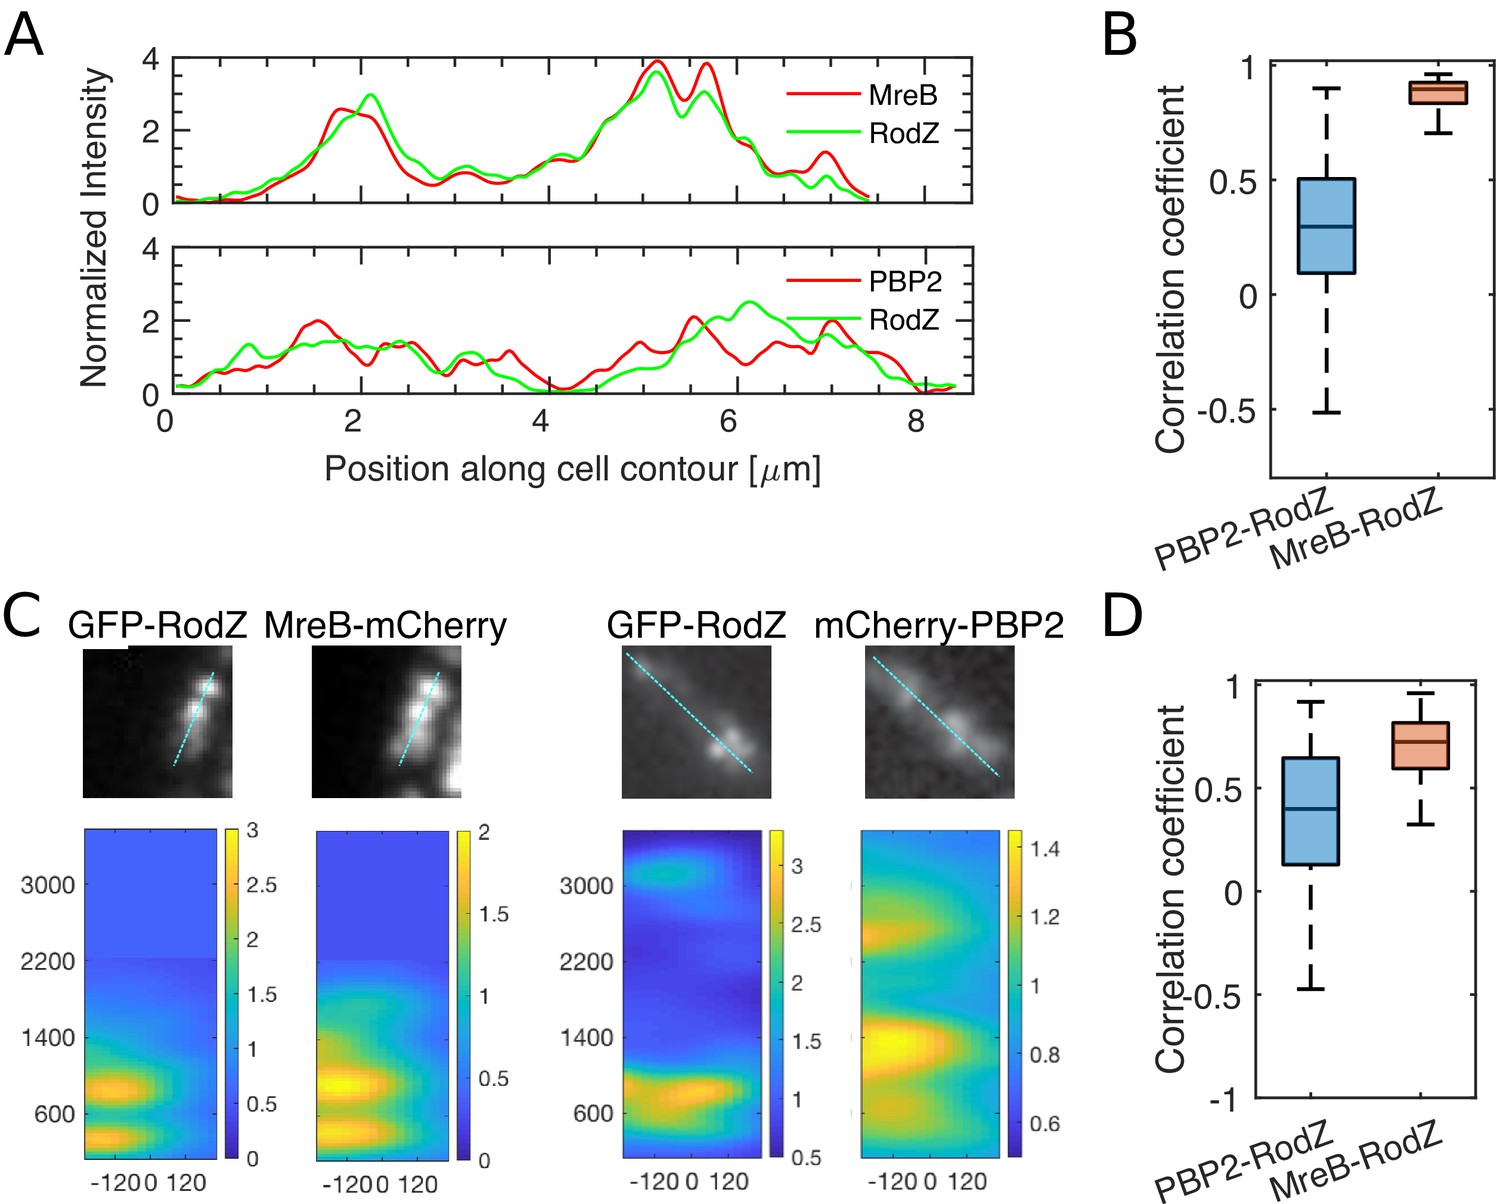
RodZ and PBP2 do not colocalize, while RodZ and MreB do.
(A) Sample profiles along the cell centerline of different cells carrying MreB-mCherry and GFP-RodZ fusions (ΔrodZ mreB <> mreB mCherry (Plac::gfp-rodZ)) (top) or mCherry-PBP2 and GFP-RodZ fusions (ΔrodZ mrdA <> mCherry mrdA (Plac::gfp-rodZ)) (bottom) acquired by epi-fluorescence microscopy. Intensities are normalized by the median value and then smoothened with a Gauss filter with standard deviation of 33 nm (0.5 pixel). (B) Boxplots of Pearson correlation coefficients between PBP2- and RodZ signals (left) and between MreB-and RodZ signals (right) acquired by epi-fluorescence microscopy. (C) Sample snapshots and corresponding intensity maps of cells carrying mCherry-PBP2 and GFP-RodZ fusions (ΔrodZ mrdA <> mCherry mrdA (Plac::gfp-rodZ)) (left) or MreB-mCherry and GFP-RodZ fusions (ΔrodZ mreB <> mreB mCherry (Plac::gfp-rodZ)) (right) acquired by TIRF microscopy. Intensities are normalized by the median value. x-axis show position along the short axis of the cell where zero corresponds to the centerline (mid-cell). y-axis is then the position along the cell’s long axis. Distances are given in nm. Scale bar shows 1 um. Intensity maps are stretched in x-direction for better visibility. (D) Boxplots of Pearson correlation coefficients between PBP2- and RodZ signals (left) and between MreB-and RodZ signals (right) acquired by TIRF microscopy.
Figure 6 with 2 supplements
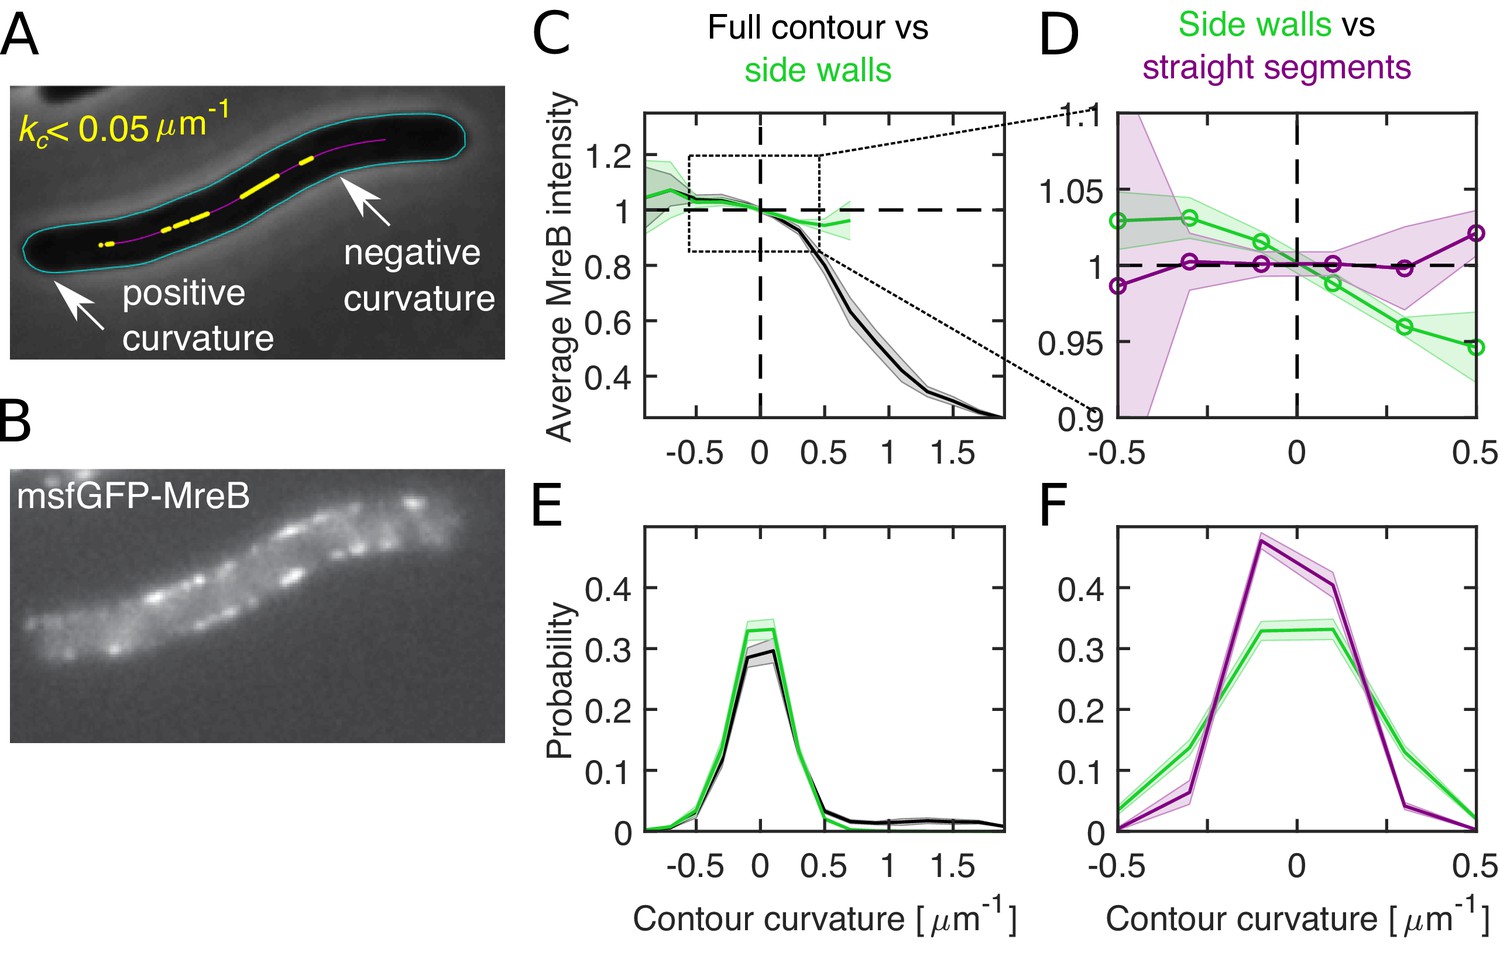
Differential MreB-curvature correlations in filamentous cells are due to cell poles and cell bending.
(A–B) Phase-contrast image (A) and fluorescence intensity (B) of a representative filamentous E. coli expressing MreB-msfGFP and SulA (NO53/pDB192). Contours (cyan) are obtained by computational cell segmentation. Positive contour curvature is found at cell poles, bulges, and outer parts of spontaneously bent regions, while negative curvature is found at indentations and inner parts of bent regions. Straight cell segments (yellow) are defined as regions where the curvature of the spatially averaged centerline (magenta) is smaller than 0.05 μm−1. (C–D) Normalized average MreB intensity as a function of local contour curvature. Comparison between correlations obtained from full contours (black) and side walls (green) (C) and from side walls (green) and straight cell segments (magenta) (D). (E–F) Distributions of contour-curvature values corresponding to correlation plots in (C–D). Shaded region: Standard deviation between three biological replicates.
-
Figure 6—source data 1
Table containing all data presented in Figure 6 and Figure 6—figure supplements 1–2.
The file Dataset-Fig6.xlsx contains: Figure 6C-D For filamentous NO53 cells, numerical values of correlations between contour curvature and normalized MreB-msfGFP intensities for the full contour, side walls or flat regions with number of cells considered. Figure 6E-F For filamentous NO53 cells, numerical values of the distribution of contour curvatures for the full contour, side walls or flat regions with number of cells considered. Figure 6—figure supplement 1 For NO53 cells, numerical values of the (i) correlations between contour curvature and normalized MreB-msfGFP intensities, and (ii) distribution of contour curvatures for the full contour and side walls. Figure 6—figure supplement 2 For filamentous NO53 cells, numerical values of (i) correlations between curvature and normalized MreB-msfGFP intensities, and (ii) curvature distributions after applying curvature or intensity correction methods.
- https://cdn.elifesciences.org/articles/50629/elife-50629-fig6-data1-v2.xlsx
Figure 6—figure supplement 1
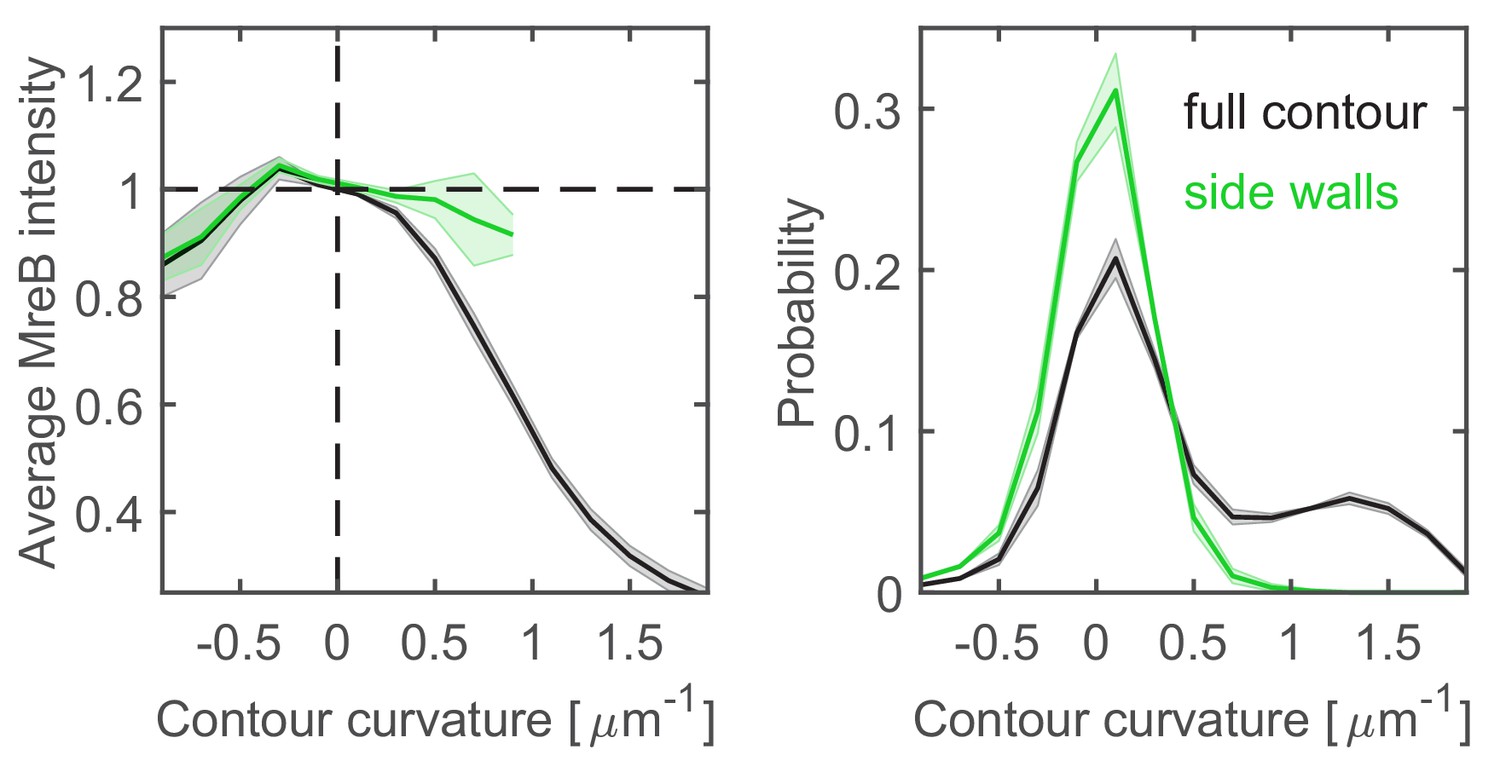
Correlations between MreB and contour curvature in WT cells.
Left. Normalized average MreB intensity as a function of local contour curvature in strain NO53 (mreB <> mreB msfGFP). Comparison between correlations obtained from full contours (black) and side walls (green). Right. Distributions of contour-curvature values corresponding to correlation plots on the left. Shaded areas show standard deviation between three biological replicates.
Figure 6—figure supplement 2
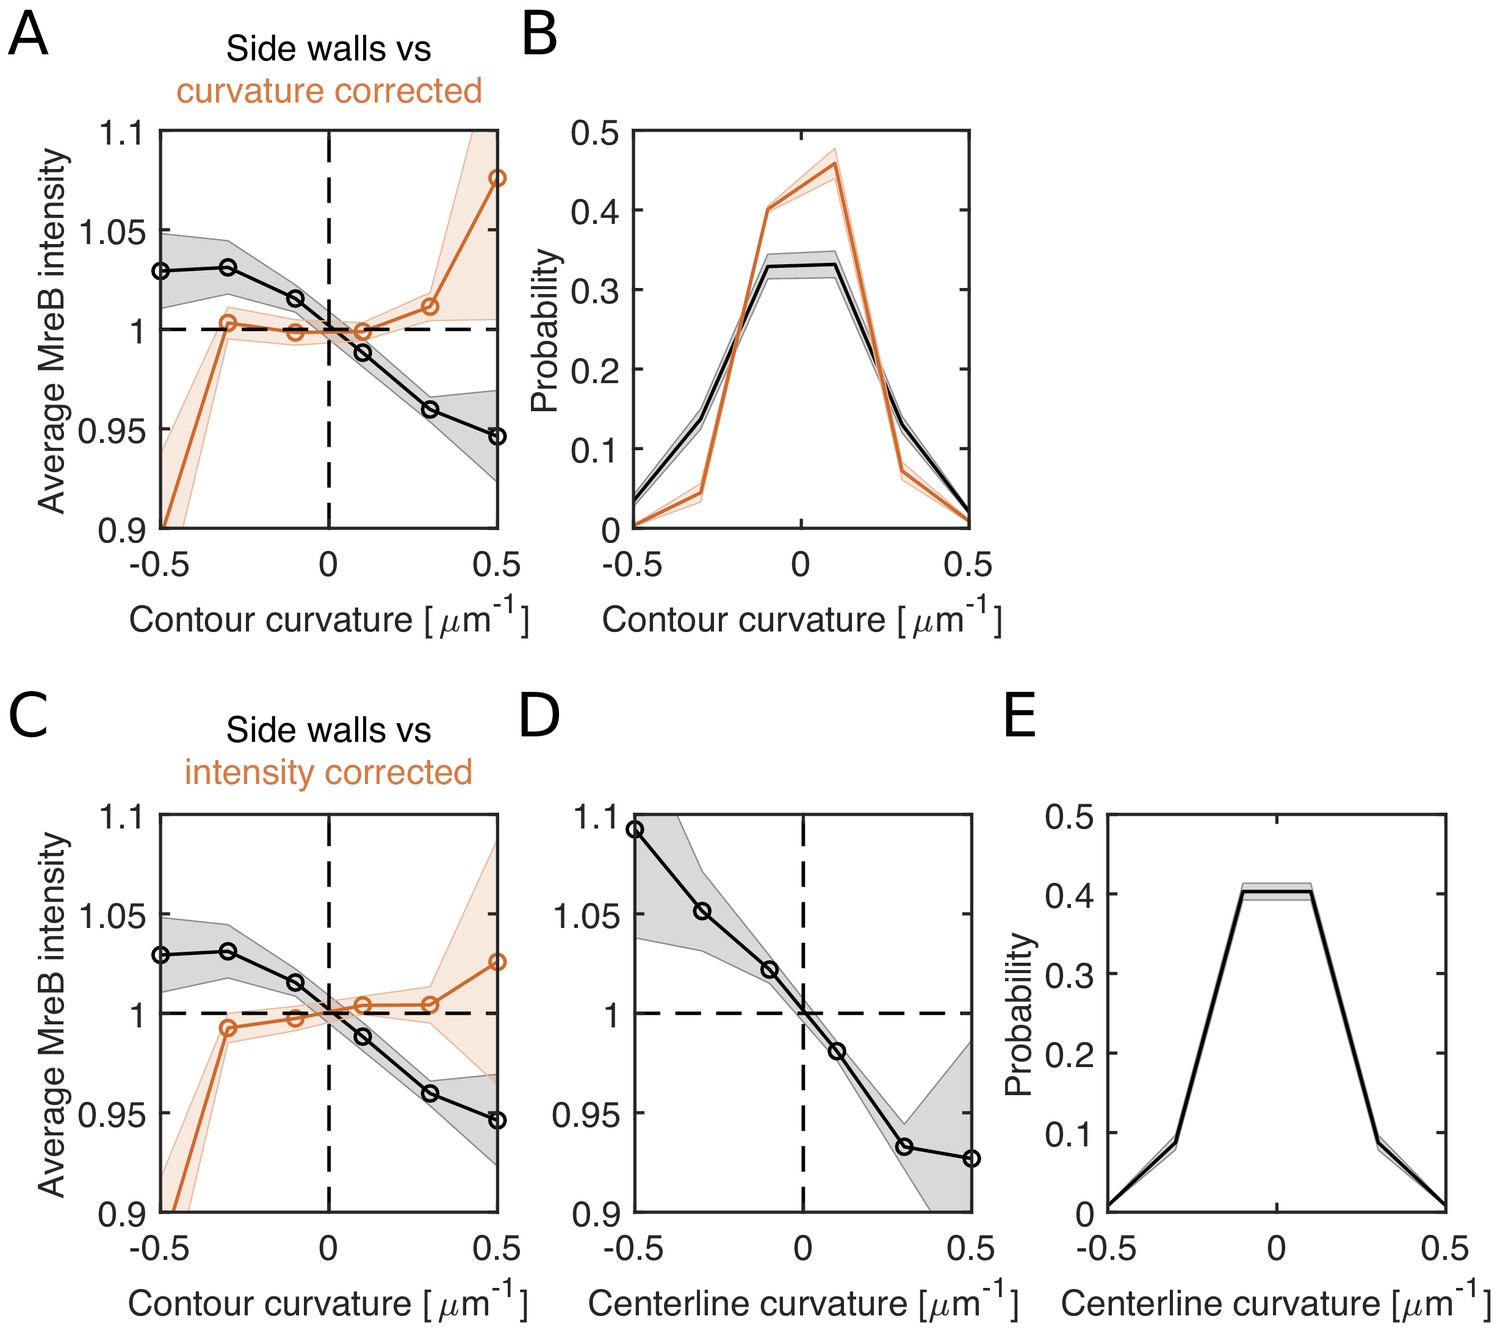
Loss of correlations between MreB and contour curvature after renormalizing either curvature or intensity for cell bending in filamentous cells.
(A–B) Curvature correction. (A) Average MreB intensity as a function of contour curvature (black) and bending-corrected contour curvature (orange) in NO53/pDB192 (Plac::sulA). (B) Distributions of contour curvature (black) and corrected contour curvature (orange). Curvature correction leads to a narrower distribution while ~ 80% of local curvature values keep their original sign of curvature. (C–E) Intensity correction. (C) Average MreB intensity as a function of bending-corrected MreB-intensity (orange). Intensity is corrected for observed correlations between MreB intensity and centerline curvature in (D) (Materials and methods). (D) Average MreB intensity as a function of smoothened centerline curvature (using a Gauss filter of σ = 80 nm). (E) Centerline-curvature distribution. Shaded areas show standard deviation between three biological replicates.
Figure 7
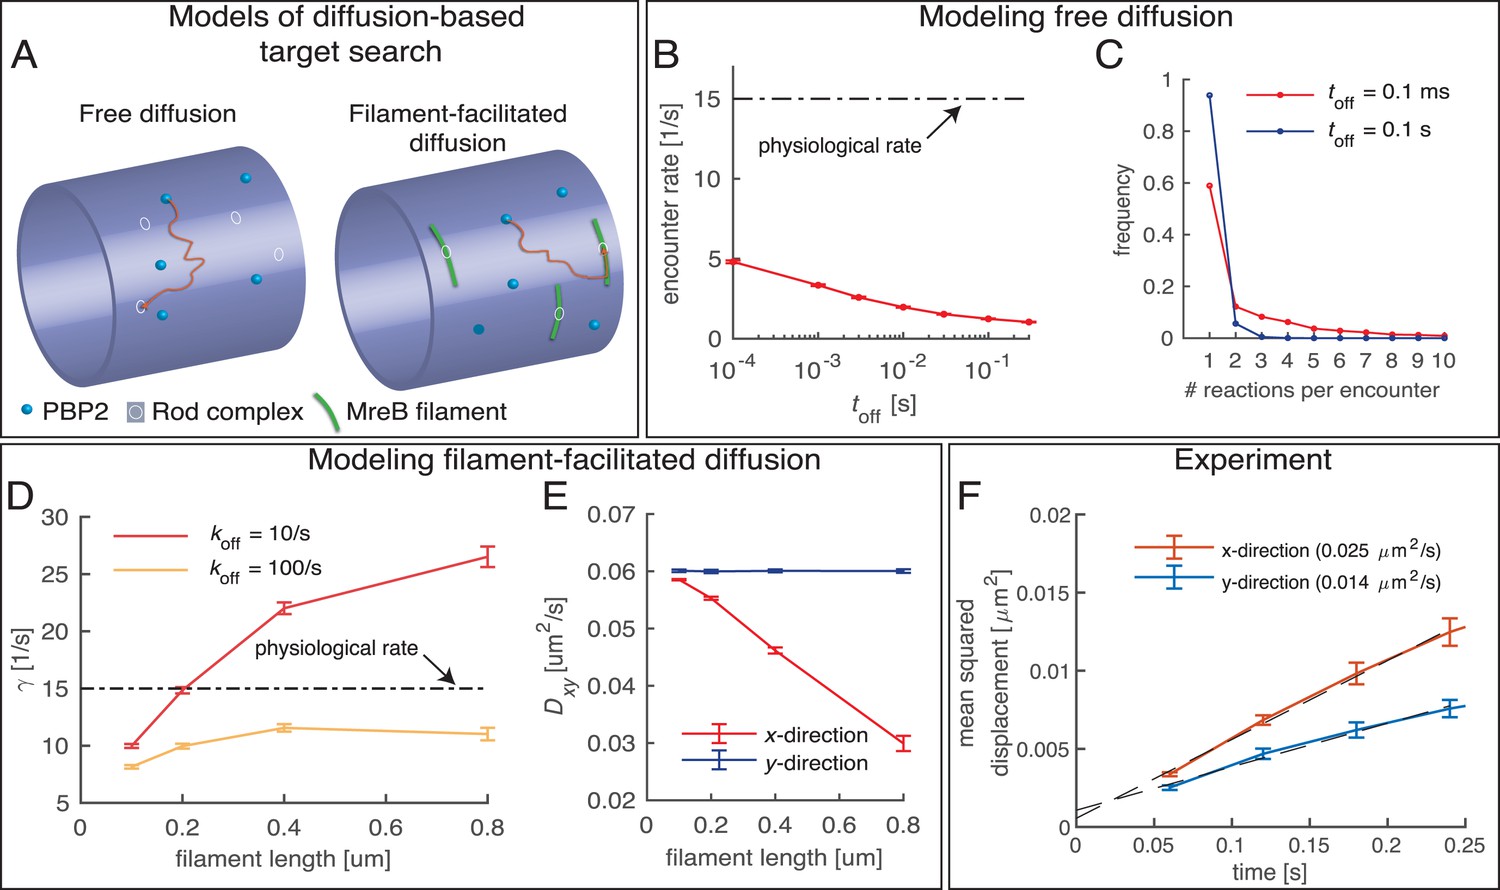
Testing a possible role of diffusive PBP2 for cross-linking.
(A) Cartoon of PBP2 finding the target site of a 'rod complex' through free diffusion (left) or filament-facilitated diffusion (right). (B) The average encounter rate between any of 100 freely diffusing PBP2 molecules and a given rod-complex site as a function of the unknown latency time toff (the duration for which a single PBP2 enzyme is inactive after a cross-linking reaction) (red) in comparison to the physiological cross-linking rate (dashed-dotted line) (C) Distribution of the number of successive cross-linking reactions conducted by the same PBP2 molecule at the same rod-complex site for two different latency times. (D–E) Facilitated diffusion along circumferentially oriented filaments centered at every rod-complex site increases the encounter rate (D) and renders diffusion asymmetric (E). (F) Diffusion of PAmCherry-PBP2 along the long axis of the cell (x-direction) is faster than around the circumference (y-direction), suggesting that PBP2 does not undergo facilitated diffusion along circumferentially oriented filaments. Reduced diffusion around the circumference is possibly caused by out-of-plane motion.
Author response image 1
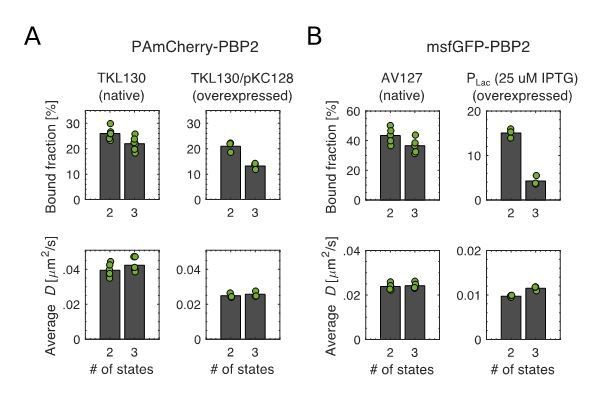
Bound fractions and average diffusion constants of the diffusive fraction(s).
(A) Left: TKL130 (near-native levels). Right: TKL130/pKC128 (overexpression). (B) Left: AV127 (mrdA::sfgfp-mrdA). Right: inducible msfGFP-PBP2 (mrdA::aph (Plac::msfgfp-mrdA)).
Author response image 2

Cell length, cell width, bound fractions and average diffusion constants as a function of time during RodZ repression in cells carrying inducible dCas9 targeting native rodZ.
Author response image 3
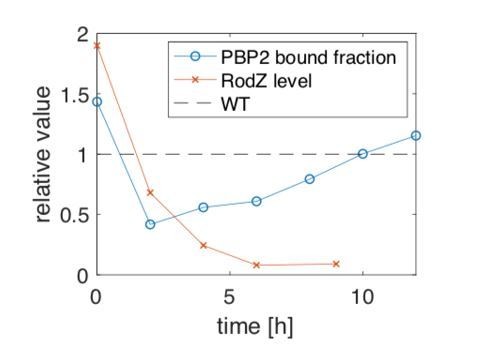
Relative changes of PBP2 bound fraction and RodZ level w.r.t.
WT during RodZ depletion. RodZ levels at 2h and 4h time points are inferred from a simple depletion formula while levels at 0h, 6h, and 9h are from mass spectrometry.
Tables
Key resources table
| Reagent type (species) or resource | Designation | Source or reference | Identifiers | Additional information |
|---|---|---|---|---|
| Strain, strain background (E. coli) | TKL130 | (Lee et al., 2014) | MG1655 mrdA::PAmCherry-mrdA | |
| Strain, strain background (E. coli) | EW07 | This work | TKL130 ΔmreCD, pFB121 | Materials and methods, Strain construction |
| Strain, strain background (E. coli) | EW49 | This work | TKL130 ΔrodZ, pFB290 | Materials and methods, Strain construction |
| Strain, strain background (E. coli) | AV48 | This work | 186attB::Ptet-dcas9, mrdA::rPAmCherry-mrdA | Materials and methods, Strain construction |
| Strain, strain background (E. coli) | NO53 | (Ouzounov et al., 2016) | MG1655 mreB-msfGFPsw | |
| Strain, strain background (E. coli) | TU230(attLHC943) | (Rohs et al., 2018) | MG1655 mrdA::aph (Plac::msfgfp-mrdA) | |
| Strain, strain background (E. coli) | TU230(attLPR122) | (Rohs et al., 2018) | MG1655 mrdA::aph (Plac::msfgfp-pbpA(L61R)) | |
| Strain, strain background (E. coli) | S352 | This work | MG1655 ΔponA::aph | Materials and methods, Strain construction |
| Strain, strain background (E. coli) | FB83 | (Bendezú and de Boer, 2008) | MG1655, lacIZYA::frt, mreB-mCherrySW yhdE::frt | |
| Strain, strain background (E. coli) | AV07 | (Vigouroux et al., 2018) | MG1655 mrdA::mcherry-mrdA | |
| Strain, strain background (E. coli) | AV127 | This work | 186::dCas9, mrdA::sfgfp-mrdA | Materials and methods, Strain construction |
| Strain, strain background (E. coli) | FB60 (iFB273) | (Bendezú and de Boer, 2008) | MG1655 lacIZYA::frt, rodZ::aph, Plac::gfp-rodZ | |
| Strain, strain background (E. coli) | S504 | This work | FB83, rodZ::aph, Plac::gfp-rodZ | Materials and methods, Strain construction |
| Strain, strain background (E. coli) | S505 | This work | AV07, rodZ::aph, Plac::gfp-rodZ | Materials and methods, Strain construction |
| Chemical compound, drug | Mecillinam | Sigma-Aldrich, #33447 | ||
| Chemical compound, drug | A22 | Cayman Chemical #15870 | ||
| Software, algorithm | Trackmate | (Tinevez et al., 2017) | ||
| Software, algorithm | Morphometrics | (Ursell et al., 2017) | ||
| Software, algorithm | Spot-On | (Hansen et al., 2018) |
Additional files
-
Source code 1
Custom written MATLAB code used for image analysis.
- https://cdn.elifesciences.org/articles/50629/elife-50629-code1-v2.zip
-
Source data 1
Source data, specifically raw tracks, are provided (one file with x-, y- coordinates and track identifier per replicate).
- https://cdn.elifesciences.org/articles/50629/elife-50629-data1-v2.zip
-
Supplementary file 1
PBP2 levels and dynamics.
(a) Unperturbed conditions. Measurement results at different levels of PAmCherry-PBP2 and msfGFP-PBP2 as well as msfGFP-PBP2(L61R). Protein levels are measured based on fluorescence, mass spectrometry (DIA and PRM), and Western Blots. (b) PBP2 dynamics under different perturbations corresponding to Figures 3 and 5.
- https://cdn.elifesciences.org/articles/50629/elife-50629-supp1-v2.xlsx
-
Supplementary file 2
Comparison of 2- and 3-state diffusion models.
(a, b) Measurements of PAmCherry-PBP2 in TKL130 and TKL130/pKC128, constraining D0 = 0 (a) or leaving D0 free (b). (c) All measurements carried out with the msfGFP-PBP2 or msfGFP-PBP2(L61R) fusions.
- https://cdn.elifesciences.org/articles/50629/elife-50629-supp2-v2.xlsx
-
Supplementary file 3
Strains (a), plasmids (b), and primers (c) used in this study.
- https://cdn.elifesciences.org/articles/50629/elife-50629-supp3-v2.xlsx
-
Transparent reporting form
- https://cdn.elifesciences.org/articles/50629/elife-50629-transrepform-v2.docx
Download links
A two-part list of links to download the article, or parts of the article, in various formats.
Downloads (link to download the article as PDF)
Open citations (links to open the citations from this article in various online reference manager services)
Cite this article (links to download the citations from this article in formats compatible with various reference manager tools)
The transpeptidase PBP2 governs initial localization and activity of the major cell-wall synthesis machinery in E. coli
eLife 9:e50629.
https://doi.org/10.7554/eLife.50629


