The tumor suppressor PTPRK promotes ZNRF3 internalization and is required for Wnt inhibition in the Spemann organizer
- DKFZ-ZMBH Alliance, Deutsches Krebsforschungszentrum (DKFZ), Germany
- Institute of Molecular Biology (IMB), Germany
Figures
Figure 1 with 1 supplement

PTPRK inhibits Wnt/β-catenin signaling at the receptor level.
(A) Topflash reporter assay in H1703 cells upon siCo, siPTPRK pool, or single siPTPRKs (siPTPRK #2, #5) transfection, with or without overnight Wnt3a treatment. Further experiments were done with siPTPRK #2. (B) qRT-PCR analysis of AXIN2 in H1703 cells treated with Wnt3a overnight upon siCo, siPTPRK transfection. (C) Western blot analysis of cytosolic β-catenin in H1703 cells upon siCo or siPTPRK transfection. Cells were treated with Wnt3a for 2 h before harvest and permeabilized with 0.05% Saponin. Ratio, relative levels of β-catenin normalized to ERK1/2. (D) Immunofluorescence microscopy showing nuclear and cytosolic β-catenin in H1703 cells. Cells were transfected with the indicated siRNAs and treated with Wnt3a for 2 h. siβ-catenin and siZNRF3/siRNF43 were used as negative and positive control, respectively. (E) Topflash reporter assay in H1703 cells upon PTPRK or β-catenin knockdown. Topflash activity was stimulated by overnight treatment of Wnt3a, or transfection of Wnt1/Fzd8/LRP6, Dvl1, or hβ-catenin S37A. Data in all graphs are displayed as means ± SD, and show one representative of multiple independent experiments with three biological replicates. RLU, relative light units. *p<0.05 **p<0.01, ***p<0.001.
Figure 1—figure supplement 1

Knockdown effects of siPTPRKs.
(A) qRT-PCR analysis showing the knockdown efficiencies of siRNAs targeting PTPRK in H1703 cells (related to Figure 1A). (B) qRT-PCR analysis of PTPRK in H1703 cells upon siCo or siPTPRK transfection (related to Figure 1B). (C) Subcellular fractionation of H1703 cells upon siCo or siPTPRK transfection. Cells were treated with Wnt3a for 24 hr before harvest and fractionated into cytosol and membrane as indicated. Tubulin and Transferrin receptor (TfR) serve as the markers for cytosolic and membrane fractions, respectively. (D) Topflash reporter assay in H1703 cells transfected with V5-PTPRK or V5-PTPRK-DA. Cells were treated with control or Wnt3a for 24 hr before harvest and measured for Topflash activity (Mean ± SD). (E) Topflash reporter assay in HEK293T cells upon siRNA treatment. Cells were treated with control or dilutions of Wnt3a for 24 hr before harvest and measured for Topflash activity. (Mean ± SD, n = 3; n.s., not significant, student t-test). (F) qRT-PCR analysis of AXIN2 in H1703 cells treated with Wnt3a overnight upon indicated siRNA transfection.
Figure 2 with 1 supplement
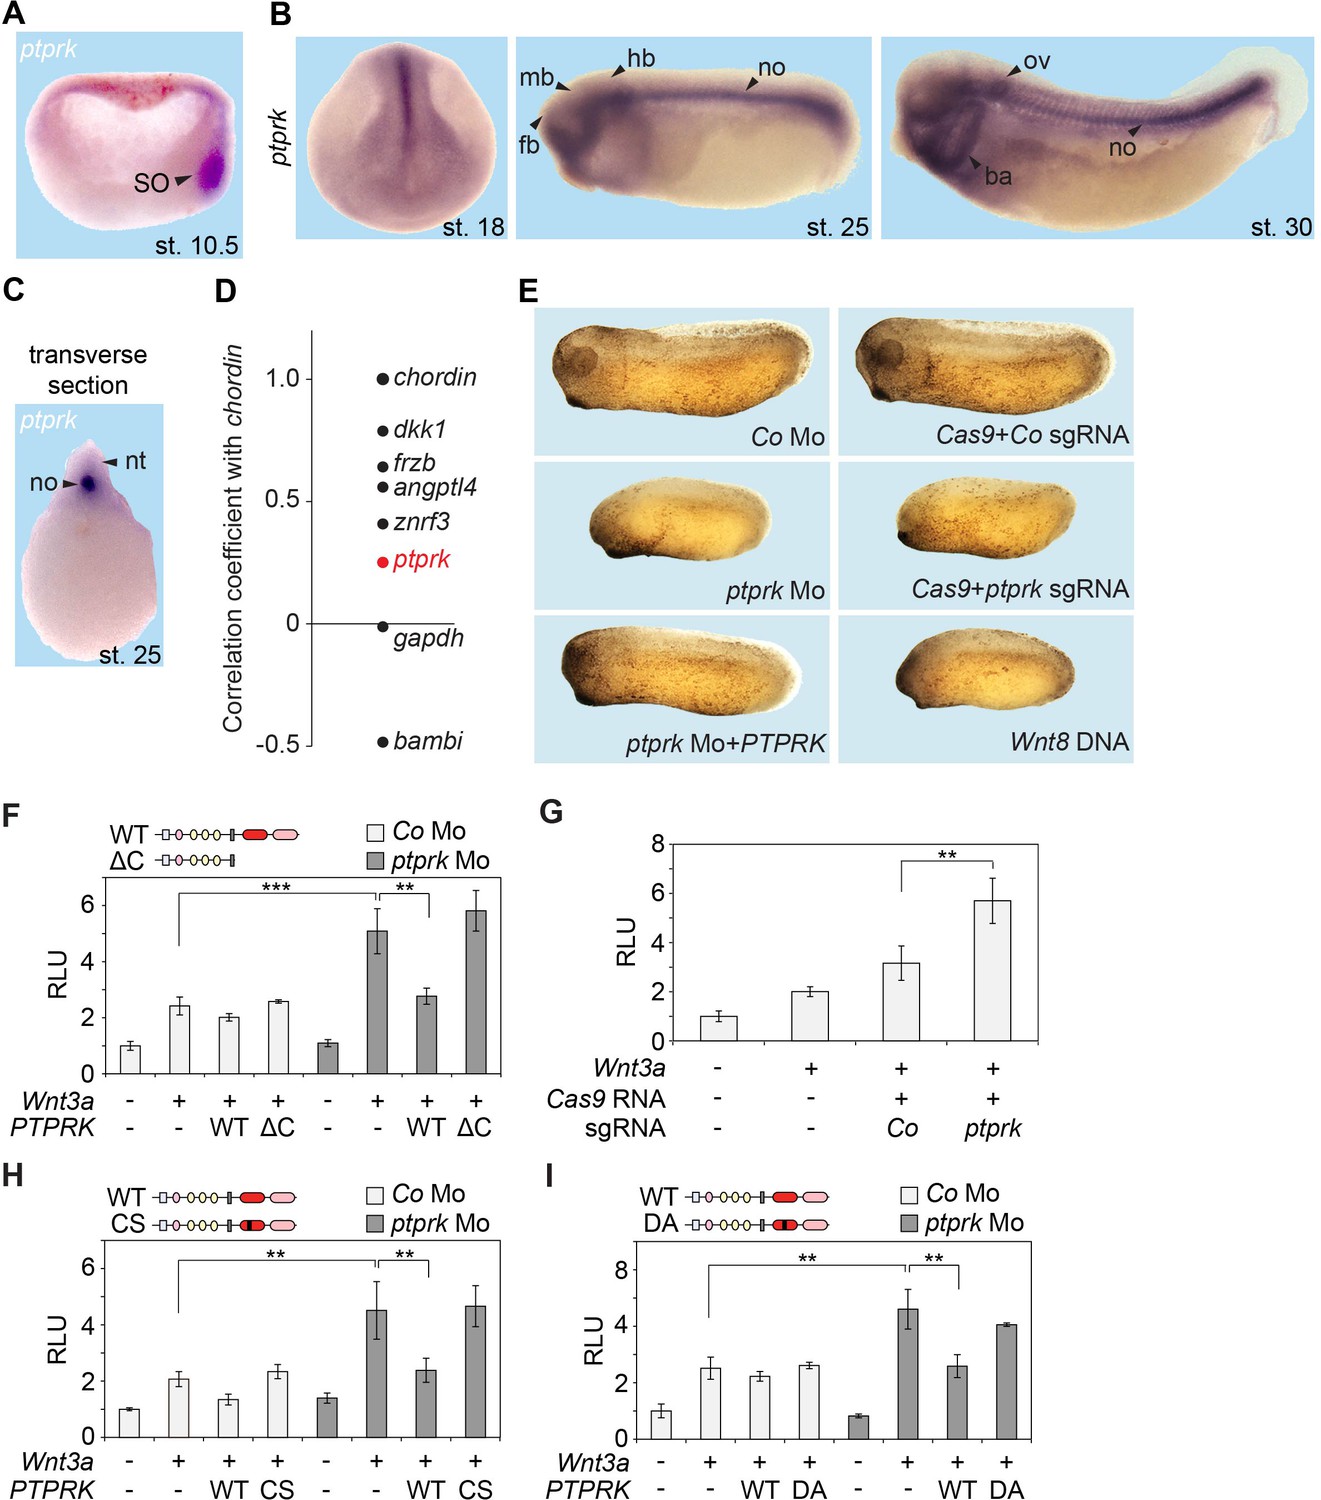
Ptprk inhibits Wnt signaling in the Xenopus Spemann organizer.
(A–C) In situ hybridization of ptprk in Xenopus tropicalis at (A) gastrula (hemisected, dorsal to the right), (B) neurula, tailbud, and tadpole stages, and in (C) transverse dissected tailbud embryo. ba, branchial arches; fb, forebrain; hb, hindbrain; mb, midbrain; no, notochord; nt, neural tube; ov, otic vesicle; SO, Spemann organizer. (D) Data mining using data from Ding et al. (2017), showing gene expression correlation with a dorsal/organizer marker chordin. Xenopus dkk1, frzb, and angptl4 are known organizer-expressed genes, gapdh is shown as housekeeping gene, and bambi is a ventrally expressed gene. (E) Representative phenotypes of tailbud stage Xenopus tropicalis embryos injected animally at 2- to 8 cell stage and as indicated. For quantification, see Figure 2—figure supplement 1D–E. (F–I) Topflash reporter assays performed with neurulae (stage 18). Embryos were injected animally at 2- to 8 cell stage (F, H–I) or one cell stage (G) with reporter plasmids and the indicated mRNAs and Mos. Domain structures of WT PTPRK and mutants are shown on top. Normalized Topflash activity of Co-injected embryos only with reporter plasmids was set to 1. Data in all graphs are displayed as means ± SD, and show one representative of multiple independent experiments with three biological replicates. RLU, relative light units. **p<0.01, ***p<0.001.
Figure 2—figure supplement 1
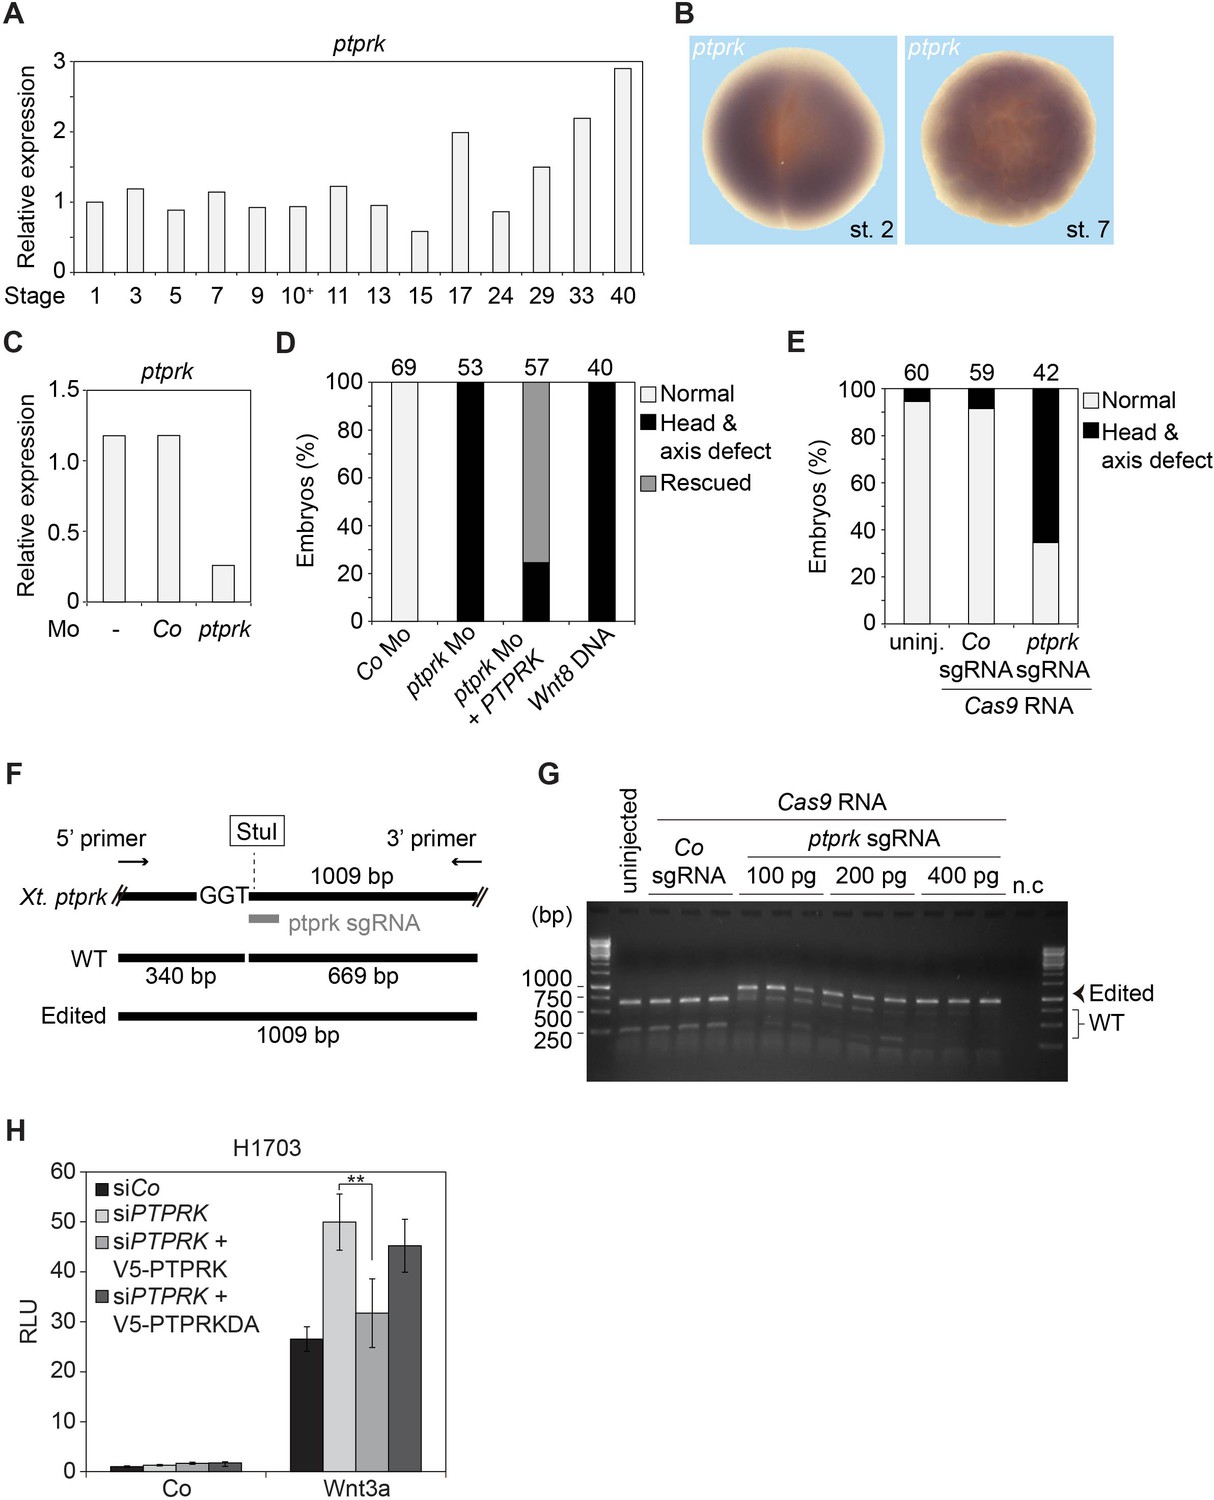
Spatiotemporal expression and knockdown of ptprk in Xenopus embryos.
(A) qRT-PCR analysis displaying the relative expression levels of ptprk in Xenopus tropicalis embryos at indicated stages. Expression of ptprk was normalized to odc, and the level of ptprk at stage one was set to 1. Data show one representative result from three independent experiments. (B) Spatial expression patterns of ptprk in Xenopus embryos at 2 cell stage (animal view) and stage 7 (animal view). (C) Knockdown efficiency of ptprk Mo. qRT-PCR analysis was performed with uninjected tailbud stage Xenopus embryos, and embryos injected with Co or ptprk Mo. (D–E) Quantification of phenotypes shown in Figure 2E. The number of embryos is indicated on the top. (F) Scheme of validation of CRISPR/Cas9-mediated genome modification by restriction enzyme digestion. Xenopus ptprk sgRNA targeted sequence contains a StuI site. A pair of primers was designed to amplify a DNA fragment of 1009 bp. After StuI digestion, wild-type (WT) but not edited DNA, yields DNA fragments of 340 bp and 669 bp. (G) Agarose electrophoresis of StuI digested PCR products described in (F). n.c, negative control, PCR product of DNA from an uninjected tailbud embryo without DNA polymerase in PCR reaction. (H) Topflash reporter assay in H1703 cells transfected with indicated siRNA and siRNA resistant V5-PTPRK or V5-PTPRK-DA. Cells were treated with control or Wnt3a for 24 hr before measurement. (Mean ± SD, n = 3; **p<0.01, student t-test).
Figure 3 with 1 supplement
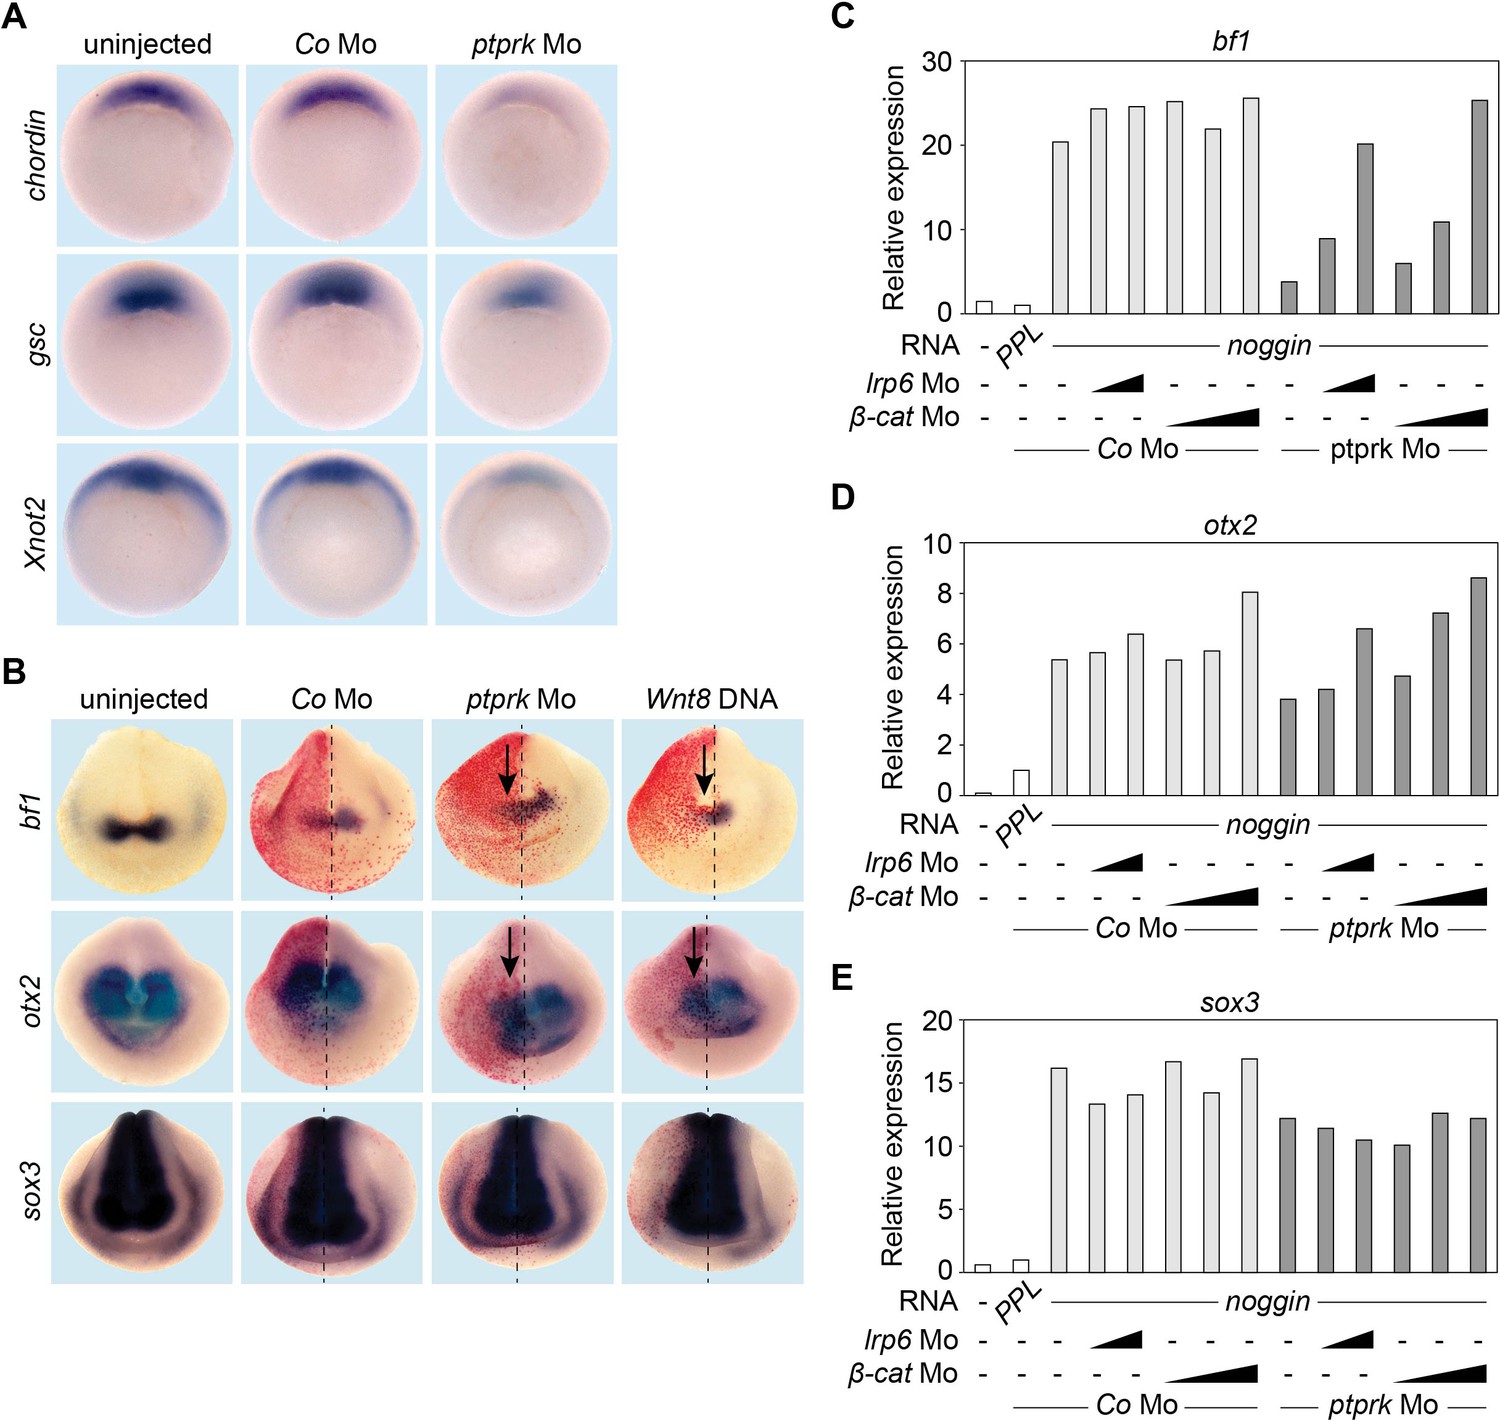
Ptprk regulates Spemann organizer function by inhibiting Wnt signaling.
(A) Whole mount in situ hybridization of chordin, gsc, and Xnot2 in gastrula embryos (stage 10.5). Embryos were injected at 2- to 8 cell stage animally with Co or ptprk Mo. For quantification, see Figure 3—figure supplement 1A–C. (B) Whole mount in situ hybridization of forebrain marker bf1 and otx2, and pan-neural marker sox3 in neurula embryos (stage 18). Embryos were injected at 4- to 8 cell stage unilaterally in animal blastomeres as indicated (β-galactosidase lineage tracer in red; arrows mark injected side). For quantification, see Figure 3—figure supplement 1D–F. (C–E) qRT-PCR analysis showing the expression of (C) bf1, (D) otx2 and (E) sox3 in Xenopus tropicalis animal cap explants. Embryos were injected animally at 2- to 8 cell stage as indicated. Xenopus noggin mRNA was injected to induce to neural fate in animal cap explants. Animal caps were excised at stage 9 and harvested at stage 18. The expression of each gene was normalized to odc. PPL and Co Mo injected embryos were set to 1. Data show one representative experiment of at least three independent experiments with similar results.
Figure 3—figure supplement 1
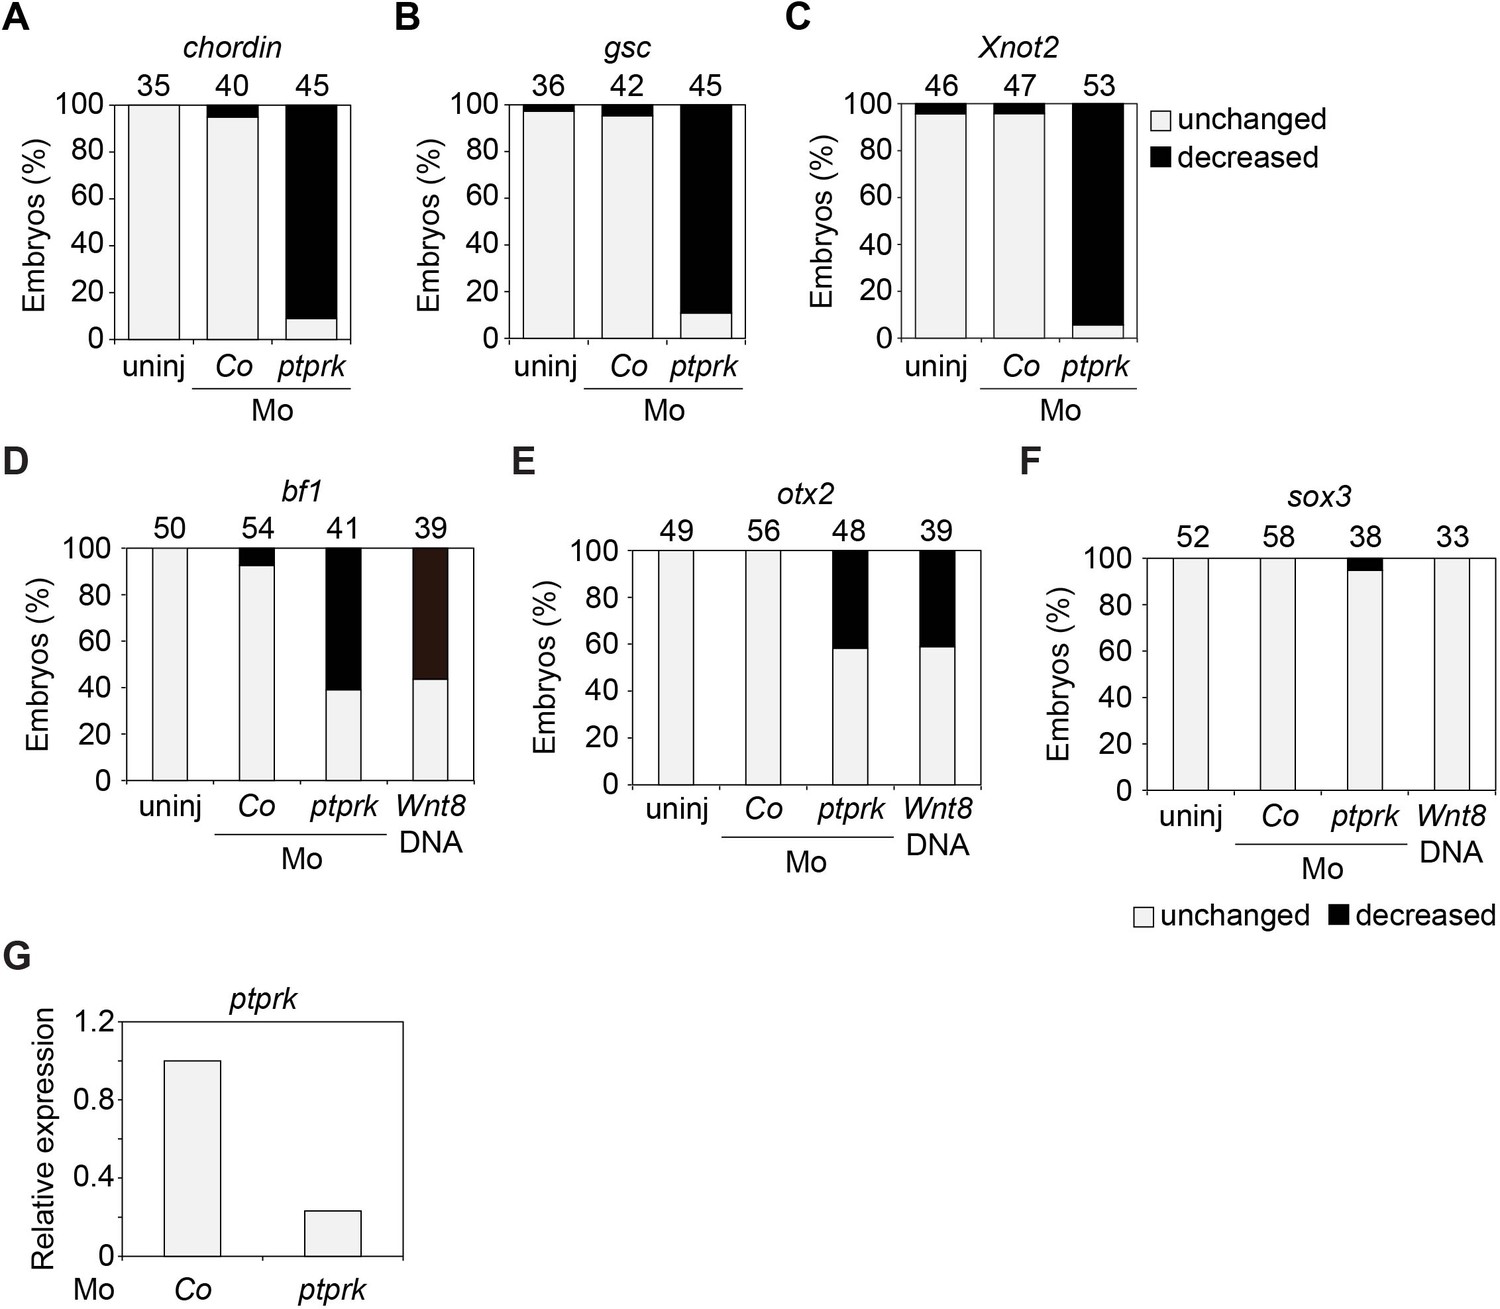
Ptprk regulates Spemann organizer function.
(A–F) Quantification of the expression of the indicated genes by whole mount in situ hybridization in Figure 3A–B. Top, number of embryos. (G) qRT-PCR analysis showing the knockdown efficiency of ptprk Mo in animal cap experiments in Figure 3C–E. Xenopus ptprk expression was normalized to odc. Expression in PPL and Co Mo injected embryos was set to 1. Data show one representative experiment of three independent experiments.
Figure 4 with 1 supplement
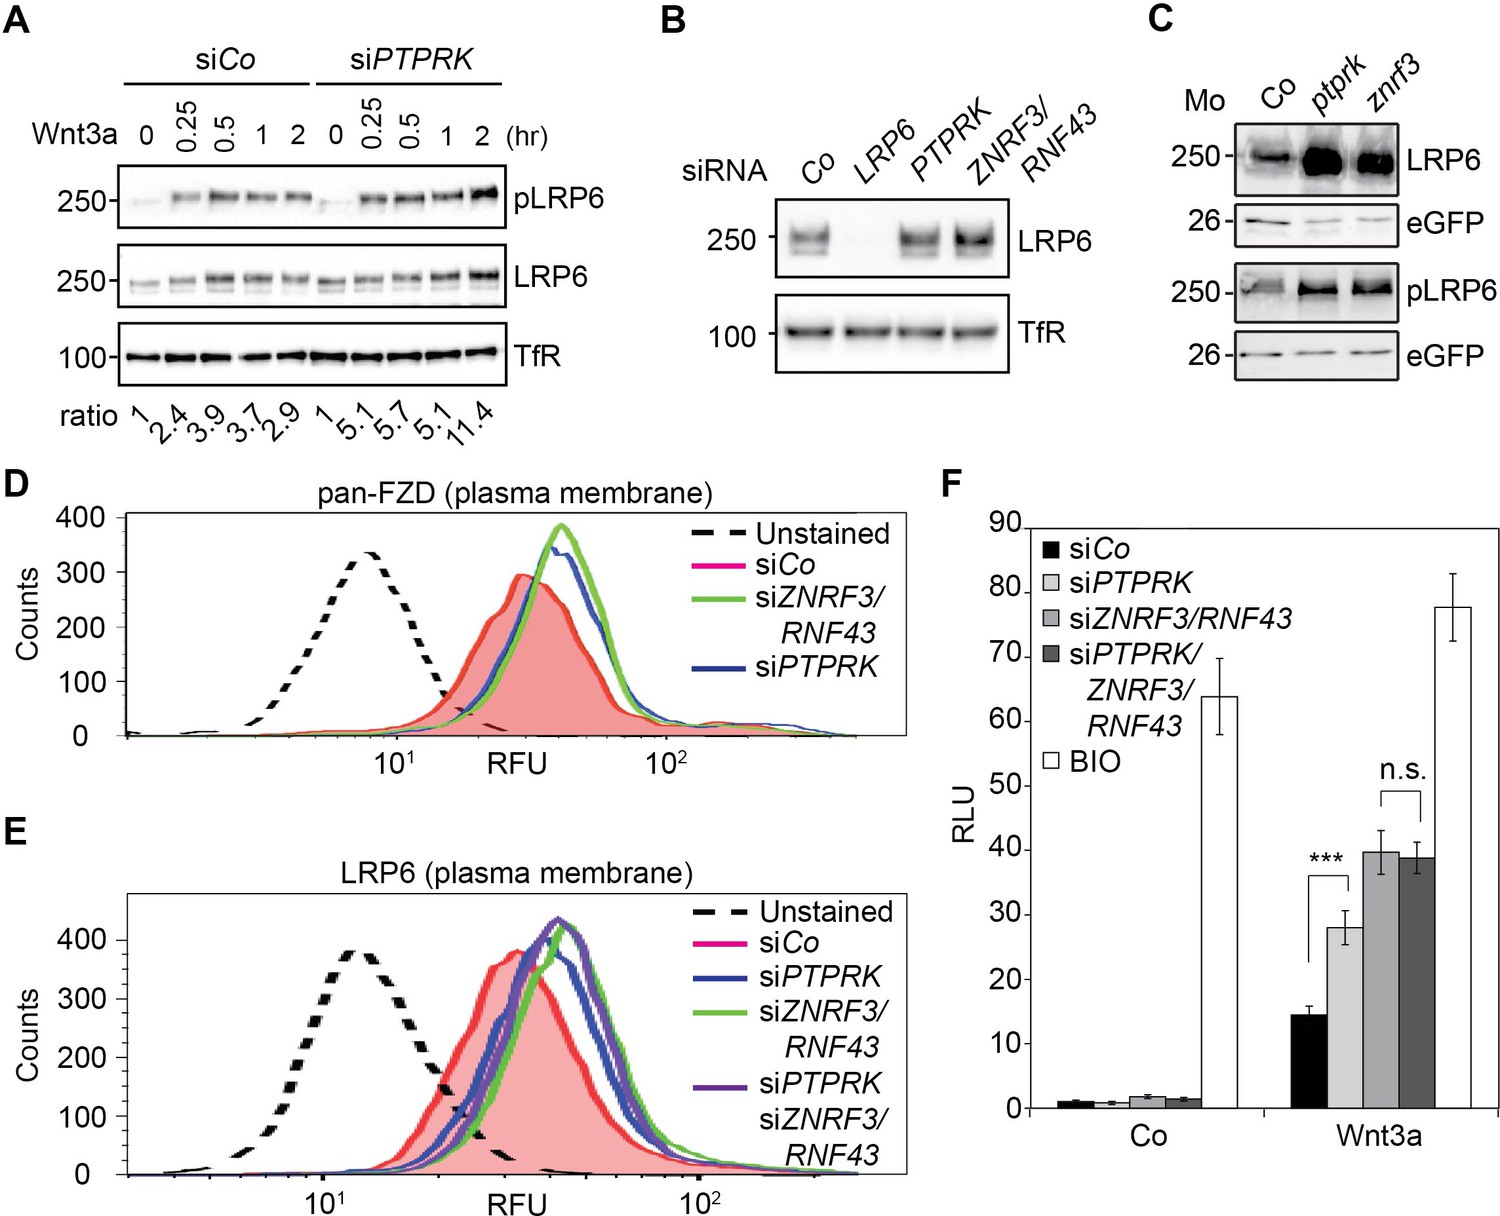
PTPRK reduces FZD and LRP6 surface levels via ZNRF3/RNF43.
(A) Western blots analysis of membrane fractions from H1703 cells upon siRNA transfection. Cells were treated with Wnt3a for the indicated time and were analyzed. Ratio, phospho-LRP6 (pLRP6) levels normalized to control (transferrin receptor, TfR). Representative results from three independent experiments with similar outcome are shown. (B) Western blots analysis of membrane fractions from H1703 cells upon siRNA transfection. Transferrin receptor (TfR) served as loading control. Representative results from three independent experiments with similar outcome are shown. (C) Western blot analysis of LRP6 and phospho-LRP6 (pLRP6) in neurula (stage 18) embryos injected with LRP6 RNA, eGFP RNA and indicated Mo. eGFP served as an injection control. Data show one representative result from three independent experiments. (D) Flow cytometric analysis of cell surface Frizzled receptors (pan-FZD antibody) in H1703 cells upon siRNA knockdown of PTPRK or ZNRF3/RNF43. Only live cells were counted and dead cells were gated out by propidium iodide (PI) staining. Dashed line, unstained H1703 cells. RFU, relative fluorescence units. (E) Flow cytometric analysis of cell surface LRP6 in H1703 cells upon siRNA depletion of PTPRK, ZNRF3/RNF43 or combination of both. Only live cells were counted and dead cells were gated out by propidium iodide (PI) staining. Dashed line, unstained H1703 cells. RFU, relative fluorescence units. (F) Topflash reporter assay in H1703 cells upon transfection of indicated siRNAs. Cells were treated with Wnt3a with or without 20 μM BIO for 24 hr before measurement. (Mean ± SD, n = 3; ***p<0.001, n.s., not significant, student t-test). RLU, relative light.
Figure 4—figure supplement 1

PTPRK regulates LRP6 protein but not mRNA levels.
(A) Quantification of relative LRP6 protein levels normalized to TfR in Figure 4B. (B) qRT-PCR analysis of LRP6 mRNA levels in H1703 cells transfected with indicated siRNAs. mRNA expression was normalized to GAPDH, and the level of LRP6 in siCo was set to 1. (C) Quantification of the protein levels of LRP6 (left) and phospho-LRP6 (pLRP6, right) shown in Figure 4C. Levels of LRP6 or phospho-LRP6 were normalized to eGFP and protein levels in Co Mo injected embryos were set to 1. (D) qRT-PCR analysis of ptprk and lrp6 mRNA levels in Co Mo or ptprk Mo injected neurula embryos (stage 18) in Figure 4C. The expression level in Co Mo injected embryos was set to 1. (E) qRT-PCR analysis showing the knockdown efficiencies of the indicated siRNAs in H1703 cells (related to Figure 4F). Statistics was performed with three independent experiments (Mean ± SD, *p<0.05, **p<0.01, ***p<0.001).
Figure 5 with 1 supplement
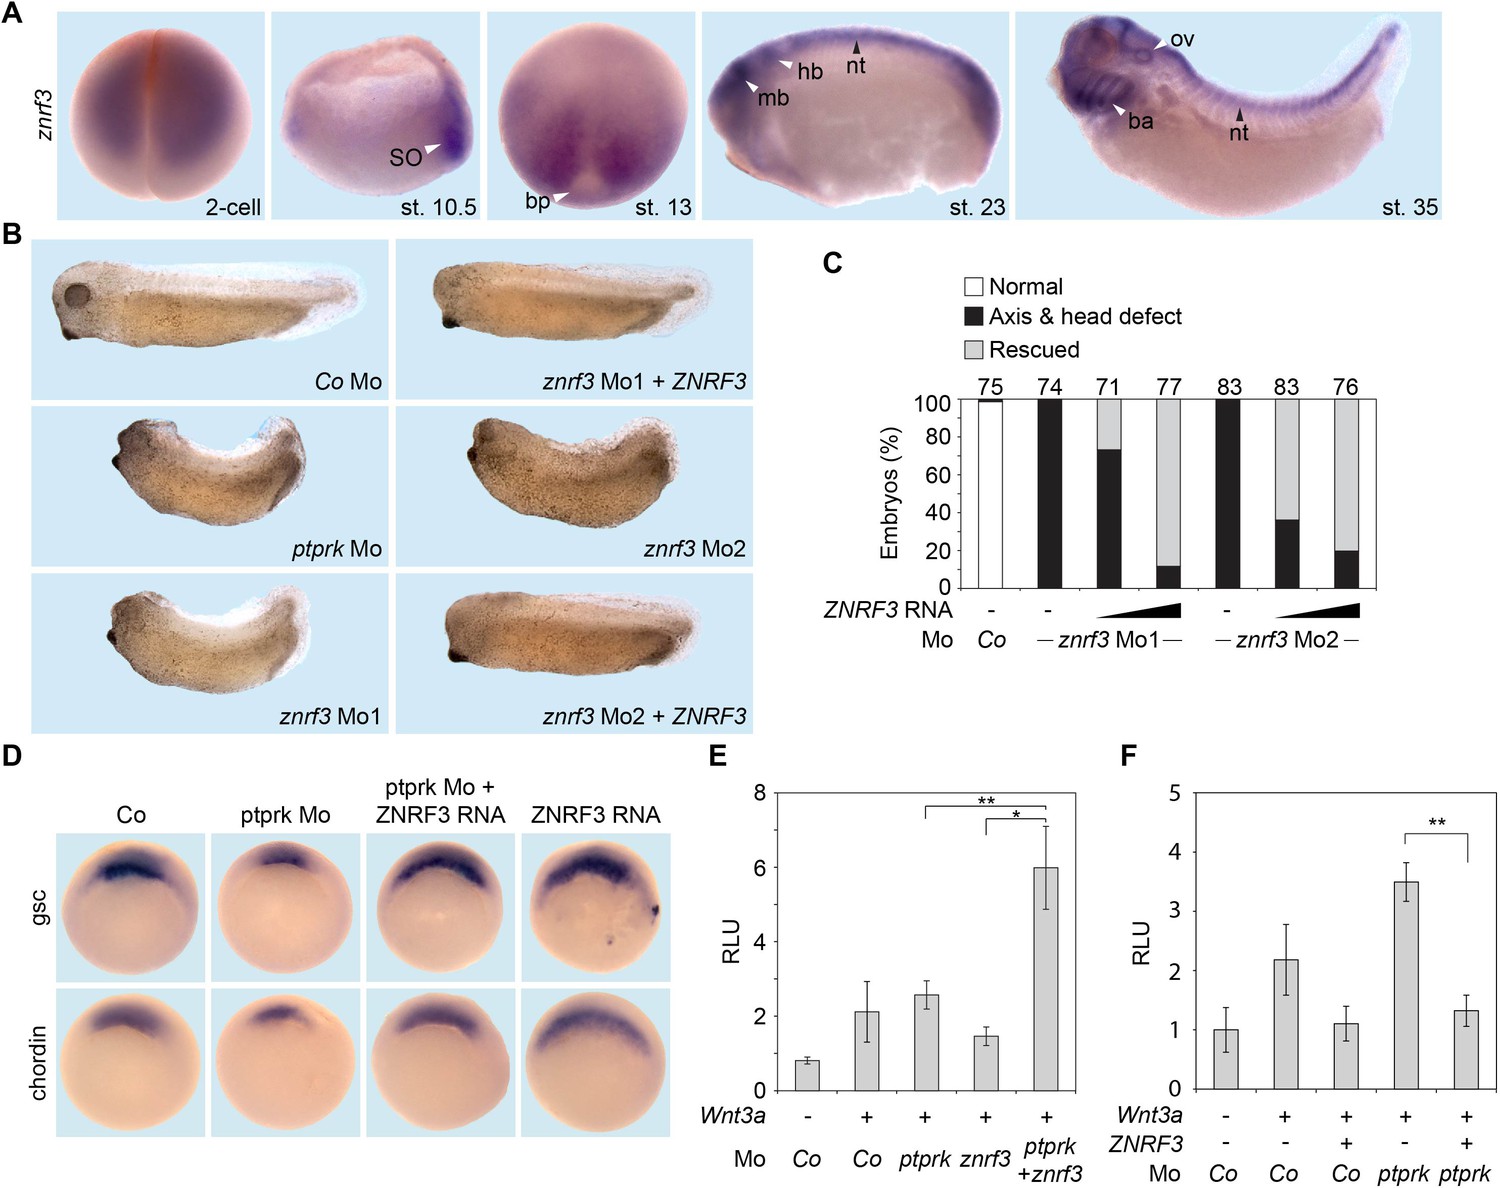
Znrf3 is coexpressed- and cooperates with ptprk in early Xenopus embryos.
(A) Spatial expression of znrf3 in Xenopus tropicalis embryos at blastula (animal view), gastrula (hemisected dorsal to the right), neurula, tailbud and tadpole stages. ba, branchial arches; bp, blastopore; hb, hindbrain; mb, midbrain; nt, neural tube; ov, ovic vesicle; SO Spemann organizer. (B) Representative phenotypes of tailbud stage Xenopus tropicalis embryos injected animally at 2- to 8 cell stage as indicated. (C) Quantification of phenotypes shown in (B). The number of embryos per condition is indicated on the top. (D) Whole mount in situ hybridization of gsc and chordin in gastrula embryos (stage 10.5). Embryos were injected at 2- to 8 cell stage animally with Co or ptprk Mo with or without ZNRF3 RNA. For quantification, see Figure 5—figure supplement 1C. (E) Topflash reporter assay performed with neurulae (stage 18). Embryos were injected animally at 2- to 8 cell stage as indicated. Suboptimal dosages of ptprk or znrf3 Mos were used in this experiment. Normalized Topflash activity of Co Mo injected embryos was set to 1. (F) Topflash reporter assay performed with neurulae (stage 18). Embryos were injected animally at 2- to 8 cell stage as indicated. Normalized Topflash activity of Co Mo injected embryos was set to 1. Data in all graphs are displayed as means ± SD, and show one representative of multiple independent experiments with three biological replicates. RLU, relative light units. **p<0.01.
Figure 5—figure supplement 1
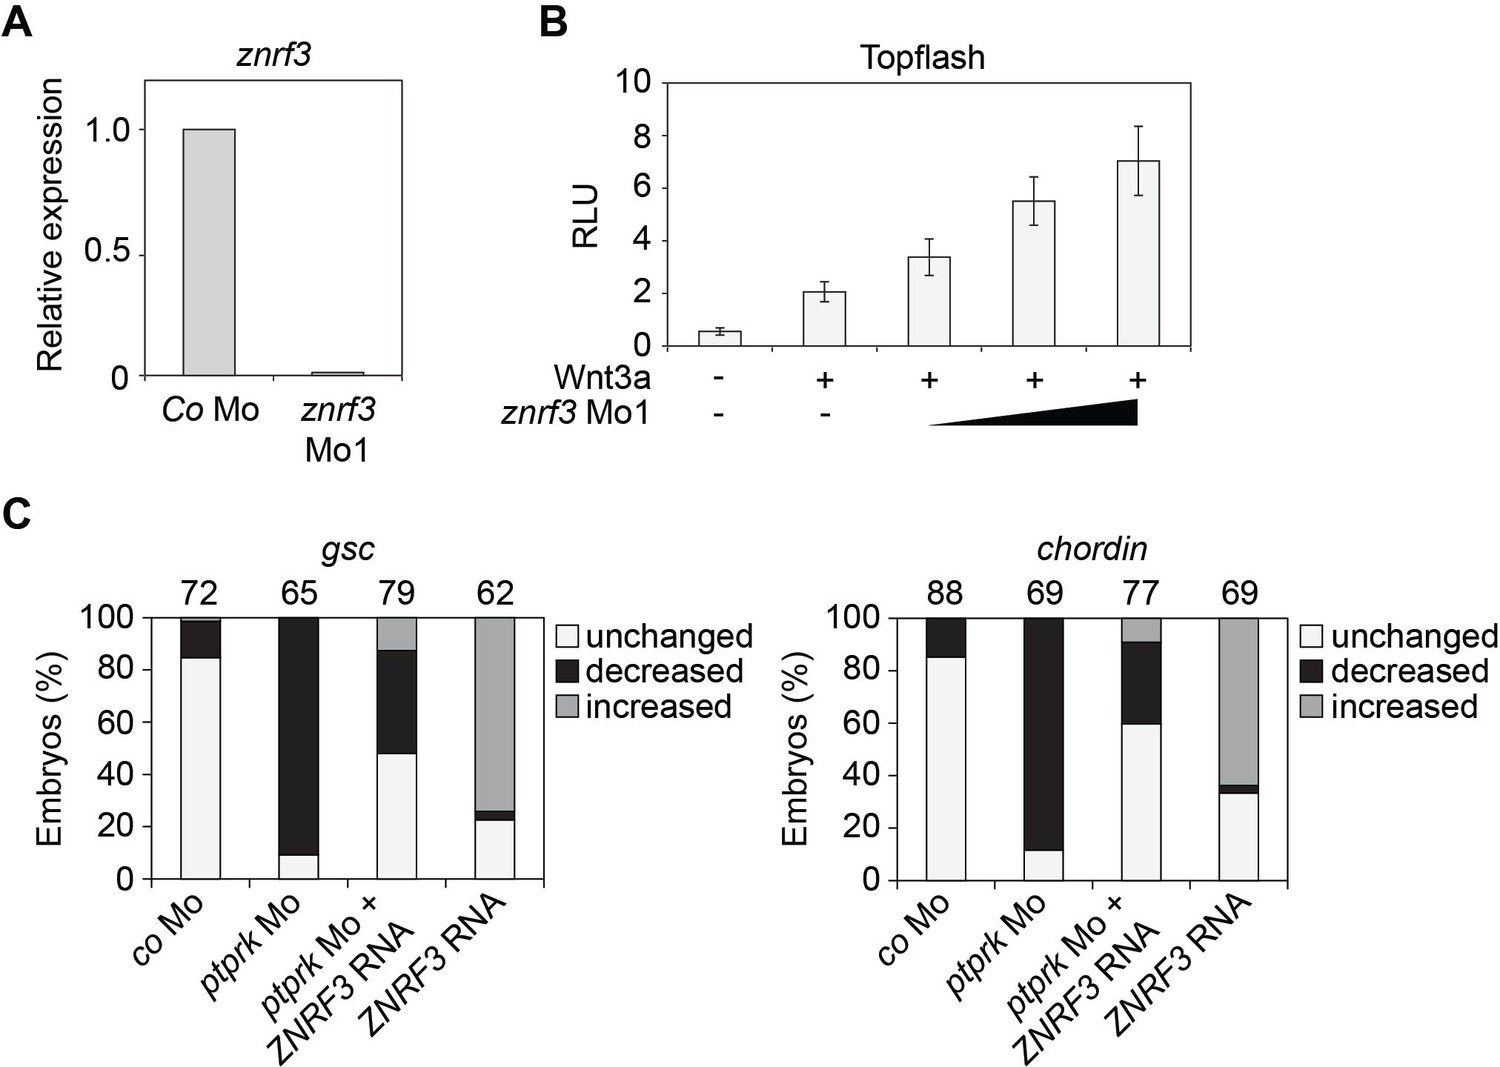
Znrf3 Mo activates Wnt signaling in Xenopus embryos.
(A) Knockdown efficiency of znrf3 Mo1 by qRT-PCR analysis. (B) Topflash reporter assay performed with neurula (stage 18) embryos. Embryos were injected animally at 2- to 8 cell stage as indicated. Normalized Topflash activity of Co Mo injected embryos was set to 1. (C) Quantification of the expression of the indicated genes by whole mount in situ hybridization in Figure 5D. Top, number of embryos.
Figure 6 with 1 supplement
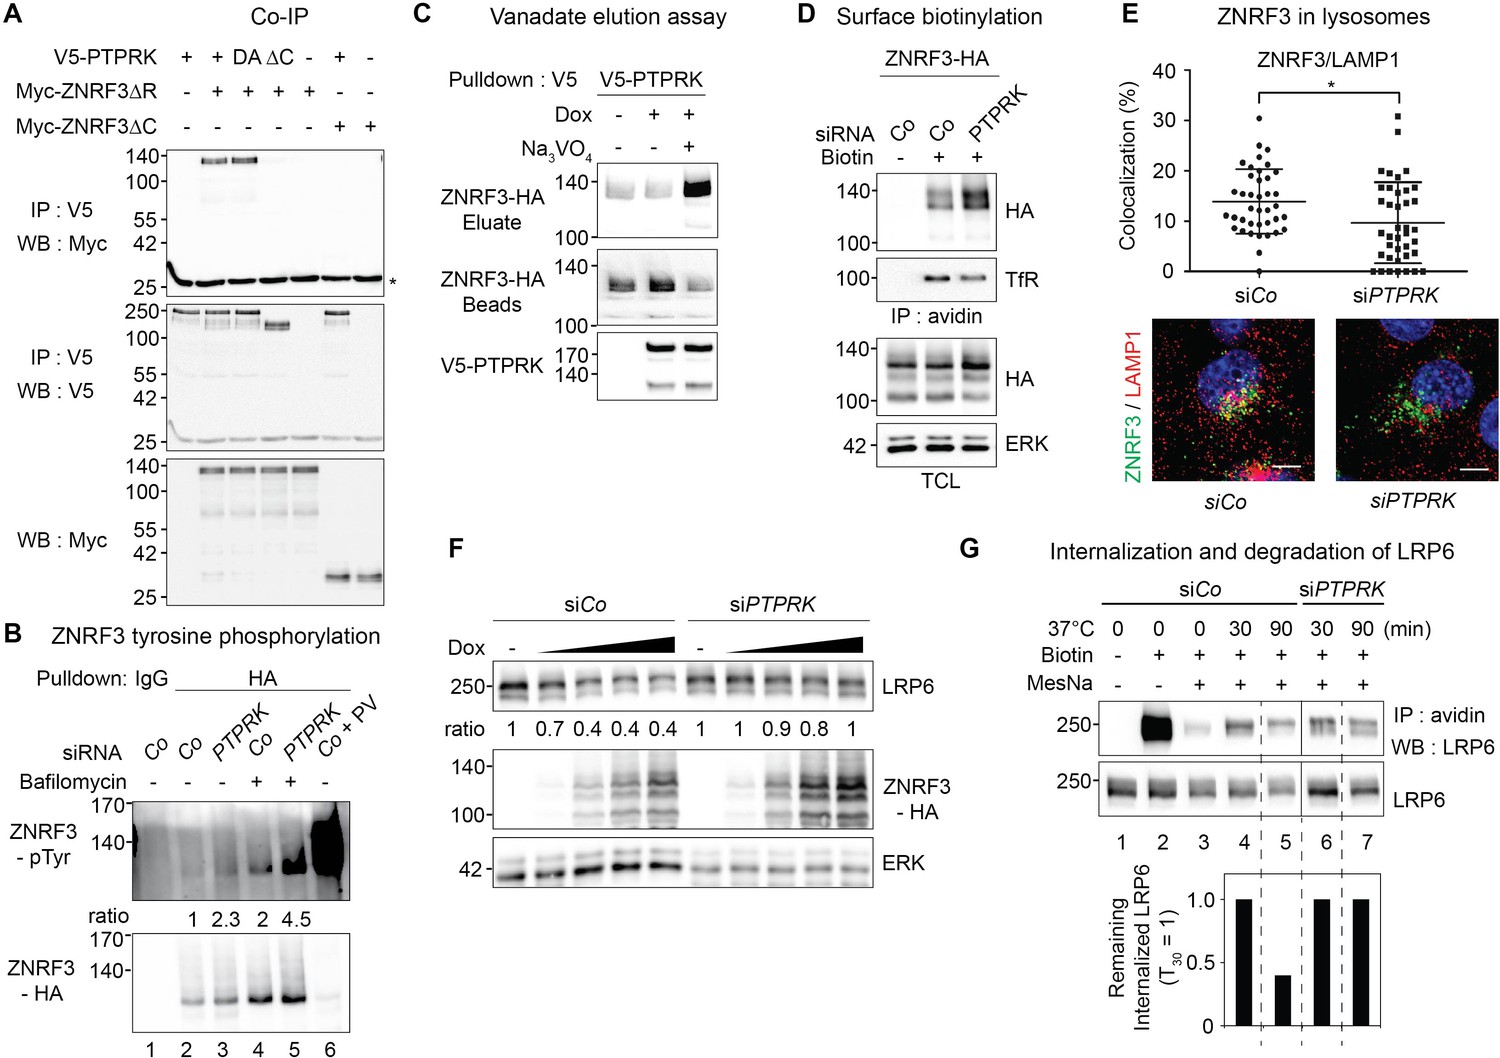
PTPRK binds ZNRF3 and promotes its dephosphorylation and lysosomal trafficking.
(A) Co-immunoprecipitation experiments in HEK293T cells transfected with the indicated constructs and analyzed 48 hr after transfection. Data show a representative result from three independent experiments with similar outcomes. Asterisk, IgG light chain. (B) Tyrosine phosphorylation of ZNRF3 in TetOn ZNRF3-HA H1703 cells upon siRNA transfection with or without bafilomycin treatment overnight. Cells were treated with Dox for 48 hr before harvest. As a control, cells were treated with Na-pervanadate (PV, phosphatase inhibitor) for 30 min before harvest. Lysates were pulled down with anti-HA antibody or control IgG and subjected to Western blot analysis. Ratio, tyrosine phosphorylation of ZNRF3 normalized to total ZNRF3. (C) PTPRK-ZNRF3 interaction is vanadate-sensitive. Immobilized, immunoisolated V5-PTPRK from TetOn V5-PTPRK cells was incubated with total cell lysate from ZNRF3-HA expressing, Na-pervanadate treated cells. Bound ZNRF3-HA was eluted with 20 mM vanadate as indicated and eluate and beads were separated before Western blot analysis. (D) Cell surface biotinylation assay performed in TetOn ZNRF3-HA H1703 cells upon siRNA treatment. Cells were treated with Dox for 48 hr before harvest. After labeling surface proteins with Sulfo-NHS-LC-LC-Biotin, lysates were pulled down with streptavidin beads and subjected to Western blot analysis. Transferrin receptor (TfR), loading control for avidin pull down; ERK, total cell lysate (TCL) control. A representative result from three independent experiments with similar outcomes is shown. (E) Colocalization by immunofluorescence microscopy (IF) of ZNRF3 (Green) with LAMP1 (Red) in TetOn ZNRF3-HA H1703 cells upon siRNA treatment. Top, graph shows quantification of ZNRF3 colocalizing with LAMP1 (Mean ± SD, *p<0.05, student t-test). Bottom, representative IF images. Note that plasma membrane localized ZNRF3 cannot be seen due to low microscope laser power used for optimal vesicular co-localization in. Colocalization data are pooled from two independent experiments. (F) Western blot analysis of Dox treated TetOn ZNRF3-HA H1703 cells upon siRNA treatment. Ratio, LRP6 normalized to ERK. A representative result from three independent experiments with similar outcomes is shown. (G) Internalization and degradation assay of LRP6 in TetOn ZNRF3-HA H1703 cells treated as indicated. After labeling of surface proteins with Sulfo-NHS-SS-Biotin, endocytosis was induced by shifting cells to 37°C for the indicated times. At each indicated time point, cells were treated with MesNa to remove biotinylated surface proteins and then harvested. Cells were lysed, and biotinylated proteins were pulled down with streptavidin beads and analyzed with indicated antibodies. Lane 1: non-biotin treated control, Lane 3: MesNa treated after biotin labeling without inducing endocytosis (monitoring MesNa efficiency). The graph below shows avidin pulled down LRP6 levels normalized to total LRP6 levels (remaining internalized LRP6 at 30 min upon siCo was set to 1).
Figure 6—figure supplement 1
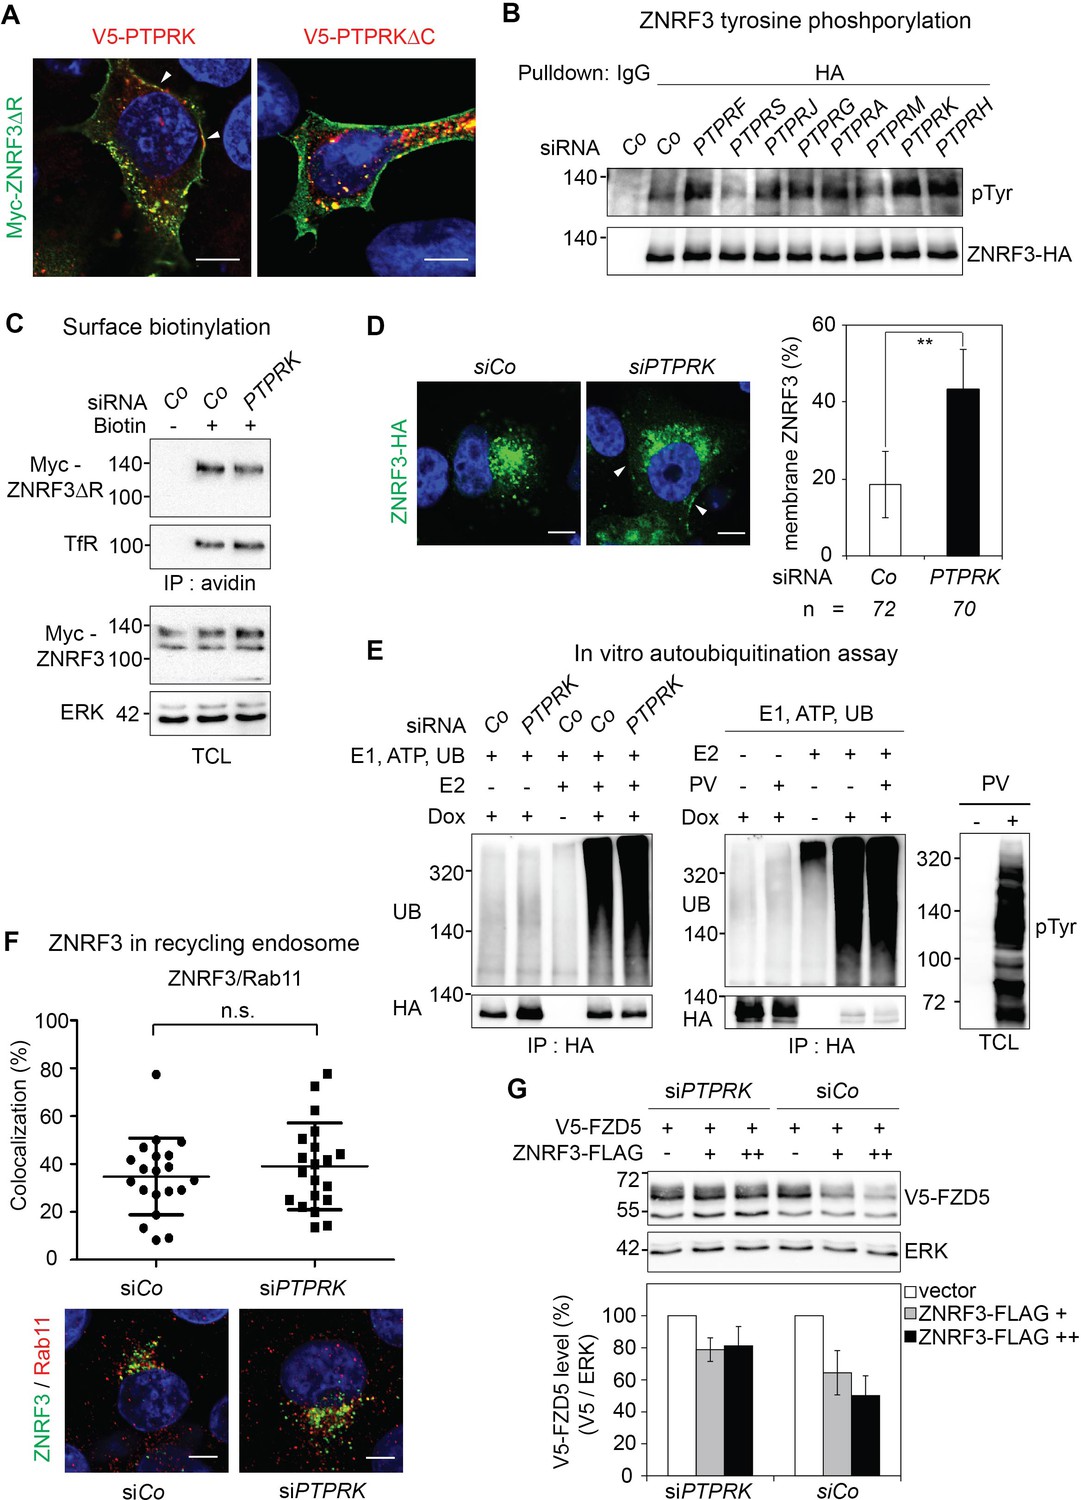
PTPRK regulates ZNRF3 trafficking but not its intrinsic E3 ligase activity.
(A) Immunofluorescence microscopy showing colocalization of Myc-ZNRF3-ΔRING (green) with V5-PTPRK or V5-PTPRK-ΔC (red). Arrowheads indicate colocalization of PTPRK but not PTPRK-ΔC with ZNRF3 at the plasma membrane. (B) Tyrosine phosphorylation of ZNRF3 in TetOn ZNRF3-HA H1703 cells upon siRNA transfection and bafilomycin treatment overnight. (C) Cell surface biotinylation assay performed in H1703 cells transfected with Myc-ZNRF3-ΔR upon PTPRK knockdown. After labeling surface protein with NHS-LC-LC-Biotin, lyates were pulled down with streptavidin beads and subjected to Western blot analysis. Transferrin receptor (TfR), loading control for avidin pull down; ERK, total cell lysate (TCL) control. A representative result from three independent experiments with similar outcomes is shown. (D) Immunofluorescence microscopy (IF) showing the localization of ZNRF3-HA (green) upon PTPRK knockdown. Left, representative IF images. Arrowheads indicate plasma membrane ZNRF3. Right, quantification of membrane ZNRF3 positive cells (mean ± SD, **p<0.01, student t-test). The number of cells per condition is indicated at the bottom (n). (E) Ubiquitin Western blot of in vitro autoubiquitination assay for ZNRF3-HA upon PTPRK knockdown (left panel) or Na-pervanadate treatment (right panel) in TetOn ZNRF3-HA cells. After 48 hr of Dox treatment and 72 hr of PTPRK knockdown, immunoisolated ZNRF3 was incubated as indicated. Where indicated, cells were treated with 100 μM Na-pervanadate (PV) for 30 min before harvest. A representative result of two independent experiments with similar outcomes is shown. (F) Colocalization by immunofluorescence microscopy (IF) of ZNRF3 (Green) with Rab11 (recycling endosome marker, red) in Dox treated TetOn ZNRF3-HA H1703 cells upon siRNA treatment. Top, graph shows quantification of ZNRF3 colocalizing with LAMP1 (Mean ± SD, *p<0.05, student t-test). Bottom, representative IF images. Colocalization data are pooled from two independent experiments. (G) Western blot analysis of H1703 cells transfected as indicated. The graph shows quantification of V5-FZD5 normalized to ERK from three independent experiments (Mean ± SE, student t-test). The level of V5-FZD5 without ZNRF3-HA transfection was set to 100%.
Figure 7 with 2 supplements
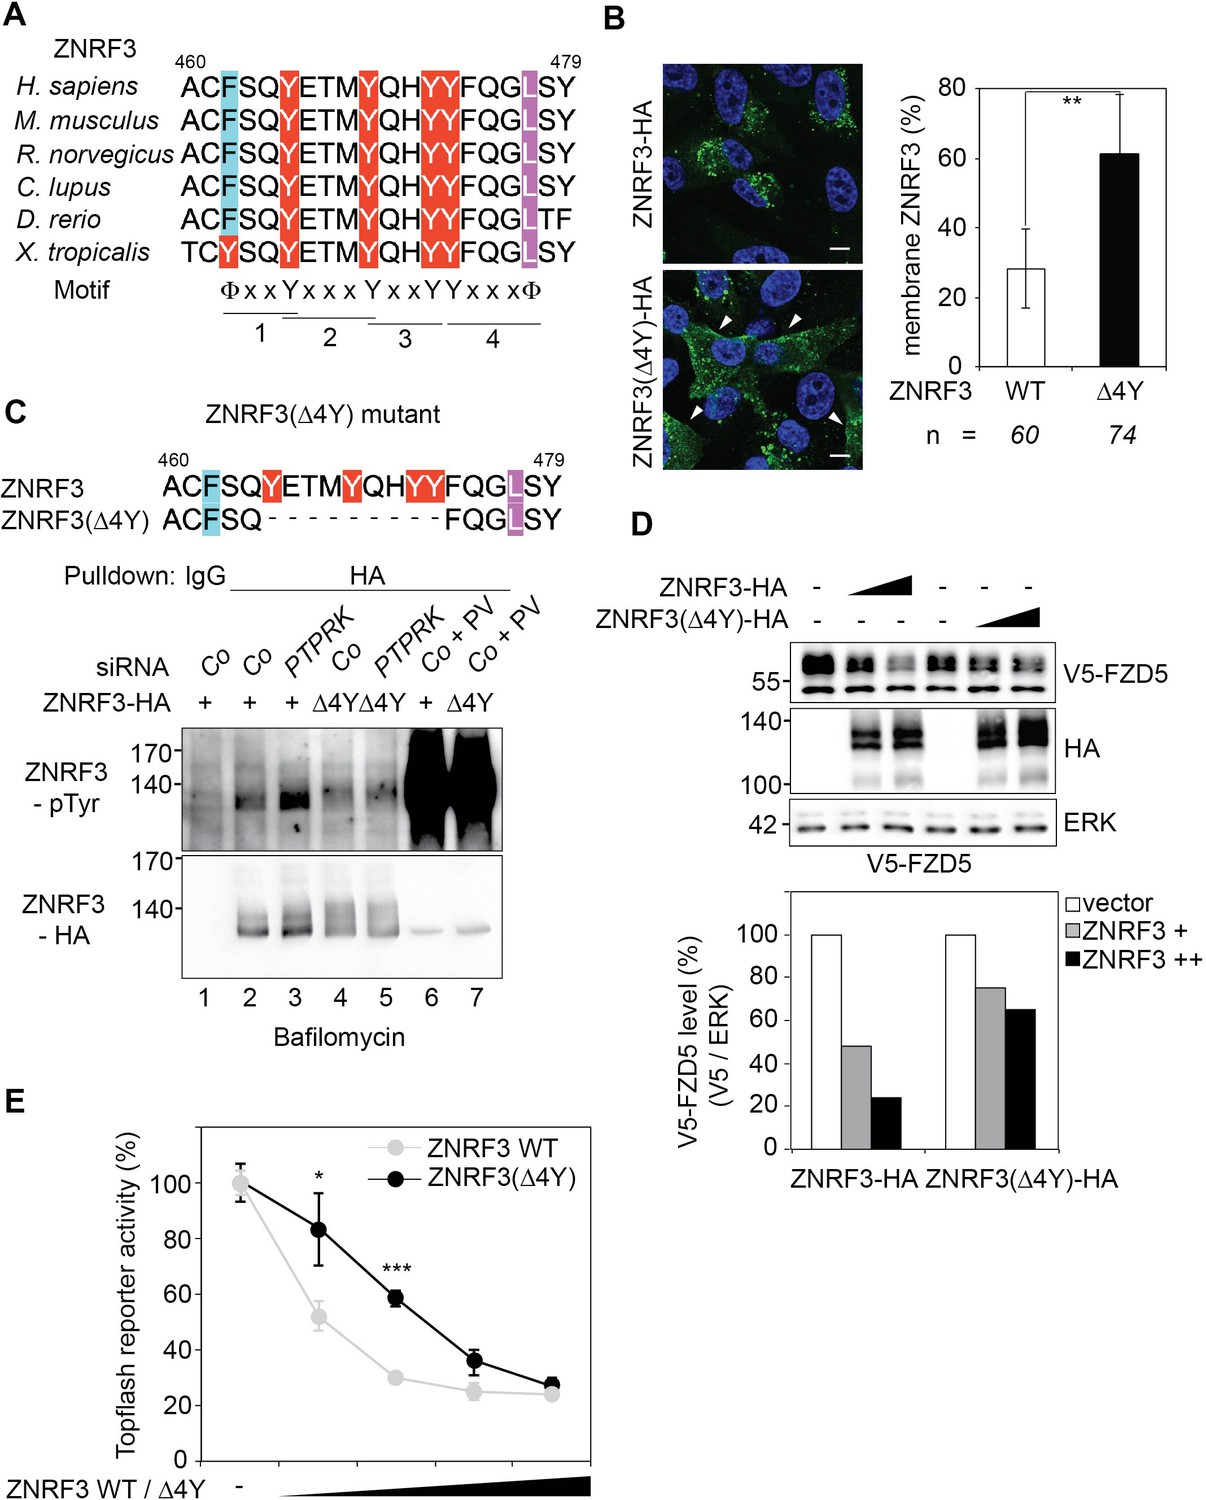
A "4Y" endocytic motif in ZNRF3 is regulated by PTPRK.
(A) Multiple sequence alignment of ZNRF3 among different species. Y: Tyrosine, X: any amino acids, and Φ: hydrophobic bulky amino acids. (B) Subcellular localization by immunofluorescence microscopy (IF) of ZNRF3-HA or ZNRF3(Δ4Y)-HA in H1703 cells with bafilomycin treatment overnight. Left, representative IF images. Arrowheads indicate membrane ZNRF3. Right, graph shows quantification of membrane ZNRF3 positive cells (Mean ± SD, **p<0.01, student t-test). The number of cells per condition is indicated at the bottom (n). IF data are pooled from two independent experiments. (C) Tyrosine phosphorylation of ZNRF3-HA or ZNRF3(Δ4Y)-HA in H1703 cells upon siRNA transfection with bafilomycin treatment overnight. As a control, cells were treated with Na-pervanadate (PV, phosphatase inhibitor) for 30 min before harvest. Lysates were pulled down with anti-HA antibody or control IgG and subjected to Western blot analysis. (D) Western blot analysis of H1703 cells transfected as indicated. The graph below shows quantification of V5-FZD5 normalized to ERK. The level of V5-FZD5 without ZNRF3-HA transfection was set to 100%. A representative result from two independent experiments with similar outcomes is shown. (E) Topflash reporter assay in H1703 cells upon transfection of different amount of ZNRF3-HA or ZNRF3(Δ4Y)-HA plasmids. All samples were Wnt3a treated for 24 hr before measurement. (Mean ± SD, n = 3; *p<0.05, ***p<0.001, student t-test). Topflash activity without ZNRF3 transfection was set to 100%. A representative result from three independent experiments with similar outcomes is shown.
Figure 7—figure supplement 1
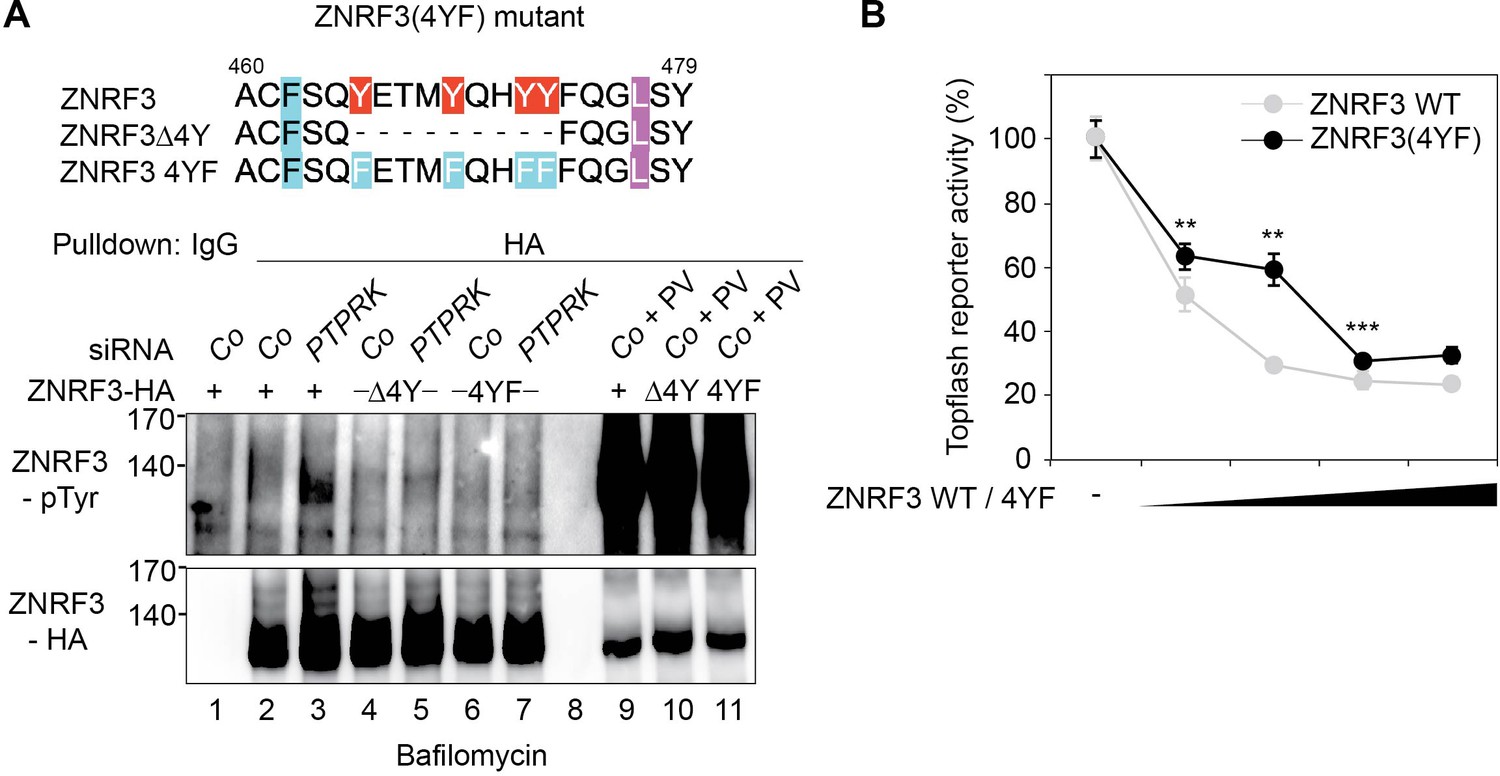
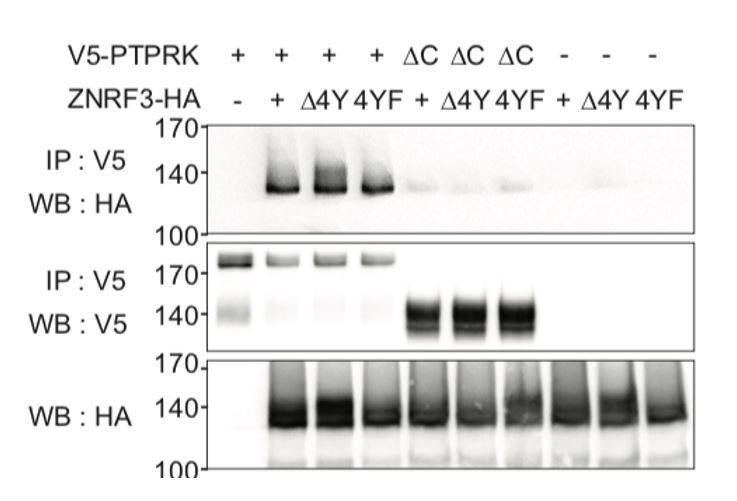
The ZNRF3(4YF) mutant resists PTPRK regulation and shows reduced Wnt signal inhibition.
(A) Tyrosine phosphorylation of the indicated Wt and mutant ZNRF3 constructs in H1703 cells upon siRNA transfection and bafilomycin treatment overnight. As control, cells were treated with Na-pervanadate (PV, phosphatase inhibitor) for 30 min before harvest. Lysates were pulled down with anti-HA antibody or control IgG and subjected to Western blot analysis. (B) Topflash reporter assay in H1703 cells upon transfection of different amount of the indicated Wt and mutant ZNRF3 plasmids. All samples were Wnt3a treated for 24 hr before measurement. (Mean ± SD, n = 3; **p<0.005, ***p<0.001, student t-test). Topflash activity without ZNRF3 transfection was set to 100%. A representative result from three independent experiments with similar outcomes is shown.
Figure 7—figure supplement 2
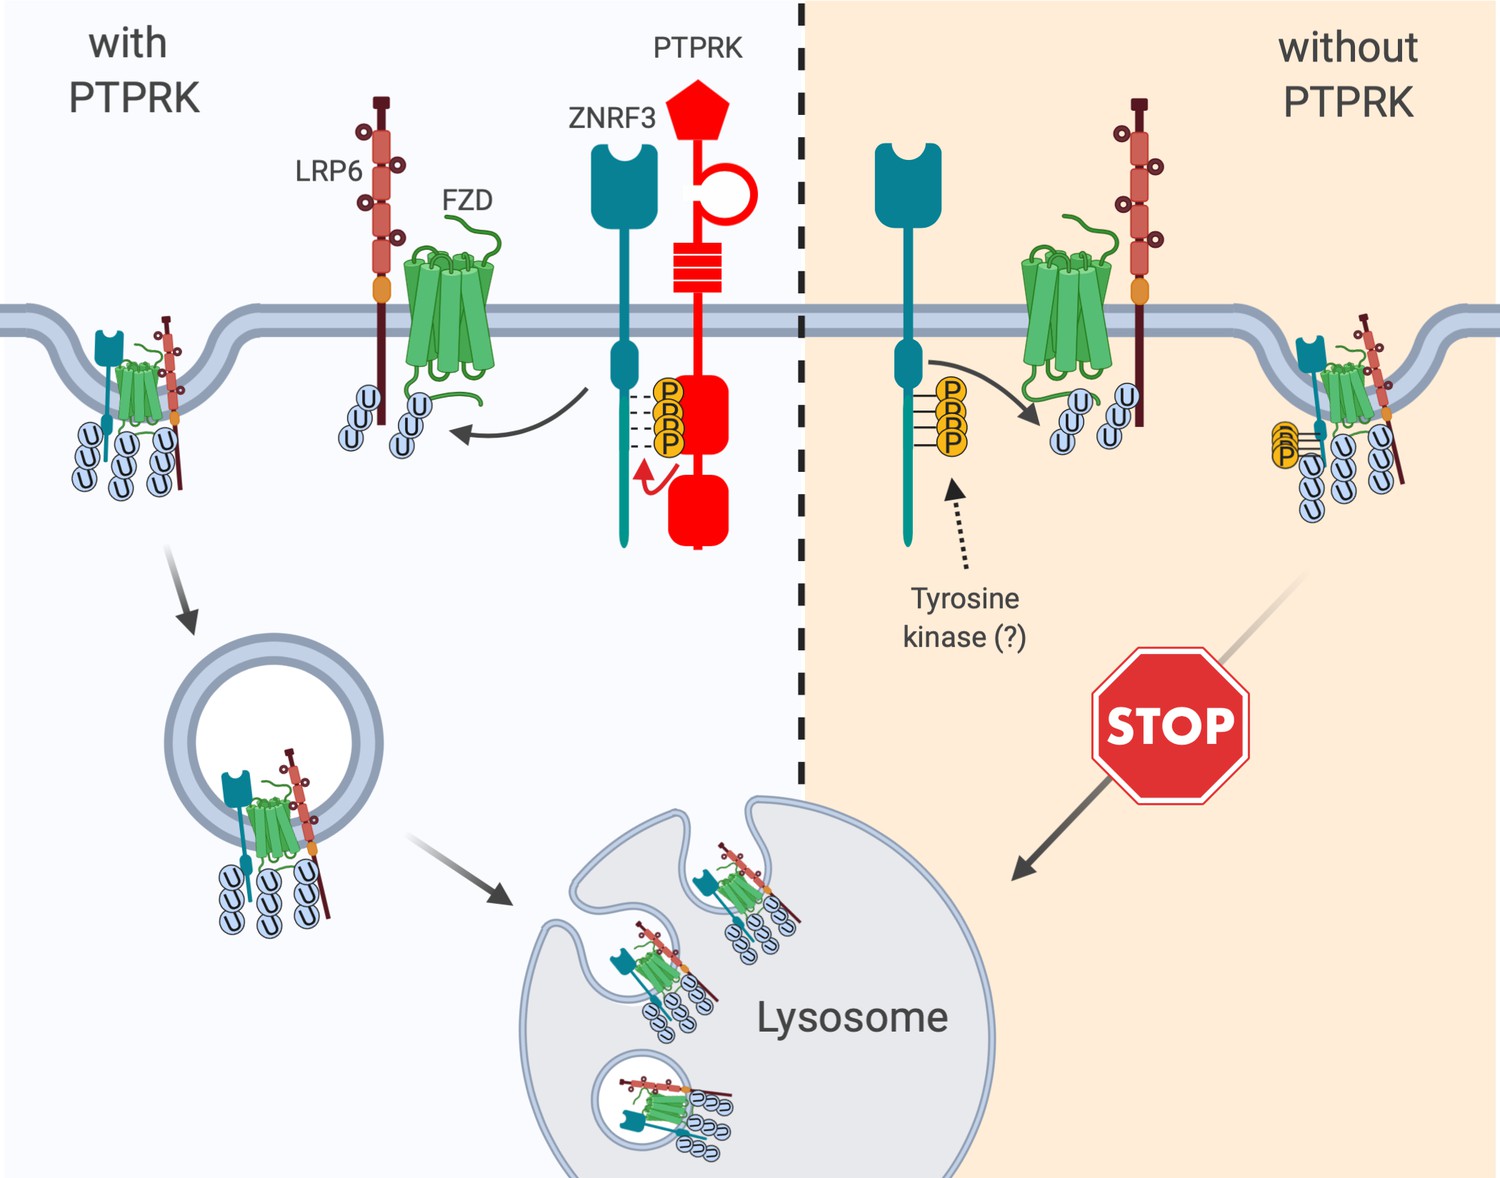
Model for PTPRK acting as Wnt inhibitor.
Left, ZNRF3 E3 ubiquitin ligase reaching the plasma membrane continuously co-internalizes Wnt receptors, targets them for lysosomal degradation and reduces Wnt signaling. An unphosphorylated 4-tyrosine (‘4Y’) motif serves as ZNRF3 internalization signal. The phosphatase PTPRK dephosphorylates the 4Y motif and promotes ZNRF3 lysosomal targeting along with Wnt receptors to reduce Wnt signaling. Right, in the absence of PTPRK an unknown tyrosine kinase(s) phosphorylates the 4Y motif, impairs ZNRF3/Wnt receptor internalization, and increases Wnt signaling. Created with https://biorender.com/.
Author response image 1
Internalization-motif mutants of ZNRF3 still bind PTPRK.
CoIP experiments in HEK293T cells transfected with the indicated constructs. Data show a representative result from three independent experiments with similar outcomes.
Author response image 2
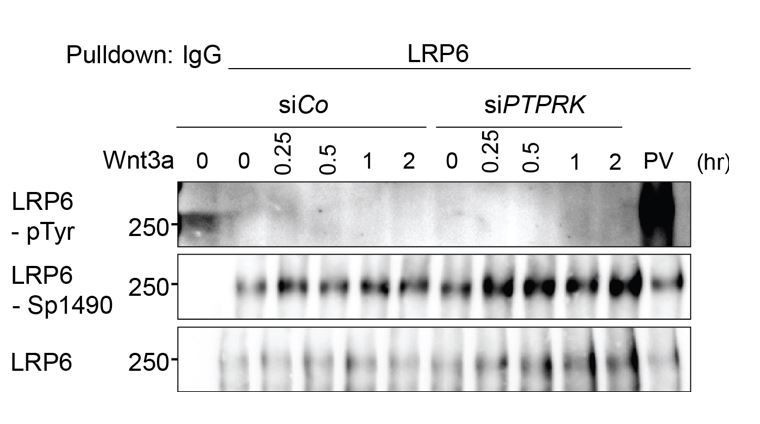
PTPRK depletion does not induce LRP6 Tyrosine phosphorylation.
Tyrosine phosphorylation of LRP6 in H1703 cells with Wnt3a treatment upon siRNA transfection. As a control, cells were treated with Na-pervanadate (PV, phosphatase inhibitor) for 30 min before harvest. Cells were treated with Wnt3a for the indicated time before harvest. Lysates were pulled down with anti-LRP6 antibody or control IgG and subjected to Western blot analysis.
Author response image 3

siPTPRK does not affect tyrosine phosphorylation of RNF43.
(A) Table showing the comparison of multiple sequence alignment result of ZNRF3 and RNF43 intracellular domain among different species including H. sapiens, M. musculus, R. norvegicus, C. lupus, D. rerio and X. tropicalis. (B) siPTPRK does not affect tyrosine phosphorylation of RNF43. Tyrosine phosphorylation of RNF43-FLAG in H1703 cells was analyzed in bafilomycin treated cells. As a control, cells were treated with Na-pervanadate (PV, phosphatase inhibitor) for 30 min before harvest. Lysates were pulled down with anti-FLAG antibody or control IgG and subjected to Western blot analysis. A representative result from two independent experiments with similar outcomes is shown.
Author response image 4
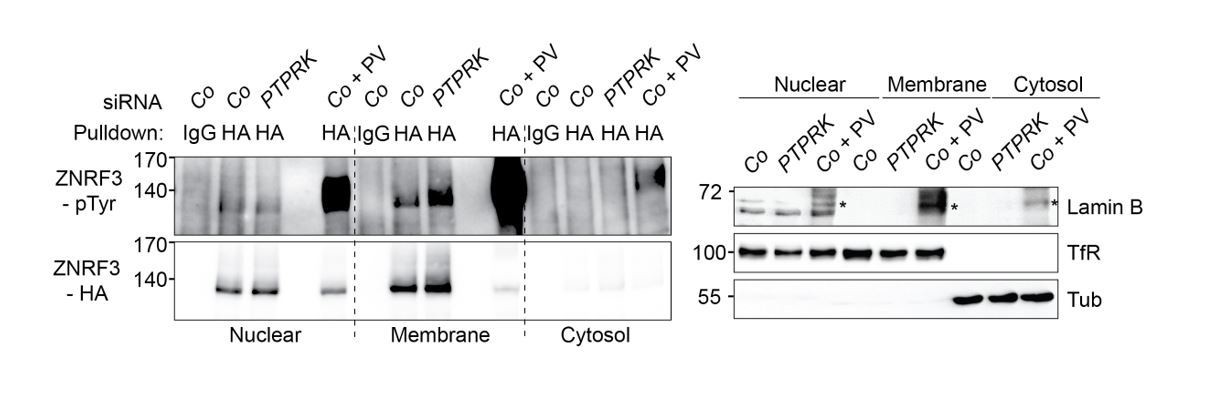
PTPRK regulates tyrosine phosphorylation of ZNRF3 at the plasma membrane.
Left: Tyrosine phosphorylation of ZNRF3 in TetOn ZNRF3-HA H1703 cells upon siRNA transfection after subcellular fractionation. As a control, cells were treated with Na-pervanadate (PV, phosphatase inhibitor) for 30 min before harvest. Right: Subcellular markers to validate fractionation. Lamin B: Nucleus; TfR (transferrin receptor), Plasma membrane; Tubulin, cytosol marker. Note that nuclear fraction displaying TfR signal indicates that nuclear fraction contains ER. Asterisk: non-specific bands from Na-pervanadate treatment. A representative result from two independent experiments with similar outcomes is shown.
Author response image 5
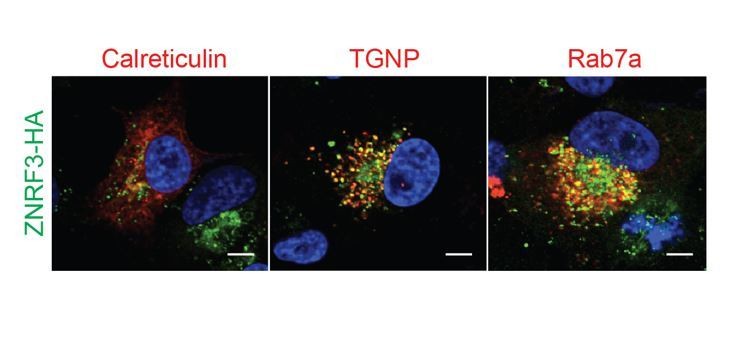
PTPRK resides in secretory vesicles and endosomes.
Immunofluorescence microscopy showing colocalization of ZNRF3-HA (green) with mCherry-Calreticulin, mCherry-TGNP or mCherry-Rab7a (red).
Tables
Key resources table
| Reagent type (species) or resource | Designation | Source or reference | Identifiers | Additional information |
|---|---|---|---|---|
| Gene (Homo spiens) | PTPRK | RZPD | DKFZ p686c2268Q2 | |
| Gene (Homo spiens) | ZNRF3 | Feng Cong PMID: 22575959 | ||
| Gene (Homo spiens) | FZD5 | NCBI | NM_003468.4 | |
| Strain, strain background (Xenopus tropicalis) | Xenopus tropicalis | Nasco | LM00822 | |
| Strain, strain background (Xenopus tropicalis) | Xenopus tropicalis | National Xenopus Resource (NXR) | NXR_1018 RRID:SCR_013731 | |
| Strain, strain background (Xenopus tropicalis) | Xenopus tropicalis | European Xenopus Resource Centre (EXRC) | RRID:SCR_007164 | |
| Cell line (Homo-sapiens) | H1703 | ATCC | CRL-5889 RRID:CVCL_1490 | |
| Cell line (Homo-sapiens) | 293T | ATCC | CRL-3216 RRID:CVCL_0063 | |
| Cell line (Homo-sapiens) | H1703 TetOn ZNRF3-HA | This paper | generated from H1703 | |
| cell line (Homo-sapiens) | H1703 TetOn V5-PTPRK | This paper | generated from H1703 | |
| Antibody | anti-transferrin receptor (Rabbit monoclonal) | Cell signaling | Cat# 13113 RRID:AB_2715594 | WB (1:5000) |
| Antibody | anti-LRP6 (Rabbit monoclonal) | Cell signaling | Cat# 2560 RRID:AB_2139329 | WB (1:1000) |
| Antibody | anti-LRP6 (Mouse monoclonal) | R and D systems | Cat#: MAP1505 RRID:AB_10889810 | FACS (2.5 µg/ml) |
| Antibody | anti-phospho LRP6 (Sp1490) (Rabbit monoclonal) | Cell signaling | Cat#: 2568 RRID:AB_2139327 | WB (1:1000) |
| Antibody | anti-Rab11 (Mouse monoclonal) | BD bioscience | Cat#: 610656 RRID:AB_397983 | IF (1:200) |
| Antibody | anti-β-catenin (Mouse monoclonal) | BD bioscience | Cat#: 610154 RRID:AB_397555 | WB (1:5000) |
| Antibody | anti-phosphotyrosine(4G10) (Mouse monoclonal) | BD bioscience | Cat#: 610000 RRID:AB_397423 | IF (1:1000) |
| Antibody | anti-Erk1/2 (Rabbit polyclonal) | Sigma Aldrich | Cat#: M8159 RRID:AB_477245 | WB (1:5000) |
| Antibody | anti-V5 (Mouse monoclonal) | Thermo scientific | Cat#: R960-25 RRID:AB_2556564 | WB (1:5000) IF (1:1000) |
| Antibody | anti-HA (Rat polyclonal) | Roche | Cat#: 1867423 RRID:AB_390918 | WB (1:1000) IF (1:1000) |
| Antibody | anti-Myc (Mouse monoclonal) | DSHB | Cat#: 9E10 RRID:AB_2266850 | WB (1:1000) |
| Antibody | anti-Myc (Rabbit polyclonal) | Millipore | Cat#: 06–549 RRID:AB_310165 | IF (1:1000) |
| Antibody | anti-pan FZD (humanized) | Austin Gurney (former Oncomed pharmaceuticals) | OMP-18R5 | FACS (2.5 µg/ml) |
| Antibody | anti-GFP (Rabbit polyclonal) | Invitrogen | Cat#: A11122 RRID:AB_221569 | WB (1:1000) |
| Antibody | anti-Ubiquitin (Rabbit polyclonal) | Dako | Cat#: Z0458 RRID:AB_2315524 | WB (1:1000) |
| Antibody | anti-LAMP1 (Rabbit polyclonal) | Abcam | Cat#: ab24170 RRID:AB_775978 | IF (1:200) |
| Antibody | goat-anti mouse HRP | Dianova | 115-035-174 RRID:AB_2338512 | WB (1:10000) |
| Antibody | goat-anti rabbit HRP | Dianova | 111-035-144 RRID:AB_2307391 | WB (1:10000) |
| Antibody | goat-anti rat HRP | Dianova | 112-035-175 RRID:AB_2338140 | WB (1:10000) |
| Antibody | goat-anti mouse Alexa 488 | Invitrogen | A11029 RRID:AB_138404 | IF (1:200) |
| Antibody | donkey-anti rabbit Alexa 647 | Invitrogen | A31573 RRID:AB_2536183 | IF (1:200) |
| Antibody | goat-anti rat Alexa 488 | Invitrogen | A11006 RRID:AB_141373 | IF (1:200) |
| Antibody | donkey-anti mouse Alexa 647 | Invitrogen | A31571 RRID:AB_162542 | IF (1:200) |
| Antibody | goat-anti human Alexa 488 | Invitrogen | A11013 RRID:AB_141360 | FACS (1:500) |
| Recombinant DNA reagent | pCS2+ (plasmid) | Ralph AW Rupp PMID: 7926732 | ||
| Recombinant DNA reagent | pCS2-V5PTPRK (plasmid) | This paper | See ‘Expression constructs’ | |
| Recombinant DNA reagent | pCS2-V5PTPRK D1057A (plasmid) | This paper | See ‘Expression constructs’ | |
| Recombinant DNA reagent | pCS2-V5PTPRK C1089S (plasmid) | This paper | See ‘Expression constructs’ | |
| Recombinant DNA reagent | pCS2-V5PTPRK ΔC (plasmid) | This paper | See ‘Expression constructs’ | |
| Recombinant DNA reagent | pcDNA4/TO-ZNRF3HA (plasmid) | Feng Cong PMID: 22575959 | ||
| Recombinant DNA reagent | Myc-ZNRF3ΔRING (plasmid) | Feng Cong PMID: 22575959 | ||
| Recombinant DNA reagent | pcDNA4/TO-ZNRF3(Δ4Y) (plasmid) | This paper | See ‘Expression constructs’ | |
| Recombinant DNA reagent | pcDNA4/TO-ZNRF3(4YF) (plasmid) | This paper | See ‘Expression constructs’ | |
| Recombinant DNA reagent | pcDNA4/TO-ZNRF3-Flag (plasmid) | Feng Cong PMID: 25891077 | ||
| Recombinant DNA reagent | pCS2-V5-Frizzled5 | This paper | See ‘Expression constructs’ | |
| Recombinant DNA reagent | pCDNA3-mWnt1-Myc | from Xi He | ||
| Recombinant DNA reagent | pRK5-mFz8 | from J Nathans | ||
| Recombinant DNA reagent | pCS2-hLRP6 | from Xi He | ||
| Recombinant DNA reagent | pCS2-hDvl1 | RZPD | IRALp962D1142 | |
| Recombinant DNA reagent | hβ-catenin S37A | from M Boutros | ||
| Peptide, recombinant protein | Catalase | Sigma Aldrich | Cat. #: C1345 | |
| Commercial assay or kit | NucleoSpin RNA | Macherey-Nagel | Cat. #: 740955 | |
| Commercial assay or kit | SuperSignal West pico ECL | Thermo Scientific | Cat. #: 34577 | |
| Chemical compound, drug | Bafilomycin | Calbiochem | Cat. #: 196000 | |
| Chemical compound, drug | BIO | Cayman chemical company | Cat. #: 16329 | |
| Chemical compound, drug | Mesna | Cayman chemical company | Cat. #: 21238 | |
| Software, algorithm | LightCycler 480 software | Roche | 4994884001 | |
| Software, algorithm | Fluoroskan Ascent FL software | Thermo scientific | 11540775 | |
| Software, algorithm | LAS 3000 Reader ver 2.2 | Fuji film | ||
| Software, algorithm | Multi-gauge ver 3.2 | Fuji film | ||
| Software, algorithm | FlowJo software ver 10.5.3 | BD | RRID:SCR_008520 | |
| Software, algorithm | Zen black | Carl Zeiss | RRID:SCR_013672 | |
| Software, algorithm | Graphpad | Prism | RRID:SCR_002798 | |
| Software, algorithm | Fiji (image J) | Open source PMID: 22743772 | RRID:SCR_002285 | |
| Other | Hoechst | Sigma Aldrich | B-2883 | (1 µg/mL) |
| Other | Protein A magnetic bead | Thermo Scientific | 88846 | |
| Other | Strepavidin agarose | Thermo Scientific | 20359 | |
| Other | sulfo-NHS-LC-LC-Biotin | Thermo Scientific | 21338 | 0.25 mg/ml |
| Other | sulfo-NHS-SS-Biotin | Thermo Scientific | 21331 | 0.5 mg/ml |
Additional files
-
Supplementary file 1
Morpholinos, siRNA and primers used in this study.
- https://cdn.elifesciences.org/articles/51248/elife-51248-supp1-v2.docx
-
Transparent reporting form
- https://cdn.elifesciences.org/articles/51248/elife-51248-transrepform-v2.docx
Download links
A two-part list of links to download the article, or parts of the article, in various formats.
Downloads (link to download the article as PDF)
Open citations (links to open the citations from this article in various online reference manager services)
Cite this article (links to download the citations from this article in formats compatible with various reference manager tools)
The tumor suppressor PTPRK promotes ZNRF3 internalization and is required for Wnt inhibition in the Spemann organizer
eLife 9:e51248.
https://doi.org/10.7554/eLife.51248


