Revisiting the role of Dcc in visual system development with a novel eye clearing method
- Institut de la Vision, Sorbonne Université, INSERM, CNRS, France
Figures
Figure 1 with 1 supplement
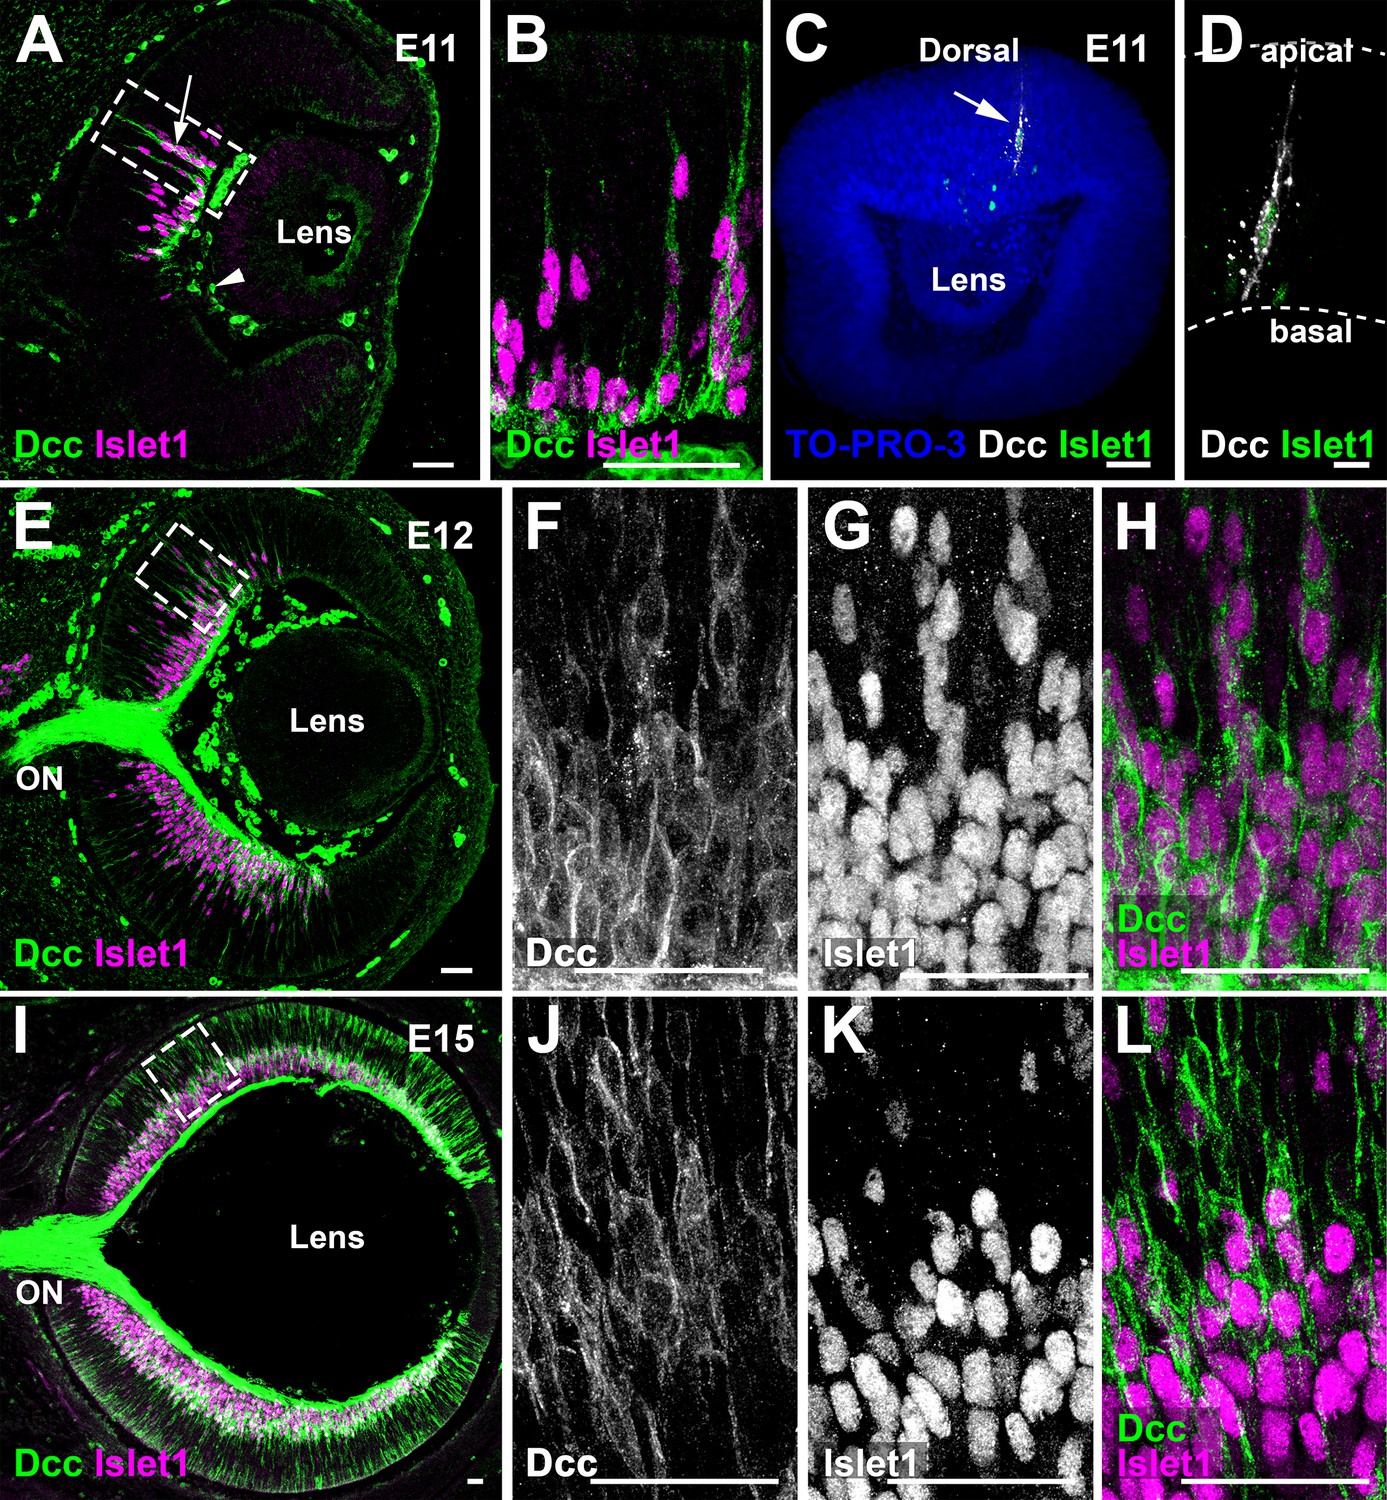
Dcc is broadly expressed in the mouse retina.
(A) Immunohistochemistry (IHC) of Dcc (arrow, green) and the retinal ganglion cell marker Islet1 (magenta), at E11. Non-specific Dcc signal is seen in mesenchymal cells (arrowhead) (B) is a high magnification image. (C,D) Whole-mount IHC of an E11 eye for Dcc (white, arrow) and Islet1 (green) counterstained with the nuclear marker TO-PRO-3 (blue). (E) Dcc (green) and Islet1 (magenta) IHC at E12. (F–H) are high magnification images. (I–L) Dcc (green) and Islet1 (magenta) IHC at E15. Scale bars: (A–H) 50 μm, (I,K) 30 μm, (J,L) 10 μm. ON, Optic Nerve.
Figure 1—figure supplement 1
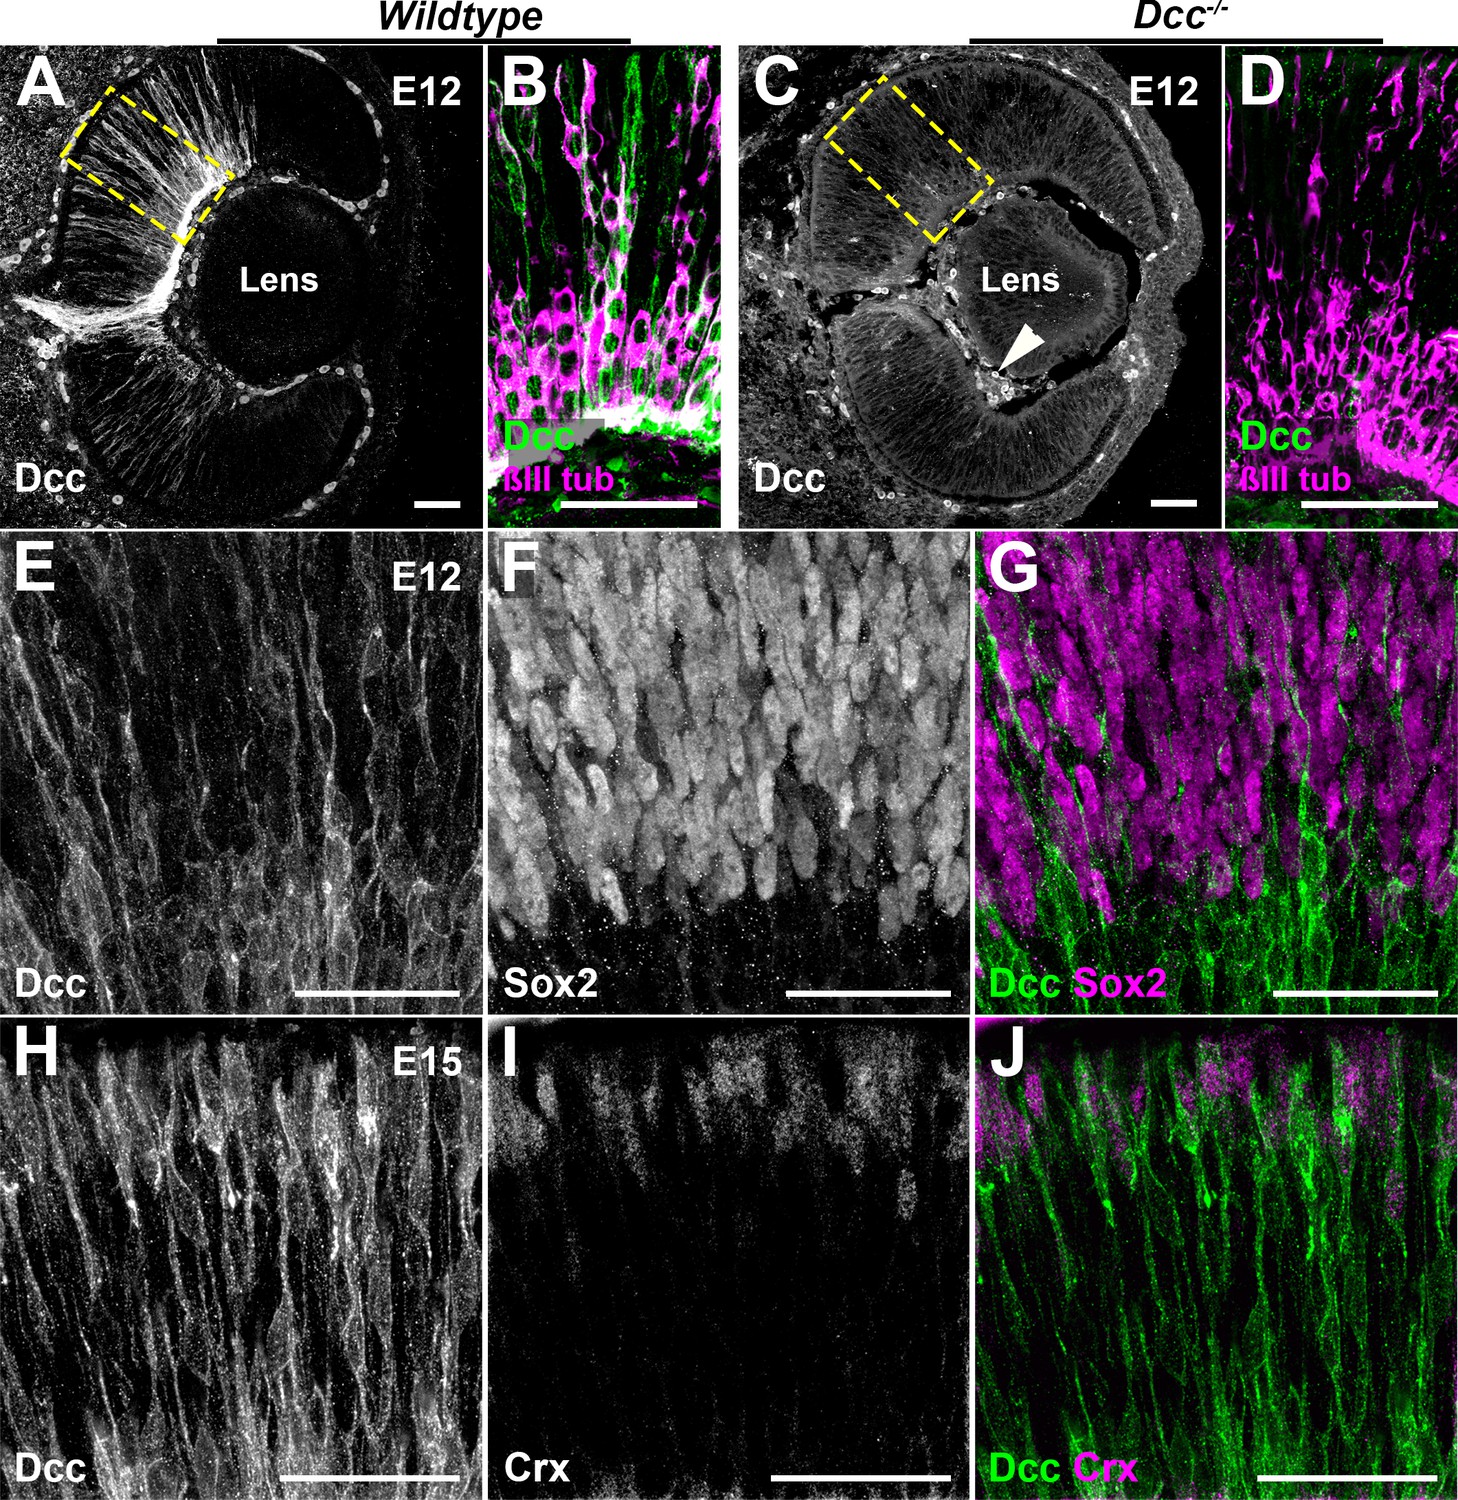
Early Dcc expression is restricted to post-mitotic cells of the retina.
(A–D) Cryosection of E12 Wildtype and Dcc-/- mouse eyes immunolabeled for Dcc (white or green) and βIII-tubulin (magenta). Non-specific Dcc staining is seen in mesenchymal cells (arrowhead). (B,D) higher magnification images. (E–G) IHC of E12 Wildtype retina immunolabeled for Dcc (green) and the retinal progenitor cell marker, Sox2 (magenta). (H–J) IHC of E15 mouse retinas labeled for Dcc (green) and the post-mitotic photoreceptor cell marker, Cone-rod homeobox protein (Crx, magenta). (B,D) show high magnification images. Scale bars: A–J 50 μm.
Figure 2 with 1 supplement
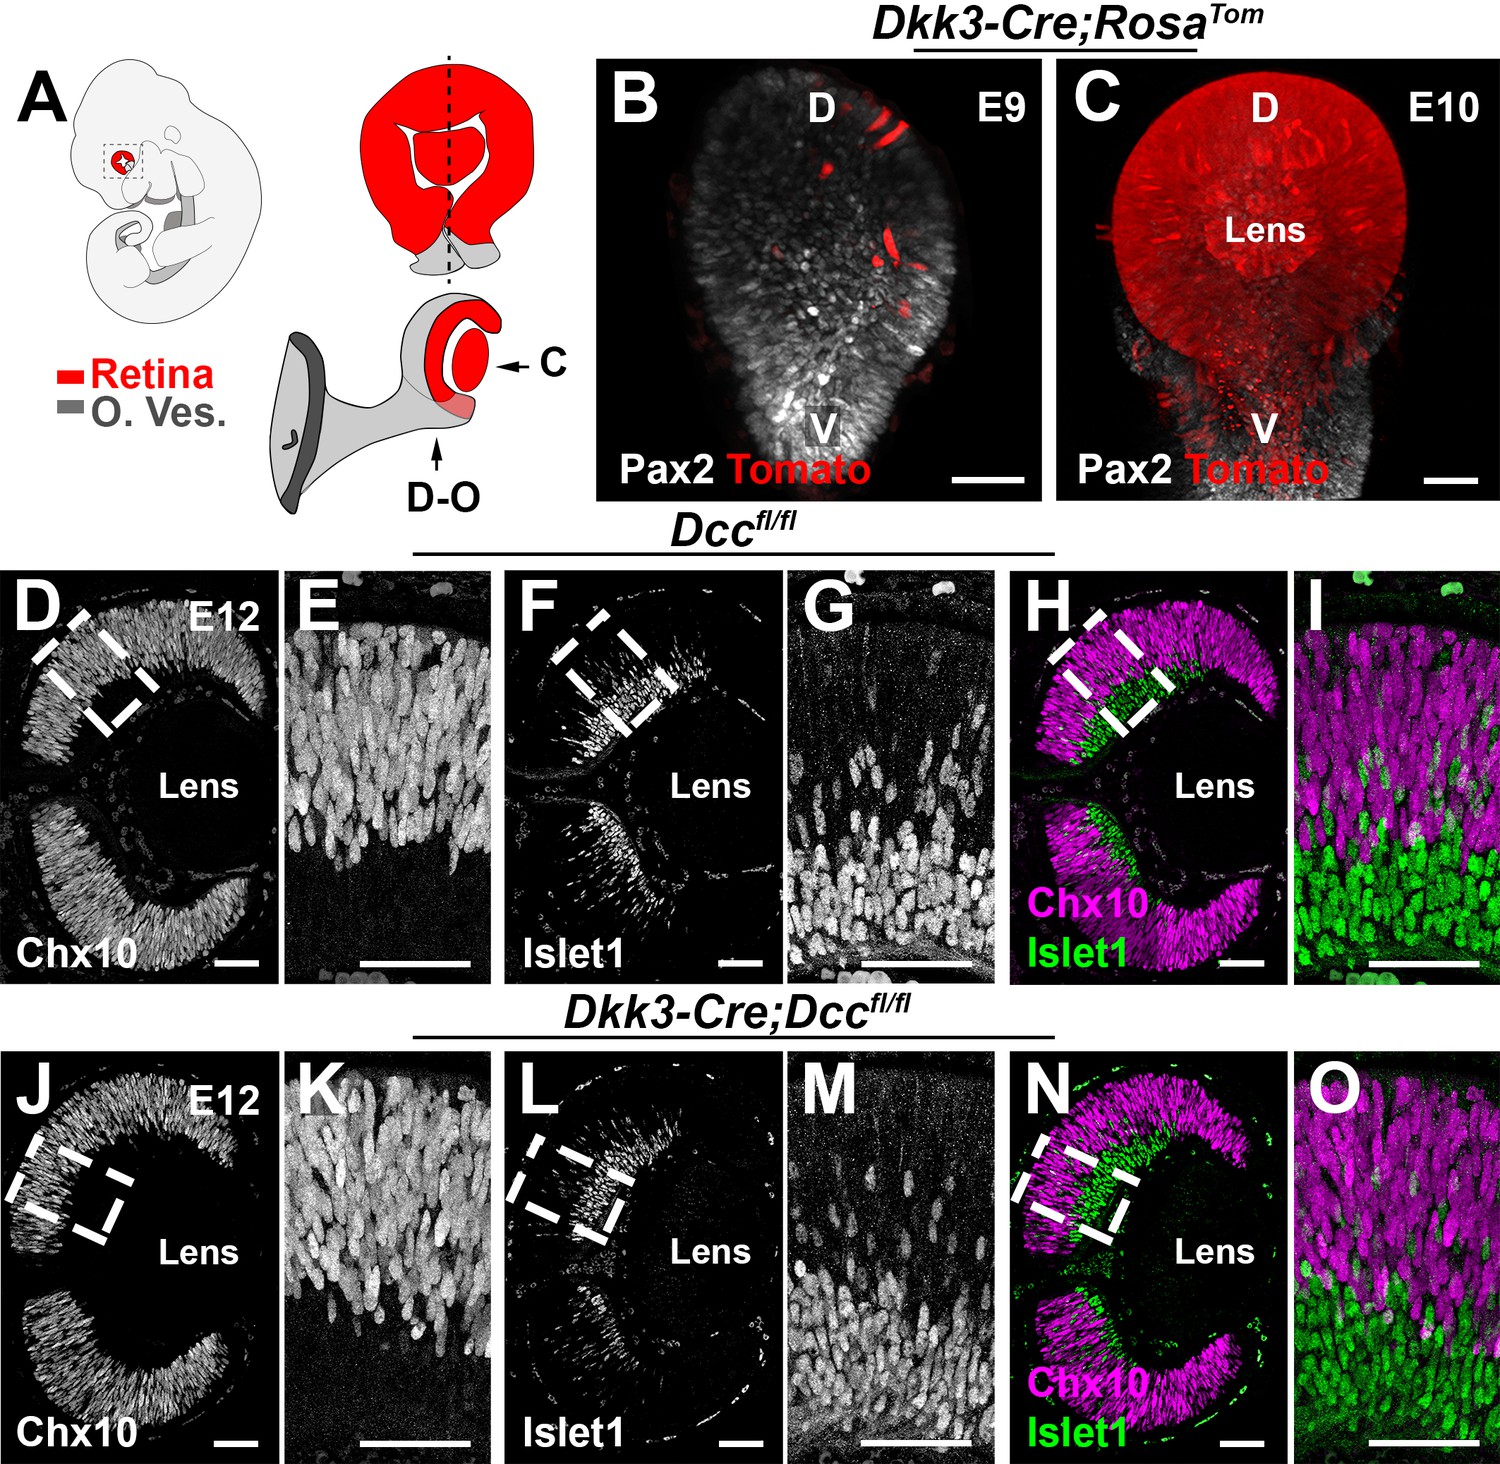
Retina-specific inactivation of Dcc.
(A) Schematic representation of an E10 embryo (upper left) showing the neural retina (red) and the optic vesicle (gray). (B,C) Lateral views of the eye from Dkk3:cre;RosaTom E9 and E10 embryos after whole-mount labeling for dsRed (Rosa tomato) and Pax2 (optic vesicle). (C) Represents the whole-mount lateral visualization, whereas (D–O) shows the orientation of the sagittal cryosections. (D–O) Cryosections of E12 Dccfl/fl and Dkk3:cre;Dccfl/fl embryos labeled for Chx10 (magenta) and Islet1 (green). Scale bars: (B,C) 30 μm, (D–O) 50 μm. D, dorsal; V, ventral; O. Ves, optic vesicle.
-
Figure 2—source data 1
Eye-specific loss of Dcc does not impact the proliferation of retinal progenitor cells.
- https://cdn.elifesciences.org/articles/51275/elife-51275-fig2-data1-v2.xlsx
Figure 2—figure supplement 1
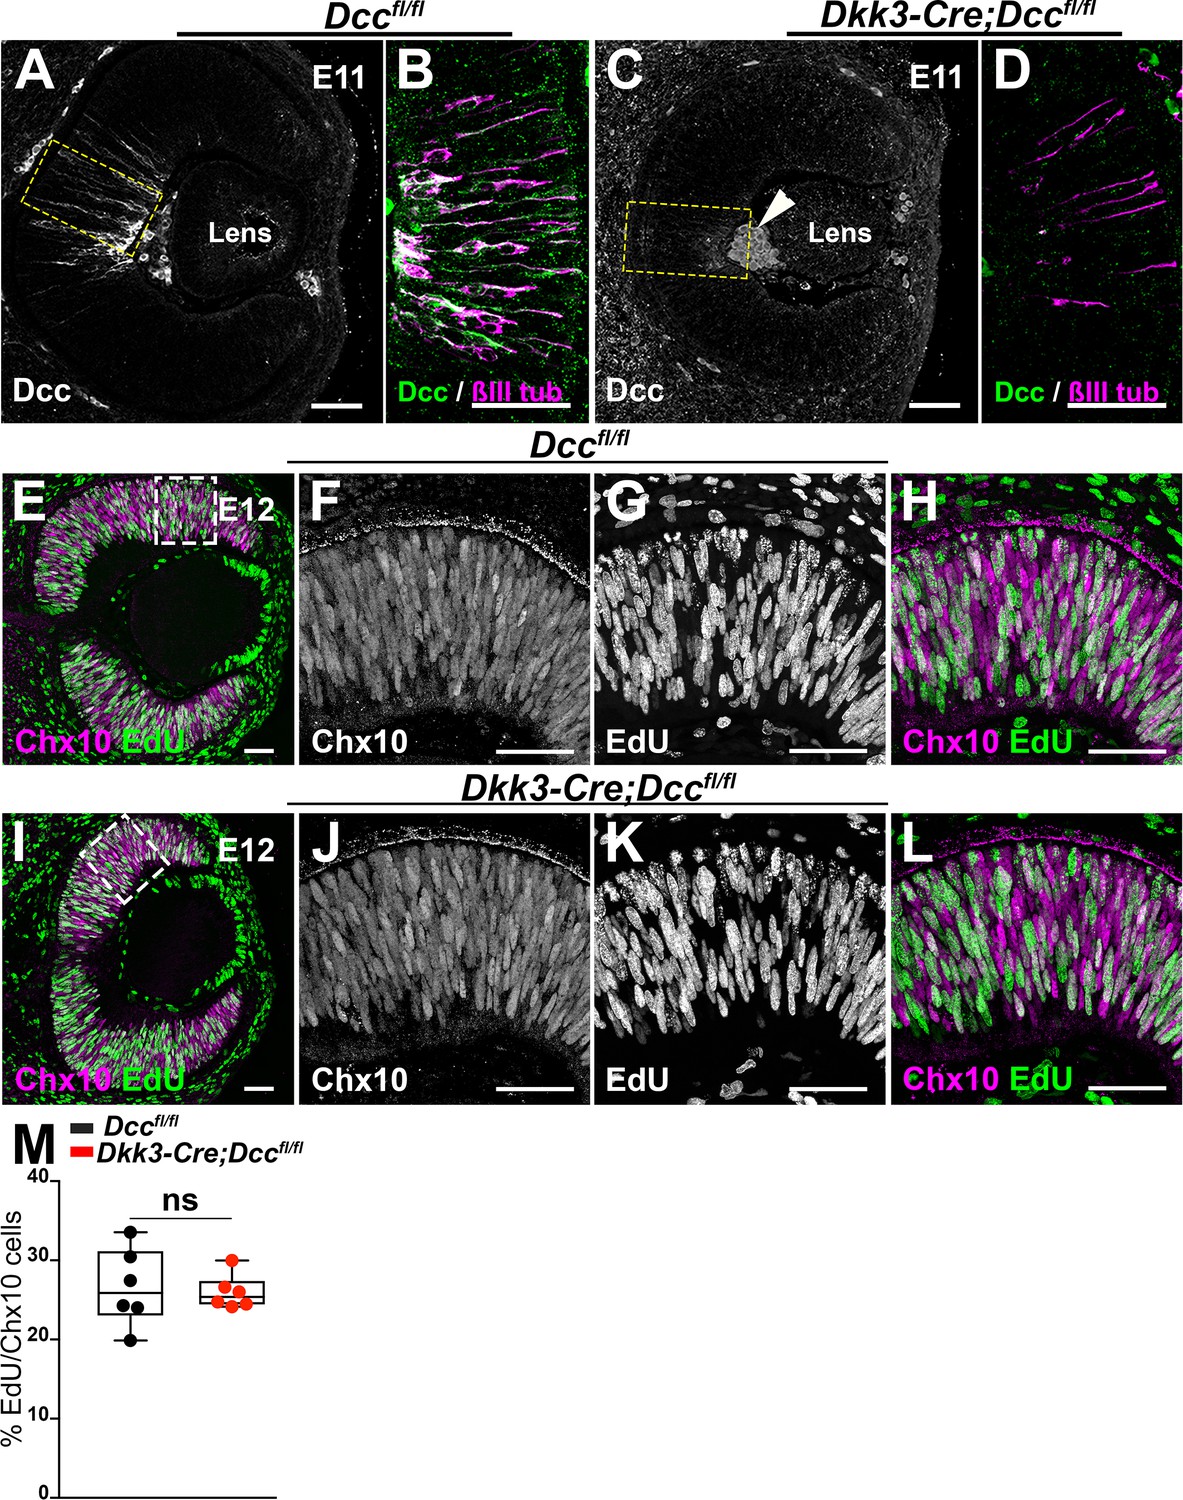
Dcc deletion does not impact early retinal proliferation.
(A–D) sagittal cryosections of Dccfl/fl and Dkk3:cre;Dccfl/fl E11 mouse embryo eyes immunolabeled for Dcc (white or green) and β-III tubulin (magenta). Non-specific binding of Dcc in mesenchymal cells is shown (arrowhead). (E–L) Sagittal cryosections of EdU-treated Dccfl/fl and Dkk3:cre;Dccfl/fl E12 retinas labeled for the progenitor cell marker Chx10 (magenta) and EdU (green). (M) Quantification of EdU and Chx10-positive cells represented as a box plot; whiskers show min to max values. A Mann-Whitney test was used. Results were considered as non-significant (ns) when p>0.05. Scale bars: (A–L) 50 μm.
Figure 3
EyeDISCO, a novel tissue clearing protocol for embryonic eye visualization.
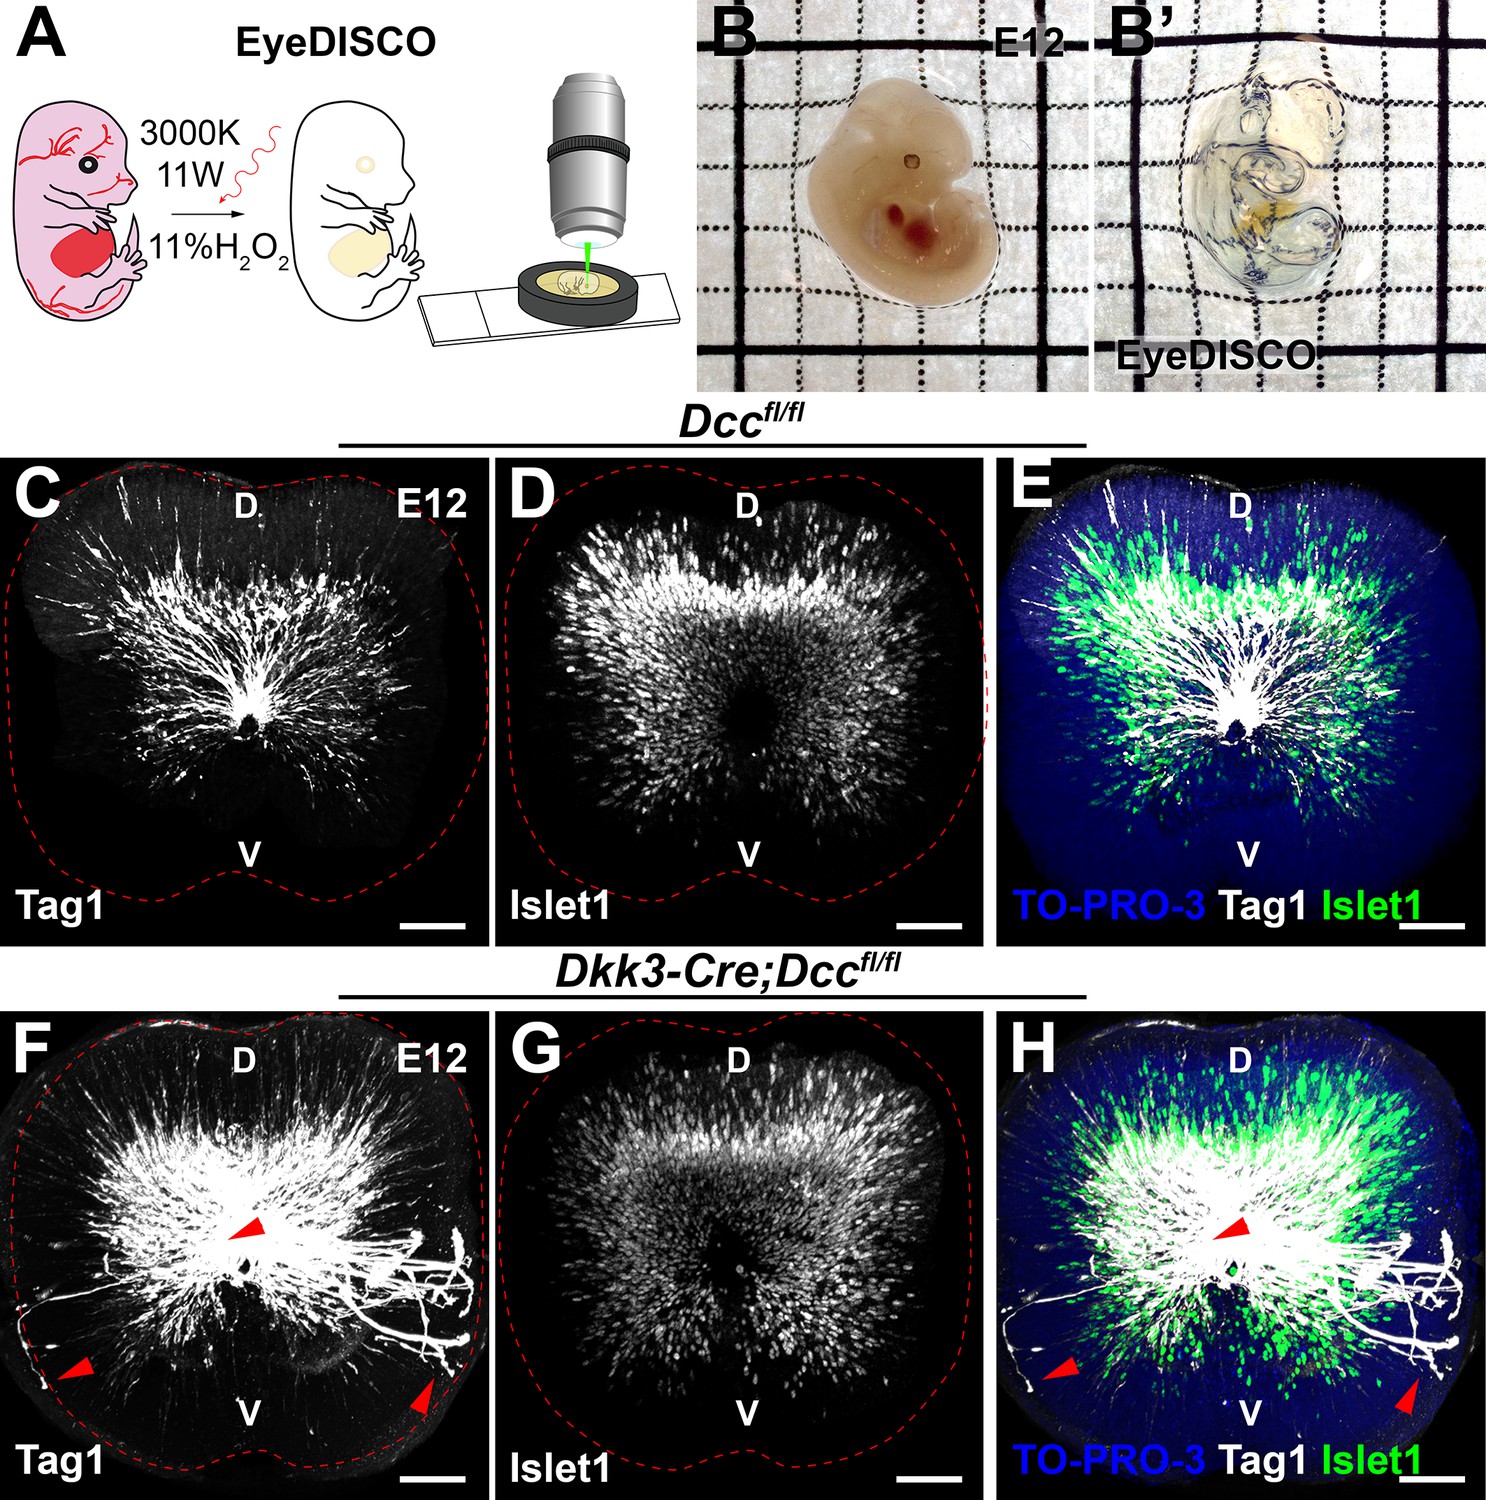
(A) Schematic representation of the EyeDISCO protocol. The embryo is dehydrated in methanol and incubated in an 11% H2O2 solution irradiated with a 3000 °K warm white light. The sample is then included in a homemade chamber for confocal microscopy and 3D rendering. (B,B’) Images of an E12 embryo before and after EyeDISCO clearing. (C–H) Lateral view of whole-mount E12 eyes immunolabeled for the RGC axon marker, Tag1 (white) and the RGC nuclear marker (Islet1) counterstained with the nuclear marker TO-PRO-3 (blue). Several axons misproject in the Dkk3:cre;Dccfl/fl mutants (red arrowheads) or are stalled at the optic disc. Scale bars: (C–H) 50 μm. D, dorsal ; V, ventral.
Figure 4 with 2 supplements
Early Dcc deletion leads to major intra-retinal axonal misprojections.
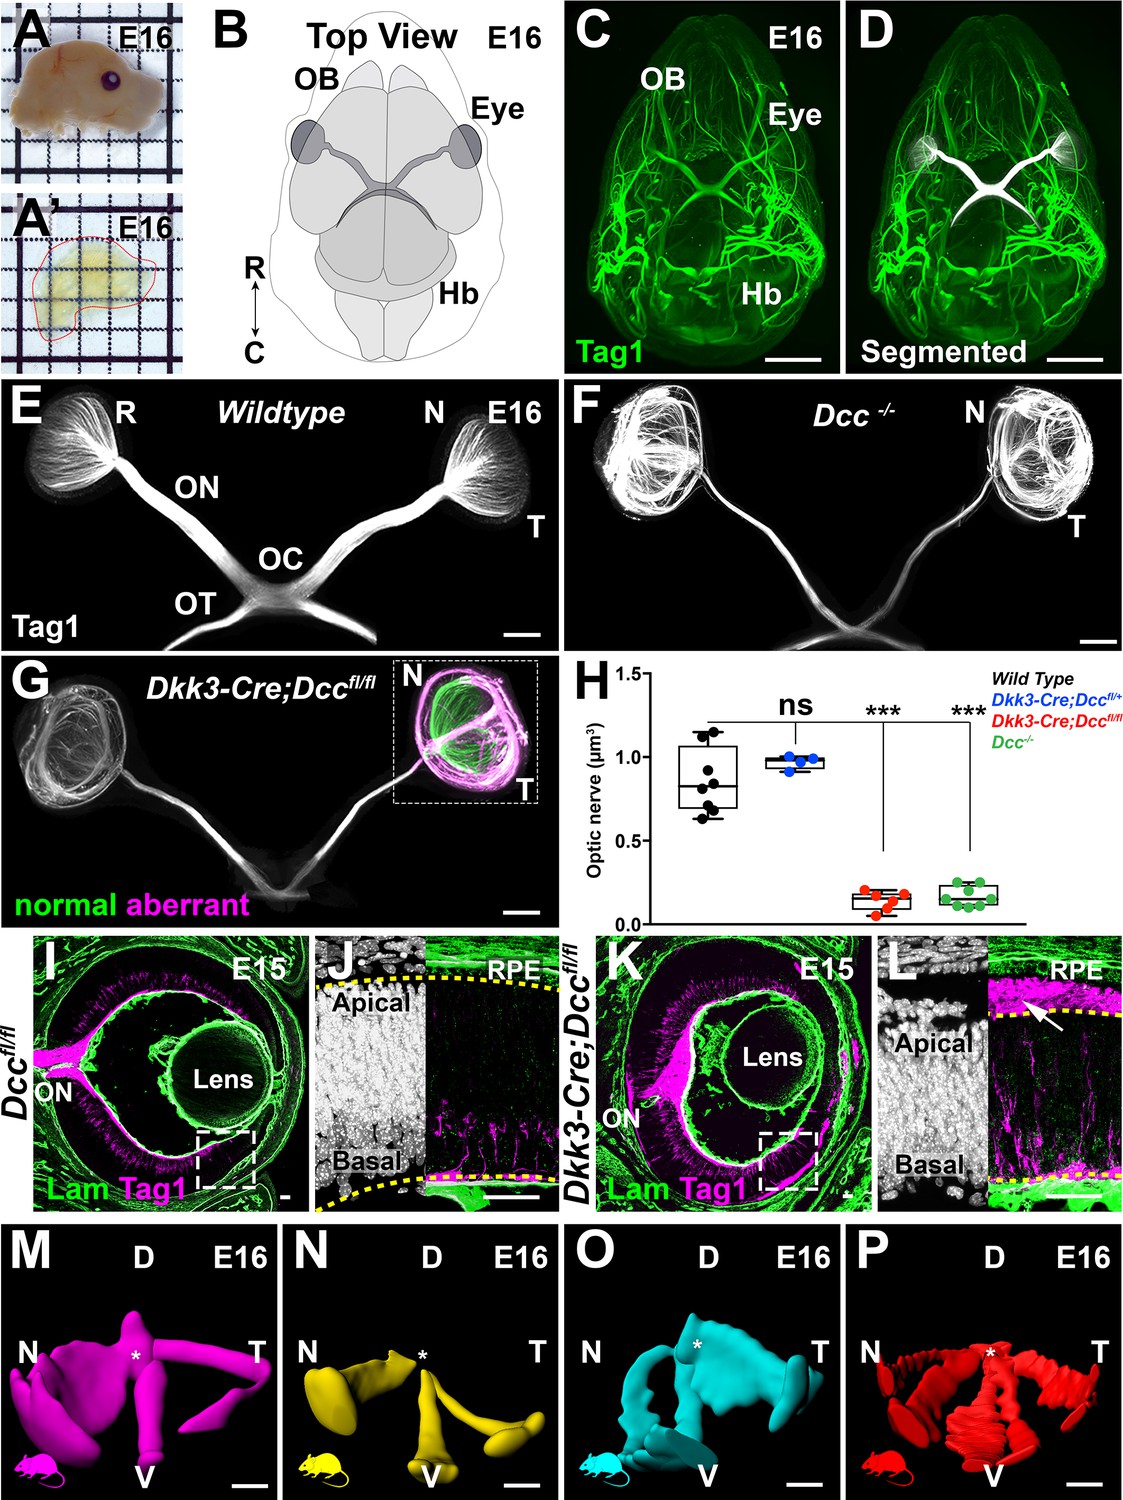
(A–A’) Illustrates the clearing efficiency of the EyeDISCO protocol of an E16 mouse head. (B) Schematic representation of a top view of an E16 head, OB: olfactory bulb, Hb: hindbrain, R: rostral, C: caudal. (C–G) IHC whole-mount of E16 heads labeled for Tag1 (green). (D) E16 embryo head labeled with Tag1 in (C) with the visual projections manually segmented (white). (E–G) Segmented visual projections in E16 Wildtype, Dcc-/-, and Dkk3:cre;Dccfl/fl embryos. R: retina, ON: optic nerve, OC: optic chiasm, OT: optic tract, N: nasal, T: temporal. (H) Quantification of optic nerve volumes (μm3) represented as a box plot, whiskers represent min to max values. Dcc-/- (0.165 ± 0.022 μm3; n = 8 nerves) and Dkk3:cre;Dccfl/fl embryos (0.140 ± 0.23 μm3; n = 6 nerves) displayed a significant reduction in optic nerve volume compared to Wildtype embryos (0.858 ± 0.07 μm3; n = 8 nerves) (p=0.0002 and p=0.0007 respectively, Mann-Whitney test). Heterozygous deletion of Dcc (Dkk3:cre;Dcclox/+) had no effect on optic nerve volume (0.97 ± 0.02 μm3; p=0.2828; n = 4 nerves, Mann-Whitney test). Results were considered non-significant (ns) when p>0.05. ***=p < 0.001. (I,J,K,L) Cryosections of E15 Dccfl/fl and Dkk3:cre;Dccfl/fl eyes immunolabeled for Laminin (green) and Tag1 (magenta). (I) In controls, RGC projections (magenta) grow circumferentially and enter the optic nerve. (K) In Dkk3:cre;Dccfl/fl embryos, RGC projections perforate the retina and stall at the optic disc, some projections manage to exit into the ON. (J,L) High magnification images. (L) In Dkk3:cre;Dccfl/fl embryos, RGC projections extend apically and invade the sub-retinal space (arrow), separating the RPE and the apical retina (future photoreceptor outer segments). (M–P) Individual masks of aberrantly projecting RGCs across different mutants. Asterisks show the optic nerve. D, Dorsal; V, Ventral; N, Nasal; T, Temporal. Scale bars: (C,D) 1000 μm, (E–G) 300 μm, (I–P) 150 μm.
-
Figure 4—source data 1
Retina-specific deletion of Dcc leads to a significant reduction in optic nerve volume.
- https://cdn.elifesciences.org/articles/51275/elife-51275-fig4-data1-v2.xlsx
-
Figure 4—source data 2
Early Netrin-1 deletion in the retina leads to a significant reduction in optic nerve volume.
- https://cdn.elifesciences.org/articles/51275/elife-51275-fig4-data2-v2.xlsx
Figure 4—figure supplement 1
Eye-specific deletion of Dcc and Netrin-1 leads to major retinal defects.
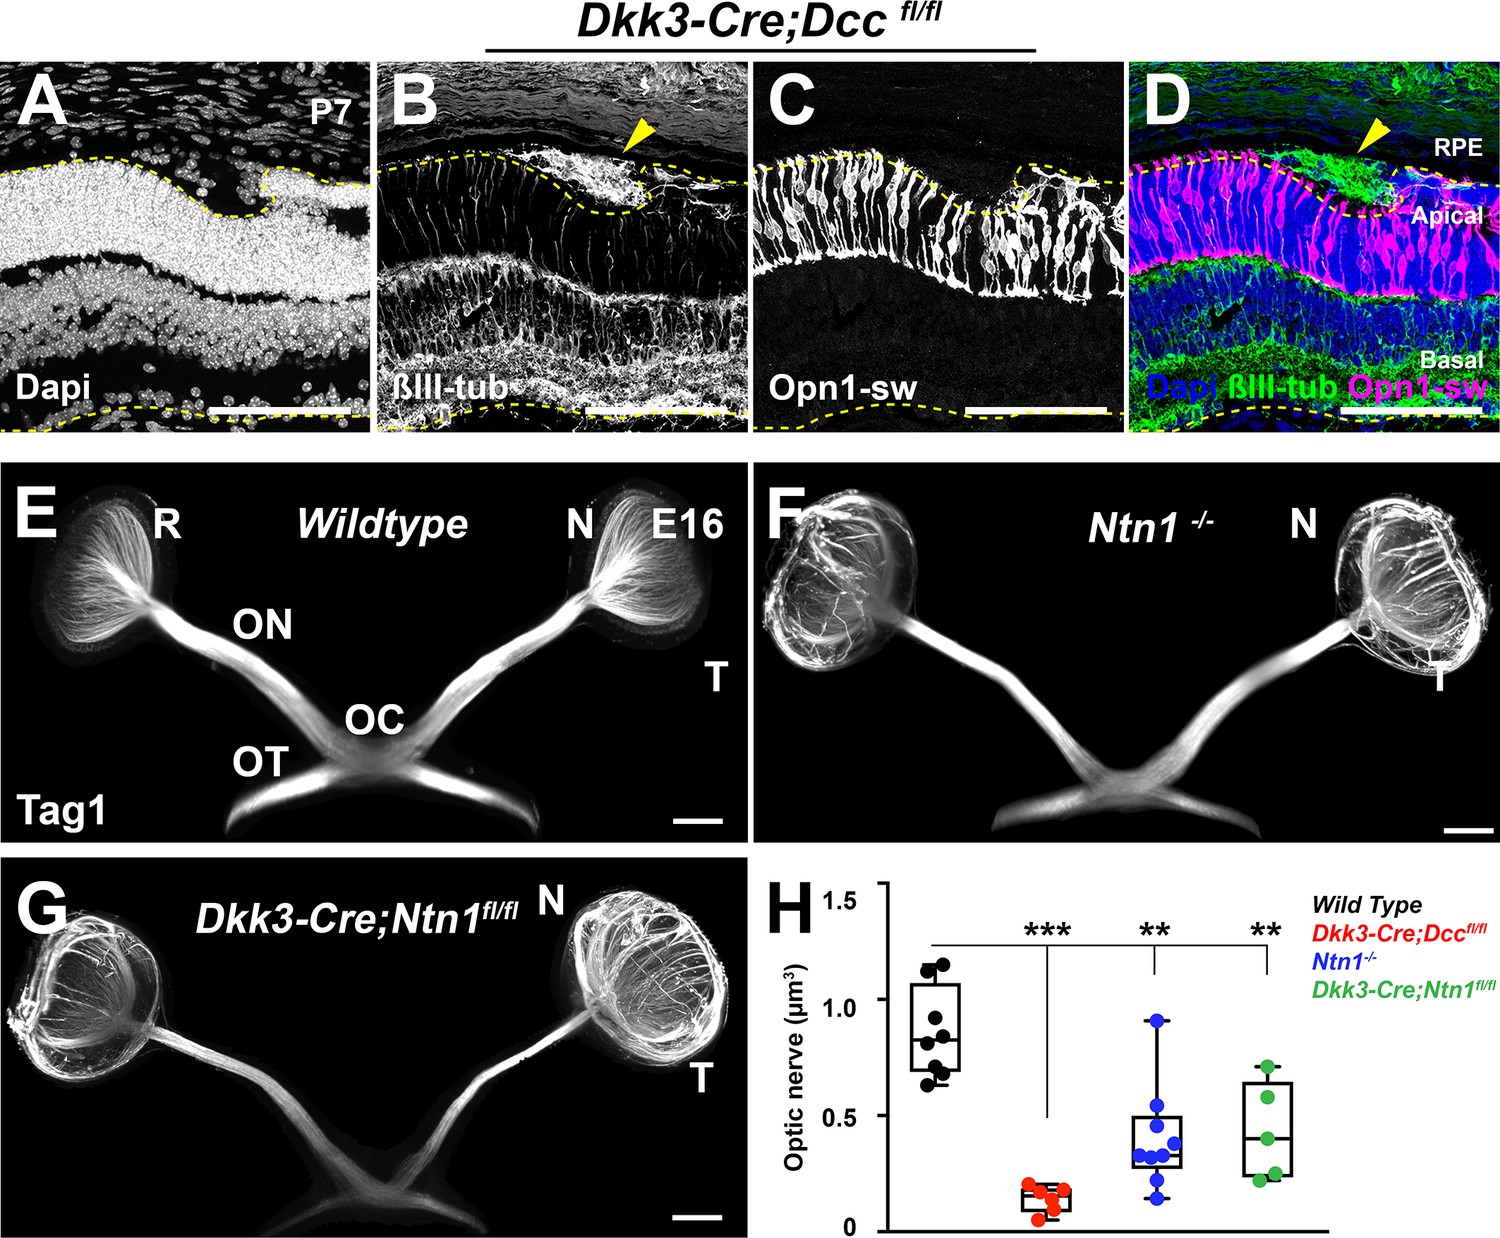
(A–D) Cryosections of P7 Dkk3;cre;Dccfl/fl mice stained for ßIII tubulin (ßIII-tub, green) and short-wavelength Opsin (Opn1sw, magenta). Aberrant RGC projections appear in the subretinal space (yellow arrow). (E–G) Whole-mount labeling of E16 Wildtype, Ntn1-/-, and Dkk3:cre;Ntn1fl/fl embryonic heads. R: retina, ON: optic nerve, OC: optic chiasm, OT: optic tract, N: nasal, T: temporal. (H) Quantification of optic nerve volumes (μm3) represented as a box plot, whiskers represent min to max values. Ntn1-/- (0.403 ± 0.074 μm3; n = 9 nerves) and Dkk3:cre;Ntn1fl/fl embryos (0.432 ± 0.094 μm3; n = 5 nerves) displayed a significant reduction in optic nerve volume compared to Wildtype embryos (0.858 ± 0.07 μm3; n = 8 nerves) (p=0.0016 and p=0.0078 respectively, Mann-Whitney test). Results were considered non-significant (ns) when p>0.05. **=p < 0.01. Scale bars: (A–D) 50 μm.
Figure 4—video 1
Embryonic RGC projections are perturbed in Dcc cKO mice.
A 3D rendering of a E16 Dccfl/fl and Dkk3:cre;Dccfl/fl head following whole-mount immunolabeling for the neuronal marker Tag1 (Green). Manual segmentation was used to isolate the retinal projections (white) (retina, optic nerve, optic chiasm, and optic tract). Aberrantly projecting RGCs were manually segmented (magenta).
Figure 5 with 1 supplement
Retinal projections in the brain are altered in eye-specific Dcc mutants.
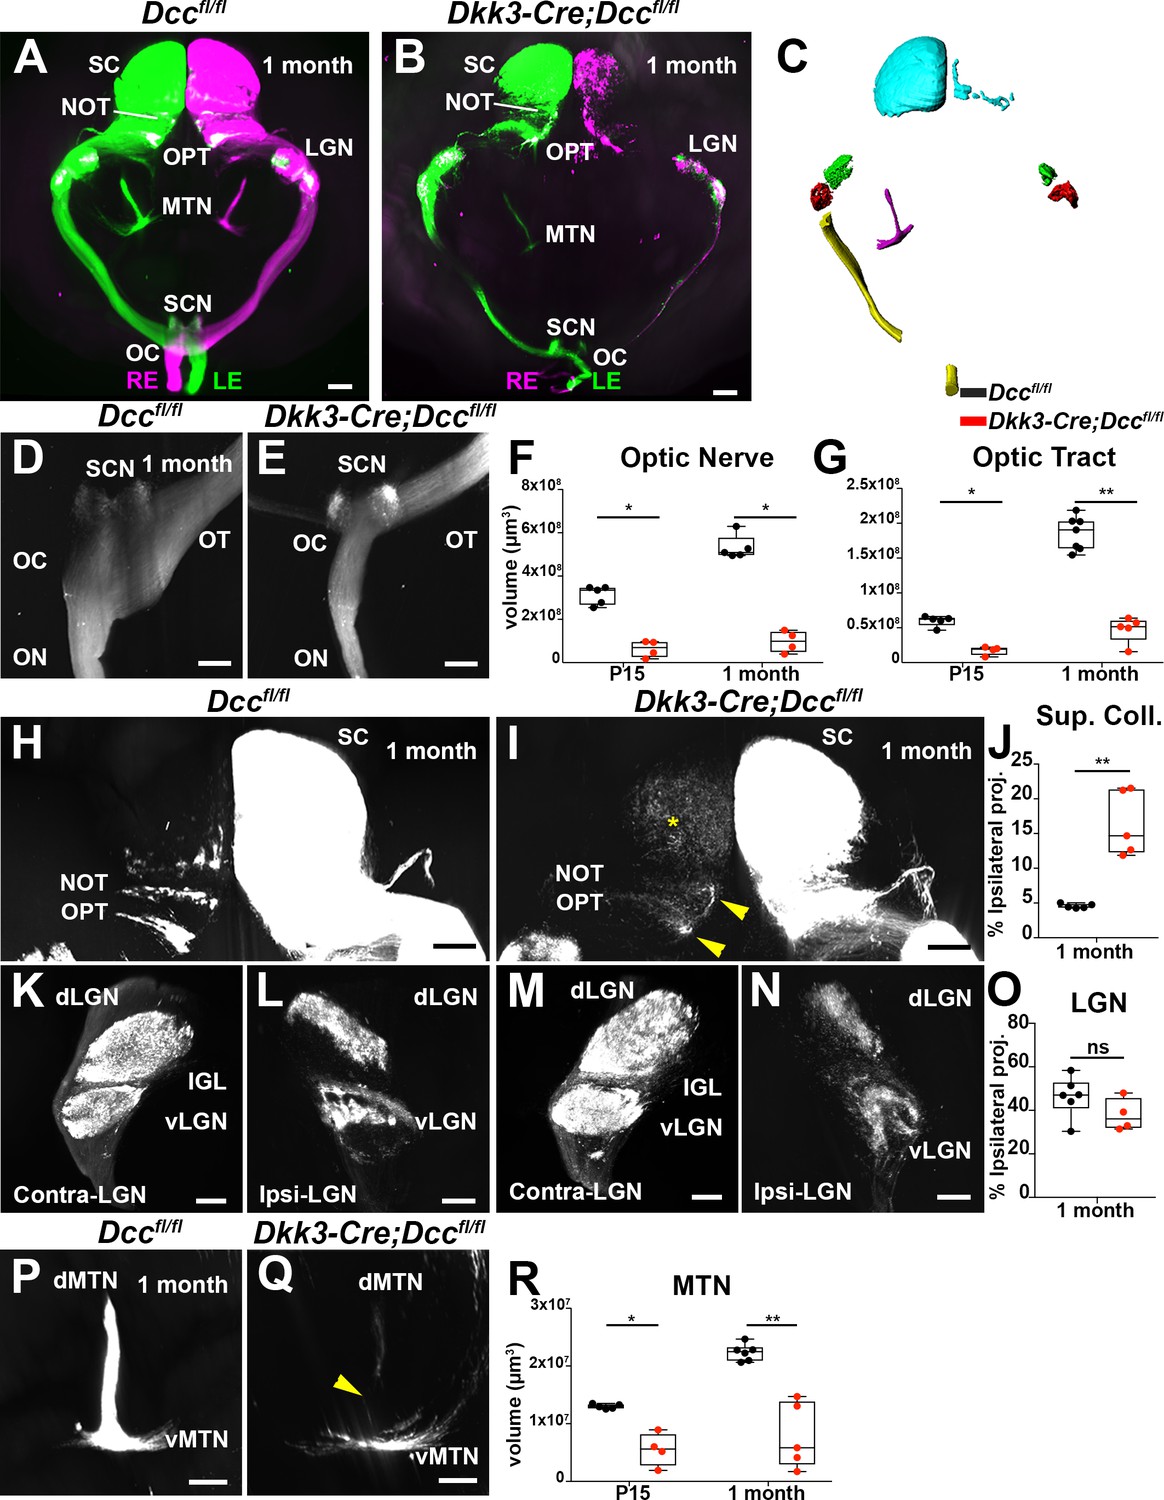
(A,B) Frontal view of 3D-rendered brains using after anterograde axon tracing of visual projections with AlexaFluor-555 and/or AlexaFluor-647-conjugated cholera toxin β subunit (CTB). RE: right eye, LE: left eye, OC: optic chiasm, SCN: supra chiasmatic nucleus, MTN: medial terminal nucleus, LGN: lateral geniculate nucleus, NOT: nucleus of the optic tract, OPT: olivary pretectal nucleus, SC: superior colliculus. (A) Control brain, and (B) a Dkk3:cre;Dccfl/fl brain. (C) Surfaces of manual and automatic segmentation of visual projections using Imaris software in a control brain. Superior colliculus (cyan), dorsal lateral geniculate nucleus (green), ventral lateral geniculate nucleus (red), medial terminal nucleus (magenta), optic nerve and optic tract (yellow). (D,E) Top view of the optic nerve, optic chiasm, and optic tract. (F) Quantification of optic nerve volumes at P15 (6.36 × 10⁶ ± 1.92 × 106 μm3; n = 4; compared to 3.12 × 10⁷ ± 1.92 × 106 μm3; n = 5; p=0.0159) and 1 month (9.67 × 10⁶ ± 2.48 × 106 μm3; n = 4; compared to 5.32 × 10⁷ ± 2.51 × 106 μm3; n = 5; p=0.0159). A Mann-Whitney test was used to measure the significance. (G) Quantification of optic tract volumes (μm3) at P15 (1.73 × 10⁷ ± 3.13 × 106 μm3; n = 4; compared to 5.97 × 10⁷ ± 3.42 × 106 μm3; n = 5; p=0,0159) and 1 month (4.76 × 10⁷ ± 8.37 × 106 μm3; n = 5; compared to 1.86 × 10⁸ ± 9.11 × 106 μm3; n = 7; p=0.0025). A Mann-Whitney test was used to measure the significance. (H,I) Top view of the superior colliculus. Dcc cKO mice display a defasciculated NOT and OPT (yellow arrowhead), as well as an aberrant segregation of ipsilateral RGC projections (yellow asterisk). (J) Percentage of ipsilateral projections normalized to the contralateral projections (volume, μm3) of the superior colliculus. At 1 month, ipsilateral superior colliculus volume represented 4.565 ± 0.1424% (n = 5) in Dccfl/fl mice compared to 16.39 ± 2.091% in Dkk3:cre;Dccfl/fl mice (p=0.0079, n = 5). A Mann-Whitney test was used to measure the significance. (K–N) Frontal view of the contra- and ipsi-lateral geniculate nucleus. dLGN: dorsal lateral geniculate nucleus, vLGN: ventral lateral geniculate nucleus, IGL: inner geniculate leaflet. (F,K) Ipsilateral lateral geniculate nucleus. (O) Percentage of ipsilateral projections normalized to the contralateral projections (volume, μm3) of the lateral geniculate nucleus were not altered in Dcc cKO mice (37.89 ± 3.751%; n = 4) compared to control littermates (46.36 ± 3.795%; n = 6; p=0.352) A Mann-Whitney test was used to measure the significance. (P,Q) Frontal view of the medial terminal nucleus, dMTN: dorsal medial terminal nucleus, vMTN: ventral medial terminal nucleus. Dcc cKO mice show disturbed projections between the dMTN and the vMTN (yellow arrowhead). (R) Quantification of medial terminal nucleus volumes (ventral and dorsal, μm3). At P15, Dcc cKO mice display a reduction (5.51 × 10⁶ ± 1.44 × 106 μm3; n = 4) compared to control (1.23 × 10⁷ ± 1.79 × 105 μm3; n = 5; p=0.0159). At 1 month, this loss was maintained (7.89 × 10⁶ ± 2.55 × 106 μm3; n = 5; compared to 2.24 × 10⁷ ± 5.95 × 105 μm3; n = 6; p=0.0043). A Mann-Whitney test was used to measure the significance. Whiskers represent min to max values. *=p < 0.05, **=p < 0.01. Scale bars: (A,B) 1000 μm, (H,I) 500 μm, (D,E,K,L,M,N, P,Q) 300 μm.
-
Figure 5—source data 1
Dcc cKO mice show a significant reduction of RGC projection volumes in multiple brain visual nuclei.
- https://cdn.elifesciences.org/articles/51275/elife-51275-fig5-data1-v2.xlsx
Figure 5—video 1
Adult RGC projections display major defects in eye-specific Dcc deletion.
3D rendering of 1 month-old Dccfl/fl and Dkk3:cre;Dccfl/fl mouse brains following visual projection tracing with AlexaFluor647-conjugated CTB. The visual projections can be seen (ON: optic nerve, OC: optic chiasm, and OT: optic tract) including their arborization in the nuclei of the primary (LGN: lateral geniculate nucleus, SC: superior colliculus) and accessory visual systems (SCN: suprachiasmatic nucleus, MTN: medial terminal nucleus, OPT: the olivary pretectal nucleus, NOT: nucleus of the optic tract).
Figure 6 with 2 supplements

Dcc signaling is required for RGC projection targeting.
(A–M) Whole-brain 3D rendering of RGC projections traced using AlexaFluor555-CTB or AlexaFluor647-CTB. (A,B) Top view of the optic nerve, optic chiasm, and optic tract of 1 month-old Dcckanga/+ and Dcckanga/- mice. OC, optic chiasm; SCN, suprachiasmatic nucleus; OT, optic tract. (C) Quantification of optic nerve volume (μm3) in Dcckangakanga/- mice (1.67 × 10⁷ ± 1.97 × 106 μm3; n = 9) were significantly reduced compared to Dcckanga/+ mice (5.89 × 10⁷ ± 3.98 × 106 μm3; n = 5; p=0.0010, Mann-Whitney test). (D) Optic tract volume (μm3) of Dcckangakanga/- mice were also significantly reduced (0.624 × 10⁸ ± 7.09 × 106 μm3; n = 9) compared to Dcckanga/+ mice (1.50 × 10⁸ ± 1.99 × 106 μm3; n = 5; p=0.0020, Mann-Whitney test). (E, F) Top view of the superior colliculus. NOT, nucleus of the optic tract; OPT, olivary pretectal nucleus; SC, superior colliculus. (G,H,I,J) Frontal view of the contra-lateral LGN. dLGN, dorsal lateral geniculate nucleus; vLGN, ventral lateral geniculate nucleus; IGL, inner geniculate leaflet. (K,L) Frontal view of the MTN. dMTN, dorsal medial terminal nucleus; vMTN, ventral medial terminal nucleus. (M) Quantification of MTN volume (μm3) of Dcckangakanga/- mice (0.788 × 10⁷ ± 1.43 × 106 μm3; n = 9) compared to Dcckanga/+ littermate controls (1.66 × 10⁷ ± 2.09 × 106 μm3; n = 5; p=0.0190, Mann-Whitney test). Results were considered non-significant (ns) if p>0.05. *=p < 0.05; **=p < 0.01; ***=p < 0.001. Scale bars: (A,B) 150 μm (E,F) 300 μm, (G,H,I,J, K, L) 200 μm.
-
Figure 6—source data 1
Dcc Kanga mice display a major reduction of RGC projections in multiple brain visual nuclei.
- https://cdn.elifesciences.org/articles/51275/elife-51275-fig6-data1-v2.xlsx
-
Figure 6—source data 2
Dcc kanga mice show a similar reduction in visual nuclei volumes compared to Dcc cKO mice.
- https://cdn.elifesciences.org/articles/51275/elife-51275-fig6-data2-v2.xlsx
Figure 6—figure supplement 1

The reduction in retinal projections observed in Dcc cKO mice is phenocopied in Dcckanga mutant mice.
(A–C) Comparison between Dkk3:cre;Dccfl/fl and DccKangaKanga/- mice. (A) Optic nerve volume (μm3). (B) Optic tract volume (μm3). (C) MTN volume (μm3). A Mann-Whitney test was used. Results were considered non-significant (ns) if p>0.05. (D,E) Automatic segmentation of MTN from Dccfl/fl (n = 5) and DccKangaKanga/- mice using Imaris software (n = 5).
Figure 6—video 1
Dcc signaling is required for RGC projections to the MTN.
Whole brain 3D rendering of a 1-month-old Dcckanga/+ and mouse Dcckanga/- mutant following pan-RGC tracing using AlexaFluor647-conjugated CTB. The visual projections can be seen (ON: optic nerve, OC: optic chiasm, and OT: optic tract) including their arborization in the nuclei of the primary (LGN: lateral geniculate nucleus, SC: superior colliculus) and accessory visual systems (SCN: suprachiasmatic nucleus, MTN: medial terminal nucleus, OPT: the olivary pretectal nucleus, NOT: nucleus of the optic tract).
Figure 7 with 3 supplements
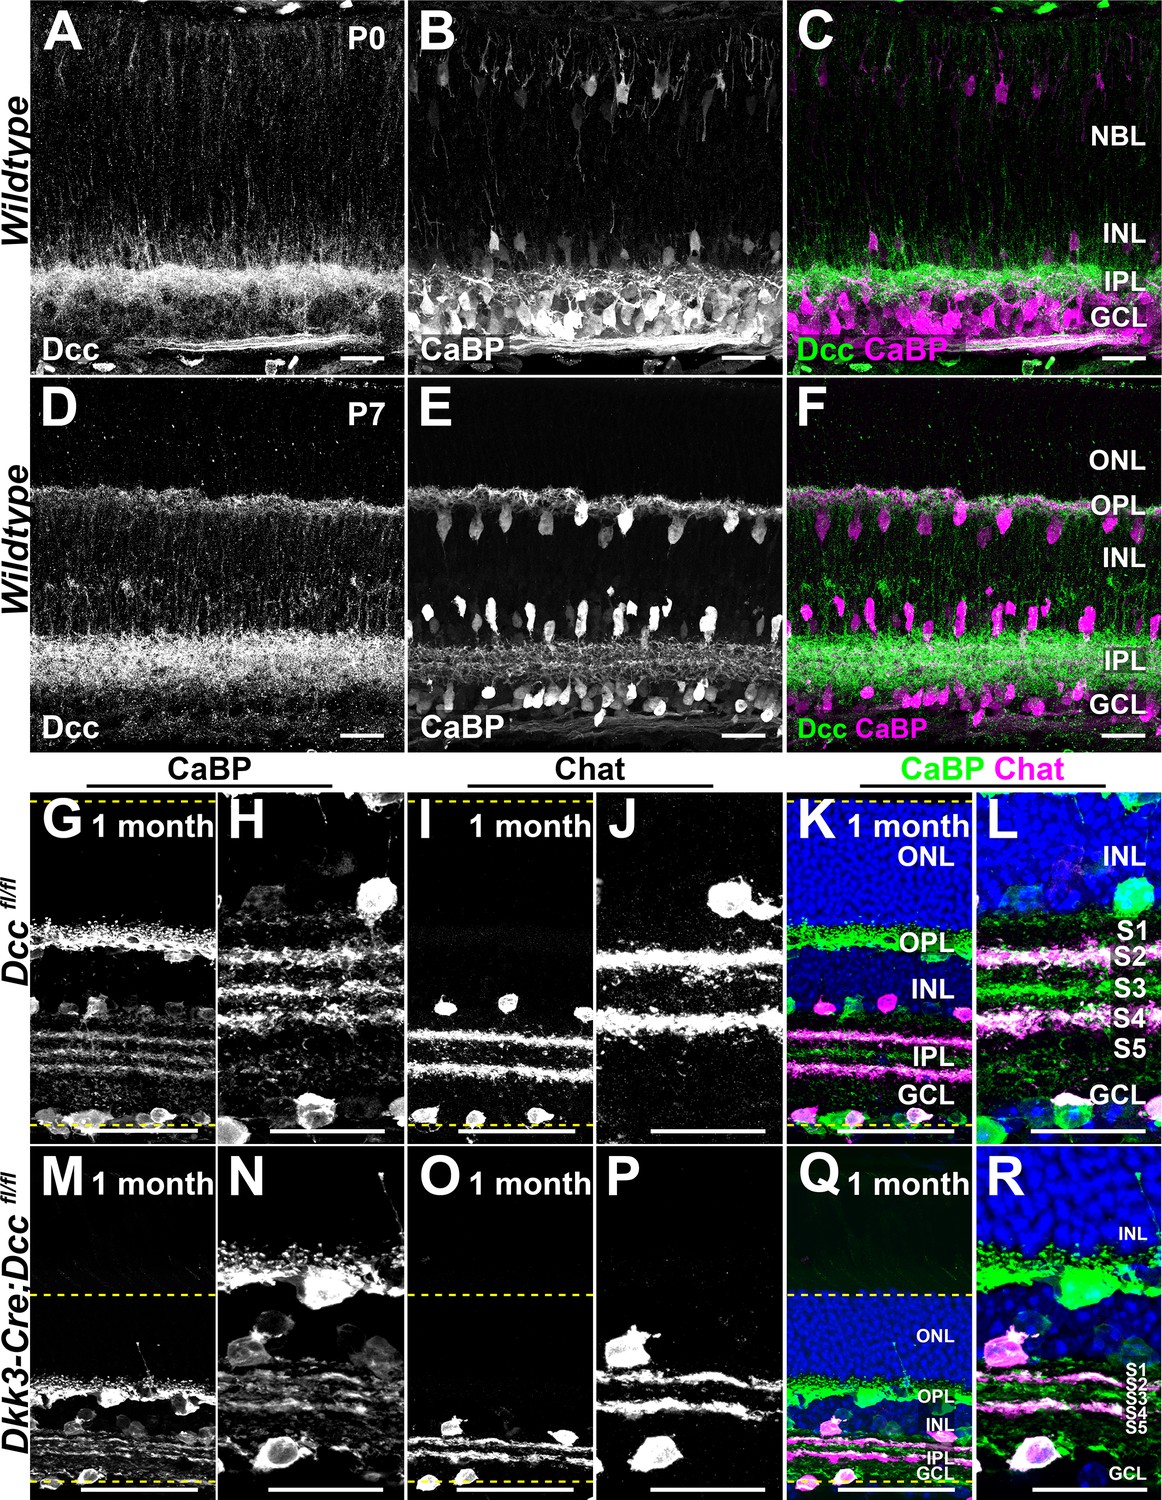
Eye-specific deletion of Dcc leads to reductions in retinal layers thickness.
(A–F) IHC of postnatal retinas labeled for Dcc (green) and the horizontal and amacrine cell marker, Calbindin (CaBP, magenta). (A–C) P0 retinas. (D–F) P7 retinas. (G–R) Cryosections of 1 month-old retinas of Dccfl/fl and Dkk3:cre;Dccfl/fl mice. (G,H,M,N) CaBP IHC (green) that labels amacrine cells that stratify in the IPL strata S2, S3, and S4. (I,J,O,P) IHC for choline O-acetyltransferase (Chat) that labels starburst amacrine cells which arborize in the IPL strata S2 and S4. (K,L,Q,R) show merge images. Yellow dashed lines delineate the retinal contours. Scale bars: (A–F,H,J,L,N, P,R) 25 μm; (G,I,K,M,O,Q) 50 μm. NBL, Neuroblastic Layer; ONL, Outer Nuclear Layer; OPL, Outer Plexiform Layer; INL, Inner Nuclear Layer; IPL, Inner Plexiform Layer; GCL, Ganglion Cell Layer.
-
Figure 7—source data 1
Early loss of Dcc leads to a significant and progressive degeneration of RGCs.
- https://cdn.elifesciences.org/articles/51275/elife-51275-fig7-data1-v2.xlsx
-
Figure 7—source data 2
Eye-specific loss of Dcc does not induce a loss of SACs but impacts retinal thickness.
- https://cdn.elifesciences.org/articles/51275/elife-51275-fig7-data2-v2.xlsx
-
Figure 7—source data 3
RGC loss is dependent on Dcc signaling.
- https://cdn.elifesciences.org/articles/51275/elife-51275-fig7-data3-v2.xlsx
Figure 7—figure supplement 1
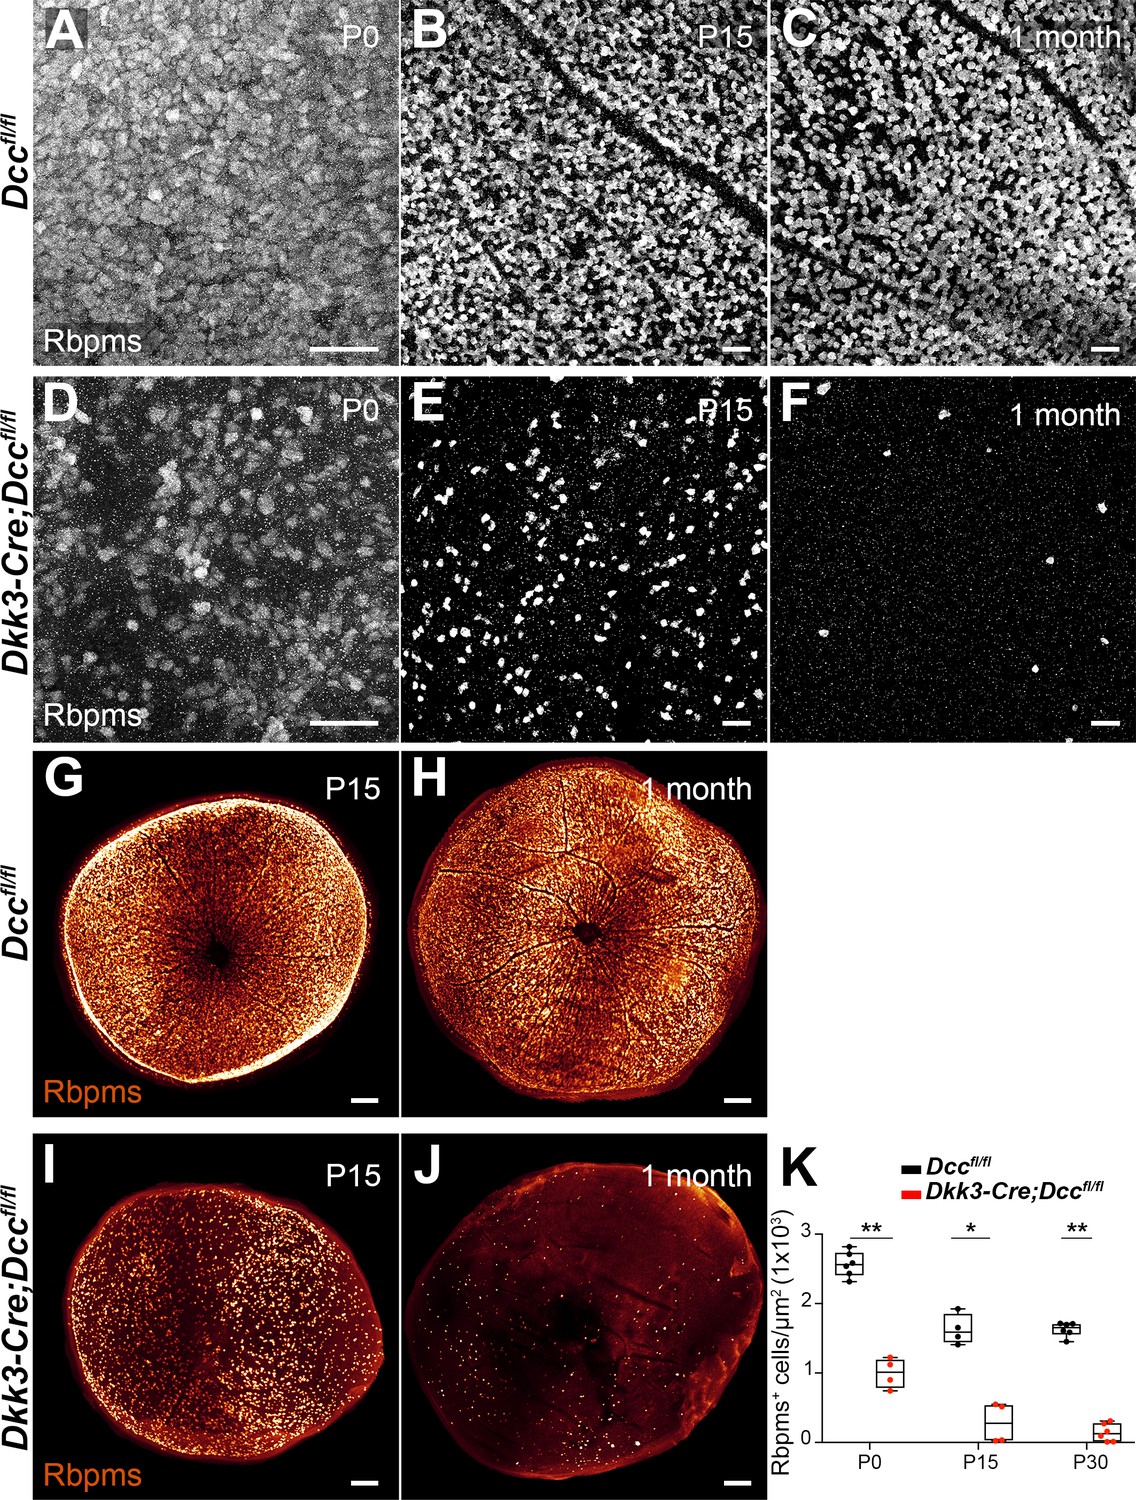
Eye-specific Dcc deletion leads to a dramatic reduction of RGC number.
(A–F) Flat-mounted retinas of Dccfl/fl and Dkk3:cre;Dccfl/fl mice immunolabeled for the pan-RGC marker Rbpms. (A,D) P0 (B,E) P15 (C,F) 1 month flat-mounted retinas. (G–J) Whole-mount eyes of Dccfl/fl and Dkk3:cre;Dccfl/fl mice treated with EyeDISCO and immunolabeled for Rbpms, (G,I) at P15 and (H,J) 1 month. (K) Quantification of Rbpms positive cell per μm2 represented as a box plot; whiskers display min to max values. A Mann-Whitney test was carried out. ****=p < 0.0001. Scale bars: (A–F) 50 μm, (G–J) 200 μm.
Figure 7—figure supplement 2
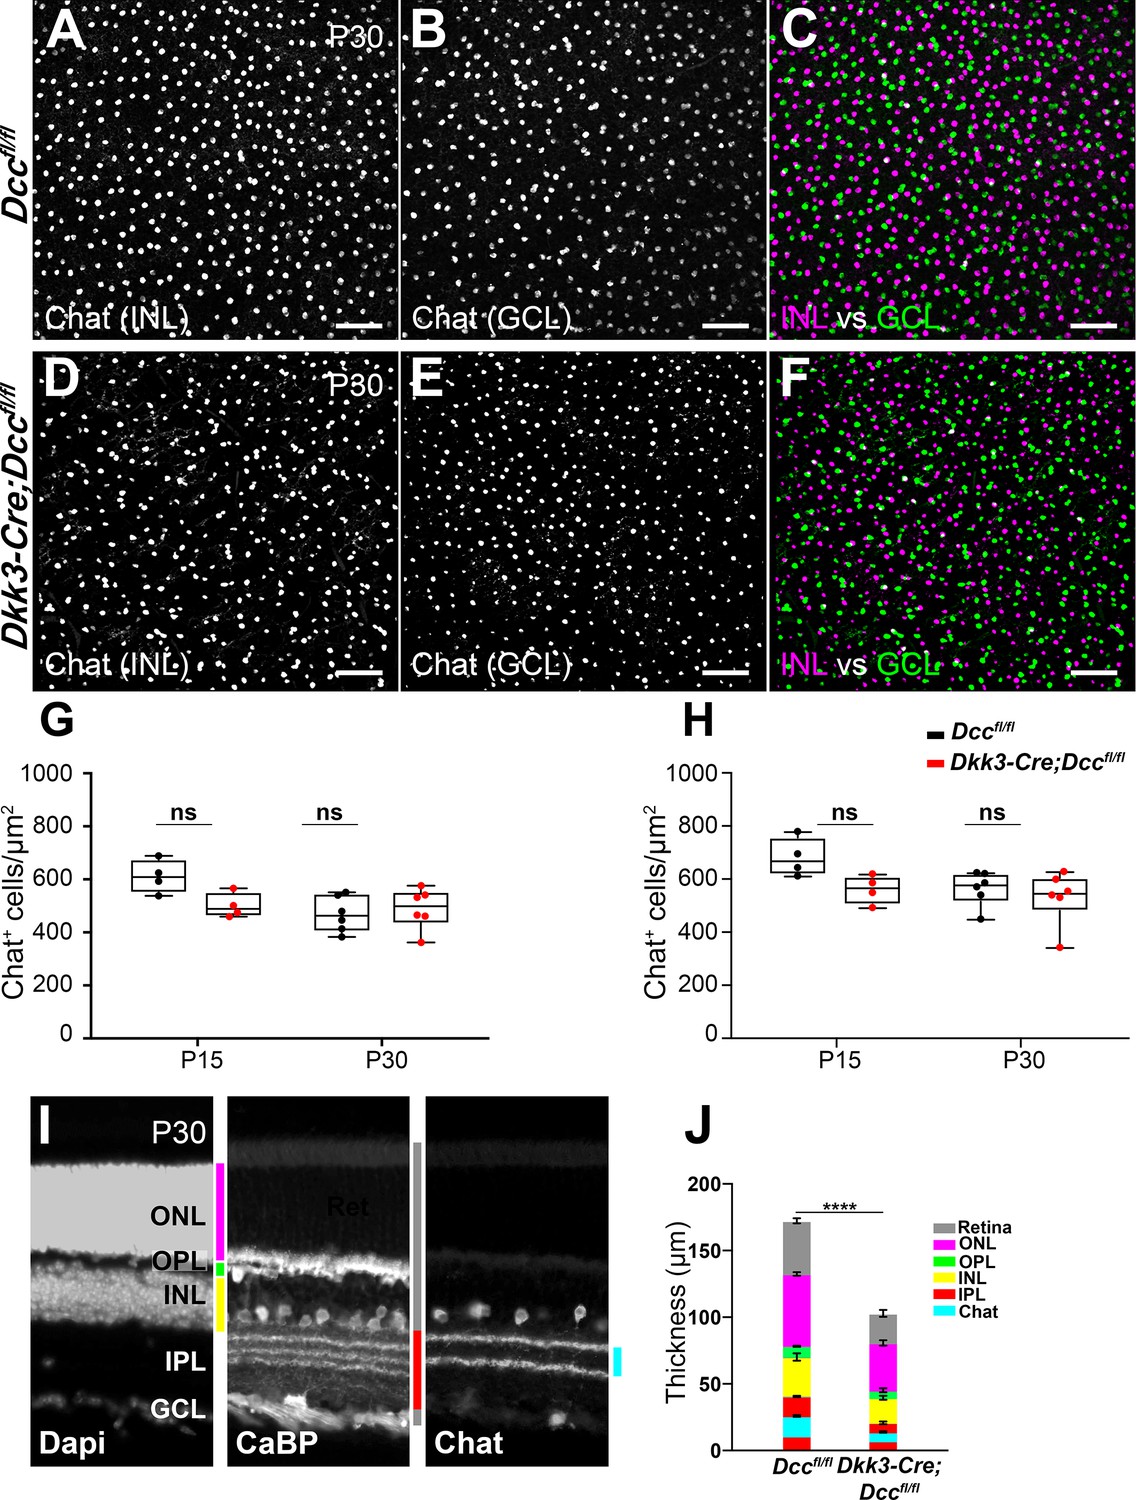
Dcc deletion does not affect Chat+ cell number.
(A–F) 1 month-old flat-mounted retinas of Dccfl/fl and Dkk3:cre;Dccfl/fl mice immunolabeled for choline O-acetyltransferase (Chat). (A,D) Chat+ cells in the inner nuclear layer (INL). (B,E) Chat+ cells in the ganglion cell layer (GCL). (C,F) Chat+ cells in the INL (magenta) and GCL (green). (G,H) Quantification of Chat+ cells per μm2 in the GCL (G) and the INL (H) represented as a box plot; whiskers display min to max values. A Mann-Whitney test was carried out. Results were considered non-significant (ns) when p>0.05. (I,J) Retinal layer thickness. (I) Cryosection of 1month-old Dccfl/fl retina immunolabeled for the amacrine and horizontal cell marker Calbindin (CaBP) as well as the Staburst amacrine cell marker Chat. Retinas were counterstained with the nuclear marker, Hoechst. ONL, outer nuclear layer (Magenta band); OPL, outer plexiform layer (green band); INL, inner nuclear layer (yellow band); IPL, inner plexiform layer (red band); GCL, retinal ganglion cell layer. The grey band corresponds to the whole retina, and the cyan band to distance between the two Chat+ sublayers. (J) Quantification of retinal layers thickness (μm) as a bar graph. Results are presented as mean ± SEM. A Welch’s t test was used. ****=p < 0.0001. Scale bars: (A–F) 80 μm.
Figure 7—figure supplement 3
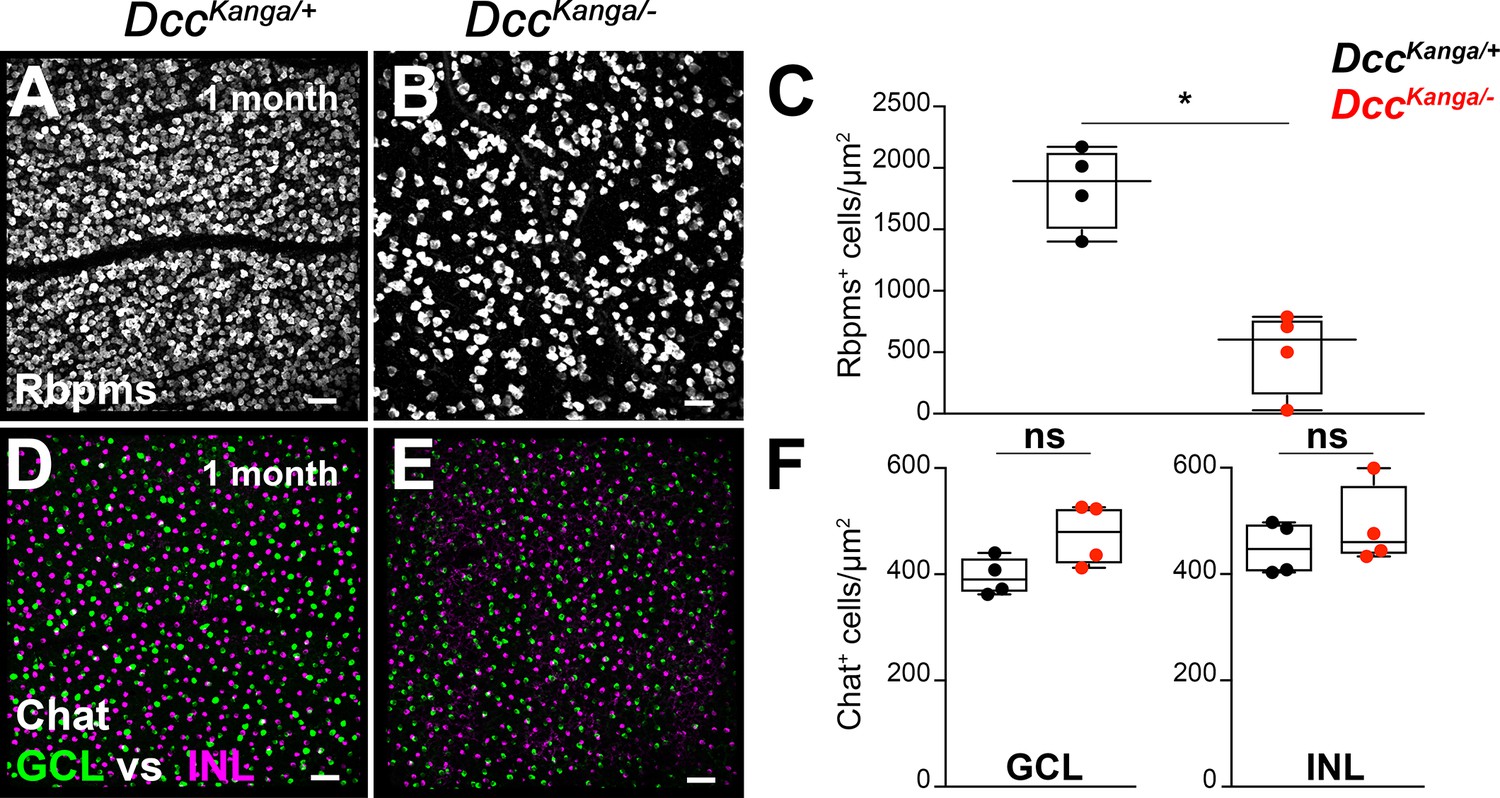
Dcc signaling is critical for RGC survival.
(A,B) 1 month-old retinas of Dcckanga/- and Dcckanga/+ control littermates were flat-mounted and immunolabeled for the pan-RGC marker, Rbpms (white). (C) Quantification of Rbpms-positive cells represented as a box plot; whiskers represent min to max values. A Mann-Whitney test was used. Results were considered non-significant (ns) if p>0.05. *=p < 0.05. (D,E) Flat-mounted retinas labeled for Chat in the ganglion cell layer (GCL, green) and the inner nuclear layer (INL, magenta). (F) Quantification of Chat+ cells represented as a box plot; whiskers represent min to max values. A Mann-Whitney test was used. Scale bars: (A,B,D,E) 300 μm.
Figure 8 with 6 supplements

EyeDISCO, a novel tissue clearing protocol for whole eye visualization.
(A) Is a representation of the EyeDISCO clearing pipeline. Adult eyes are dehydrated in methanol and immersed in an 11% H2O2 solution irradiated with a 3000°K warm white light (red arrow). After immuno-labeling the eyes are cleared and imaged using light sheet microscopy. (B, B’) Side view image of an adult eye (1 month) before and after EyeDISCO clearing. (C,D) Eye fundoscopy of a 1 month-old Dccfl/fl and a Dkk3:cre;Dccfl/fl eye. Dkk3:cre;Dccfl/fl fundoscopy shows a severe dysplasia (yellow arrows). Eye coordinates are highlighted, D, dorsal, V, ventral,N, nasal, T, temporal. (E,F) Whole eye of Dccfl/fl and Dkk3:cre;Dccfl/fl mice after EyeDISCO treatment labeled with a nuclear marker (TO-PRO-3, white). Major dysplasia can still be observed in Dkk3:cre;Dccfl/fl eyes (yellow arrows). (G) Represents a slice of the 3D stack from a Dkk3:cre;Dccfl/fl eye. The dysplasia can be isolated by manual segmentation with Imaris (magenta, yellow arrow). (H) The affected area visualized in 3D (magenta) following manual segmentation. (I–N) 3D surfaces of rosette masks in 3 separate Dkk3:cre;Dccfl/fl mice showing both the left and right eye. (O, P) Whole-mount IHC of eyes of Dccfl/fl and Dkk3:cre;Dccfl/fl 1 month-old eyes labeled for short-wavelength Opsin (Opn1sw, white). (Q) A merge of 3 separate masks using Imaris from Dkk3:cre;Dccfl/fl mice showing rosette area coverage and retina circumference. (R) Quantification of rosette area coverage in retinas. No differences in rosette coverage were seen between Dcc cKO and control littermates at P15 (21.85 ± 2.48%; n = 5 eyes), 1 month (20.11 ± 1.67%; n = 5 eyes; p>0.999) and 6 months (17.68 ± 3.76%; n = 5 eyes; p=0.6176). A Kruskal-Wallis test was used to measure significance. Data are represented as a box plot; whiskers represent min to max values. Results were considered non-significant (ns) if p>0.05. Scale bars: (E–H, I–N) 300 μm, (O, P) 500 μm, (O, P) high magnification) 150 μm, (Q) 400 μm.
-
Figure 8—source data 1
Rosette volume in Dcc cKO mice does not progress overtime.
- https://cdn.elifesciences.org/articles/51275/elife-51275-fig8-data1-v2.xlsx
-
Figure 8—source data 2
EyeDISCO leads to a mild and isotropic shrinkage of the adult mouse eye.
- https://cdn.elifesciences.org/articles/51275/elife-51275-fig8-data2-v2.xlsx
-
Figure 8—source data 3
Outer nuclear layer thickness is reduced in Dcc cKo mice.
- https://cdn.elifesciences.org/articles/51275/elife-51275-fig8-data3-v2.xlsx
-
Figure 8—source data 4
Retinal-specific deletion of Dcc leads to a significant reduction in retinal physiology.
- https://cdn.elifesciences.org/articles/51275/elife-51275-fig8-data4-v2.xlsx
Figure 8—figure supplement 1
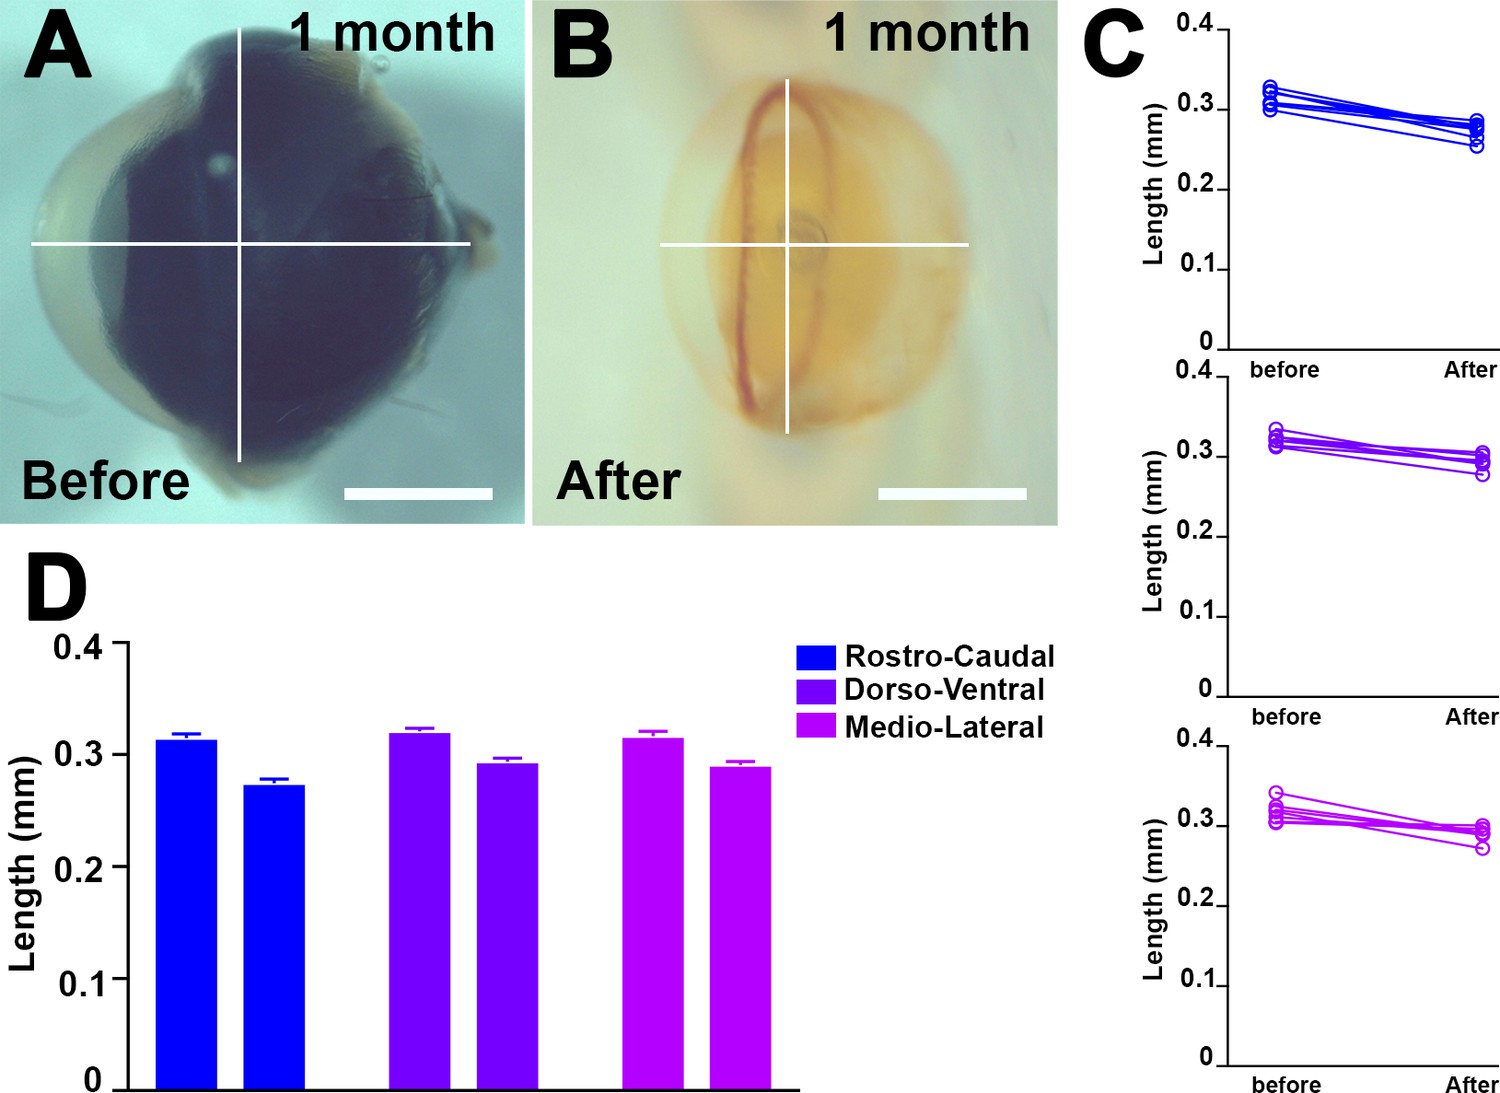
EyeDISCO leads to a mild and isotropic shrinkage of the adult eye.
(A–B) A 1 month old mouse eye before and after EyeDISCO clearing. White bars indicate measurements in rostro-caudal, dorso-ventral, and medio-lateral. (C) Quantification of 1 month old mouse eyes in rostro-caudal (12.78 ± 1.31%; n = 8), dorso-ventral (8.387 ± 1.03%; n = 8), and medio-lateral (7.875 ± 1.89%; n = 8) following EyeDISCO clearing. Results are presented as mean ± SEM with individual values. (D) Bar graph representation of a 1-month-old mouse eye shrinkage following EyeDISCO.
Figure 8—figure supplement 2
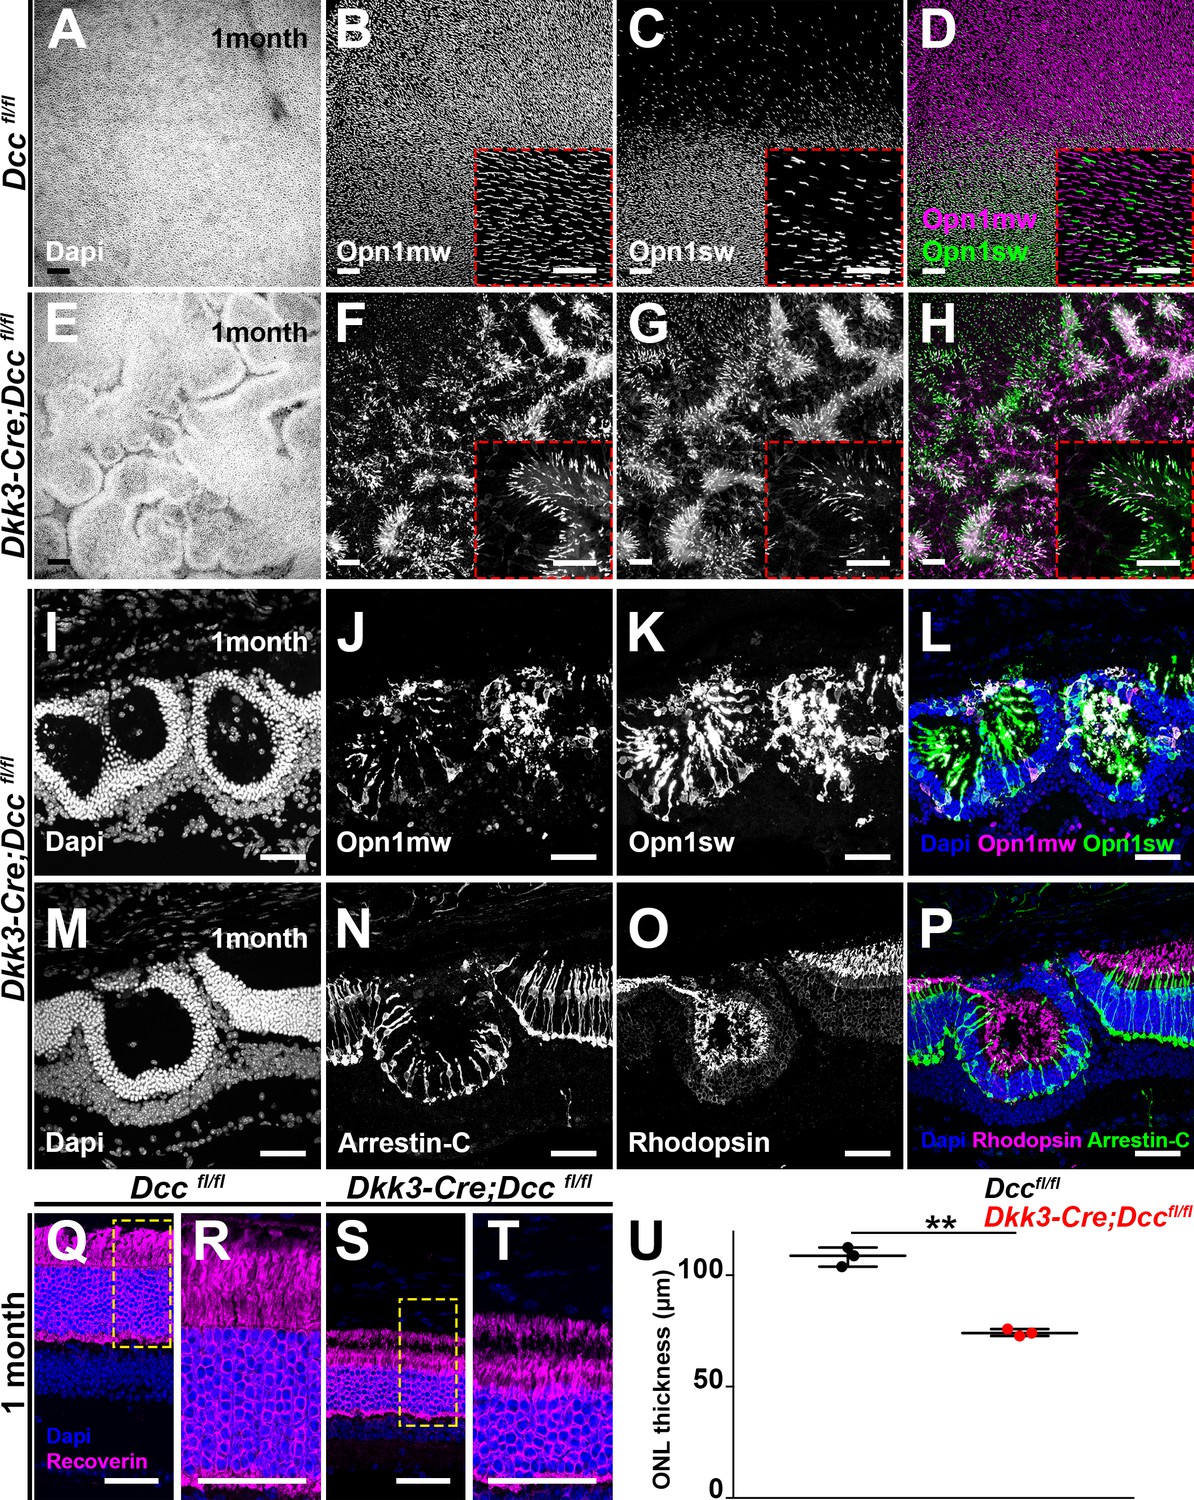
Photoreceptors are ubiquitously present within rosettes.
(A–H) Whole-mount immunostaining of Dccfl/fl and Dcc cKO retinas at 1 month labeled for short- (green; Opn1sw) and mid-wavelength (Opn1mw, magenta) opsins. (I–L) Cryosections of 1-month-old Dkk3:cre;Dccfl/fl retinas labeled for short- (green) and mid-wavelength (magenta) opsins. (M–P) Cryosections from 1-month-old Dcc cKO retinas labeled for cones (Arrestin-C, magenta) and Rods (Rhodopsin, green). (Q–T) Cryosections from 1-month-old retinas immunolabeled for a pan photoreceptor marker (Recoverin, magenta). (R,T) show high magnification images. (U) Quantification of the photoreceptor layer using Recoverin as a marker. Dcc cKO retinas display a dramatic reduction in photoreceptor layer (74.22 ± 0.89 µm; n = 3 compared to 108.3 ± 2.482 µm in Dccfl/fl control littermates; n = 3; p=0.0023. A Welch’s t-test was performed. **=p < 0.01. Scale bars: (A–T) 50 μm.
Figure 8—figure supplement 3

Eye-specific deletion of Dcc leads to functional visual deficits.
(A) Scotopic response of Dcc cKO and control littermates are shown for 1 month and 6-month-old mice. A Bonferroni’s test was used. (B) Shows the photopic response at 1 (84.743 ± 11.33; n = 5 compared to 16.1 ± 4.07; n = 5; p=0.0079) and 6 months (68.176 ± 9.56; n = 8 compared to 25.752 ± 9.33; n = 7; p=0.0093). A Mann-Whitney test was used. Results were considered non-significant (ns) if p>0.05. *=p < 0.05; **=p < 0.01; ***=p < 0.001; ****=p < 0.0001.
Figure 8—figure supplement 4
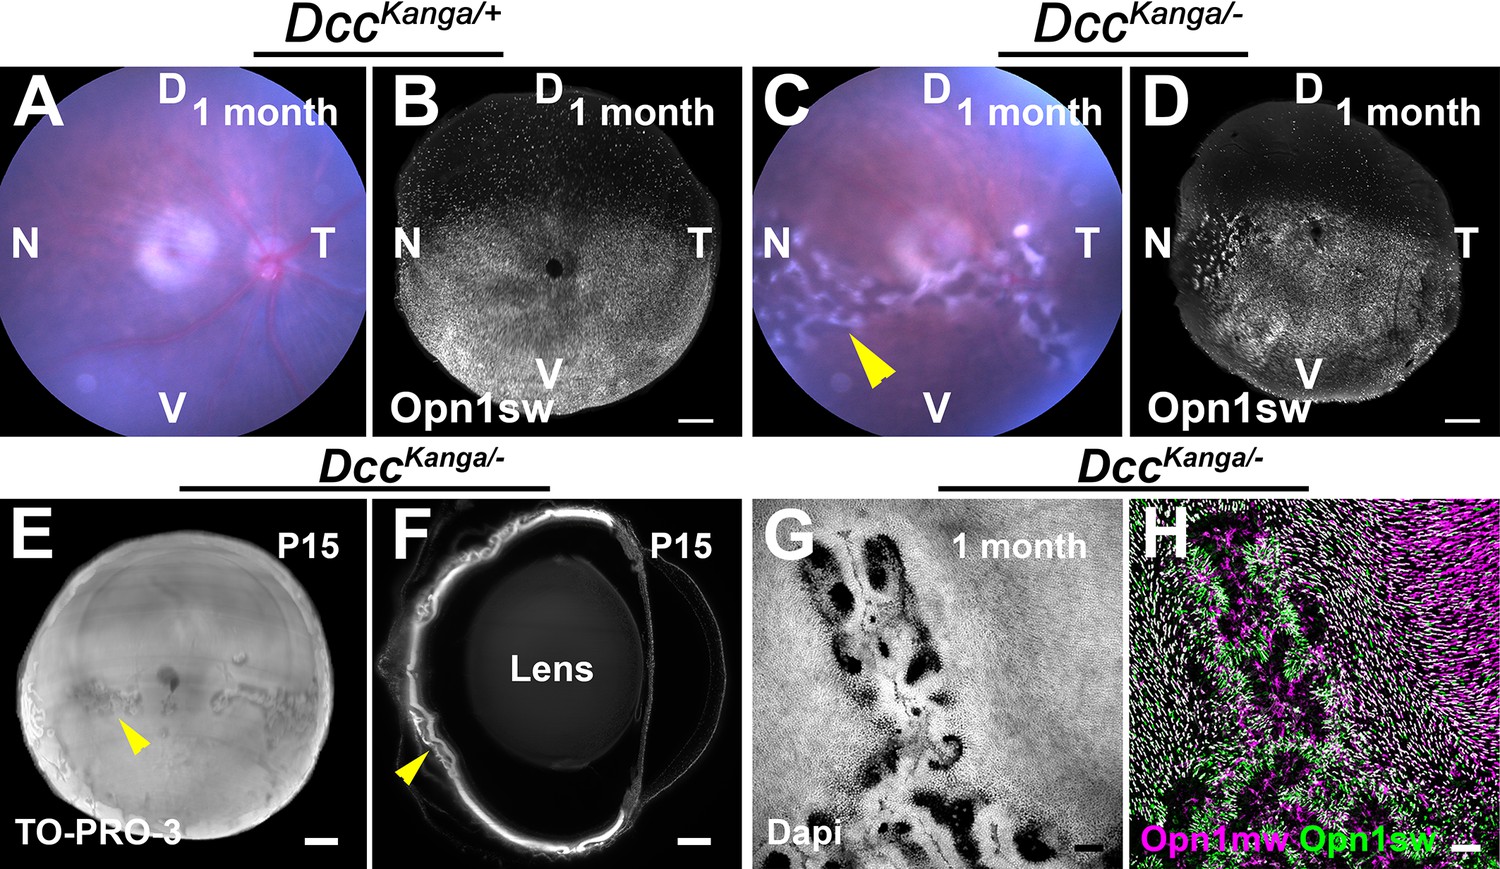
Dcc Kanga mutants display retinal dysplasia.
(A,C) Eye fundoscopy showing an eye fundoscopy of Dcc Kanga/- mice and Dcckanga/+ mice, rosettes can be seen in mutant retinas (yellow arrowhead). (B,D) show whole-mount immunolabeling of the short-wavelength Opsin (Opn1sw, white) of 1 month-old Dcckanga/- and DccKanga/+ mice following the EyeDISCO protocol. Rosettes can be seen. (E) Frontal view of a whole Dcc kanga eye immunolabeled for the nuclear marker TO-PRO-3 (white). (F) z-slice from a 3D-rendered Dcc kanga eye immunolabeled for TO-PRO-3 (white). Rosettes are observed in the naso-temporal retina (yellow arrowhead). (G-H) Flat-mounted retinas of adult Dcckanga/- and Dcckanga/+ control littermates immunolabeled for mid-wavelength opsin (Opn1mw, magenta), and short-wavelength opsins (Opn1sw, green). Rosette structures can be seen. Scale bars: (B,D) 300 μm, (E,F) 200 µm, (G,H) 50 µm.
Figure 8—video 1
Eye-specific Dcc deletion leads to major retinal dysplasia.
Whole eye phenotyping of a 1 month-old Dkk3:cre;Dccfl/fl mouse. Retinal dysplasia can be seen using eye fundoscopy. The eyes are then harvested and processed using the EyeDISCO protocol and labeled using the nuclear marker, TO-PRO-3 (white). Using z-slice, the localization of rosettes in the outer nuclear layer of the retina can be visualized. Using manual segmentation, the rosettes are isolated and a mask is created (green). The 3D rendering of retinas is aligned along the Dorsal, ventral, nasal, and temporal co-ordinates. Masks from multiple mutants can be visualized, showing a highly correlated rosette-affected region in the ventral retina as a naso-temporal band.
Figure 8—video 2
Rosette formation in Dcc cKO mice is specific to photoreceptor cells.
Photoreceptor immunolabeling of a 1 month-old Dccfl/fl and Dkk3:cre;Dccfl/fl mouse. Whole eyes were immunolabeled for the short-wavelength Opsin marker (Opn1sw, magenta) and the pan-cone photoreceptor marker, cone arrestin (Arrestin-C, green) cleared using the EyeDISCO protocol. Rosettes are observed in the ventral retina, appearing as a naso-temporal band.
Additional files
-
Supplementary file 1
List of primary and secondary antibodies used for the study.
- https://cdn.elifesciences.org/articles/51275/elife-51275-supp1-v2.docx
-
Supplementary file 2
List of primary antibodies validated with the EyeDISCO clearing protocol.
- https://cdn.elifesciences.org/articles/51275/elife-51275-supp2-v2.xlsx
-
Supplementary file 3
Sequencing of Phosphodiesterase 6b, cGMP, rod receptor, beta polypeptide (Pde6b) mutations in the Dcc cKO and Dcc kanga mice.
- https://cdn.elifesciences.org/articles/51275/elife-51275-supp3-v2.docx
-
Supplementary file 4
Key resources table.
- https://cdn.elifesciences.org/articles/51275/elife-51275-supp4-v2.docx
-
Transparent reporting form
- https://cdn.elifesciences.org/articles/51275/elife-51275-transrepform-v2.docx
Download links
A two-part list of links to download the article, or parts of the article, in various formats.
Downloads (link to download the article as PDF)
Open citations (links to open the citations from this article in various online reference manager services)
Cite this article (links to download the citations from this article in formats compatible with various reference manager tools)
Revisiting the role of Dcc in visual system development with a novel eye clearing method
eLife 9:e51275.
https://doi.org/10.7554/eLife.51275


