Distinct inactive conformations of the dopamine D2 and D3 receptors correspond to different extents of inverse agonism
- Division of Pharmacology, Physiology and Neuroscience, School of Life Sciences, Queen’s Medical Centre, University of Nottingham, United Kingdom
- Centre of Membrane Protein and Receptors, Universities of Birmingham and Nottingham, United Kingdom
- Computational Chemistry and Molecular Biophysics Unit, National Institute on Drug Abuse - Intramural Research Program, National Institutes of Health, United States
- Drug Discovery Biology, Department of Pharmacology and Medicinal Chemistry, Monash Institute of Pharmaceutical Sciences, Monash University, Australia
- Department of Psychiatry, Vagelos College of Physicians and Surgeons, Columbia University, United States
- Division of Molecular Therapeutics, New York State Psychiatric Institute, United States
- Vagelos College of Physicians and Surgeons, Columbia University, United States
Figures
Figure 1 with 1 supplement
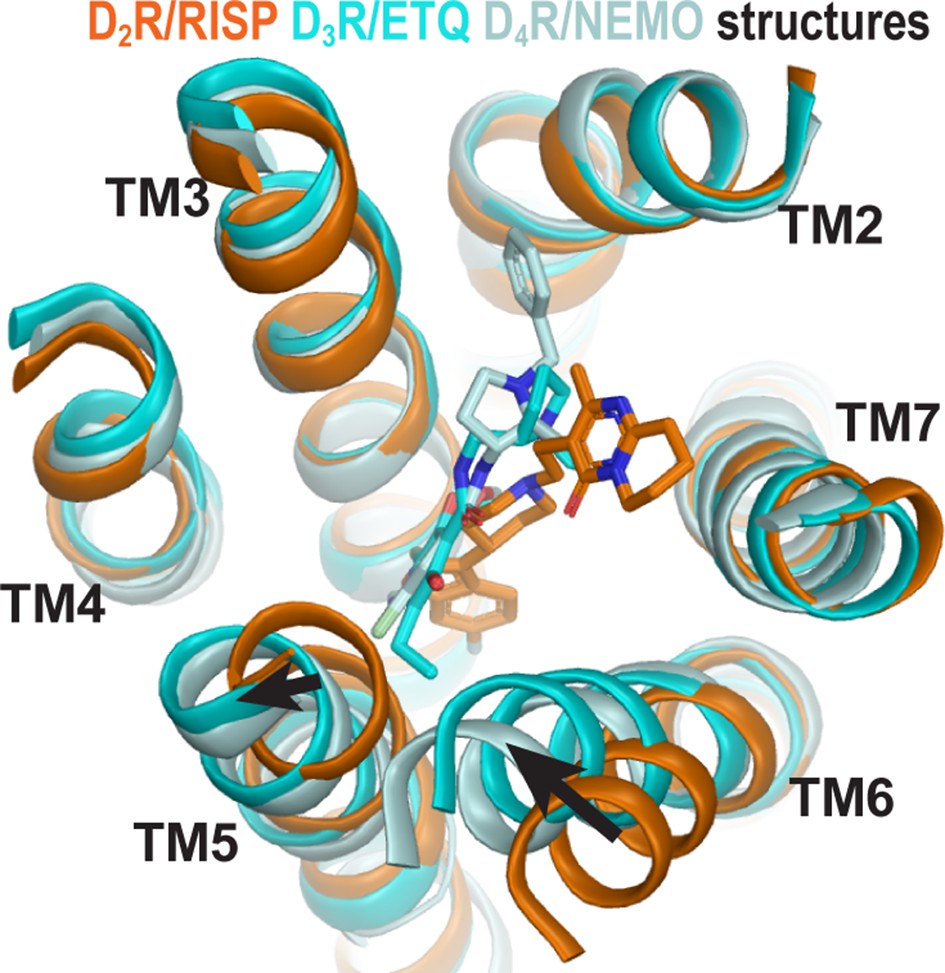
The structures of homologous D2R, D3R, and D4R show different conformations in the extracellular vestibules.
Superpositioning of D2R, D3R, and D4R structures shows that the binding of eticlopride (ETQ, cyan) in D3R and nemonapride (NEMO, pale cyan) in D4R result in outward and inward rearrangements of the extracellular portions of TM5 and TM6, respectively, compared to the binding of risperidone (RISP, orange) in D2R.
Figure 1—figure supplement 1
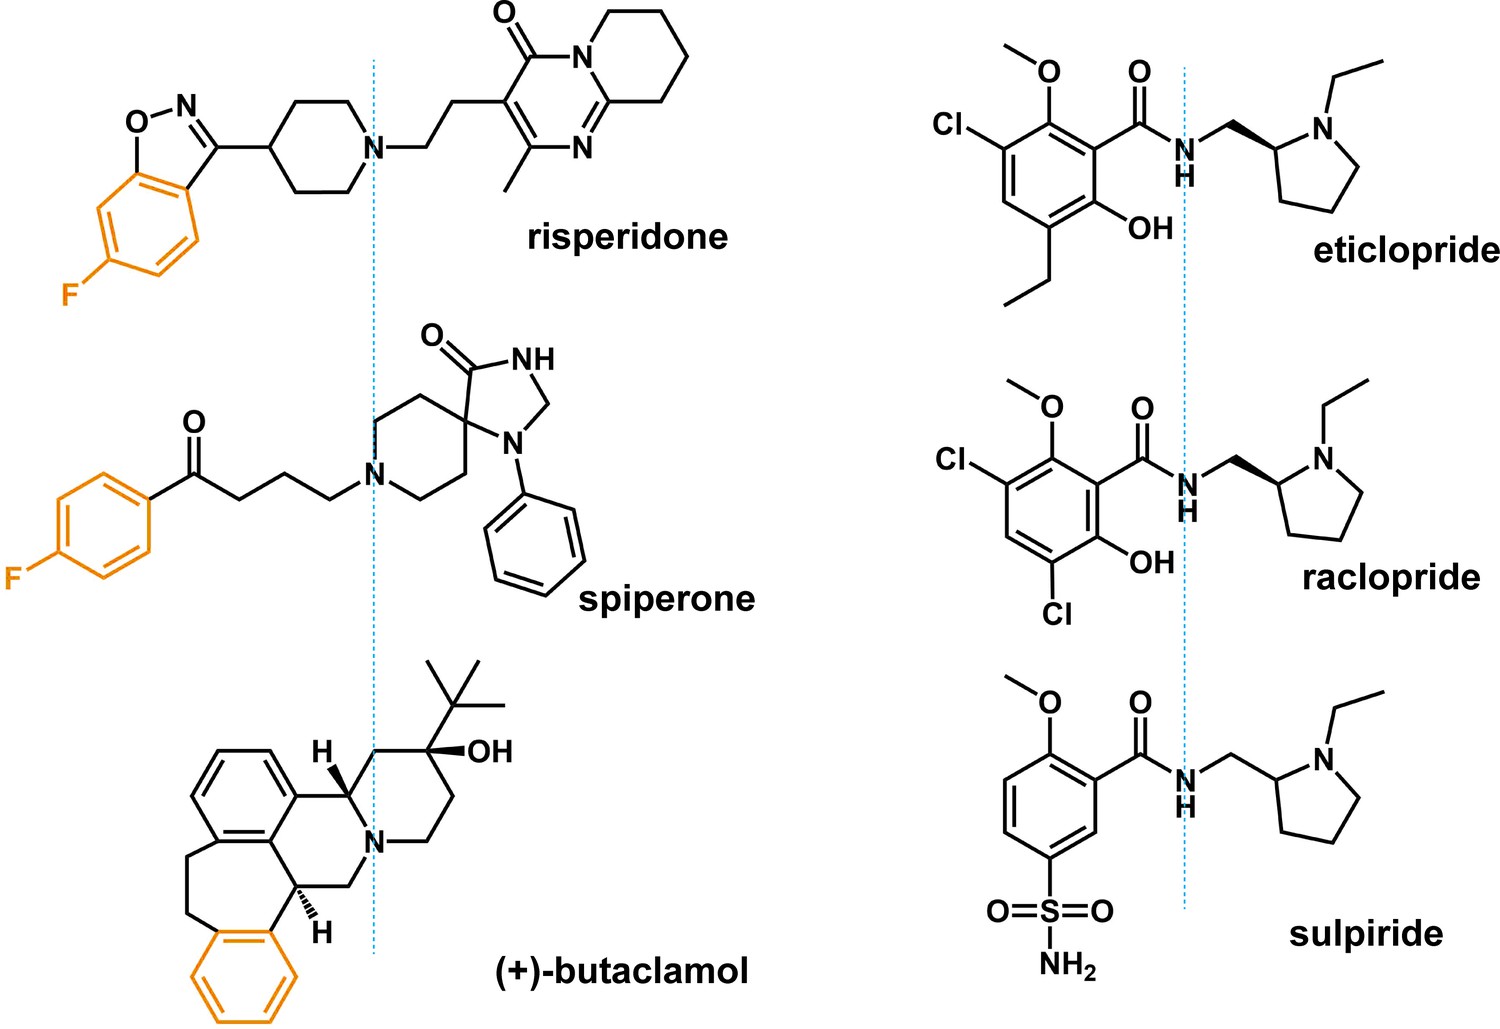
Chemical structure alignments of the non-selective D2-like receptors ligands.
The moieties that occupy the Ile3.40 sub-pocket are colored in orange.
Figure 2 with 1 supplement
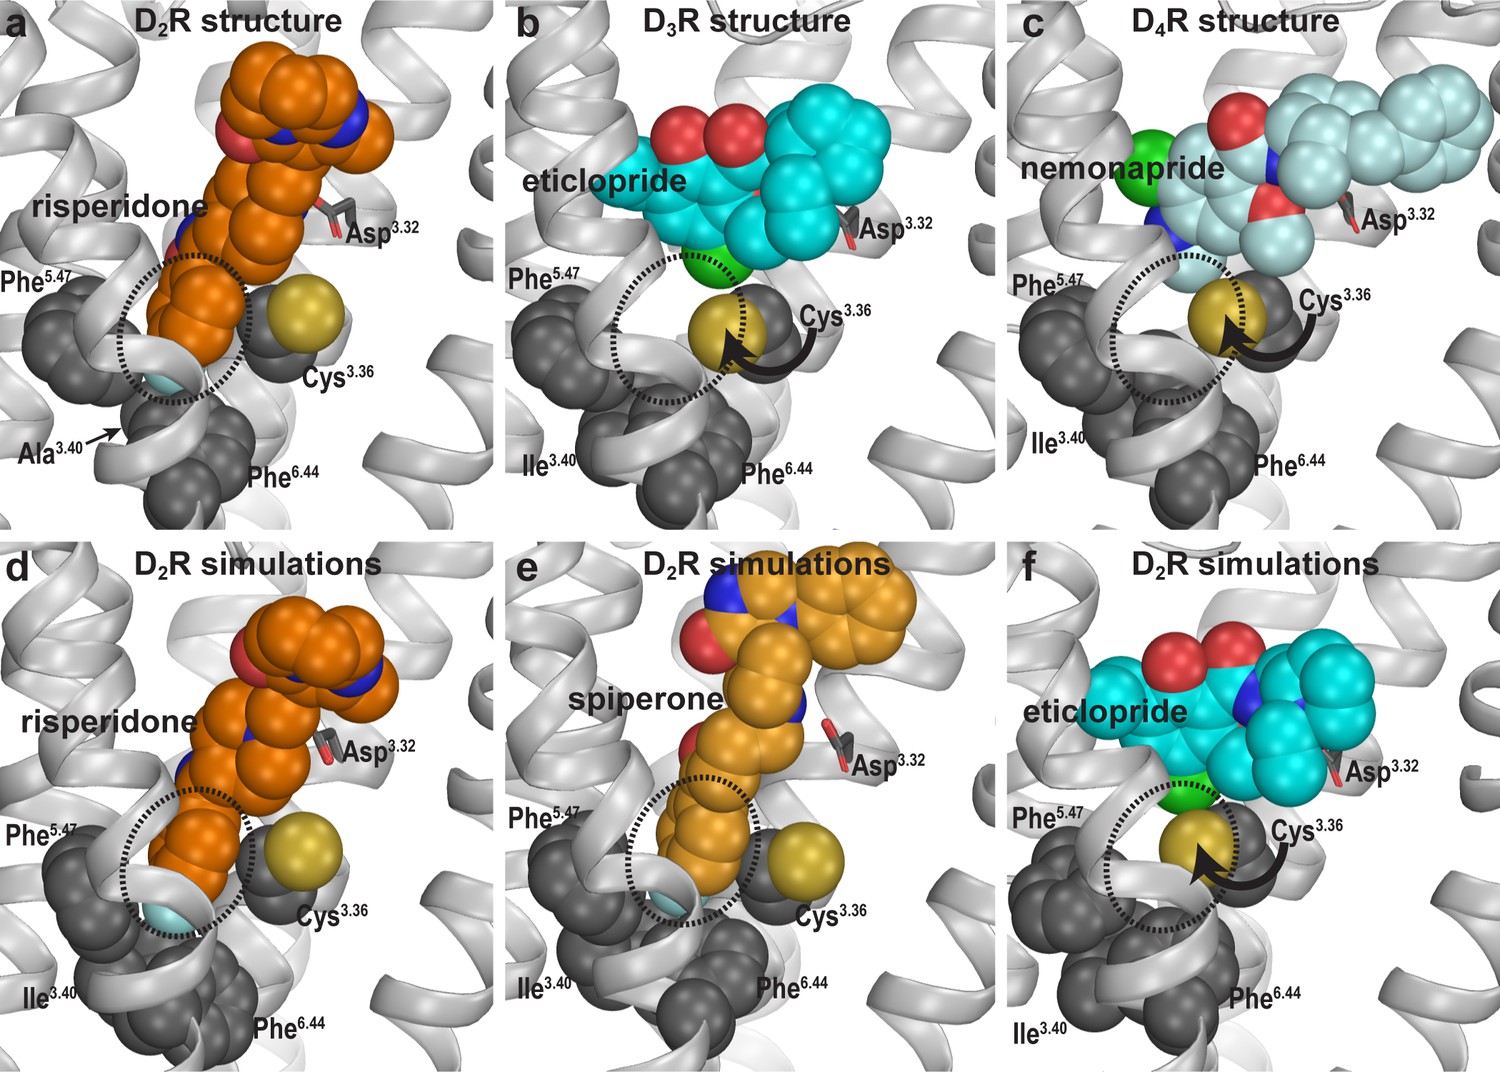
Divergent occupations of the Ile3.40 sub-pocket by non-selective ligands from different scaffolds.
In the D2R structure (a), the F-substitution on the benzisoxazole ring of risperidone occupies the Ile3.40 sub-pocket (dotted circle) enclosed by conserved Ile3.40 (mutated to Ala in the crystal structure to thermostabilize the receptor), Phe5.47, and Phe6.44. The same viewing angle shows that in the D3R (b) and D4R (c) structures, Cys3.36 rotates to fill in the Ile3.40 sub-pocket, and the substituted benzamides eticlopride and nemonapride cannot occupy the aligned sub-pockets. In our D2R/risperidone simulations (d), risperidone maintains its pose revealed by the crystal structure. In the D2R/spiperone simulations (e), the Ile3.40 sub-pocket is similarly occupied as in D2R/risperidone. In the D2R/eticlopride simulations (f), the Ile3.40 sub-pocket is collapsed as in the D3R (b) and D4R (c) structures (this trend is independent of the force field being used in the simulations).
Figure 2—figure supplement 1
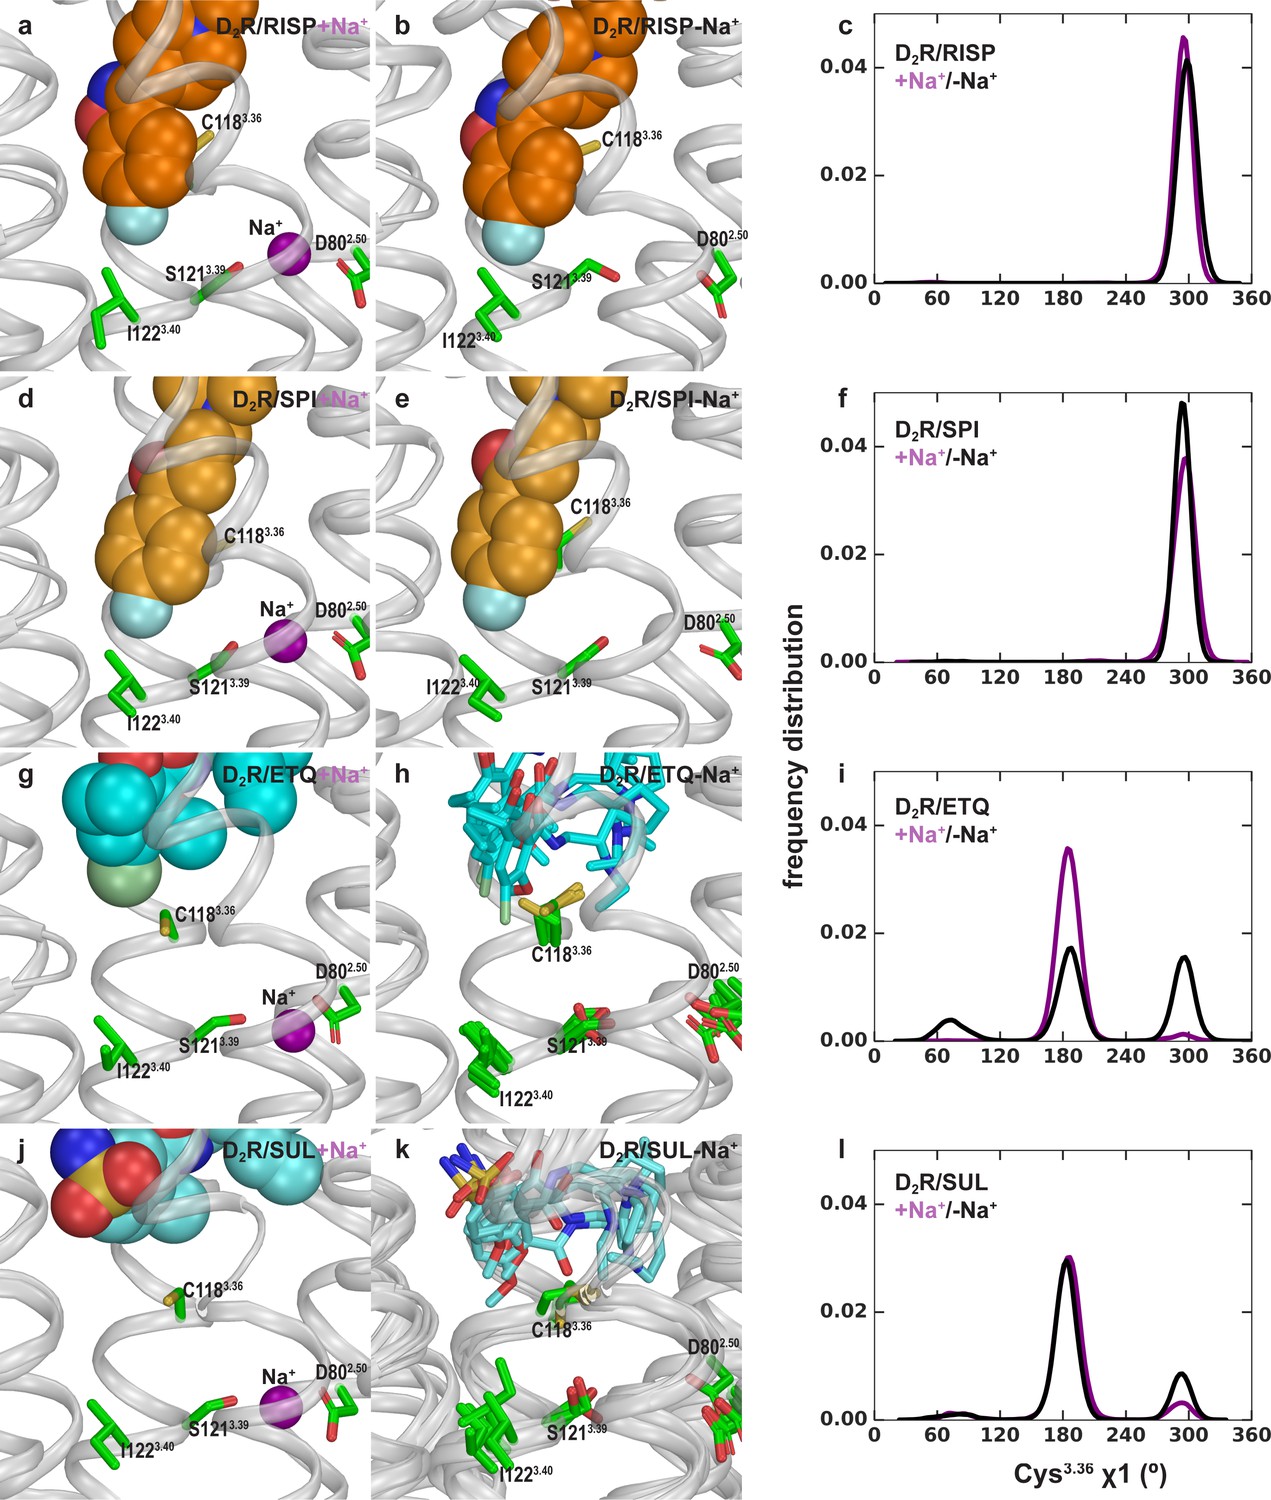
Allosteric communication between the Ile3.40 sub-pocket and the Na+ binding site.
Risperidone (a, b) and spiperone (d, e) similarly occupy the Ile3.40 sub-pocket in both the presence and absence of Na+ bound at the Asp802.50 site. In the eticlopride (g, h) and (-)-sulpiride (j, k) bound conditions, the Ile3.40 sub-pocket is not occupied, and Cys3.36 shows flexibility in the absence of bound Na+. (c), (f), (i), and l) Distributions of the χ1 rotamer of Cys3.36 in the D2R simulations in the presence of different bound ligands.
Figure 3
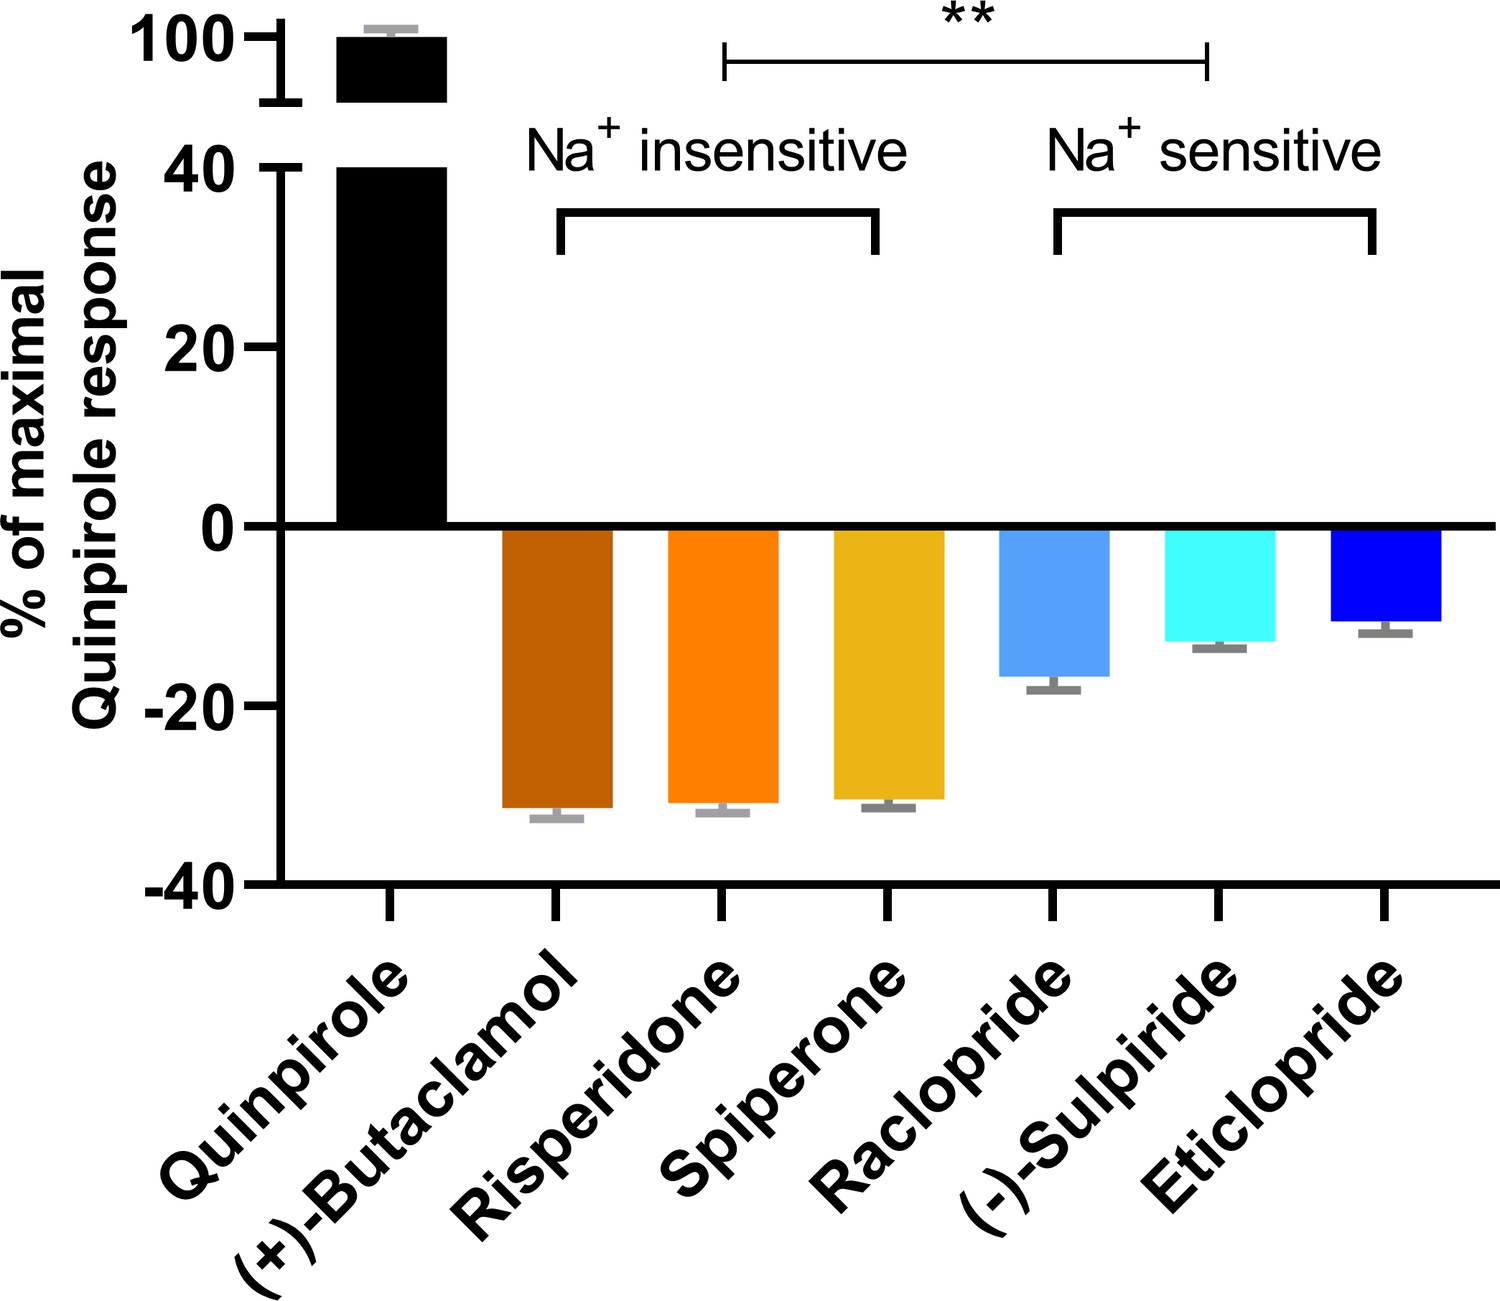
The extent of inverse agonism is negatively related with the Na+ sensitivity of ligand binding.
In a D2R-Go BRET assay, the maximal responses of the indicated ligands are normalized to that of the reference full agonist quinpirole. The ligands that are insensitive to Na+ in D2R binding display significantly higher inverse agonism (in each case, **p<0.0001 using ordinary one-way ANOVA followed by Tukey’s multiple comparisons test) than the Na+-sensitive ligands; however, within the Na+-sensitive group, raclopride is significantly different from eticlopride (p=0.005).
Figure 4 with 1 supplement

The different conformations in the extracellular vestibules of D2R and D3R are likely due to binding of non-selective ligands from different scaffolds.
(a) Compared to the comparison of the crystal structures shown in Figure 1, superpositioning of representative frames of the D2R/ETQ and D2R/RISP simulations shows a similarly trend of the outward and inward movements of TM5 and TM6, respectively, in the presence of the bound ETQ, even when the simulations were started from the D2R conformation stabilized by RISP. Note Ser1935.42 and Ser1945.43 would clash with the bound eticlopride if there was no conformational adjustment. (b, c) PIA-GPCR analysis (see Materials and methods) comparing the D2R/ETQ and D2R/RISP conformations. The analysis of the pairwise-distance differences among the subsegments (b) indicates that TM6e moves inward (smaller distance to TM2e, dark red pixel), while TM5e moves outward (larger distances to TM7e, dark blue pixel) in the D2R/ETQ simulations. The analysis of pairwise-distance differences among the Cα atoms of the ligand-binding residues (c) indicates significant changes near residues Phe1895.38, Ser1935.42, Asn3676.58, and Ile3686.59 (darker colored pixels).
Figure 4—figure supplement 1
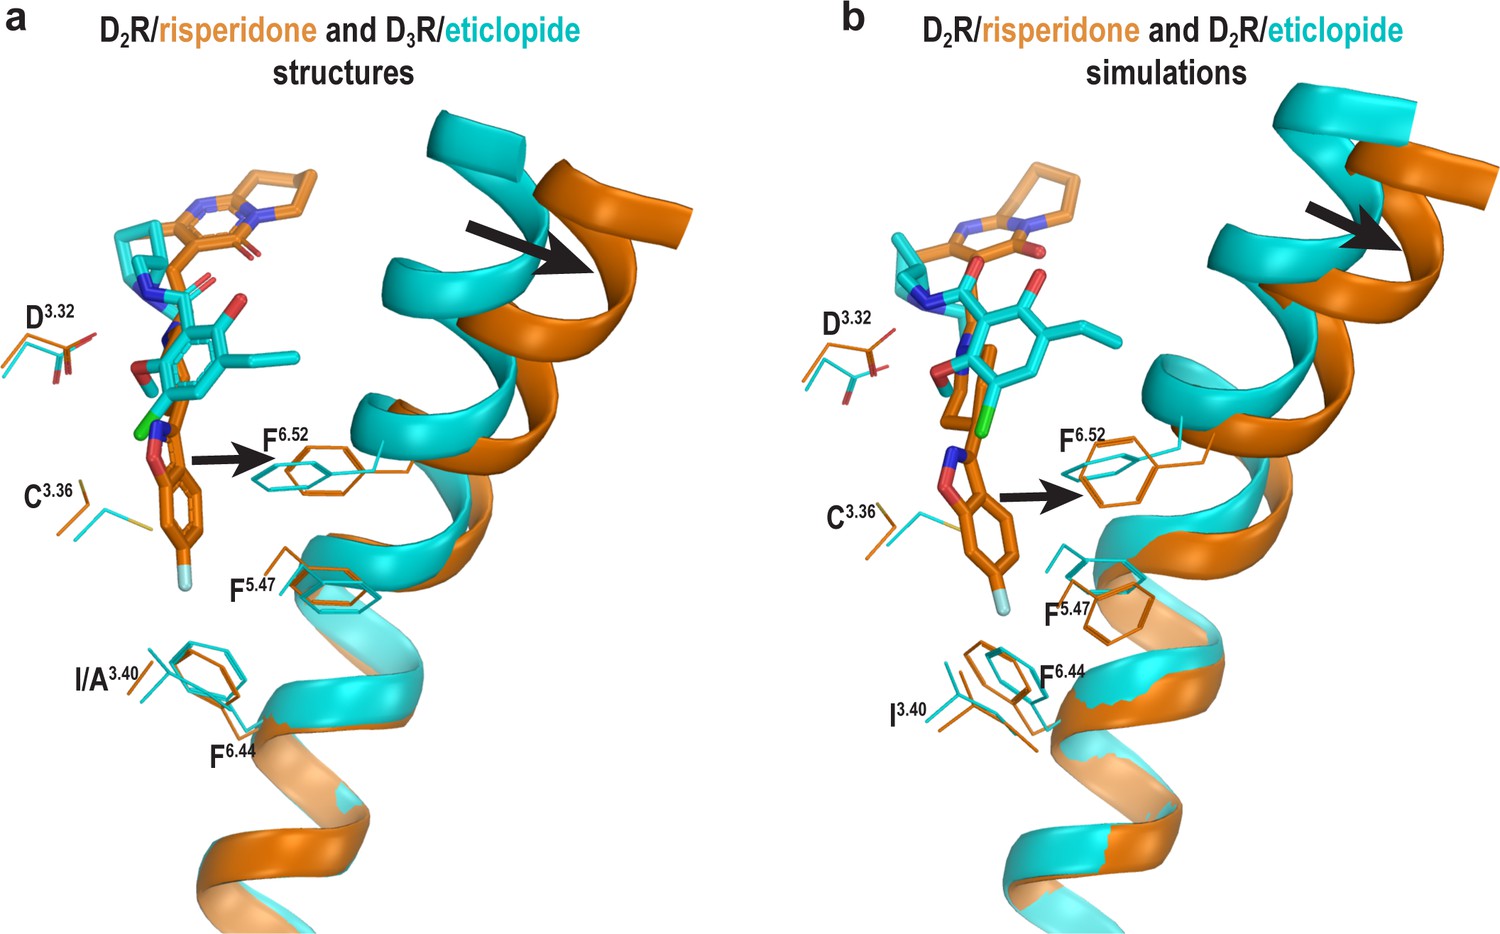
The occupation of the Ile3.40 pocket by risperidone is associated with outward movement of the extracellular portion of TM6.
(a) Superpositioning of the D2R/risperidone and D3R/eticlopride structures shows the occupation of the Ile3.40 pocket by the benzisoxazole moiety of risperidone directly affects the positioning of Phe6.52, the impact of which propagates to affect overall conformation of the extracellular portion of TM6. (b) Similar impact was observed in the comparison of the results from the D2R/risperidone and D2R/eticlopride simulations.
Figure 5 with 6 supplements
The helical conformation of EL2 in the D2R/risperidone structure has a tendency to unwind in our simulations, regardless of the bound ligand.
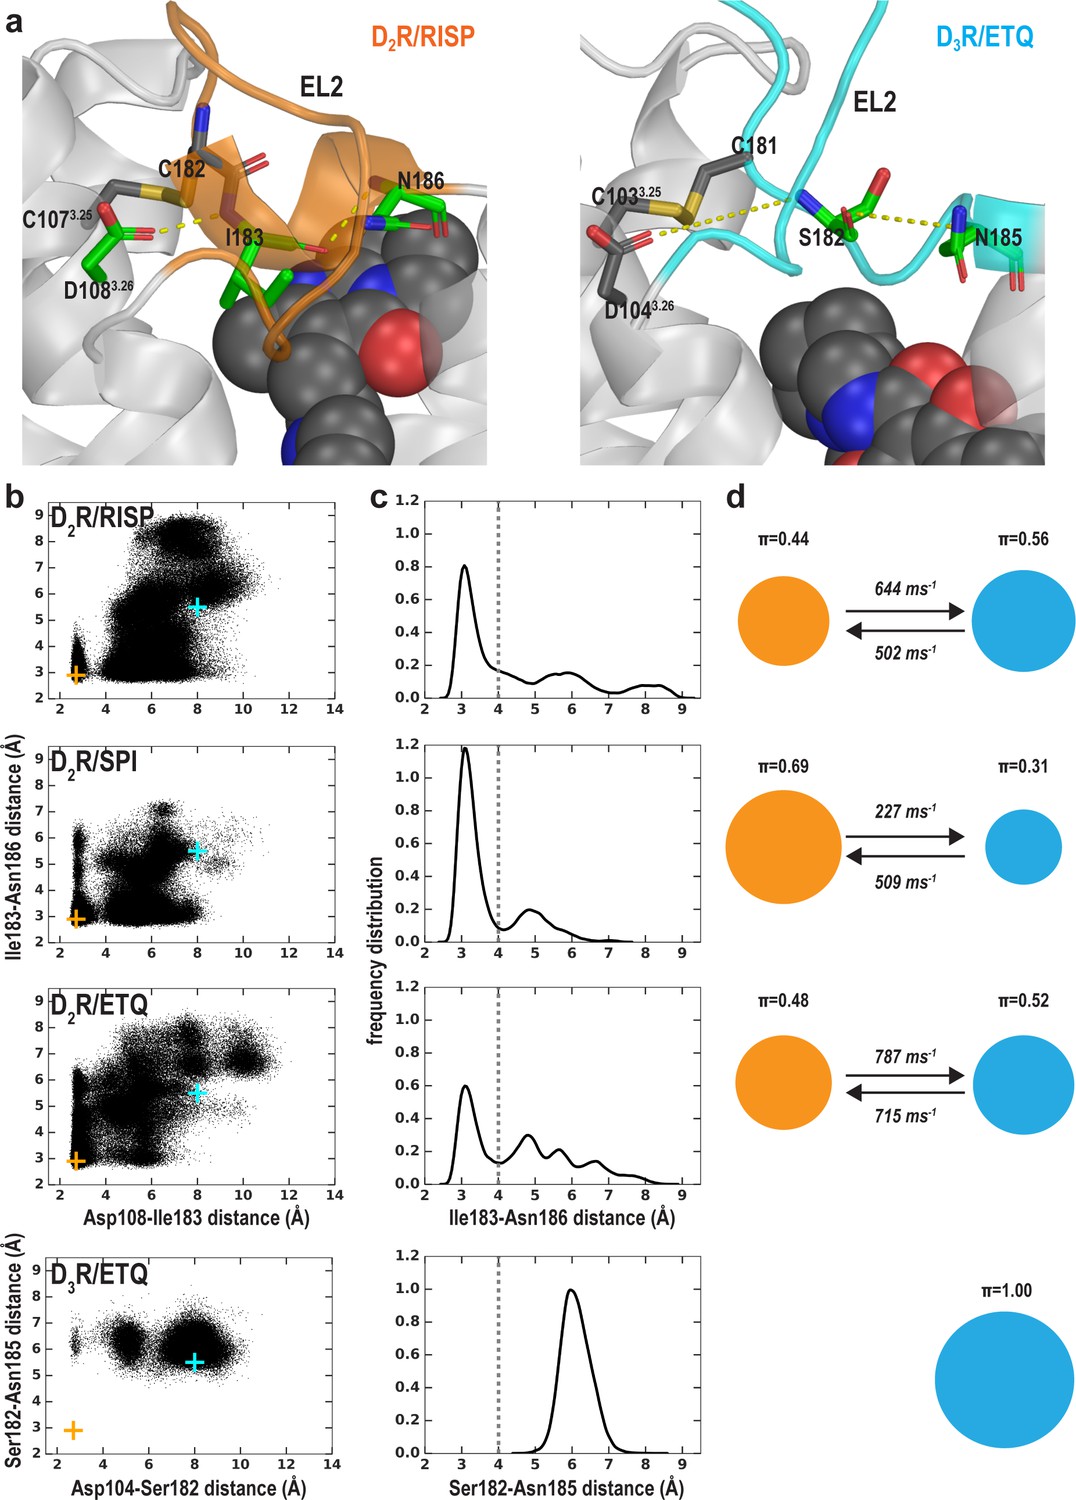
(a) The Ile183EL2.51-Asn186EL2.54 backbone H-bond and the Ile183EL2.51-Asp1083.26 interaction in D2R and their aligned interactions in D3R. (b) The scatter plots of the two distances in the indicated D2R and D3R complexes. The orange and cyan crosses indicated the distances in the D2R/risperidone and D3R/eticlopride structures, respectively. (c) The distributions of the EL2.51-EL2.54 distances in the indicated simulations. These distances were used to evaluate the tendency to unwind using Markov state model (MSM) analysis in d). (d) The MSM analysis of the transition between the helical and extended conformational states of EL2. The area of each disk representing a state is proportional to the equilibrium probability (π) in each simulated condition. The values from the maximum likelihood Bayesian Markov model for π and transition rates from 500 Bayesian Markov model samples are shown. Thus, EL2 in all the D2R complexes show significant tendencies to unwind, while that in D3R/eticlopride remains extended.
Figure 5—figure supplement 1
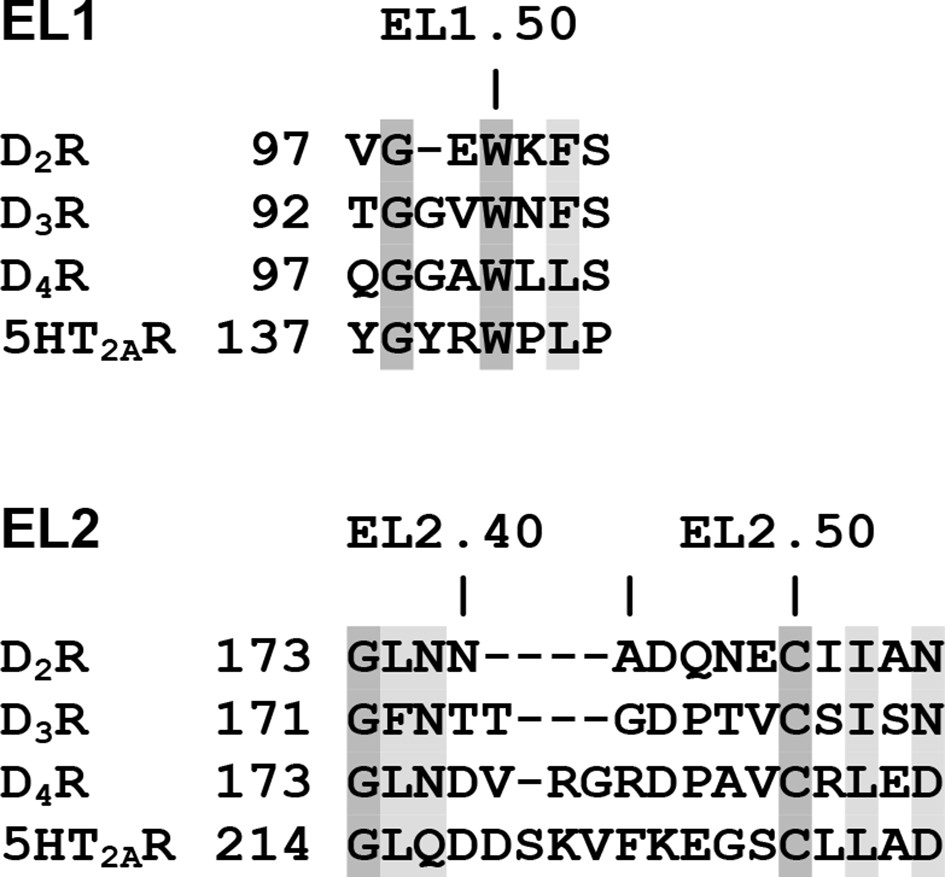
Sequence alignment and residue indices of EL1 and EL2 for the receptors being compared in this study.
The positions with identical residues are in dark gray shade, the conserved positions are in light gray shade.
Figure 5—figure supplement 2
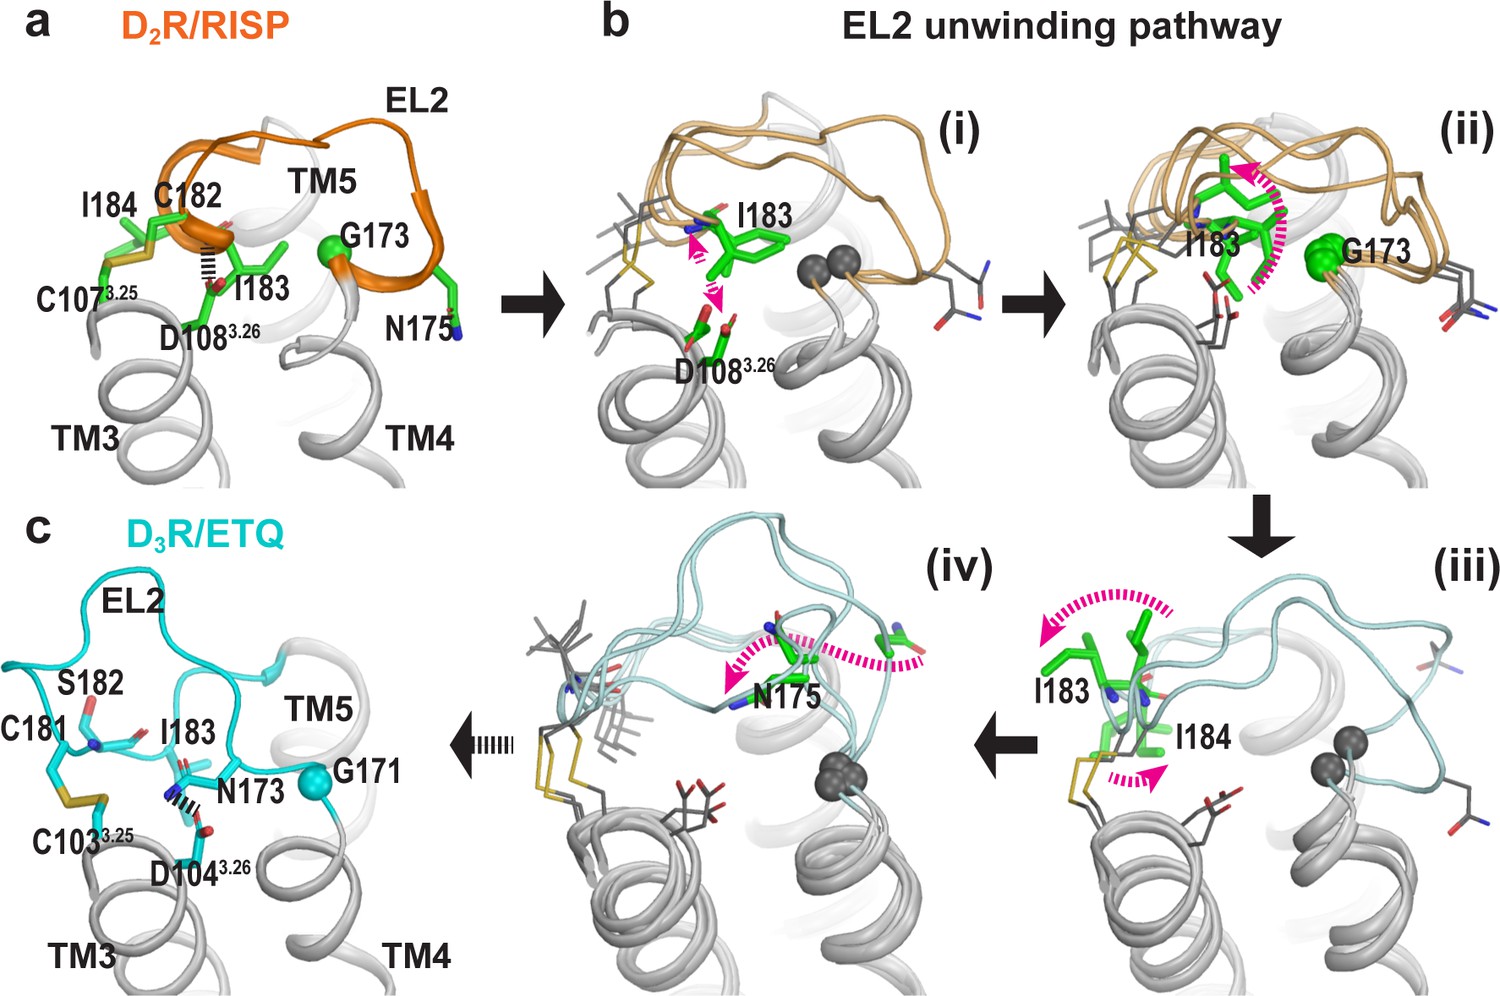
The helical region of EL2 of D2R can spontaneously unwind to an extended conformation similar to that of D3R.
(a) Residues 182EL2.50-186EL2.54 in the D2R/RISP structure are in a helical conformation. EL2 is connected to TM3 via a disulfide bond (Cys182EL2.50-Cys1073.25), while the backbone of Ile183EL2.51 forms an interaction with Asp1083.26 (magenta dotted line). (b) The key events in the EL2 unwinding pathway (for each step, a number of representative frames are shown): the ionic interaction between Asp1083.26 and Ile183EL2.51 has to dissociate first (i), which allows the sidechain of Ile183 to rotate toward lipids and pass through a minor barrier formed by Gly173EL2.37 (ii); then the sidechain of Ile183EL2.51 rotates toward the extracellular vestibule while that of Ile184EL2.52 tilts under EL2 (iii); these changes allow Asn175EL2.39 to move from facing lipid to facing the binding site (iv). The resulting conformation of EL2 of D2R is similar to that of D3R for all the aforementioned residues (c). In particular, Asn173EL2.39 of D3R, which aligns to Asn175EL2.39 of D2R, forms an H-bond interaction with Asp1043.26.
Figure 5—figure supplement 3
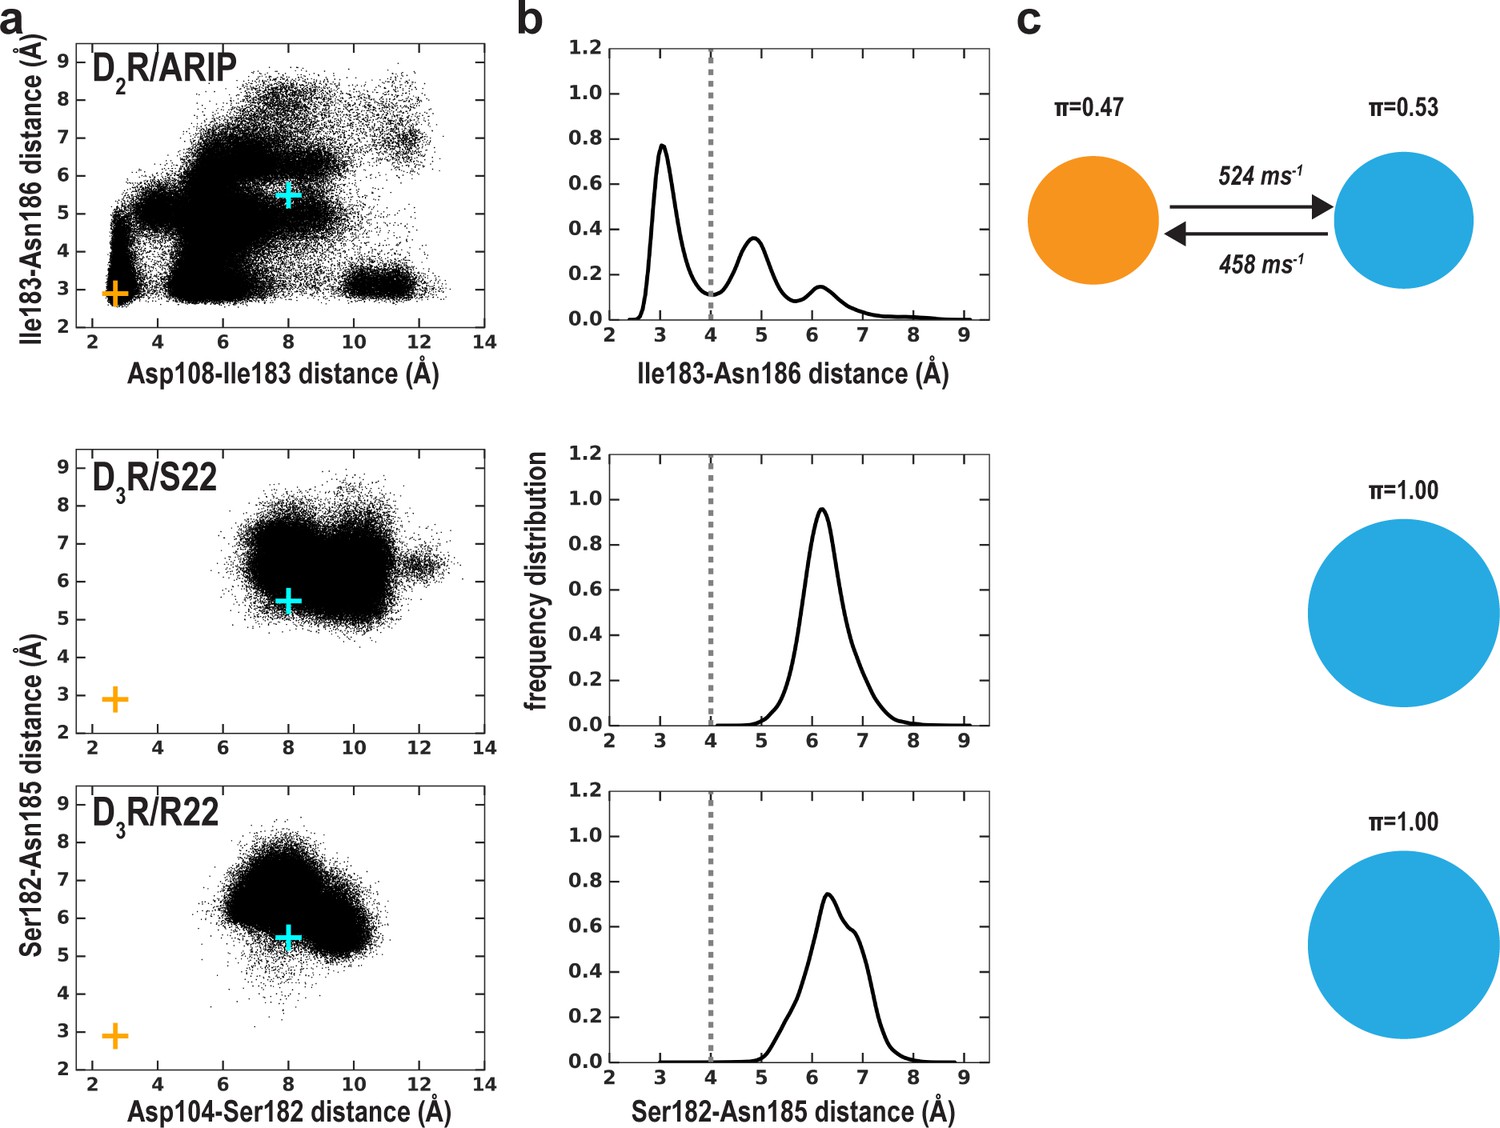
The MSM analysis of Ile183-Asn186 distance in the simulations of the D2R/aripiprazole, D3R/S22, and D3R/R22 complexes (Table 1).
The early stage of D3R/S22 and D3R/R22 simulations has been reported previously (Michino et al., 2017). The representation and color scheme is the same as that for Figure 5.
Figure 5—figure supplement 4
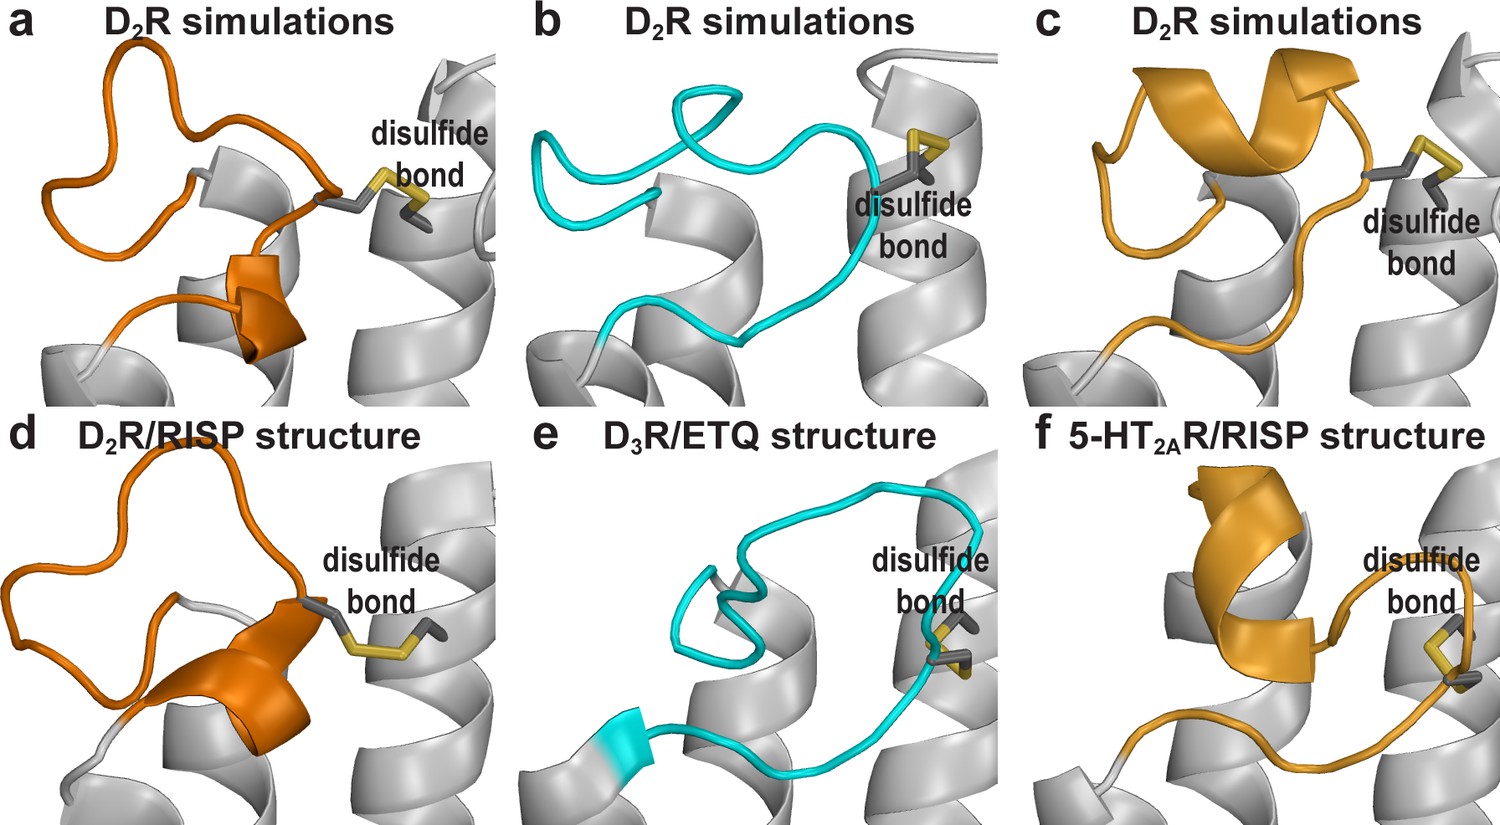
The distinct D2R EL2 conformations revealed by the MD simulations are similar to those of homologous receptors.
The C-terminal helical EL2 conformation in the D2R structure (d) can be maintained in the simulations (a). the C-terminal extended conformation (b) is similar to those in the D3R structure (e). The N-terminal helical conformation (c) is reminiscent of that in the 5-HT2AR/risperidone structure (f), and those in β1 and β2 adrenergic receptors structures (not shown).
Figure 5—figure supplement 5

The accessibility pattern of EL2 revealed by previous SCAM studies in D2R is more consistent with an extended EL2 conformation similar to that in the D3R/eticlopride structure.
The accessible residues are in green, the protected residues are in cyan. In the D2R/risperidone structure (a), Ile183EL2.51 blocks the accessibility of Gly173EL2.37 to the OBS, while Asn175 faces lipid. In the D2R/eticlopride simulations (b) and D3R/eticlopride structure (c), AsnEL2.39 rotates to point inward, while Ile183EL2.51 in D2R and Ser182EL2.51 in D3R rotates to face the extracellular vestibule of the receptors.
Figure 5—figure supplement 6
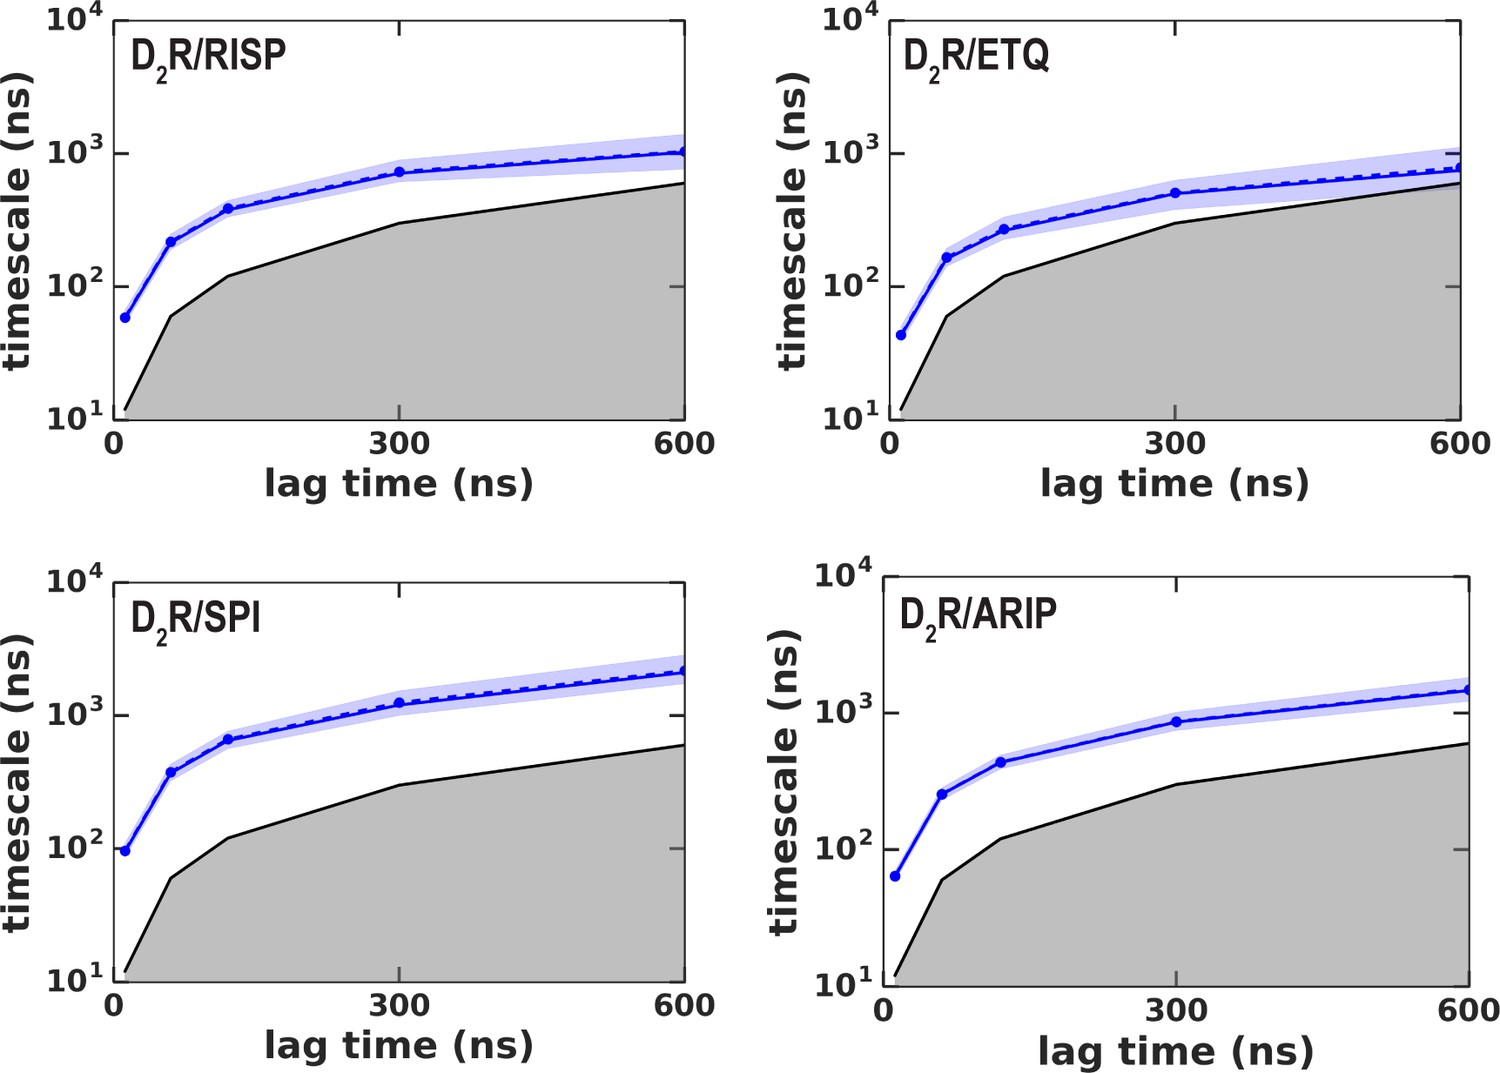
Implied timescales (ITS) for the MSM analysis.
The implied timescales (ITS) of the transition between the two states in each of the D2R conditions shown in Figure 5 and Figure 5—figure supplement 3 are plotted against various lag times. ITSs were not computed for D3R conditions because there was not transition between two states. The ITS of the maximum likelihood Bayesian Markov model is shown in a blue solid line, whereas the means and the 95% confidence intervals (computed by Bayesian sampling) are shown in dashed and shaded areas, respectively. Timescales smaller than the lag time are shown in gray-shaded area. A lag time of 300 ns was chosen for our analysis.
Figure 6 with 2 supplements
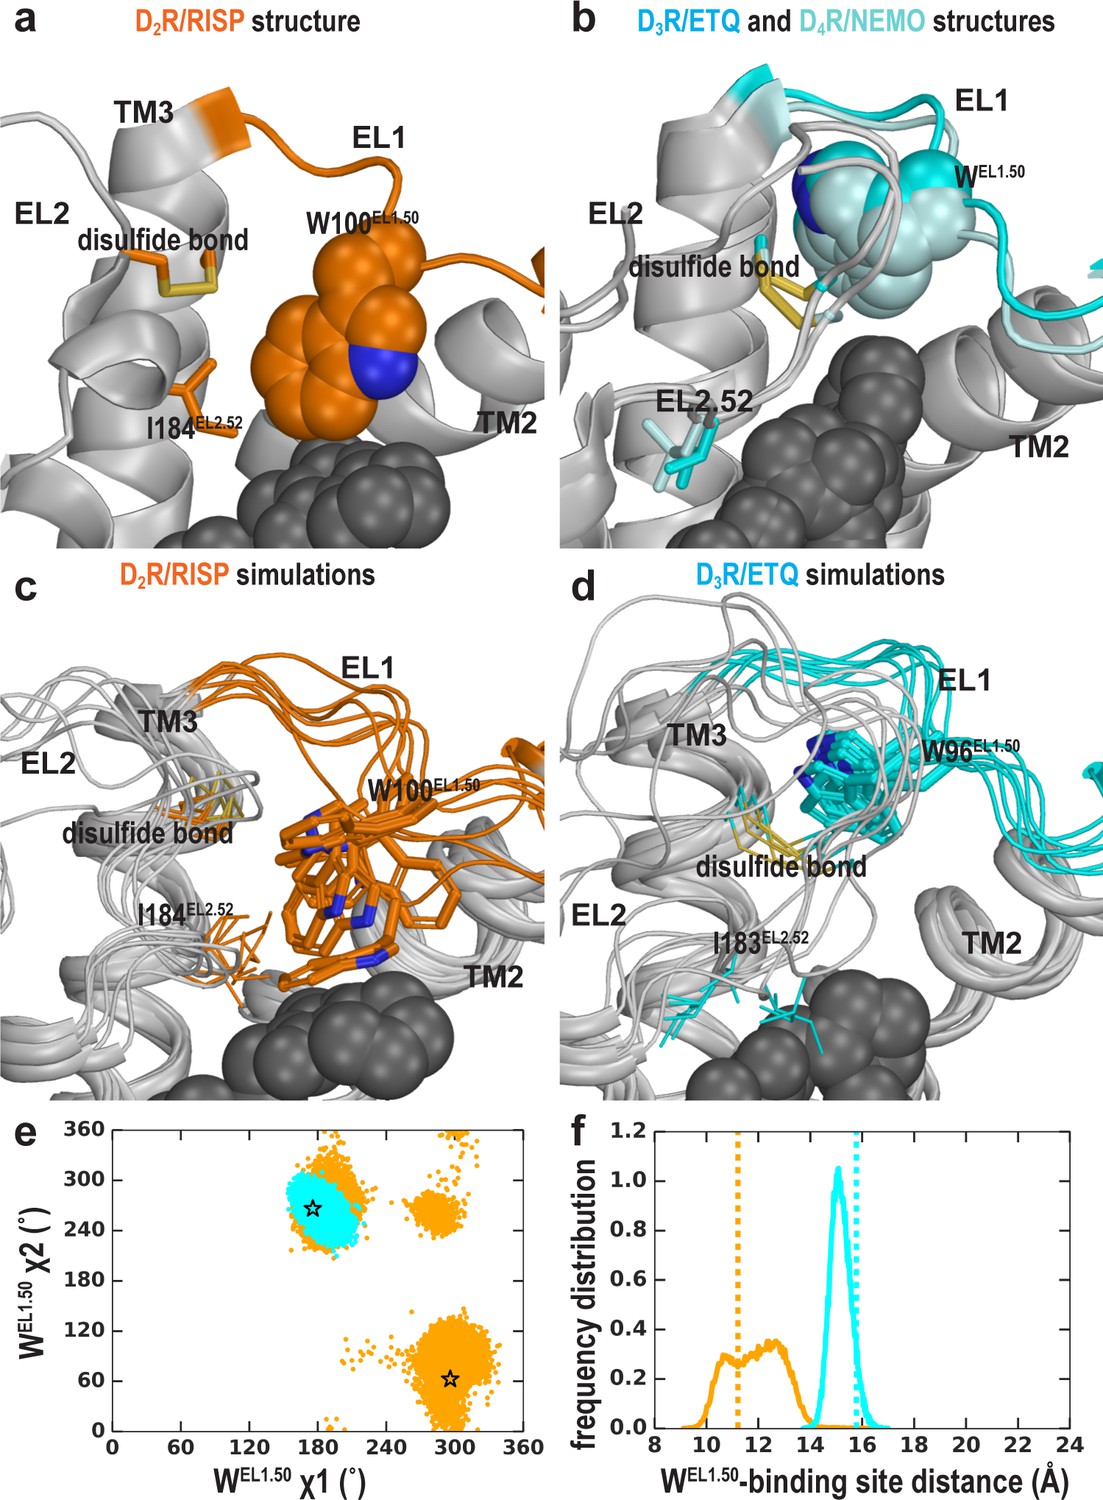
The EL2 conformation affects the EL1 conformation.
Divergent EL1-EL2 interfaces among the D2R (a), D3R, and D4R (b) structures. In the D2R structure, the Trp100EL1.50 in EL1 forms a weak interaction with Ile184EL2.52; while the aligned Trp96EL1.50 of D3R and Trp101EL1.50 in D4R are stabilized by their interactions with the disulfide bond – their passages toward the position of Trp100EL1.50 in D2R are blocked by the extended EL2. In our simulations, Trp100EL1.50 in D2R shows significant flexibility and can adopt multiple positions and orientations in D2R/risperidone (c), while Trp96EL1.50 in D3R is highly stable in D3R/eticlopride (d). (e) The χ1 and χ2 dihedral angles of Trp100EL1.50 in the subset of the D2R/risperidone simulations in which EL2 is still in a helical conformation (orange), are more widely distributed than those of Trp96EL1.50 in the D3R/eticlopride simulations in which EL2 remains in extended conformations (cyan). These dihedral angle values in the D2R and D3R structures are indicated with the orange and cyan stars, respectively. (f), For the same two sets of simulations in e, the distance between the center of mass (COM) of the sidechain heavy atoms of Trp100 in D2R and the COM of the Cα atoms of the ligand-binding site residues (excluding Trp100, see Materials and methods for the list of the residues) has wider distributions than the corresponding distance between Trp96EL1.50 in D3R and its ligand binding site. These distances in the D2R and D3R structures are indicated with the orange and cyan dotted lines, respectively.
Figure 6—figure supplement 1
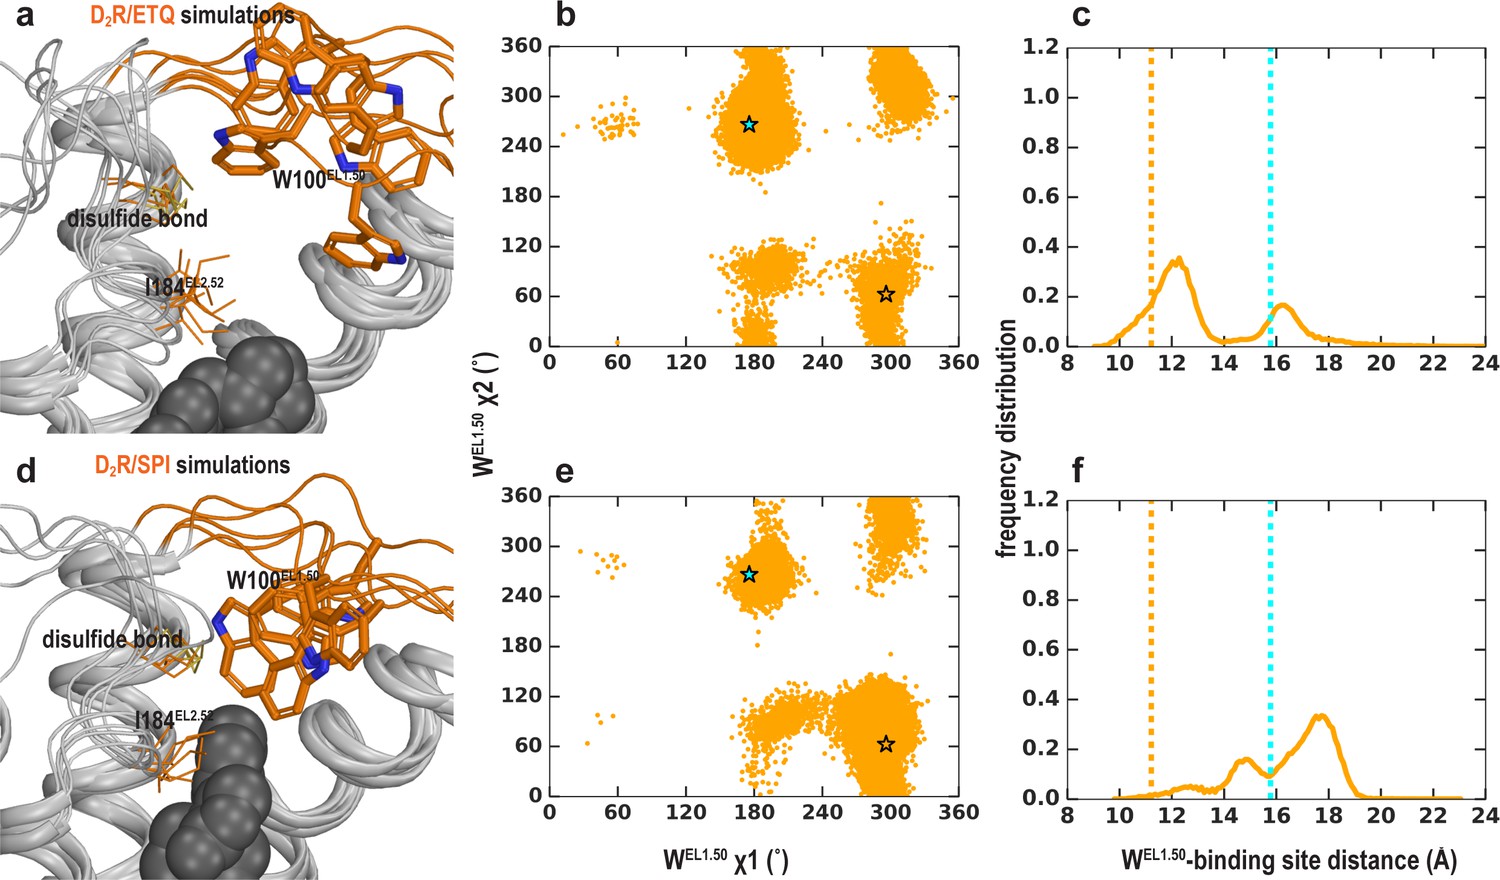
EL1 is dynamic in the D2R/eticlopride and D2R/spiperone simulations when EL2 is helical.
Trp100 shows significant flexibility and can adopt multiple positions and orientations in D2R/eticlopride (a–c) and D2R/spiperone (d–f) simulations. Their χ1 and χ2 dihedral angles of Trp100 (b, e) and the distance between Trp100 and the ligand binding site (c, f) have wide and different distributions. These dihedral angle values in the D2R and D3R structures are indicated with the orange and cyan stars, respectively. The distances in the D2R and D3R structures are indicated with the orange and cyan dotted lines, respectively.
Figure 6—figure supplement 2

TrpEL1.50 is closely associated with Leu2.64 regardless of the EL2 conformation.
In the D2R structure (a), the Trp100EL1.50 in EL1 forms a weak interaction with Ile184EL2.52 when EL2 is helical, while the aligned Trp96EL1.50 in the D3R structure does not form such an interaction with Ile183EL2.52 and is stabilized by their interactions with the disulfide bond of the extended EL2 (b). In both structures, Trp100EL1.50 is in close association with Leu2.64.
Figure 7
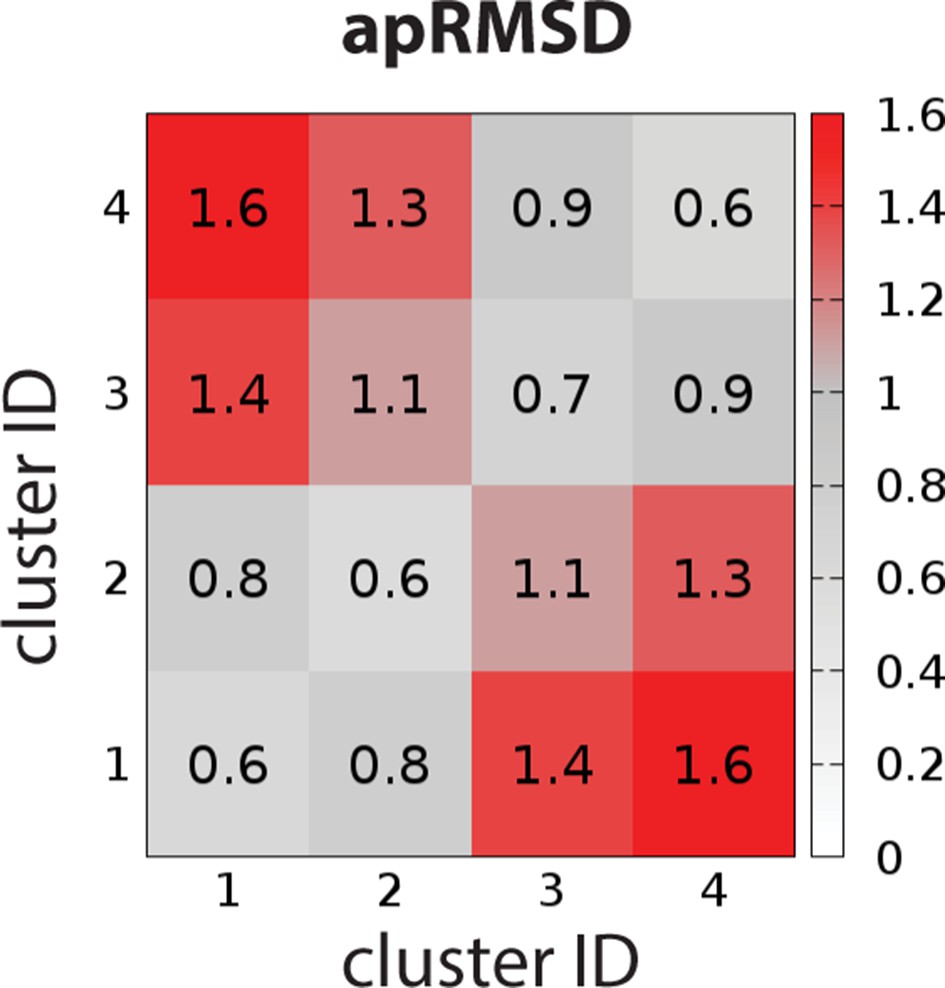
The average pairwise RMSDs of the clusters of the OBS conformations.
The clustering level was chosen to be 4, so that the average pairwise RMSDs (apRMSDs) between the D2R/eticlopride clusters (1 and 2, see Table 4 for the composition of each cluster) and D2R/risperidone clusters (3 and 4) are similar to that between D2R and D3R structures (1.2 Å), while all the apRMSDs within a cluster are smaller than those between any given two clusters.
Videos
Video 1
A movie of a 4.2 µs D2R/risperidone trajectory collected using the OPLS3e force field shows spontaneous unwinding of EL2.
The conformation of EL2 gradually transitions to an extended configuration similar to that in the D3R structure. See Figure 5—figure supplement 2 for the pathway of unwinding. Note that the extended conformation of EL2 stabilizes Trp100EL1.50. The Cα atom of Gly173EL2.37, the sidechains of Trp100EL1.50, Ile183EL2.51, and Ile184EL2.52 and the bound risperidone are shown as spheres. Asp1083.26 and the disulfide bond between Cys1073.25 and Cys182EL2.50 are shown as sticks. The carbon atoms of Gly173EL2.37 and Ile184EL2.52 are colored in cyan, those of Ile183EL2.51 are in green, those of Trp100EL1.50, Cys1073.25, Asp1083.26, Asn175EL2.39, and Cys182 EL2.50 are in dark gray; those of the bound ligand risperidone are in orange.
Video 2
A movie of a 4.2 µs D2R/eticlopride trajectory shows the dynamics of Trp100EL1.50 when the C-terminal portion of EL2 is in a helical conformation.
Note that Trp100EL1.50 can be stabilized by interacting with the disulfide bond. The presentation and color scheme are similar to those in Video 1, except that the bound carbon atoms of the ligand eticlopride are colored in cyan.
Video 3
A movie of a 3.6 µs D2R/eticlopride trajectory collected using the CHARMM36 force field shows another example of unwinding of EL2.
Thus, considering the similar unwinding pathway as that in Video 1 (Figure 5—figure supplement 2), the unwinding does not depend on the force field used in the simulations or the identity of the antagonist bound in the OBS. Note the sidechain of Asn175EL2.39 rotates inward and approaches Asp1083.26 in this trajectory. The presentation and color scheme are the same as those in Video 2.
Video 4
A movie of a 4.5 µs D2R/risperidone trajectory shows the N-terminal portion of EL2 can transition into a helical conformation when the C-terminal portion is extended.
This is a novel EL2 conformation that has not been revealed by the D2R, D3R or D4R structures but similar to those in the 5-HT2AR/risperidone (Figure 5—figure supplement 4f), β1AR and β2AR structures. The presentation and color scheme are the same as those in Video 1.
Tables
Table 1
Summary of molecular dynamics simulations.
| Receptor | Ligand | Bound na+ | Number of OPLS3e trajectories | Number of CHARMM36 trajectories | Accumulated simulation time (ns) |
|---|---|---|---|---|---|
| D2R | Risperidone | + | 12 | 28410 | |
| - | 11 | 42240 | |||
| Spiperone | + | 22 | 42000 | ||
| - | 17 | 29550 | |||
| Eticlopride | + | 5 | 12 | 51540 | |
| - | 7 | 11280 | |||
| (-)-Sulpiride | + | 3 | 4500 | ||
| - | 3 | 3600 | |||
| Aripiprazole | + | 40 | 66660 | ||
| D3R | Eticlopride | + | 3 | 13200 | |
| - | 4 | 6240 | |||
| R22 | + | 7 | 33600 | ||
| S22 | - | 7 | 59400 | ||
| Total | 120 | 33 | 392220 | ||
Table 2
The effect of mutations on the binding affinities of selected D2R ligands.
The affinities of [3H]spiperone were determined in saturation experiments at WT or mutant SNAP-tagged D2SRs stably expressed in FlpIn CHO cells. Binding affinity values for risperidone and eticlopride were obtained in competition binding experiments. Means of n independent experiments performed in triplicate are shown with 95% confidence intervals.
| [3H]spiperone saturation binding | [3H]spiperone competition binding | |||||
|---|---|---|---|---|---|---|
| SNAP-D2SR | pKd (Kd, nM) (95% CI) | N | Risperidone pKi (Ki, nM) (95% CI) | N | Eticlopride pKi (Ki, nM) (95% CI) | N |
| WT | 9.74 (0.18) (9.36–10.14) | 3 | 8.55 (2.8) (8.07–9.04) | 8 | 9.84 (0.14) (9.10–10.58) | 3 |
| WT -Na+ | 9.70 (0.20) (9.09–10.32) | 3 | 8.96 (1.1) (8.84–9.08) | 6 | - | |
| I1223.40A | 9.74 (0.18) (9.09–10.38) | 3 | 8.14 (7.9) (7.97–8.32) | 8 | 10.33 (0.04) (10.22–10.44) | 3 |
| I1223.40W | 8.95 (1.15) (8.59–9.30) | 3 | 7.43 (37) (7.11–7.75) | 5 | 9.61 (0.25) (9.33–9.89) | 4 |
Table 3
The effect of mutations on the binding affinities of selected D2R ligands as determined in Tr-FRET-binding experiments.
The affinities of the fluorescently labeled spiperone derivative (Spiperone-d2) or unlabeled antagonists were determined in saturation experiments at WT or mutant SNAP-tagged D2SRs stably expressed in FlpIn CHO cells. Binding affinity values for risperidone and eticlopride were obtained in competition binding experiments. Means of n independent experiments are shown with 95% confidence intervals (CIs).
| Spiperone-d2 saturation binding | Spiperone-d2 competition binding | |||||||||||
|---|---|---|---|---|---|---|---|---|---|---|---|---|
| SNAP-D2SR | pKd (Kd, nM) (95% CI) | N | Mut/WT | Eticlopride pKi (Ki, nM) (95% CI) | N | Mut/WT | Risperidone pKi (Ki, nM) (95% CI) | N | Mut/WT | Spiperone pKi (Ki, nM) (95% CI) | N | Mut/WT |
| WT | 8.54 (2.88) (8.32–8.77) | 9 | 1.0 | 10.06 (0.09) (9.90–10.21) | 8 | 1.0 | 8.47 (3.34) (8.15–8.80) | 7 | 1.0 | 9.96 (0.11) (9.76–10.18) | 8 | 1.0 |
| L94A | 7.71 (19.5) (7.41–8.00)* | 5 | 6.8 | 9.08 (0.83) (8.91–9.23)* | 4 | 9.2 | 8.02 (9.54) (7.86–8.17)* | 5 | 2.9 | 8.36 (4.37) (8.21–8.50)* | 5 | 39.7 |
| W100A | 7.39 (40.7) (7.21–7.56)* | 9 | 14.1 | 8.06 (8.71) (7.78–8.32)* | 4 | 96.8 | 7.60 (25.1) (7.41–7.79)* | 7 | 7.5 | 8.39 (4.07) (8.19–8.59)* | 7 | 37.0 |
| I184A | 8.79 (1.62) (8.58–9.00) | 5 | 0.6 | 9.34 (0.45) (8.94–9.75)* | 4 | 5 | 9.33 (0.47) (9.18–9.48)* | 5 | 0.1 | 9.78 (0.17) (9.51–10.05) | 5 | 1.6 |
-
*=significantly different from WT value, p<0.05, one-way ANOVA with Dunnett’s post-hoc test.
Table 4
Clustering results of the OBS conformations sampled in the D2R/eticlopride and D2R/risperidone simulations.
The compositions in each cluster are shown as percentages of the frames randomly extracted for each complex (see Materials and methods), when sorted by either receptor/ligand complex or EL2 conformation.
| Cluster ID | Percentage (%) | |||||||
|---|---|---|---|---|---|---|---|---|
| Complex | EL2 conformation | |||||||
| D2R/eticlopride | D2R/risperidone | Extended | Helical | |||||
| Mean | Sd | Mean | Sd | Mean | Sd | Mean | Sd | |
| 1 | 38.4 | 0.7 | 0.0 | 0.0 | 4.9 | 0.4 | 33.5 | 0.5 |
| 2 | 61.6 | 0.7 | 0.0 | 0.0 | 45.1 | 0.4 | 16.5 | 0.6 |
| 3 | 0.0 | 0.0 | 43.7 | 1.0 | 2.5 | 0.4 | 41.3 | 0.8 |
| 4 | 0.0 | 0.0 | 56.3 | 1.0 | 47.5 | 0.4 | 8.7 | 0.8 |
Key resources table
| Reagent type (species) or resource | Designation | Source or reference | Identifiers | Additional information |
|---|---|---|---|---|
| Cell line (Cricetulus griseus) | FlpIn CHO | Invitrogen | Cat# R75807 | |
| Transfected construct (human) | SNAP-D2SR | Cisbio | Cat# pSNAPD2 | |
| Transfected construct (human) | D2R GαoA-RLuc8 Gβ1 Gγ2-Venus | Michino et al., 2017 | N/A | |
| Commercial assay or kit | Spiperone-d2 SNAP-Lumi4-Tb 5x SNAP/CLIP labeling medium | Cisbio | Cat# L0002RED Cat# SSNPTBX Cat# LABMED | |
| Chemical compound, drug | Na bisulfite Glucose (+)-Butaclamol Risperidone Haloperidol | Sigma Aldrich | Cat# 243973 Cat# D9434 Cat# D033 Cat# R3030 Cat# H1512 | |
| Chemical compound, drug | Spiperone | Cayman chemicals | Cat# 19769 | |
| Chemical compound, drug | Eticlopride HCl Raclopride (-)-Sulpiride Quinpirole | Tocris Bioscience | Cat# 1847 Cat# 1810 Cat# 0895 Cat# 1061 | |
| Chemical compound, drug | [3H]spiperone | Perkin Elmer | Cat# NET1187250UC | |
| Chemical compound, drug | Polyethylenimine | Polysciences | Cat# 23966 | |
| Chemical compound, drug | Coelenterazine-h | NanoLight Technology | Cat# 301–5 | |
| Software, algorithm | Prism | GraphPad | v7.0 and v8.2.1 |
Additional files
Download links
A two-part list of links to download the article, or parts of the article, in various formats.
Downloads (link to download the article as PDF)
Open citations (links to open the citations from this article in various online reference manager services)
Cite this article (links to download the citations from this article in formats compatible with various reference manager tools)
Distinct inactive conformations of the dopamine D2 and D3 receptors correspond to different extents of inverse agonism
eLife 9:e52189.
https://doi.org/10.7554/eLife.52189


