A sex difference in the response of the rodent postsynaptic density to synGAP haploinsufficiency
- Caltech, United States
- University of Edinburgh, United Kingdom
- Centre for Brain Development and Repair, India
Figures
Figure 1
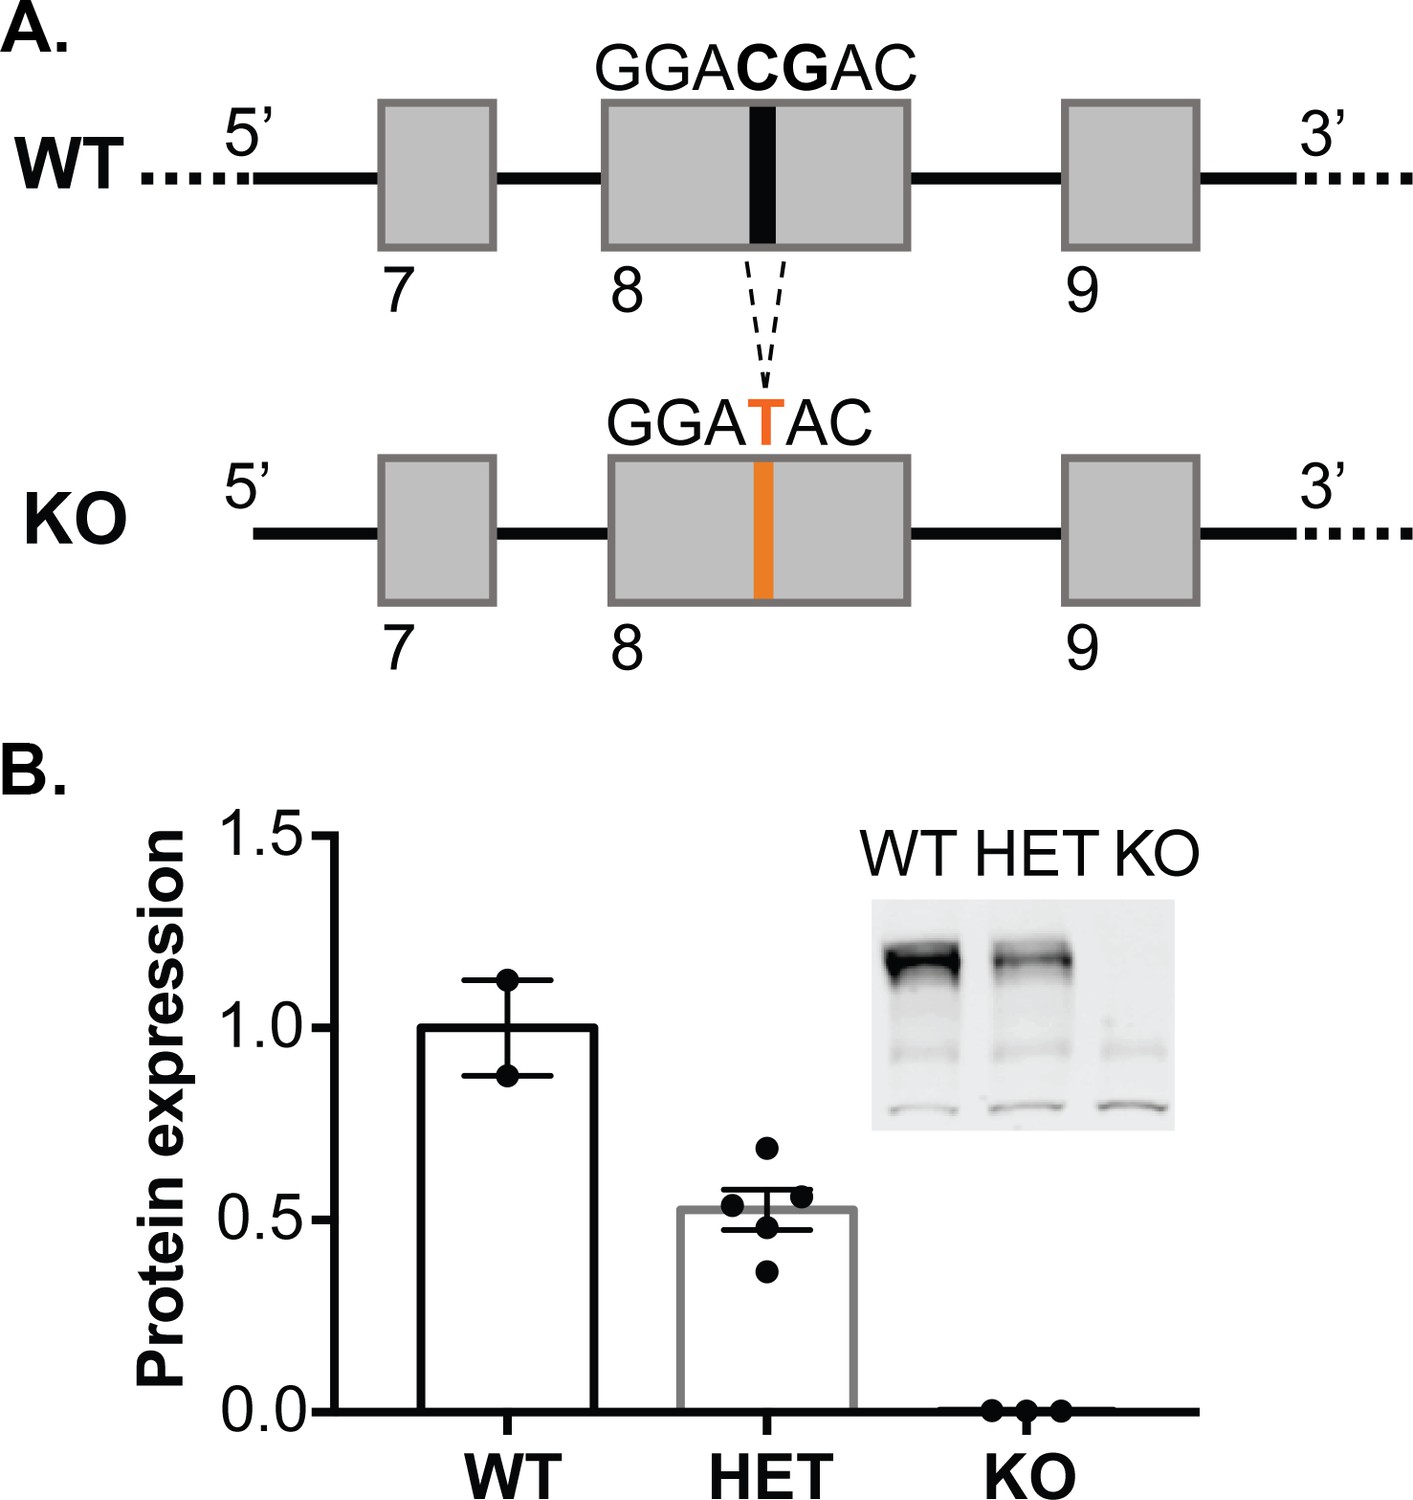
Generation of synGAP null rats.
(A) SynGAP targeting strategy introduces a frame shift mutation into exon 8. (B) Quantification of synGAP immunoblots (inset) of cortical homogenates was performed as described in Materials and methods.
Figure 2 with 1 supplement
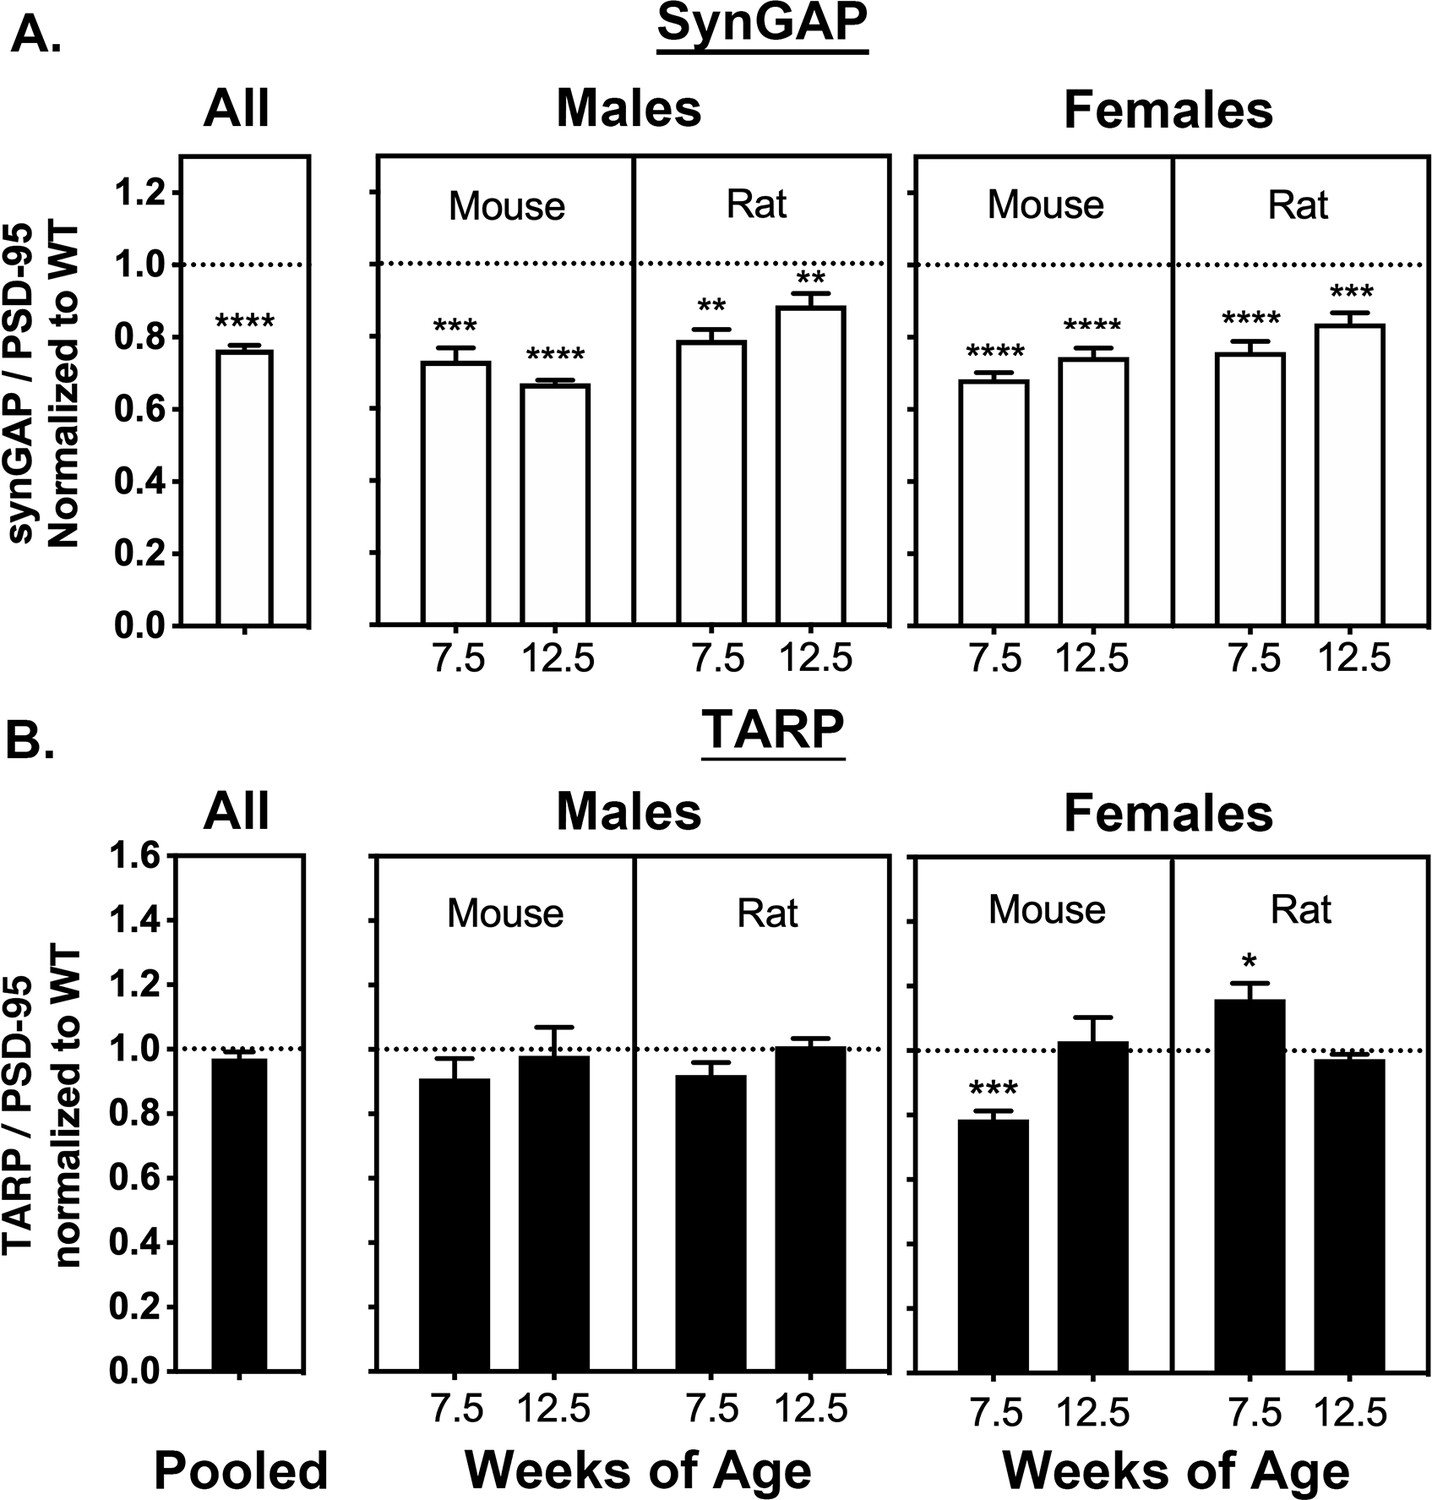
Averaged ratios of synGAP and TARPs to PSD-95 in PSDs from WT and HET Rats and Mice.
PSDs were purified from the brains of individual animals as described under Materials and methods. The ratios of synGAP to PSD-95 (A) and TARPs to PSD-95 (B) were determined as described under Materials and methods and in Figure 2—figure supplement 1. Ratios from HET animals (bars) are normalized to the ratios from WT animals (dotted lines). Antibodies against synGAP, TARPS, and PSD-95 are the same as those used in Walkup et al. (2016). The antibody against synGAP (AB_2287112) recognizes all isoforms of synGAP. The antibody against TARPs (AB_877307) recognizes TARP-γ2, γ3, γ4, and γ8. The sample sizes for each group and the significance tests are as follows. A) all animals WT = 79 and HET = 78, one-tailed Wilcoxon matched-pairs signed rank test; male mouse 7.5 weeks WT = 11 and HET = 9, one-tailed Student T-test; male mouse 12.5 weeks WT = 11 and HET = 8, one-tailed Student T-test with Welch’s correction; male rat 7.5 weeks WT = 11 and HET = 10, one-tailed Student T-test; male rat 12.5 weeks WT = 10 and HET = 11, one-tailed Student T-test; female mouse 7.5 weeks WT = 10 and HET = 12, one-tailed Student T-test with Welch’s correction; female mouse 12.5 WT = 9 and HET = 9, one-tailed Student T-test; female rat 7.5 weeks WT = 10 and HET = 10, one-tailed Student T-test; female rat 12.5 weeks WT = 9 and HET = 10, one-tailed Student T-test. B) all animals WT = 77 and HET = 80, two-tailed Wilcoxon matched-pairs signed rank test; male mouse 7.5 weeks WT = 10 and HET = 9, two-tailed Student T-test; male mouse 12.5 weeks WT = 10 and HET = 10, two-tailed Mann Whitney test; male rat 7.5 weeks WT = 10 and HET = 10, two-tailed Student T-test; male rat 12.5 weeks WT = 10 and HET = 1, two-tailed Student T-test; female mouse 7.5 weeks WT = 9 and HET = 10, two-tailed Student T-test; female mouse 12.5 WT = 9 and HET = 10, two-tailed Mann Whitney test; female rat 7.5 weeks WT = 10 and HET = 10, two-tailed Student T-test; female rat 12.5 weeks WT = 9 and HET = 10, two-tailed Student T-test with Welch’s correction. Significance: * for p≤0.05, ** for p≤0.01, *** for p≤0.001, and **** for p≤0.0001.
Figure 2—figure supplement 1
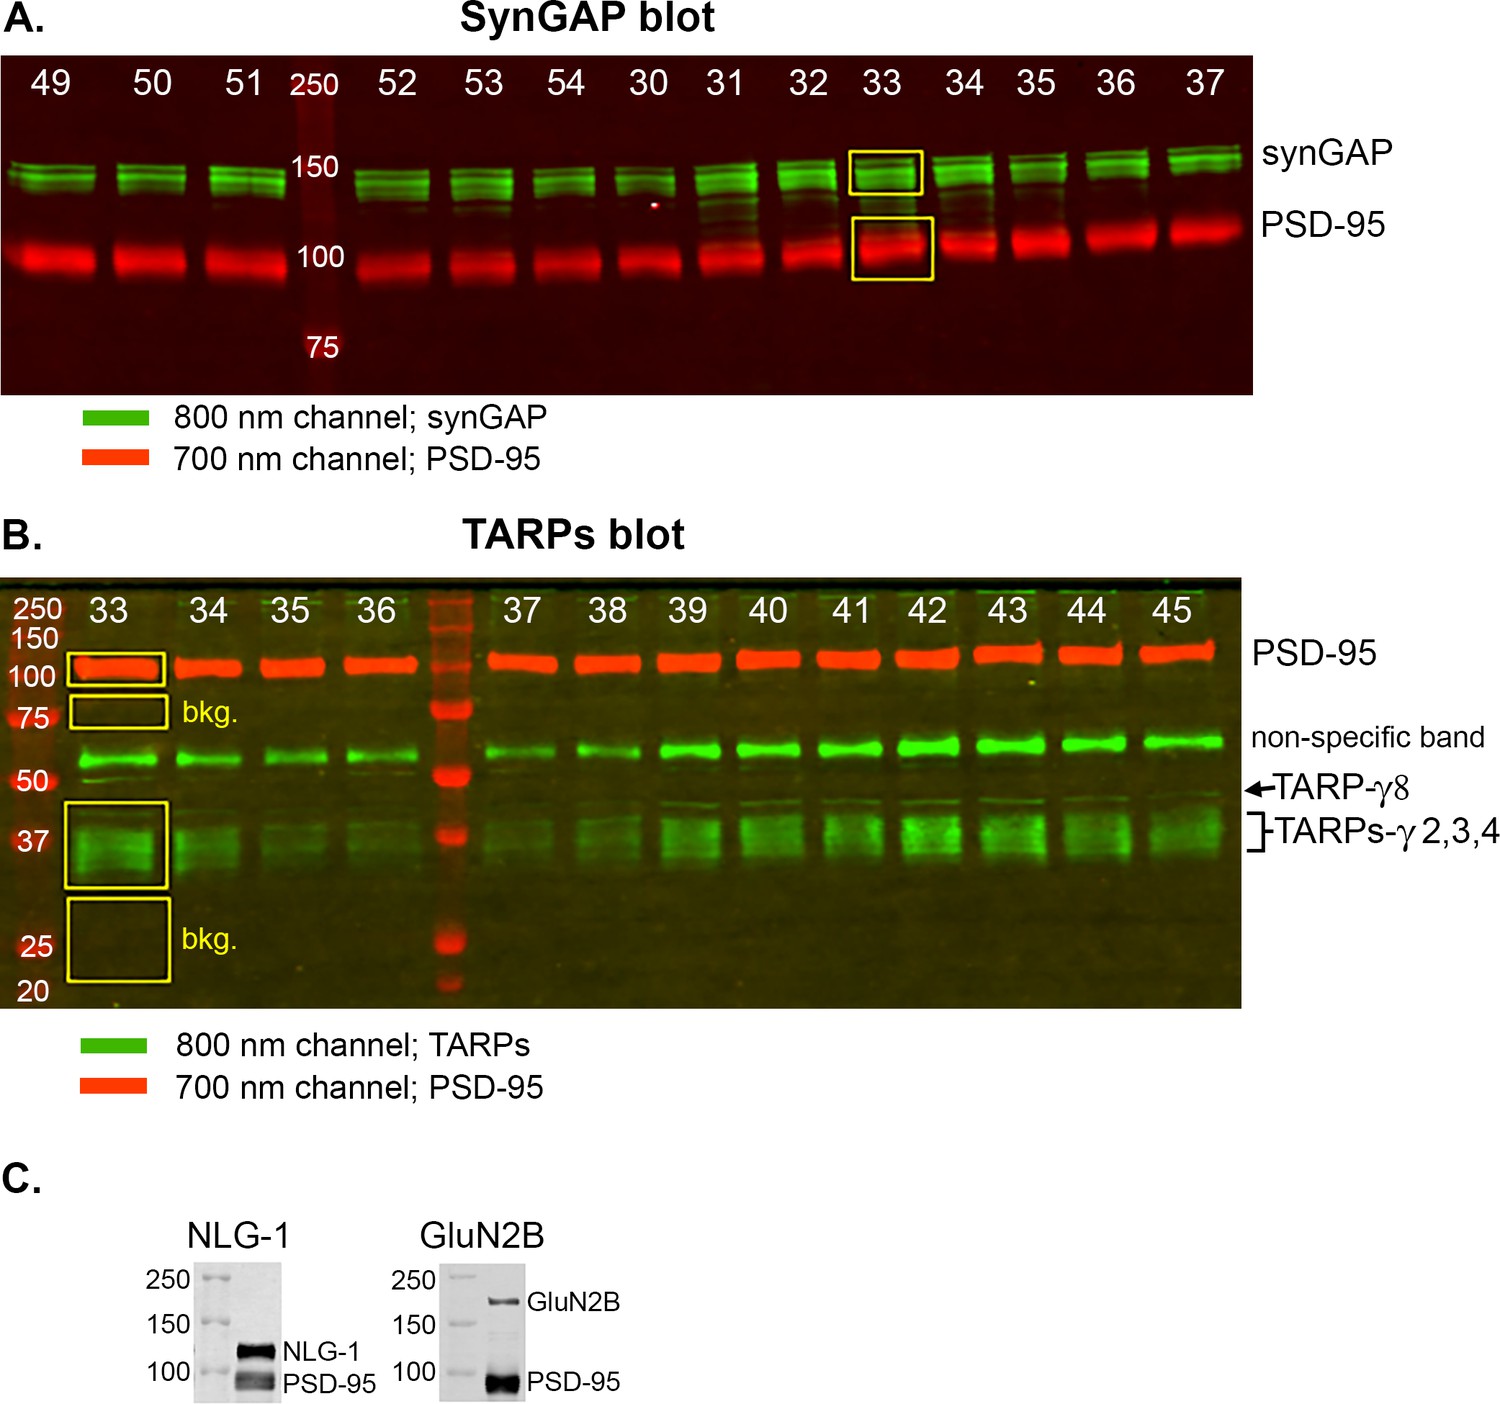
Measurement of densities and calculation of ratios.
(A) Example of an immunoblot that was double-stained for synGAP and PSD-95 as described under Materials and methods. (B) Example of an immunoblot that was double-stained for TARPs and PSD-95 as described under Materials and methods. The numbers at the top of each lane identify samples from individual rodents. The fluorescent signals at 700 and 800 nm on double-stained blots were scanned separately on the LiCor Odyssey scanner and stored in separate files. The figure is a superposition of images of the two scans. The brightness of each image was adjusted to provide the most accurate visual appearance. The LiCor system has two important advantages; adjustment of the brightness and contrast of images does not alter the underlying digital data; and the digital data can be recorded over a very large linear range. The images show examples of ‘regions of interest (ROI)’ placed with LiCor software on each of the four underlying digital files. Digital fluorescence densities within each ROI were recorded and transferred to Excel. To record background densities We used similarly sized boxes placed immediately below the target fluorescent bands. The bkg. boxes are shown only in B) to avoid visual confusion, but were recorded for all signals. (C) Specificity of antibodies for neuroligin-1 and GluN2B. For staining of synGAP, TARPS, and neuroligin-2, we used the same antibodies that were documented in Walkup et al. (2016). However, we used a different antibody to label NLG-1 (rabbit anti-NLG-1 (Synaptic Systems 129013 AB_2151646) and to label GluN2B we used rabbit anti-GluN2B). The figure shows blots of PSD fractions souble-labeled with anti-PSD-95 and these last two antibodies, to document their specificity.
Figure 3 with 3 supplements
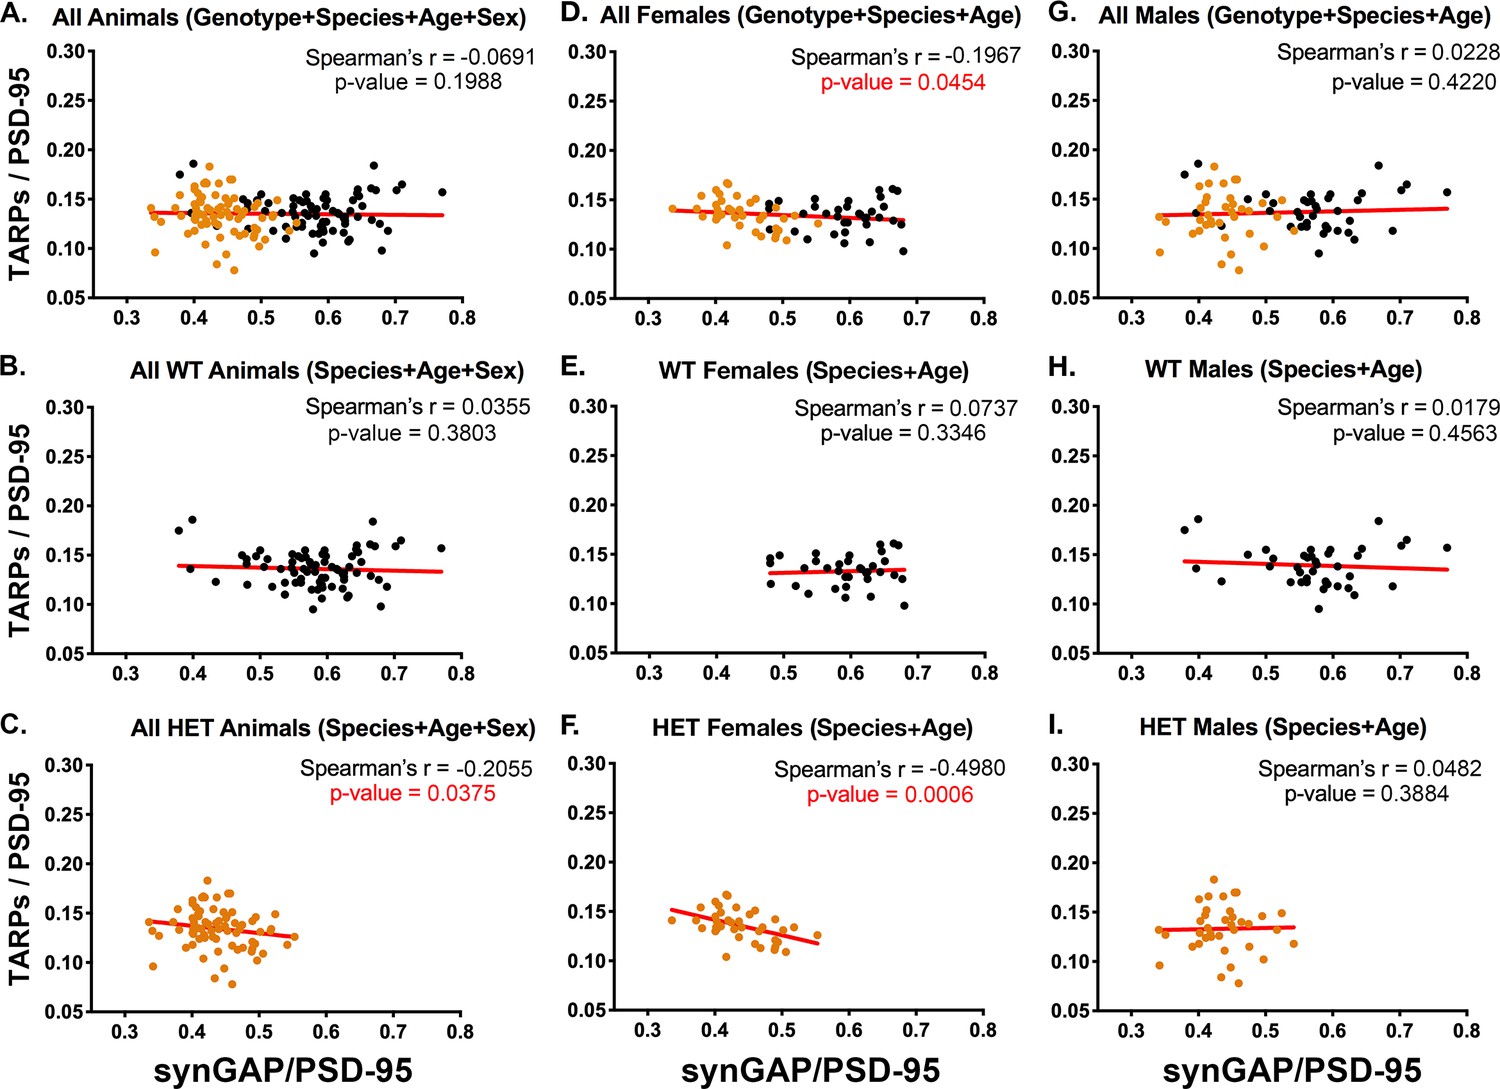
Correlation of the ratios TARPs/PSD-95 and synGAP/PSD-95 among individual animals.
Each point represents mean ratios for a single animal. Corrected ratios and Spearman’s rank correlation coefficients were determined as described under Materials and methods. (A) All animals, including all genotypes, ages, species, and sexes; n = 152. (B) All WT animals, including all ages, species, and sexes; n = 76. (C) All HET animals, including all ages, species, and sexes; n = 76. (D) All female animals, including all genotypes, ages, and species; n = 75. (E) All WT females including all ages and species; n = 36. (F) All HET females, including all ages and species; n = 39. (G) All male animals, including all genotypes, ages, and species; n = 77. (H) All WT males, including all ages and species; n = 40. (I) All HET males, including all ages and species; n = 37. Black symbols, WT; Orange symbols, HET. P-values for Spearman’s rank correlation coefficient are one-tailed. Significant p-values are shown in red.
Figure 3—figure supplement 1
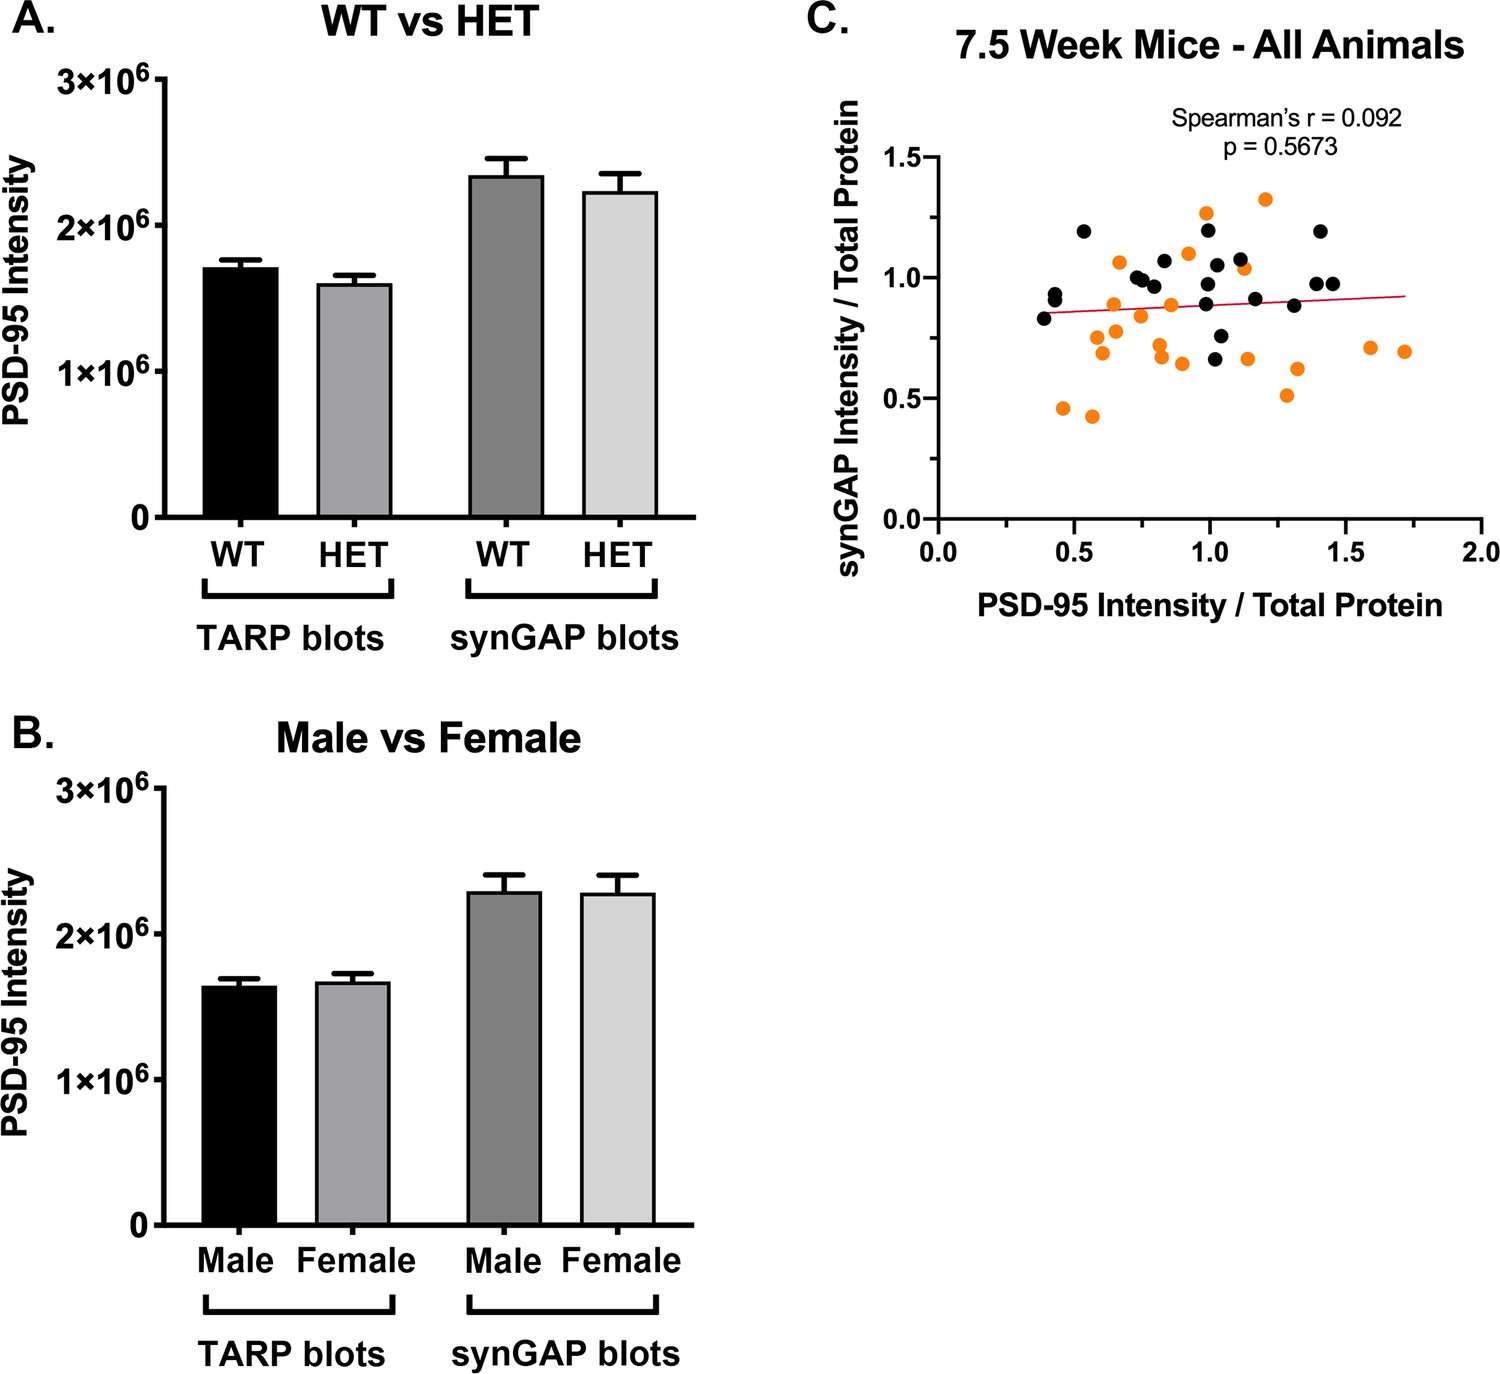
Intensity of PSD-95 bands on immunoblots.
Blots were double-stained for PSD-95 and the target proteins as described under Materials and methods. SynGAP, GluN2B, NLG-1 and NLG-2 were fractionated on 8% gels. TARPS were fractionated on 12% gels. The averaged intensity of staining of PSD-95 was not statistically different between WT and HET (A) or between Male and Female (B), measured on blots of 8% or 12% gels. (C) For each set of blots, a separate gel of the same individual samples was stained for protein with Coomassie blue. For the blots of 7.5 week old mice, synGAP intensity was divided by Coomassie intensity for each individual. PSD-95 intensity (from blots double stained for TARP) was divided by Coomassie intensity for each individual. Plots of synGAP intensity against PSD-95 intensity revealed no significant correlation between the two values. This data shows that the correlation between the synGAP/PSD-95 ration and the TARP/PSD-95 ratio in 7.5 week mice was not influenced by a correlation between levels of synGAP and PSD-95. Separate plots of data from 7.5 week old HET female mice, in which the largest correlation between synGAP and TARP was observed, produced a Spearman’s r = −0.0.2069 with p=0.5187. Plots of data for 7.5 week old male mice also showed no significant correlation.
Figure 3—figure supplement 2
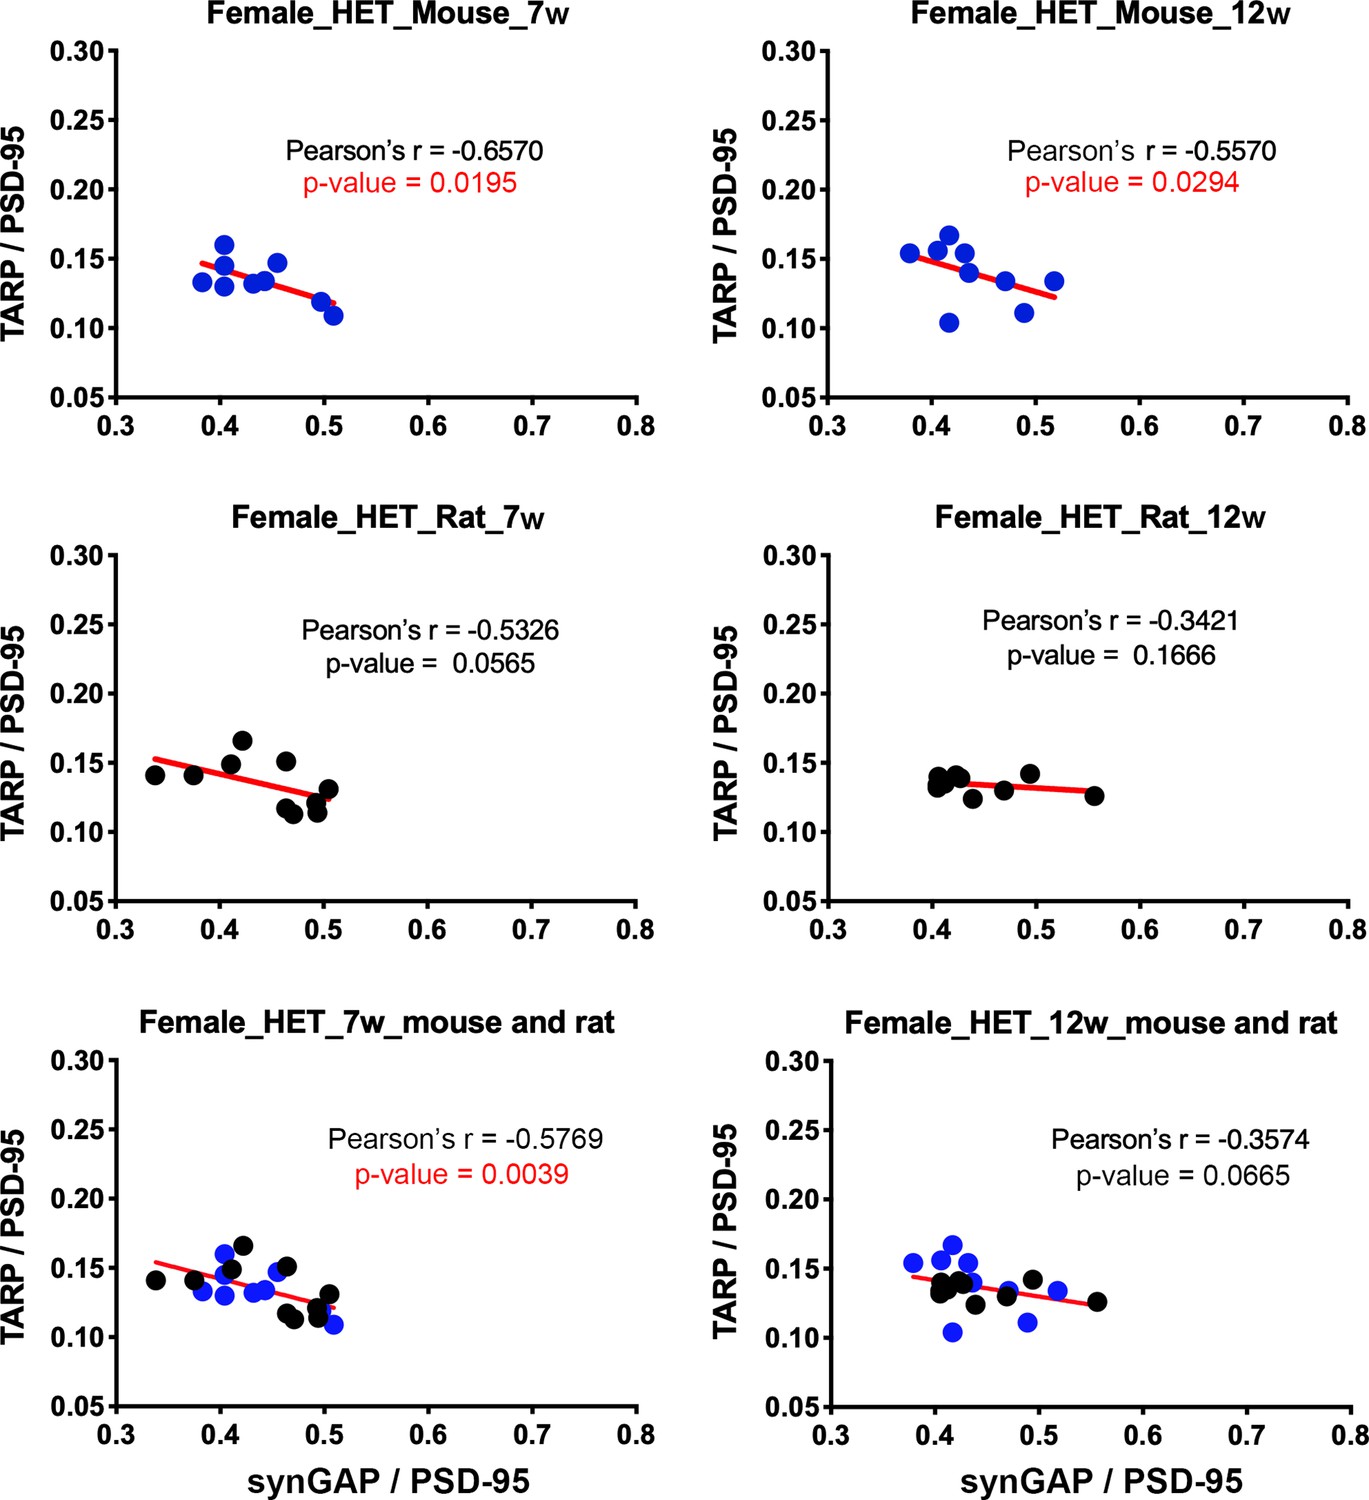
Correlation analysis between synGAP/PSD-95 and TARP/PSD-95 for data from 7 and 12 week old female mice and rats.
Data was acquired as described under Materials and methods and in Figure 3. The small individual data sets indicated in the headings of each panel were normal in distribution. Therefore, Pearson’s r, the parametric equivalent of the non-parametric Spearman’s coefficient, was calculated for each set. (A) A significant inverse correlation was found for 7 and 12 week old female mice, and a strong trend was present for 7 and 12 week old female rats.
Figure 3—figure supplement 3
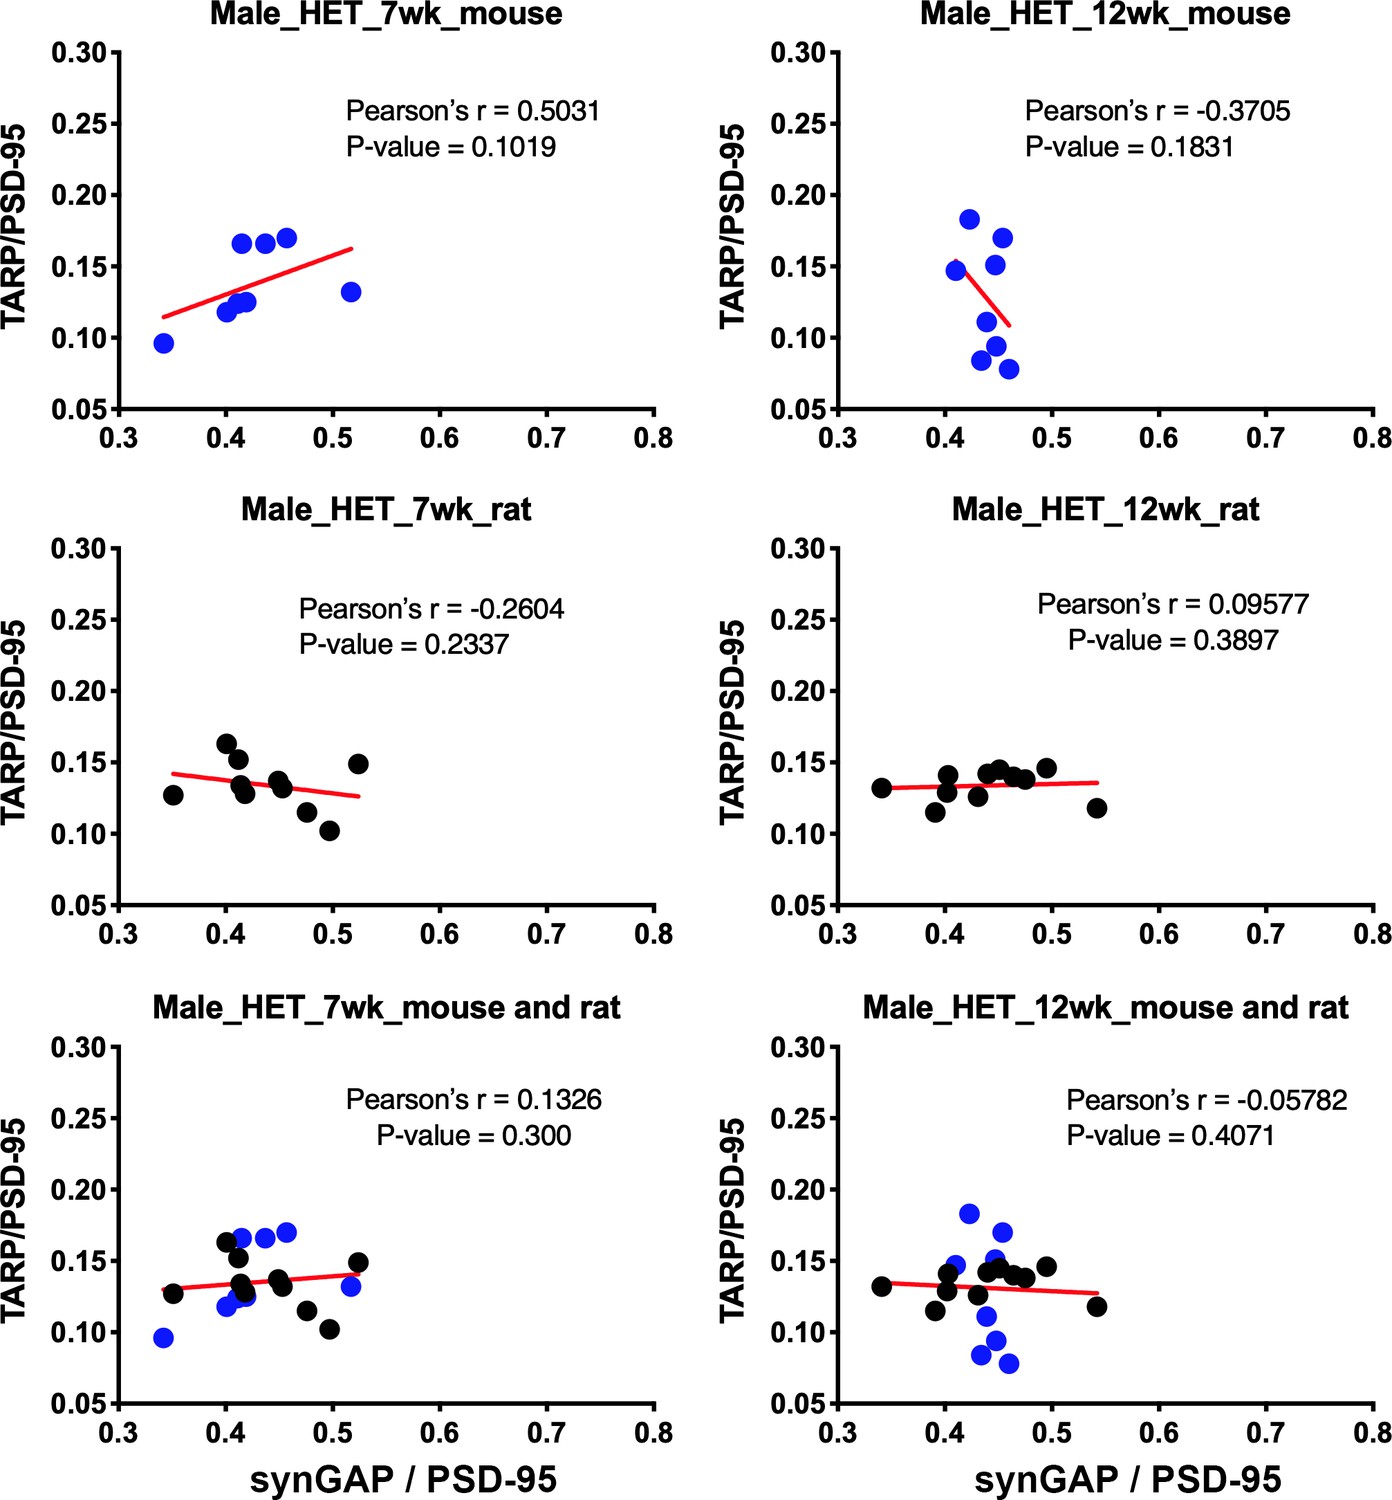
Correlation analysis between synGAP/PSD-95 and TARP/PSD-95 for data from 7 and 12 week old male mice and rats.
Data was acquired and analyzed as described for Figure 3—figure supplement 2. None of the data sets containing only males showed a significant inverse correlation between levels of TARPs and levels of synGAP. Data from HET mice are shown in blue; data from WT mice are shown in black.
Figure 4
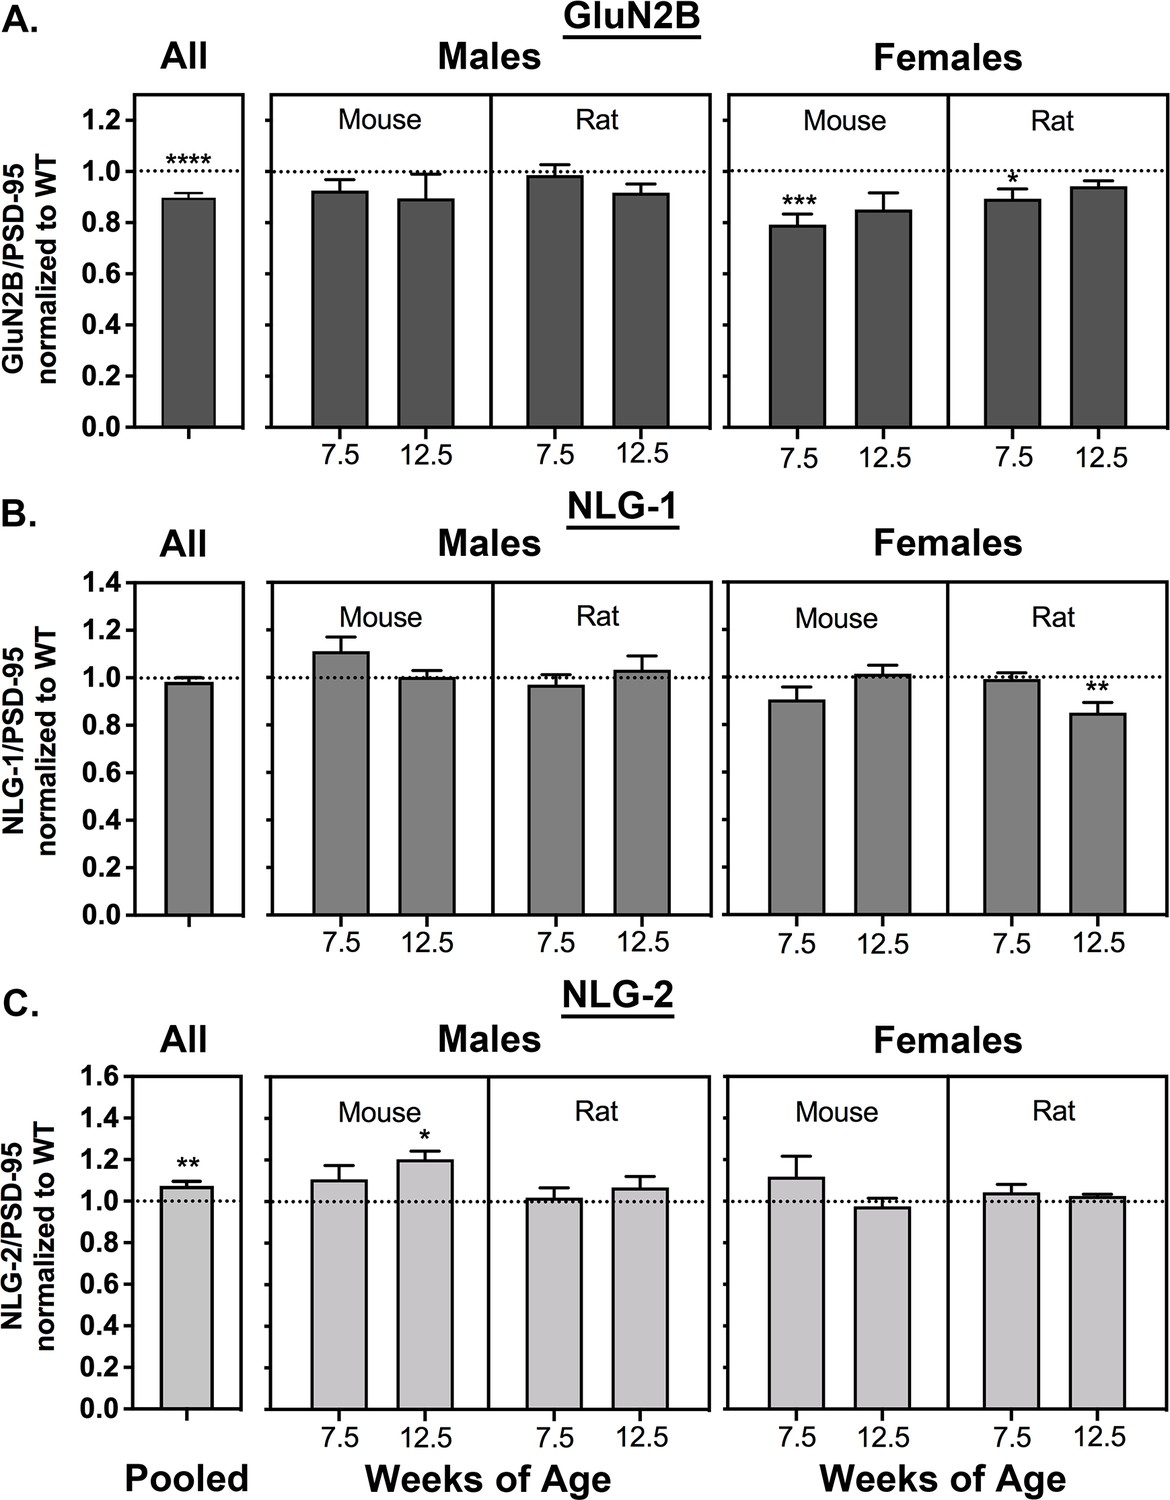
Averaged ratios of GluN2B, NLG1, and NLG-2 to PSD-95 in mice and rat syngap1 HETs.
PSDs were purified as in Figure 2. Ratios were determined as described under Materials and methods. Ratios from HET animals (bars) are normalized to the ratios from WT animals (dotted lines). (A) GluN2B/PSD-95. Sample sizes and significance tests are as follows: all animals WT = 81 and HET = 82, two-tailed Wilcoxon matched-pairs signed rank test; male mouse 7.5 weeks WT = 11 and HET = 10, two-tailed Student T-test; male mouse 12.5 weeks WT = 11 and HET = 10, two-tailed Student T-test; male rat 7.5 weeks WT = 11 and HET = 10, two-tailed Student T-test; male rat 12.5 weeks WT = 10 and HET = 11, two-tailed Student T-test; female mouse 7.5 weeks WT = 10 and HET = 12, two-tailed Student T-test; female mouse 12.5 WT = 9 and HET = 9, one-tailed Student T-test; female rat 7.5 weeks WT = 9 and HET = 10, two-tailed Student T-test with Welch’s correction; female rat 12.5 weeks WT = 9 and HET = 9, two-tailed Student T-test with Welch’s correction. (B) NLG-1/PSD-95. Sample sizes and significance tests are as follows: all animals WT = 81 and HET = 83, two-tailed Wilcoxon matched-pairs signed rank test; male mouse 7.5 weeks WT = 10 and HET = 10, two-tailed Student T-test; male mouse 12.5 weeks WT = 11 and HET = 10, two-tailed Student T-test; male rat 7.5 weeks WT = 11 and HET = 10, two-tailed Student T-test; male rat 12.5 weeks WT = 10 and HET = 11, two-tailed Student T-test; female mouse 7.5 weeks WT = 10 and HET = 12, two-tailed Student T-test; female mouse 12.5 WT = 10 and HET = 10, two-tailed Student T-test; female rat 7.5 weeks WT = 10 and HET = 11, two-tailed Mann-Whitney test; female rat 12.5 weeks WT = 9 and HET = 10, two-tailed Student T-test with Welch’s correction. (C) NLG-2/PSD-95. Sample sizes and significance tests are as follows: all animals WT = 79 and HET = 79, one-tailed Wilcoxon matched-pairs signed rank test; male mouse 7.5 weeks WT = 10 and HET = 10, one-tailed Student T-test; male mouse 12.5 weeks WT = 11 and HET = 10, one-tailed Student T-test; male rat 7.5 weeks WT = 11 and HET = 10, one-tailed Student T-test; male rat 12.5 weeks WT = 10 and HET = 11, one-tailed Student T-test; female mouse 7.5 weeks WT = 9 and HET = 12, one-tailed Student T-test with Welch’s correction; female mouse 12.5 WT = 10 and HET = 9, one-tailed Student T-test; female rat 7.5 weeks WT = 9 and HET = 10, one-tailed Student T-test; female rat 12.5 weeks WT = 9 and HET = 8, one-tailed Student T-test with Welch’s correction. Significance: * for p≤0.05, ** for p≤0.01, *** for p≤0.001, and **** for p≤0.0001.
Figure 5
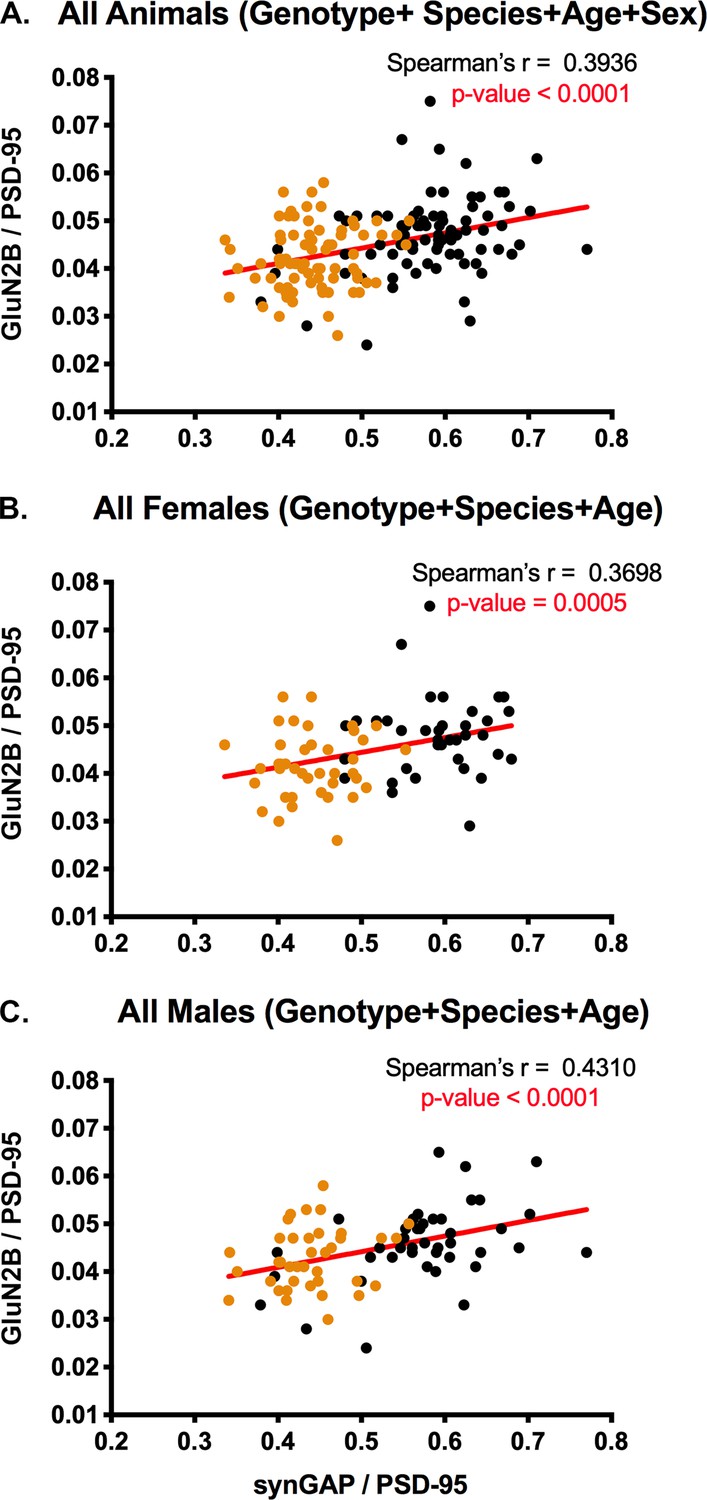
Correlation of the ratios GluN2B/PSD-95 and synGAP/PSD-95 in individual animals.
Each point represents a single animal. Black, WT; Orange, HET. (A) All animals including all genotypes, ages, species, and sexes. n = 158. (B) All female animals, including all genotypes, ages, and species. n = 77. C) All male animals, including all genotypes, ages, and species. n = 81. P-values for Spearman’s rank correlation coefficient are one-tailed. Significant p-values are shown in red.
Figure 6
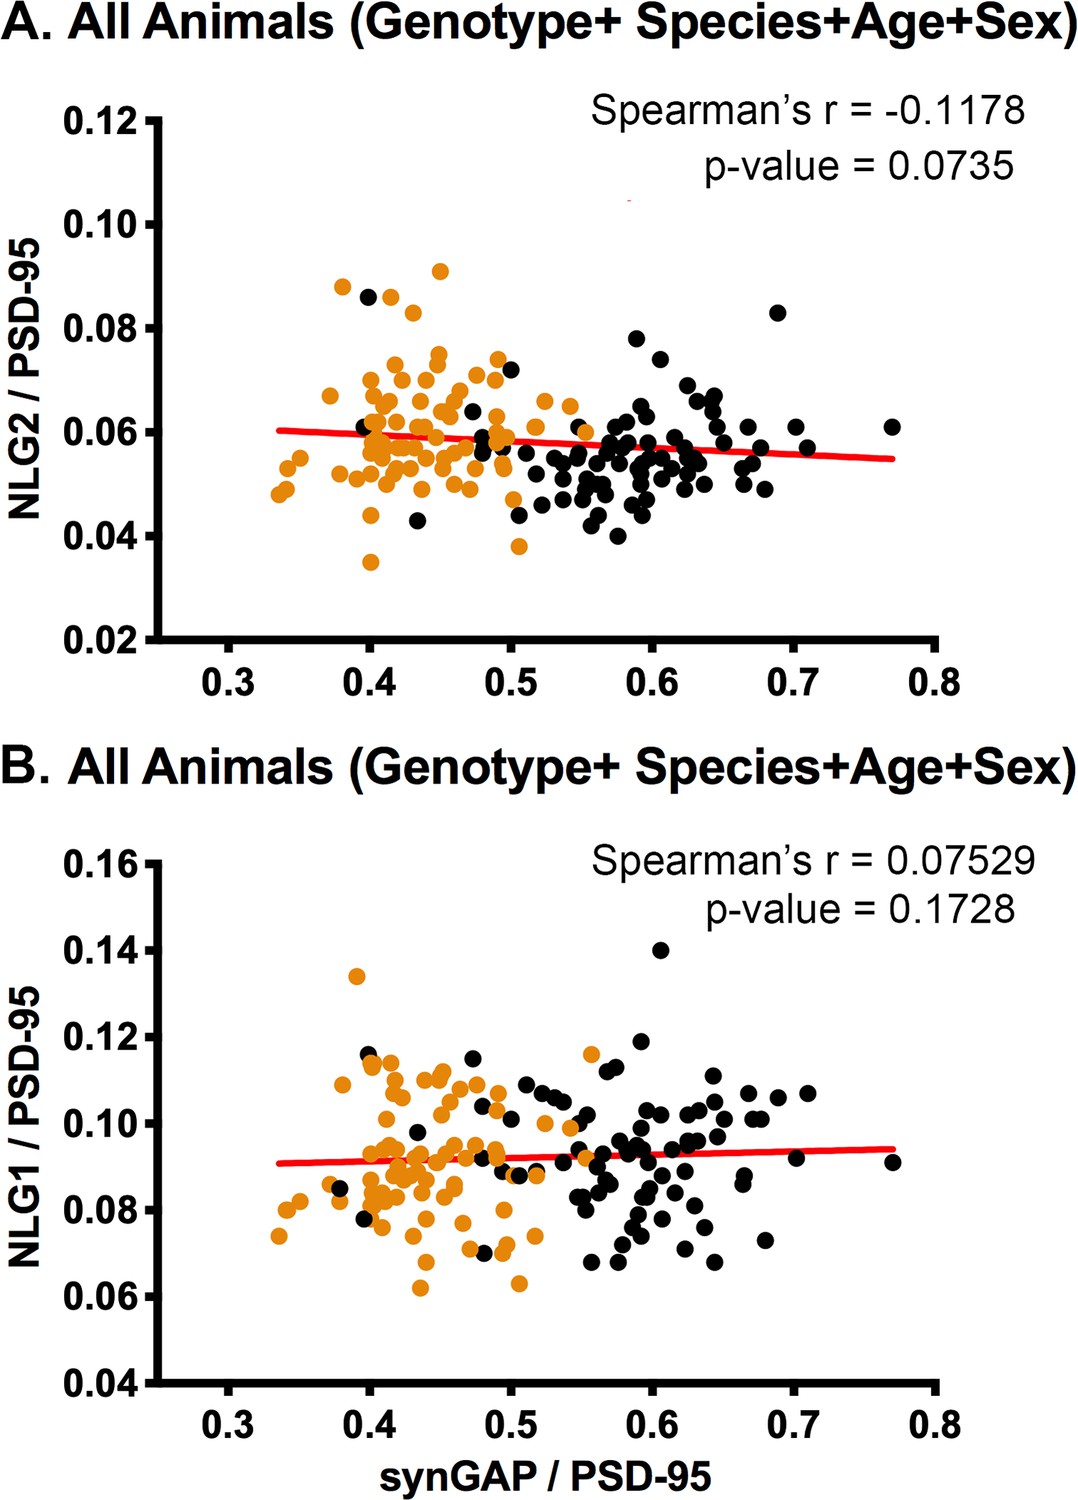
Correlation of the ratios of NLG-2/PSD-95 or NLG-1/PSD-95 and synGAP/PSD-95 for individual animals.
Each point represents a single animal. Black, WT; Orange, HET. (A) Correlation of NLG-2/PSD-95. All animals, including all genotypes, ages, species, and sexes. n = 153. (B) Correlation of NLG-1/PSD-95. All animals, including all genotypes, ages, species, and sexes. n = 159. P-values of Spearman’s rank correlation coefficient indicate no significant correlation.
Tables
Key resources table
| Reagent type (species) or resource | Designation | Source or reference | Identifiers | Additional information |
|---|---|---|---|---|
| Strain, strain background (Mus musculus) | Syngap1 KO mouse | Vazquez et al., 2004 | C57BL/6 | |
| Strain, strain background (Rattus norvegicus) | Syngap1 KO rat; LE-Syngap1em1/PWC | SAGE Labs, Sigma-Aldrich | Syngap1em1/PWC | CRISPR/Cas9 based genome targeting exon 8 |
| Antibody | anti-PSD-95 (Mouse monoclonal) | Caltech Monoclonal Antibody Facility | 50% ammonium sulfate cut of Ascites fluid of 7E3-1B8; AB_212825 | WB (1:10,000) |
| Antibody | anti-synGAP (Rabbit polyclonal) | Pierce | PA1-046; AB_2287112 | WB (1:3,500) |
| Antibody | anti-TARP (Rabbit polyclonal) | EDM Millipore | Ab9876; AB_877307 | WB (1:300) |
| Antibody | anti-GluN2B (Rabbit polyclonal) | Raised in our lab. Zhou et al., 2007, see Figure 2—figure supplement 1 | WB (1:1000) | |
| Antibody | anti-NLG-1 (Rabbit polyclonal) | Synaptic Systems | 129013; AB_2151646 | WB (1:2000) |
| Antibody | anti-NLG-2 (Rabbit polyclonal) | Synaptic Systems | 129202; AB_2151646 | WB (1:1000) |
| Antibody | Alexa Fluor 680 goat anti-mouse IgG | Thermo Fisher Scientific | A28183; AB_2536167 | WB (1 μg/ml) |
| Antibody | IRdye800-conjugated goat-anti-rabbit IgG | Rockland Immunochemicals, Limerick, PA | 611-145-122; AB_1057618 | WB (1 μg/ml) |
| Commercial assay or kit | BCA Protein Assay Kit | Pierce | 23227 | |
| Software, algorithm | Image Studio Light | LI-COR Biosciences | ||
| Software, algorithm | Microsoft Excel | Microsoft | ||
| Software, algorithm | Prism 8 | GraphPad Software, San Diego |
Additional files
-
Supplementary file 1
Example calculations of synGAP/PSD-95 ratio and TARPs/PSD-95 ratio for animals 33 and 34.
The Table shows the steps to calculate a synGAP/PSD-95 ratio and a TARPs/PSD-95 ratio from digital data recorded from one pair of gels containing samples from animals 33 and 34 (see Figure 2—figure supplement 1). Data were collected from at least three technical replicates of synGAP gel lanes for each animal and usually six technical replicates of target gel lanes. The resulting ratios were averaged.
- https://cdn.elifesciences.org/articles/52656/elife-52656-supp1-v2.pdf
-
Transparent reporting form
- https://cdn.elifesciences.org/articles/52656/elife-52656-transrepform-v2.pdf
Download links
A two-part list of links to download the article, or parts of the article, in various formats.
Downloads (link to download the article as PDF)
Open citations (links to open the citations from this article in various online reference manager services)
Cite this article (links to download the citations from this article in formats compatible with various reference manager tools)
A sex difference in the response of the rodent postsynaptic density to synGAP haploinsufficiency
eLife 9:e52656.
https://doi.org/10.7554/eLife.52656


