Proximity proteomics in a marine diatom reveals a putative cell surface-to-chloroplast iron trafficking pathway
- Biological and Biomedical Sciences, The Graduate School of Arts and Sciences, Harvard University, United States
- Department of Systems Biology, Harvard Medical School, United States
- Wyss Institute for Biologically Inspired Engineering, Harvard University, United States
- Integrative Oceanography Division, Scripps Institution of Oceanography, University of California San Diego, United States
- Center for Research in Biological Systems, University of California San Diego, United States
- Microbial and Environmental Genomics, J. Craig Venter Institute, United States
- Center for Marine Biotechnology and Biomedicine, Scripps Institution of Oceanography, University of California San Diego, United States
- Informatics, J. Craig Venter Institute, United States
- National Center for Microscopy and Imaging Research, University of California San Diego, United States
- Biology Centre CAS, Institute of Parasitology, Czech Republic
- University of South Bohemia, Faculty of Science, Czech Republic
- Synthetic Biology and Bioenergy, J. Craig Venter Institute, United States
Figures
Figure 1
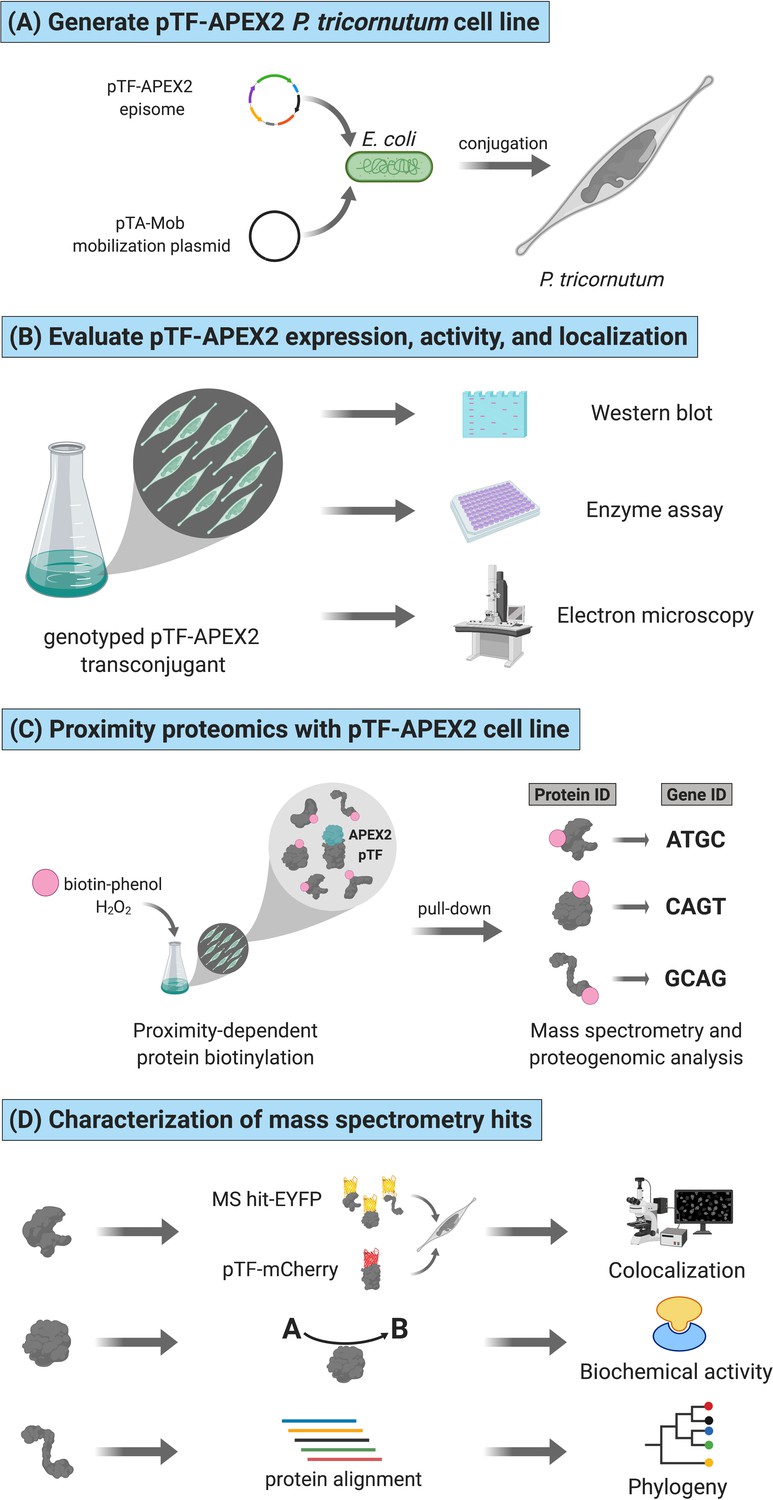
Functional APEX2-enabled proteogenomics with pTF (phytotransferrin/ISIP2a/Phatr3_J54465) in the model marine diatom Phaeodactylum tricornutum.
(A) pTF-APEX2 encoding episome is introduced into P. tricornutum cells using bacterial conjugation. (B) Resulting transconjugants are genotyped and evaluated for fusion protein expression. APEX2 activity and fusion protein localization are then confirmed with an enzymatic assay and electron microscopy, respectively. (C) In a proximity-dependent proteomic mapping (proximity proteomics) experiment, pTF-APEX2 expressing cell line is supplemented with biotin-phenol and hydrogen peroxide, reaction quenched, and cells lysed. Cell lysate is then subjected to streptavidin pull-down, proteins analyzed with mass spectrometry (MS), peptides mapped to a P. tricornutum proteome database, and corresponding genes identified. (D) Interesting MS hits are further evaluated experimentally (e.g. for colocalization with the bait protein (i.e. pTF) and/or for predicted biochemical activity) as well as bioinformatically. Created with BioRender.com.
Figure 2 with 1 supplement
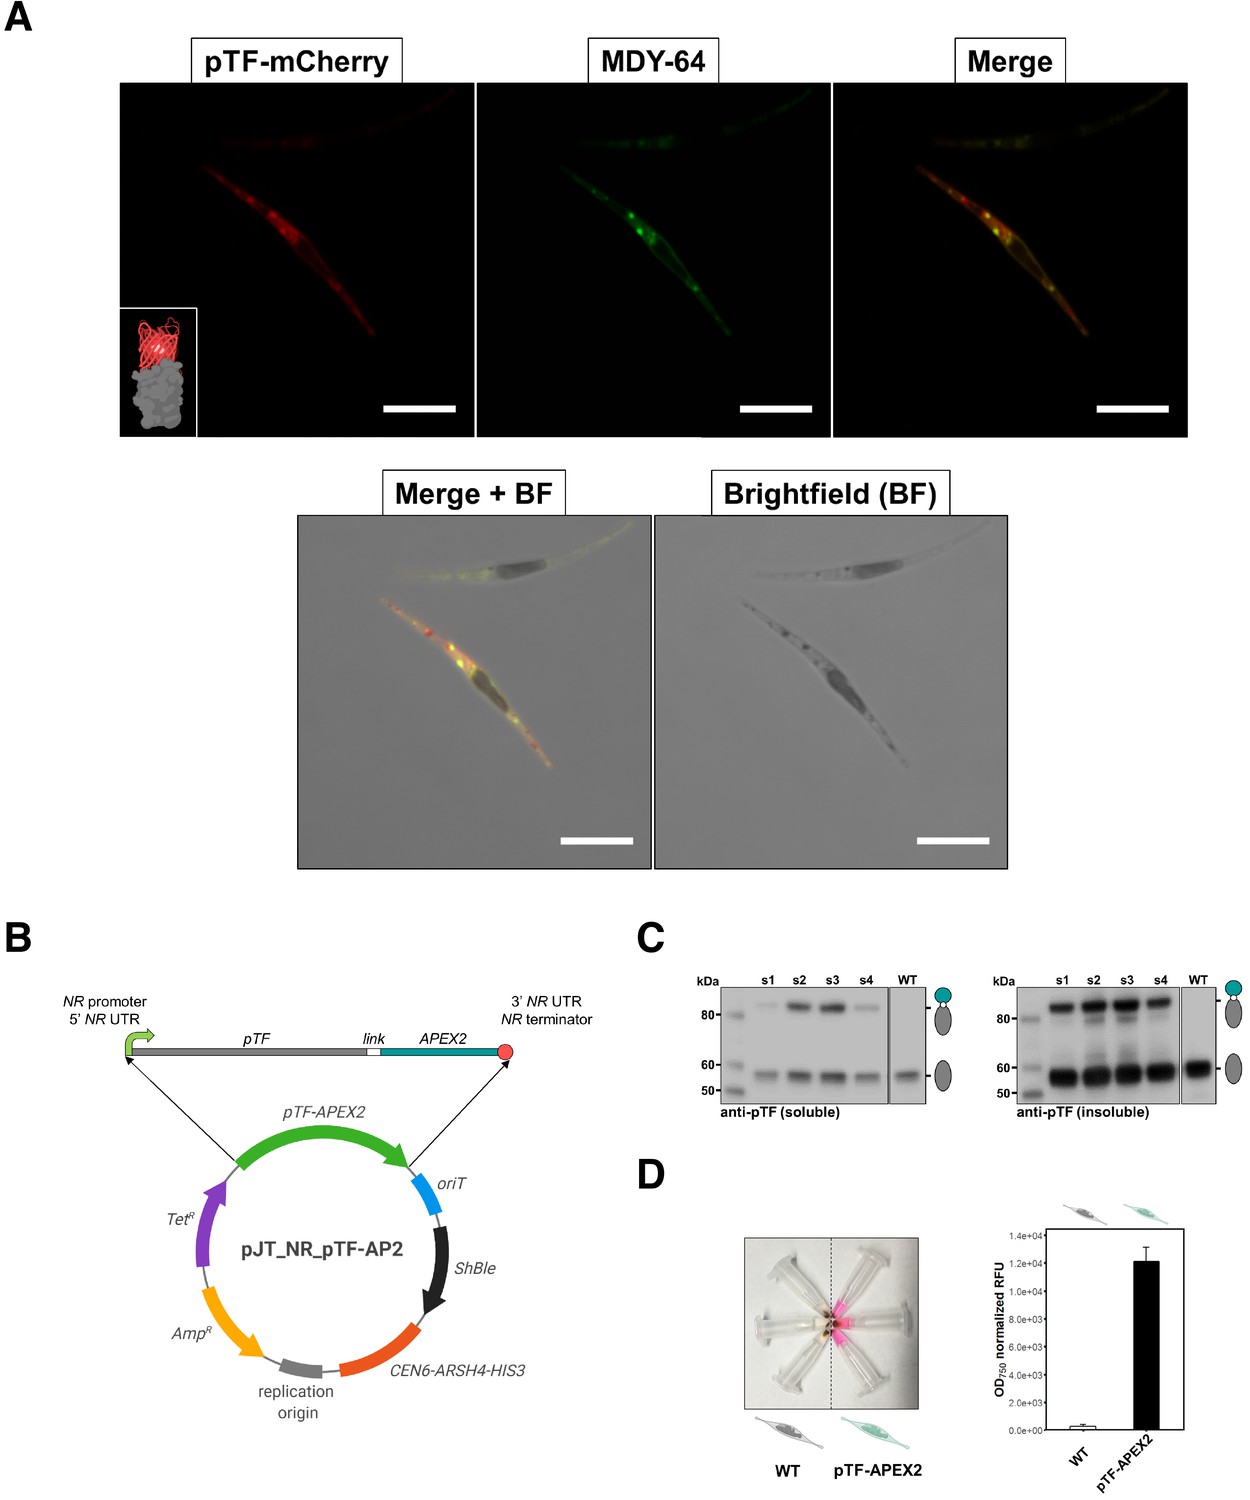
pTF is localized to intracellular vesicles and APEX2 is enzymatically active in live Phaeodactylum tricornutum cells.
(A) pTF-mCherry colocalizes with the membrane dye MDY-64 on the cell surface and within intracellular vesicles. The fluorescent fusion protein was expressed under the pTF promoter and terminator in a ΔpTF P. tricornutum genetic background. Cells were stained with 100 μM MDY-64 for 10 min at room temperature. Scale bar is 10 μm. Fusion protein schematic created with BioRender.com. (B) Top: pTF-APEX2 flanked by nitrate-inducible NR (nitrate reductase) promoter, terminator, and untranslated regions (UTRs). Linker sequence (‘link’) between pTF and APEX2 encoded KGSGSTSGSG. Bottom: Schematic of the pTF-APEX2 expressing episome. Tetracycline (TetR) and ampicillin (AmpR) resistance genes for E. coli selection, bacterial replication origin, yeast centromere (CEN6-ARSH4-HIS3) for episome maintenance, phleomycin/zeocin (ShBle) resistance gene for P. tricornutum selection, origin of conjugative transfer (oriT). Plasmid map created with BioRender.com. (C) Anti-pTF western blot confirming pTF-APEX2 fusion protein (84.73 kDa) expression in four transconjugant P. tricornutum cell lines (lanes s1–s4; left: soluble cell lysate fraction, right: insoluble cell lysate fraction). Bacterial conjugation was performed with WT P. tricornutum cells which is why native pTF (57.05 kDa) bands were present in our samples. Teal circle: APEX2, white circle: linker, gray oval: pTF. (D) Left: pTF-APEX2 expressing, but not WT, cells convert APEX2 substrate Amplex UltraRed (50 μM) into a colored product resorufin in the presence of 2 mM H2O2. Right: >40 fold higher resorufin signal was observed in supernatants from pTF-APEX2 expressing cells than those from WT cells. Triplicate cultures from one WT and one pTF-APEX2 expressing cell line (cell line s2) were used in this experiment. Standard deviation is shown. P. tricornutum cartoons created with BioRender.com.
-
Figure 2—source data 1
Raw Amplex UltraRed assay data underpinning the chart in Figure 2D.
- https://cdn.elifesciences.org/articles/52770/elife-52770-fig2-data1-v3.xlsx
-
Figure 2—source data 2
R script to reproduce the chart in Figure 2D.
- https://cdn.elifesciences.org/articles/52770/elife-52770-fig2-data2-v3.zip
-
Figure 2—source data 3
CSV file to be used in conjuction with Figure 2—source data 2.
- https://cdn.elifesciences.org/articles/52770/elife-52770-fig2-data3-v3.zip
Figure 2—figure supplement 1
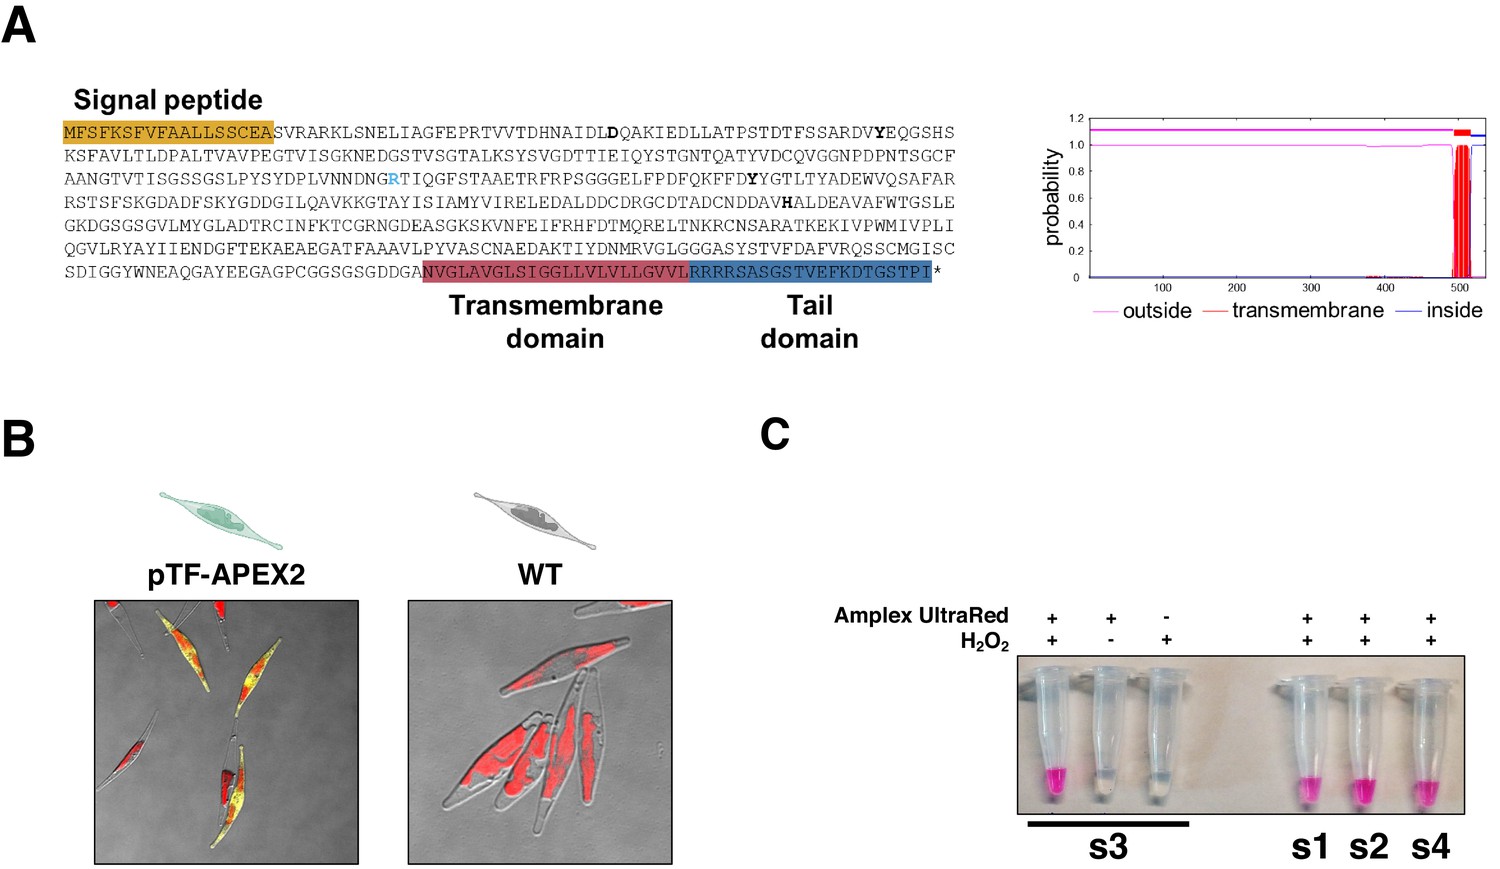
Phaeodactylum tricornutum phytotransferrin (pTF) features, resorufin imaging in pTF-APEX2 expressing cells, and resorufin signal co-dependence on Amplex UltraRed and hydrogen peroxide.
(A) pTF is a 537 amino acid residues (AAs) long cell membrane-associated iron receptor protein consisting of a signal peptide (AAs 1–18; predicted with SignalP 4.1), an iron-binding domain (AAs 19–493), a transmembrane domain (AAs 494–516; TMHMM Server v. 2.0 prediction output is shown to the right), and a tail domain (AAs 517–537). The latter is predicted to contain an endocytosis motif (Lommer et al., 2012). Bolded and light blue are conserved putative iron- (Asp48, Tyr71, Tyr214, His294) and carbonate-coordinating (Arg183) amino acid residues, respectively. (B) Direct visualization of resorufin (yellow) in pTF-APEX2 expressing cells. Both WT and pTF-APEX2 expressing cells were incubated in reaction buffer (50 μM Amplex UltraRed, 2 mM H2O2, PBS [pH 7.4]) for 6 min at room temperature prior to imaging. Red is chloroplast autofluorescence. (C) Supernatants after incubating cells from four pTF-APEX2 expressing cell lines (s1–s4) in reaction buffer (50 μM Amplex UltraRed, 2 mM H2O2, PBS [pH 7.4]) for 6 min at room temperature. Resorufin signal was observed only when both APEX2 substrates (Amplex UltraRed and hydrogen peroxide) were present.
Figure 3 with 1 supplement
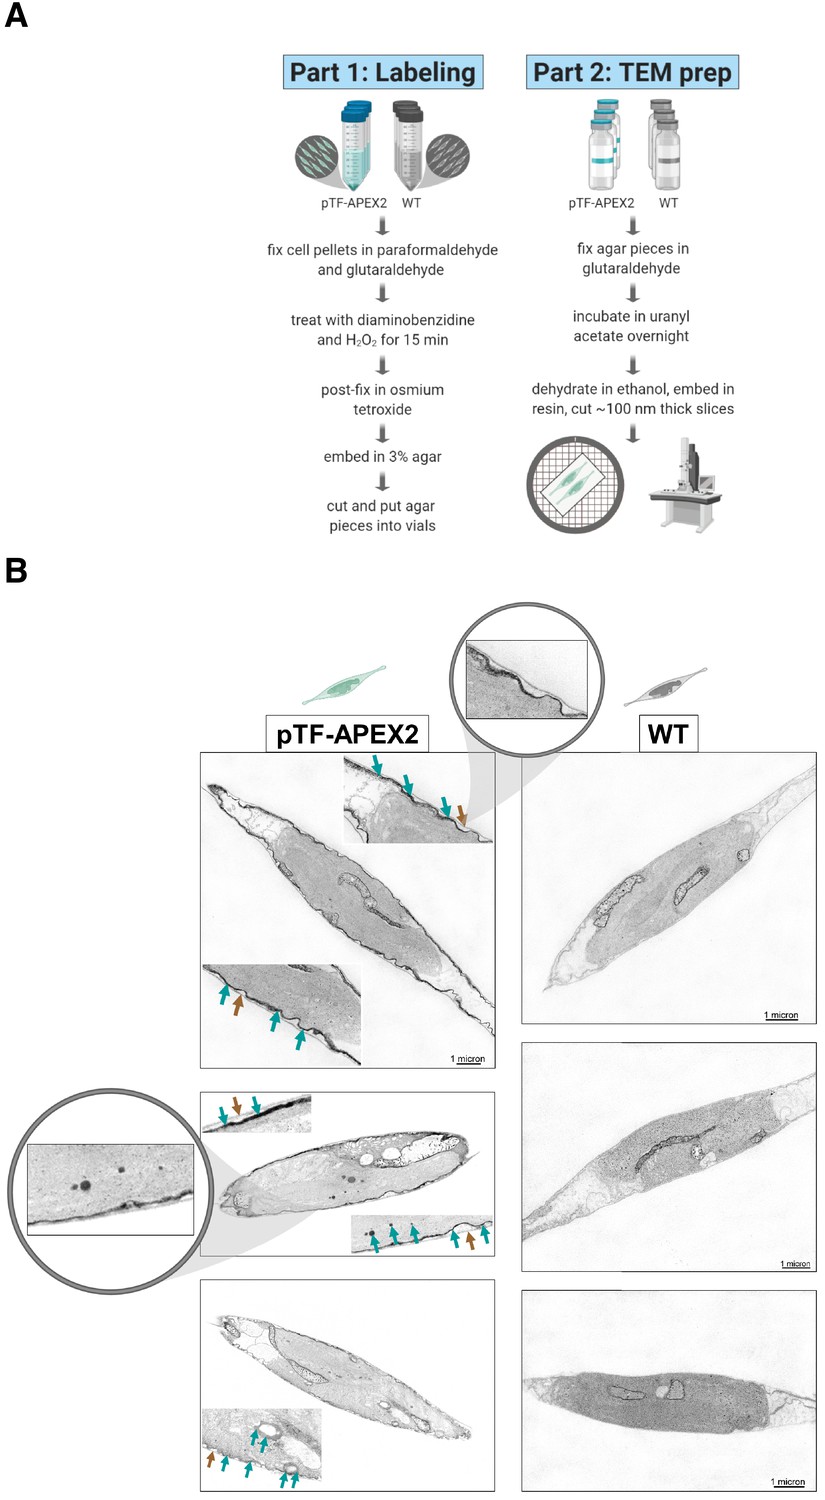
pTF-APEX2 is localized to the cell membrane and intracellular vesicles.
(A) Electron microscopy protocol summary. Briefly: WT and pTF-APEX2 expressing cells (grown in triplicate) were fixed, treated with diaminobenzidine (DAB) and hydrogen peroxide, post-fixed with osmium tetroxide, embedded in agar, negatively stained with uranyl acetate, dehydrated, embedded in resin, and visualized. Created with BioRender.com. (B) Expected cell surface and intracellular pTF-APEX2 localization. Teal and brown arrows point to APEX2-induced signal and cell wall, respectively. Zoomed in (top left image) is cell periphery where it can clearly be seen that cell membrane, not cell wall, is occupied by the fusion protein. pTF-APEX2 containing vesicles were observed (bottom two left images; acquired with backscatter scanning electron microscopy). Zoomed in (middle left image) are cell membrane and vesicles with pTF-APEX2. Mitochondrial signal in both WT and pTF-APEX2 expressing cells is likely due to endogenous (mitochondrial) APEX2-like peroxidases. Scale bar is 1 μm. P. tricornutum cartoons created with BioRender.com.
Figure 3—figure supplement 1
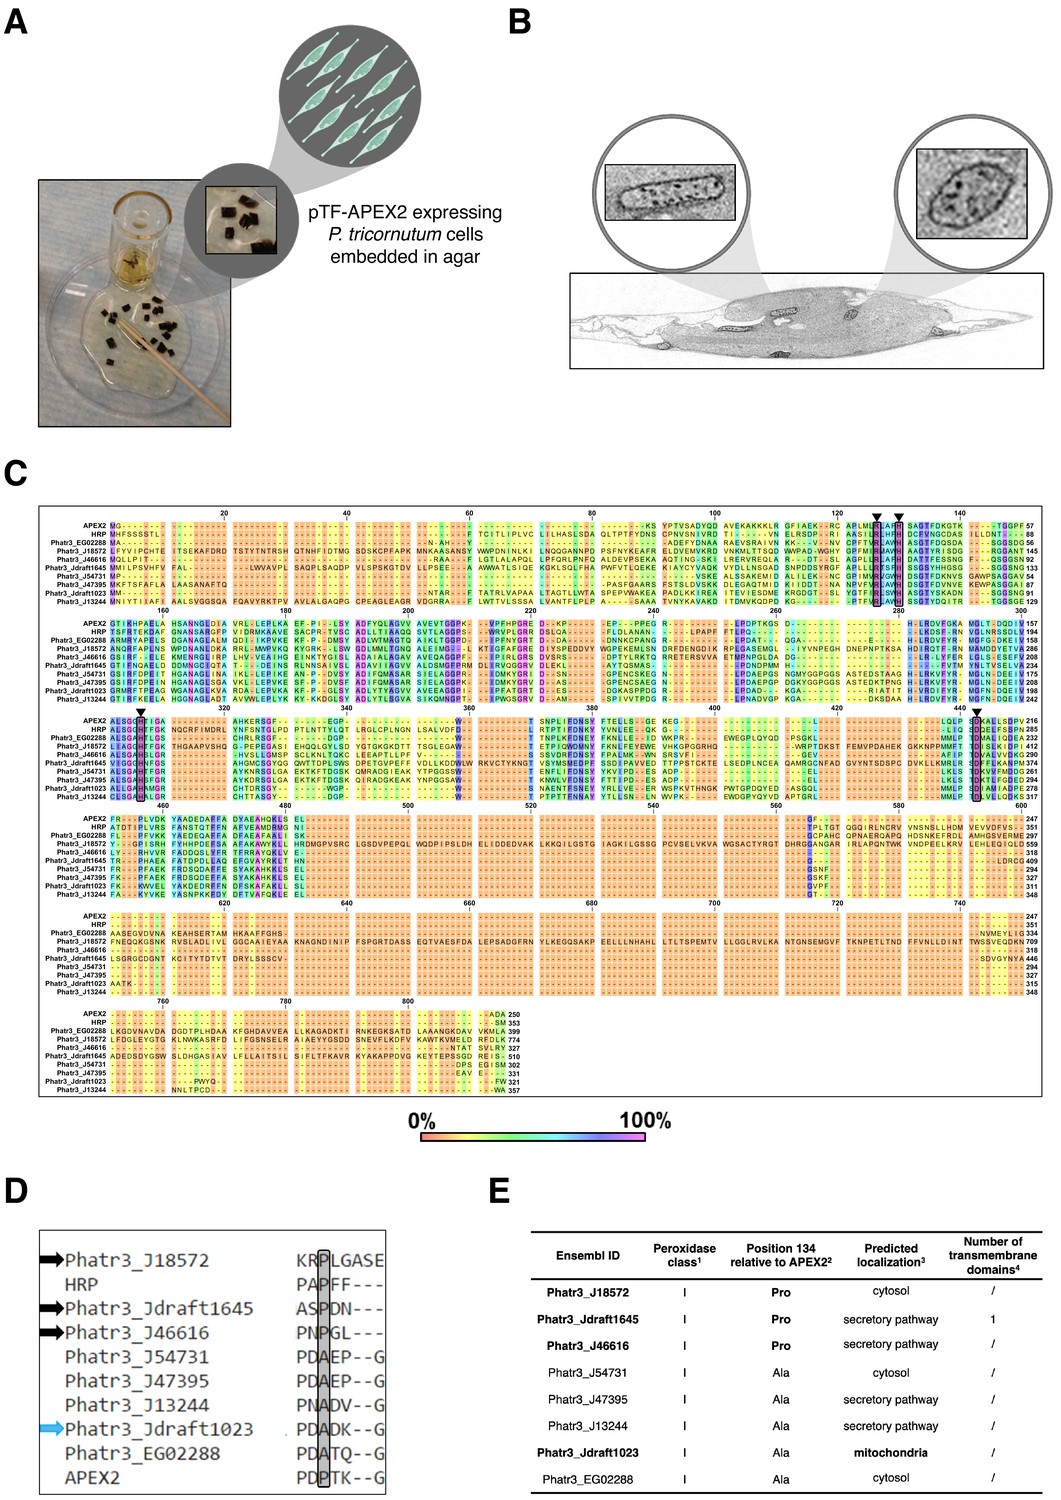
Analysis of transcriptionally active Phaeodactylum tricornutum peroxidases reveals putative APEX2-like and mitochondrial enzymes.
(A) Detail from the electron microscopy sample preparation protocol: agar blocks with embedded diaminobenzidine (DAB)-treated pTF-APEX2 expressing diatom cells. P. tricornutum cartoon and ‘zoom in’ objects created with BioRender.com. (B) Mitochondrial signal as shown here was observed in electron microscopy experiments with both WT and pTF-APEX2 expressing cells subjected to DAB and hydrogen peroxide. ‘Zoom in’ objects created with BioRender.com. (C) Amino acid sequence alignment of putative APEX2-like P. tricornutum peroxidases. Amino acid residues crucial for ascorbate peroxidase (APX) and likely crucial for APEX2 activity (Arg38, His42, His163, and Asp208; numbering is relative to APEX2; depicted with black triangles and shaded) are conserved in eight P. tricornutum peroxidases. Numbers above amino acid sequences indicate alignment position. (D) Amino acid sequence alignment of putative substrate binding loops in the identified APEX2-like peroxidases. Black and blue arrows point to enzymes with proline at position 134 (shaded; numbering is relative to APEX2)—an amino acid residue change rendering APEX2 much more active than its APEX predecessor (Lam et al., 2015)—and predicted mitochondrial localization, respectively. (E) Some additional properties of the identified APEX2-like peroxidases. They all belong to class I (intracellular) haem peroxidases; one may be membrane-associated. 1RedoxiBase database. 2APEX2 and horseradish peroxidase (HRP) have proline at this position. 3TargetP 1.1. 4TMHMM Server v. 2.0.
Figure 4 with 1 supplement

Proximity-dependent proteomic mapping with APEX2 reveals candidate proteins involved in phytotransferrin (pTF) endocytosis in Phaeodactylum tricornutum.
(A) Summary of the proximity-dependent proteomic mapping experiment. Briefly: WT and pTF-APEX2 expressing cells (grown in quintuplicate) were chilled on ice, pelleted, treated with 1.2 M sorbitol, supplemented with 2.5 mM biotin-phenol and 1 mM H2O2. The labeling reaction was quenched, cells were lysed, and evaluated for biotin enrichment. Cleared cell lysates were then subjected to streptavidin pull-down followed by quantitative mass spectrometry using tandem mass tags (TMT). Created with BioRender.com. (B) Left: Enrichment of biotinylated proteins over WT background was observed with streptavidin blot; ~66.5 kDa biotinylated BSA control; equal loading. The most prominent band in all samples is likely the endogenous biotin-containing propionyl-CoA carboxylase (Phatr3_J51245, ~72.5 kDa). Right: Volcano plot of quantitative MS data highlighting proteins with APEX2/WT ratio of at least 1.5 and p value ≤ 0.05 (shaded area with teal data points). Proteins encoded by a known iron-sensitive gene cluster on chromosome 20 are highlighted (arrowed Ensembl IDs). P. tricornutum cartoons created with BioRender.com. (C) 14/38 (10 shown here) MS hits are proteins with iron-sensitive transcripts. Proteins chosen for further characterization are bolded. Chloroplast localization and the associated prediction confidence were determined with SignalP 4.1 and ASAFind version 1.1.7. *Experimentally shown to localize to the pyrenoid—a RuBisCO-containing proteinaceus organelle—in the interior of the P. tricornutum chloroplast (Allen et al., 2012). **Experimentally shown to be localized adjacently to the chloroplast (Kazamia et al., 2019; Kazamia et al., 2018).
-
Figure 4—source data 1
Pre-processed quantitative mass spectrometry proteomics data underpinning the Volcano plot and the table in Figure 4B and Figure 4C, respectively.
The table in Figure 4C was additionally informed by Figure 5—figure supplement 1—source data 1.
- https://cdn.elifesciences.org/articles/52770/elife-52770-fig4-data1-v3.xlsx
-
Figure 4—source data 2
R script to reproduce the chart in Figure 4B.
- https://cdn.elifesciences.org/articles/52770/elife-52770-fig4-data2-v3.zip
-
Figure 4—source data 3
CSV file to be used in conjuction with Figure 4—source data 2.
- https://cdn.elifesciences.org/articles/52770/elife-52770-fig4-data3-v3.zip
Figure 4—figure supplement 1
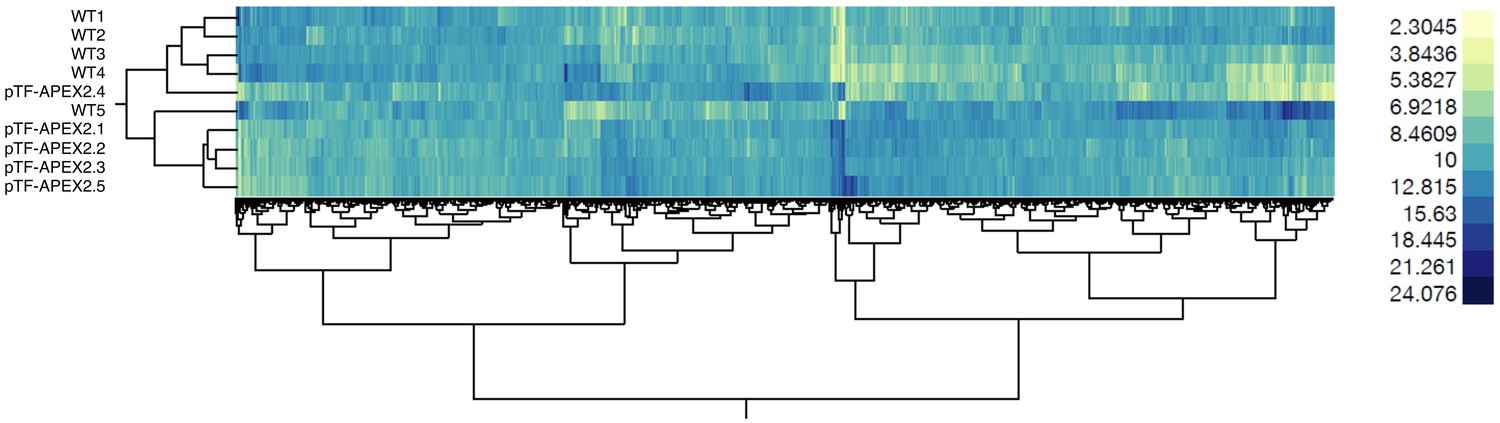
WT and pTF-APEX2 proteomic replicates form distinct clusters.
Hierarchical clustering (Ward’s method as implemented in the JMP software package) of scaled quantitative mass spectrometry proteomics data reveals WT- and pTF-APEX2-specific clusters. The heat map as a whole suggests minimal technical variability in our proteomic experiment even though samples WT5 and pTF-APEX2.4 deviate slightly from other corresponding samples.
-
Figure 4—figure supplement 1—source data 1
Scaled quantitative mass spectrometry proteomics data.
- https://cdn.elifesciences.org/articles/52770/elife-52770-fig4-figsupp1-data1-v3.xlsx
Figure 5 with 4 supplements
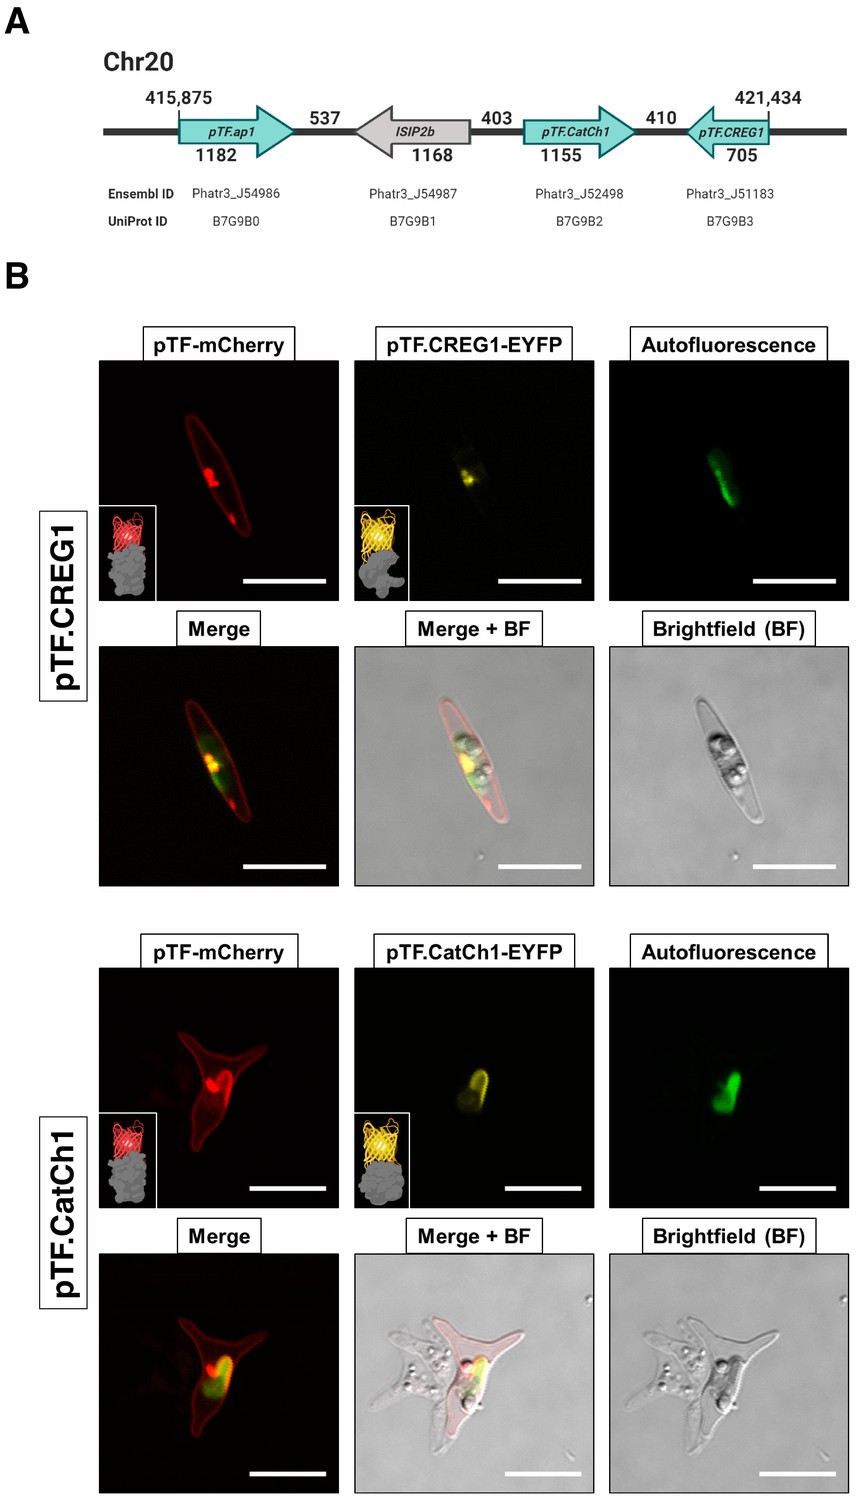
Proteins encoded by a known iron- and silicon-sensitive locus in Phaeodactylum tricornutum colocalize with pTF in the chloroplast vicinity.
(A) Genes corresponding to three statistically significant proteomic hits are clustered on chromosome 20. All three proteins were co-expressed with mCherry-tagged pTF as fusions with a yellow fluorescent protein. Corresponding Ensembl and UniProt IDs are noted. Numbers indicate base pairs. Created with BioRender.com. (B) Two proteins—pTF.CREG1 and pTF.CatCh1—show clear, yet distinct, colocalization with pTF and the chloroplast periphery. pTF.CREG1-EYFP was consistently punctate whereas pTF.CatCh1-EYFP lined the chloroplast margin. pTF-mCherry punctum was almost exclusively positioned next to this ‘chloroplast lining’ pattern. P. tricornutum is pleiomorphic which explains why different cell morphologies were observed in pTF.CREG1-EYFP (fusiform morphotype) and pTF.CatCh1-EYFP (triradiate morphotype) cell lines. Scale bar is 10 μm. Fusion protein schematics created with BioRender.com.
Figure 5—figure supplement 1
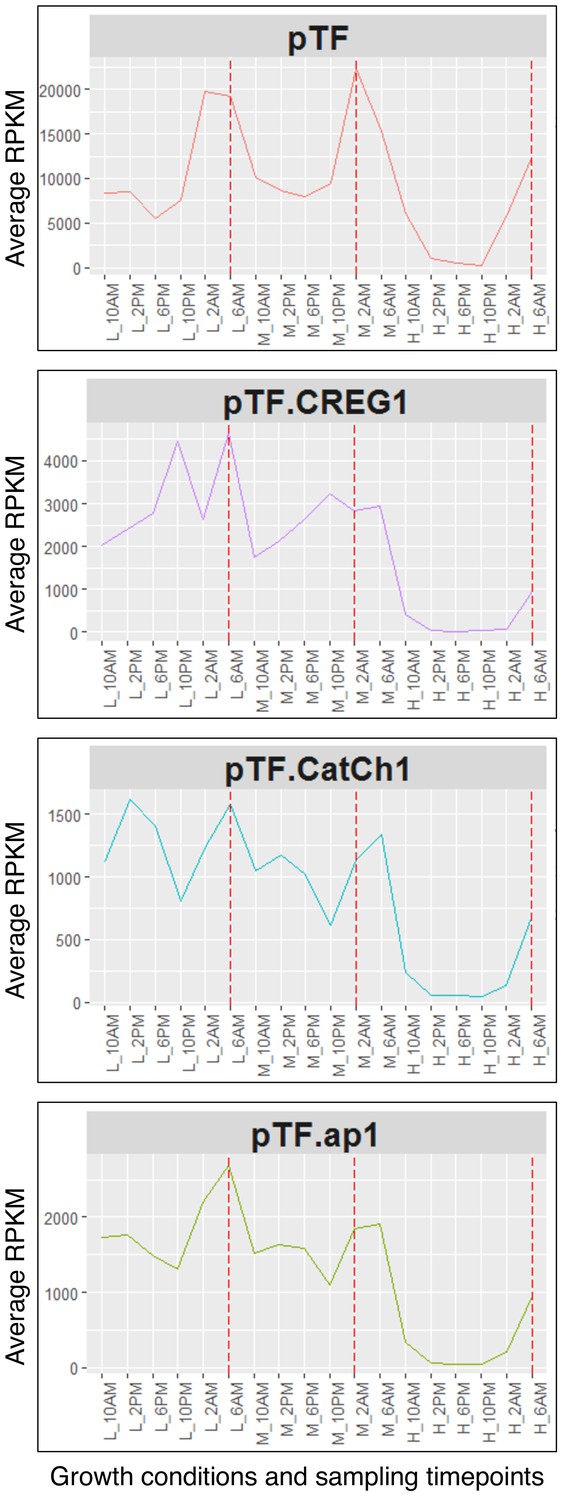
pTF.CREG1, pTF.CatCh1, and pTF.ap1 closely resemble pTF transcriptional profile.
Transcriptional profiles of pTF and the three genes from the identified iron- and silicon-sensitive gene cluster on chromosome 20 across different growth conditions (L (low): 20 pM Fe’, M (medium): 40 pM Fe’, H (high): 400 pM Fe’) and sampling timepoints (10AM, 2PM, 6PM, 10PM, 2AM, 6AM) are shown. Fe’: sum of all iron species not complexed to EDTA. Red dashed lines correspond to genes’ transcriptional peaks (late night). Average RPKM: Reads Per Kilobase of transcript, per Million mapped reads averaged across across two (L and M) or three (H) replicates.
-
Figure 5—figure supplement 1—source data 1
Transcriptomic data and functional annotations for proteins with APEX2/WT ratios ≥ 1.5 and p values ≤ 0.05 underpinning Figure 5—figure supplement 1 and Figure 4C.
- https://cdn.elifesciences.org/articles/52770/elife-52770-fig5-figsupp1-data1-v3.xlsx
-
Figure 5—figure supplement 1—source data 2
R script to reproduce the chart in Figure 5—figure supplement 1.
- https://cdn.elifesciences.org/articles/52770/elife-52770-fig5-figsupp1-data2-v3.zip
-
Figure 5—figure supplement 1—source data 3
CSV file to be used in conjuction with Figure 5—figure supplement 1—source data 2.
- https://cdn.elifesciences.org/articles/52770/elife-52770-fig5-figsupp1-data3-v3.zip
Figure 5—figure supplement 2
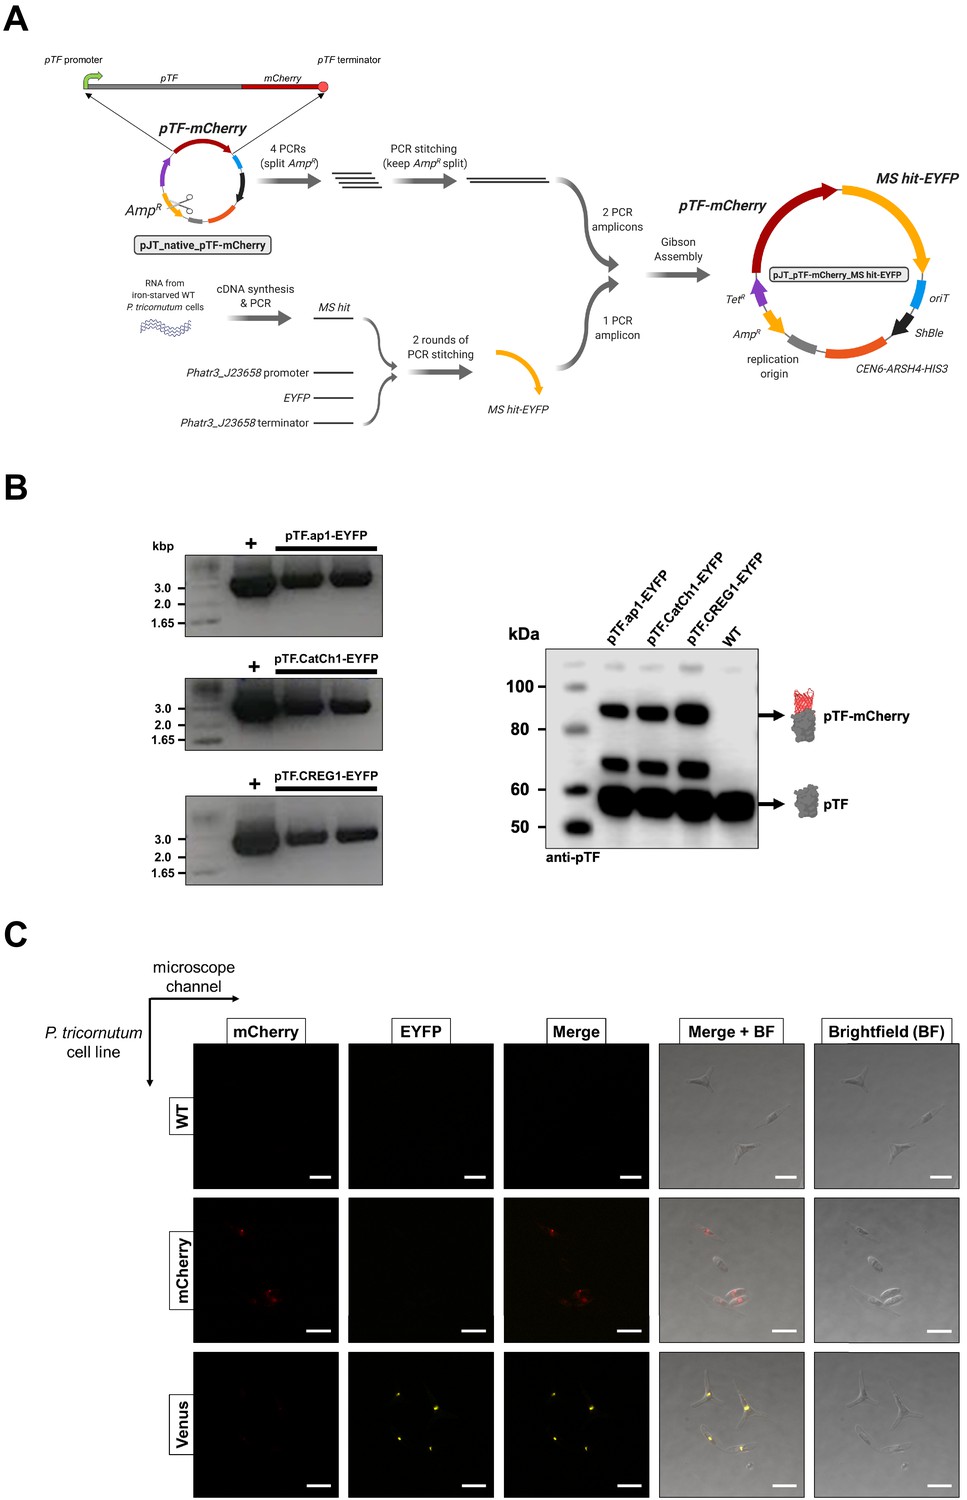
Co-expression episome assembly overview, assessment of co-expression cell lines, and confocal microscopy bleed-through controls.
(A) Summary of the pTF-mCherry MS hit-EYFP co-expression episome assembly strategy. Created with BioRender.com. (B) Colony PCR and western blot analyses indicate the presence of full-length fusion proteins in our co-expression cell lines. Left: Primers binding to Phatr3_J23658 (flavodoxin-encoding gene) promoter and terminator flanking MS hit-EYFP coding regions were used in PCR reactions which resulted in the expected ~3 kbp amplicons. Positive controls: pure episomes used for conjugation. Negative controls: WT P. tricornutum cells and water which yielded no amplicons (not shown). Right: Anti-pTF western blot revealed the expected pTF-mCherry (83.75 kDa) bands alongside the bands corresponding to native pTF (57.05 kDa) and what appears to be a pTF-mCherry truncation (the additional band at ~70 kDa). Protein schematics created with BioRender.com. (C) The observed lack of significant cross-channel bleed-through supports colocalization imaging data and conclusions. Imaging conditions with minimal bleed-through were determined with WT P. tricornutum cells (top row), P. tricornutum cells expressing mCherry alone (middle row), and P. tricornutum cells expressing a Venus-tagged protein (bottom row). Scale bar is 10 μm.
Figure 5—figure supplement 3
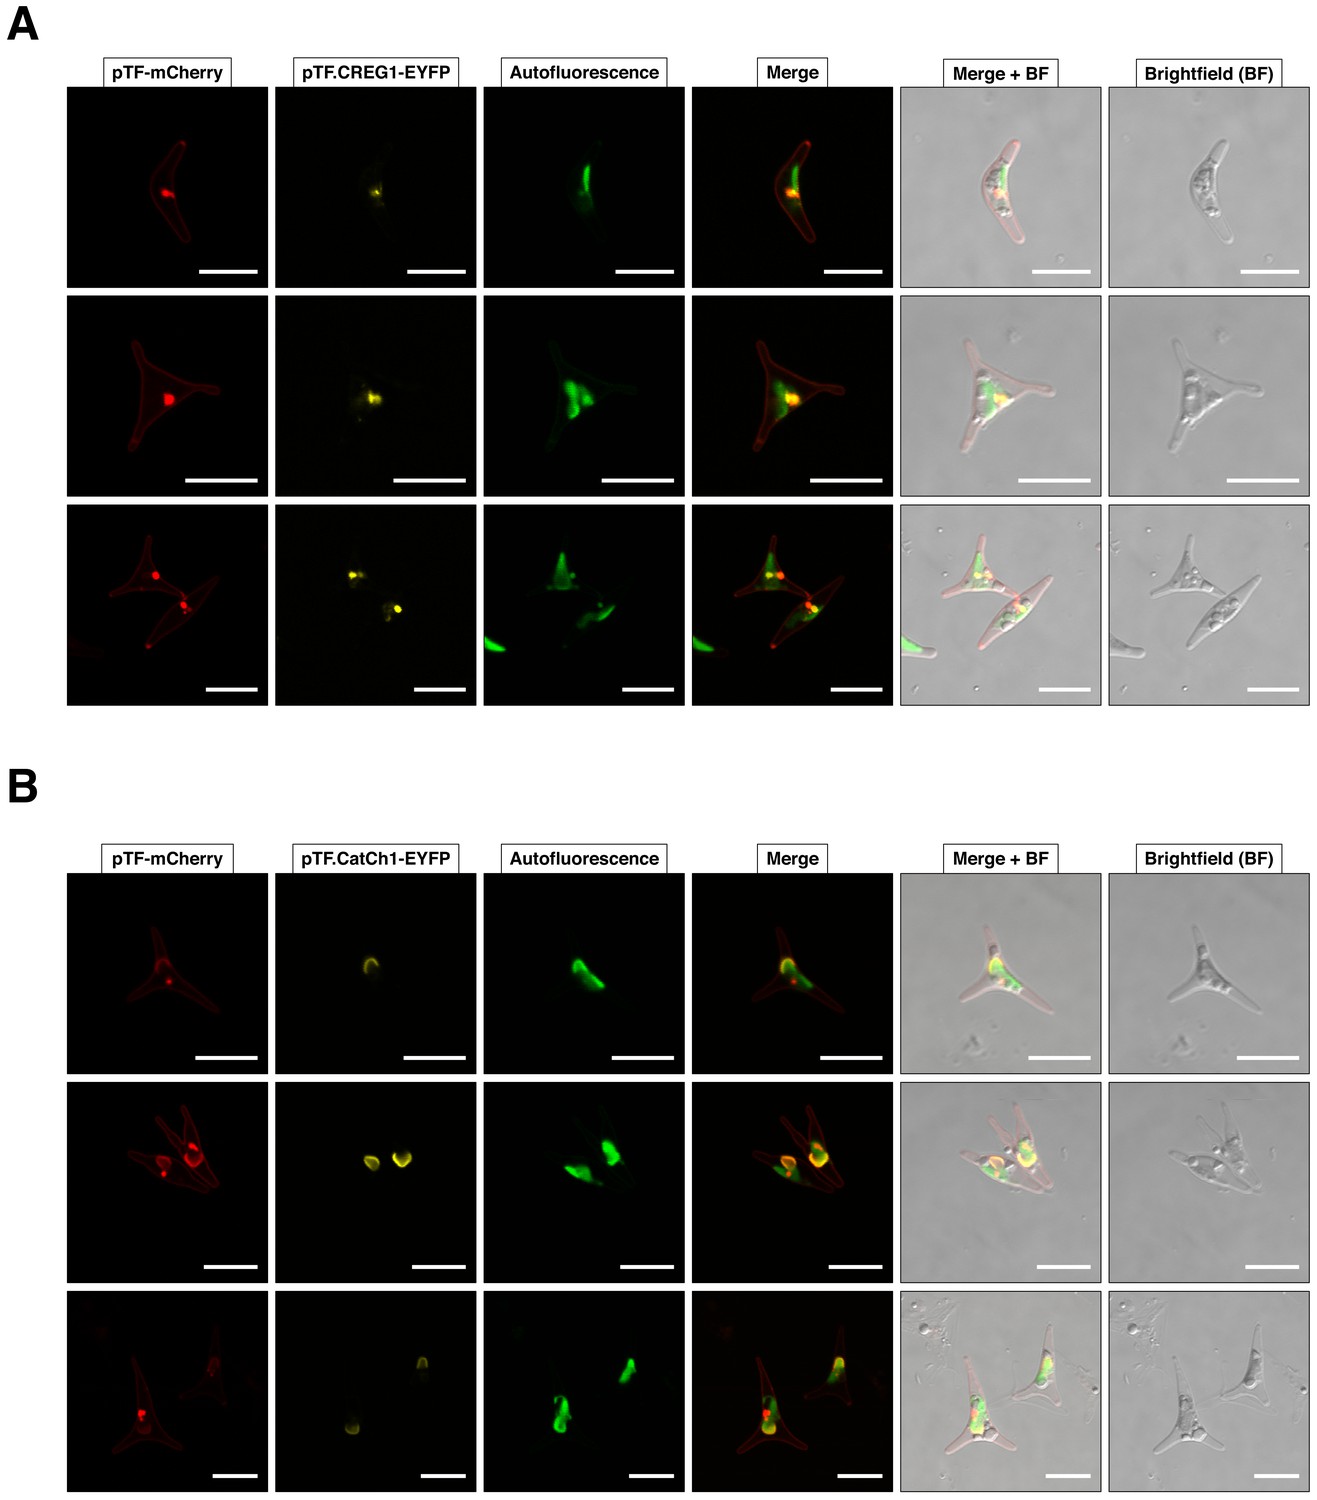
Additional representative examples of pTF.CREG1 and pTF.CatCh1 colocalization with pTF.
(A) Three additional cells from pTF-mCherry and pTF.CREG1-EYFP expressing cell line described in the main text exhibit similar punctate colocalization of both fusion proteins at the chloroplast periphery. (B) Three additional cells from pTF-mCherry and pTF.CatCh1-EYFP expressing cell line described in the main text exhibit similar ‘chloroplast lining’ colocalization pattern of both fusion proteins at the chloroplast periphery. pTF-mCherry punctum was typically positioned adjacently to this signal. Scale bar is 10 μm.
Figure 5—figure supplement 4
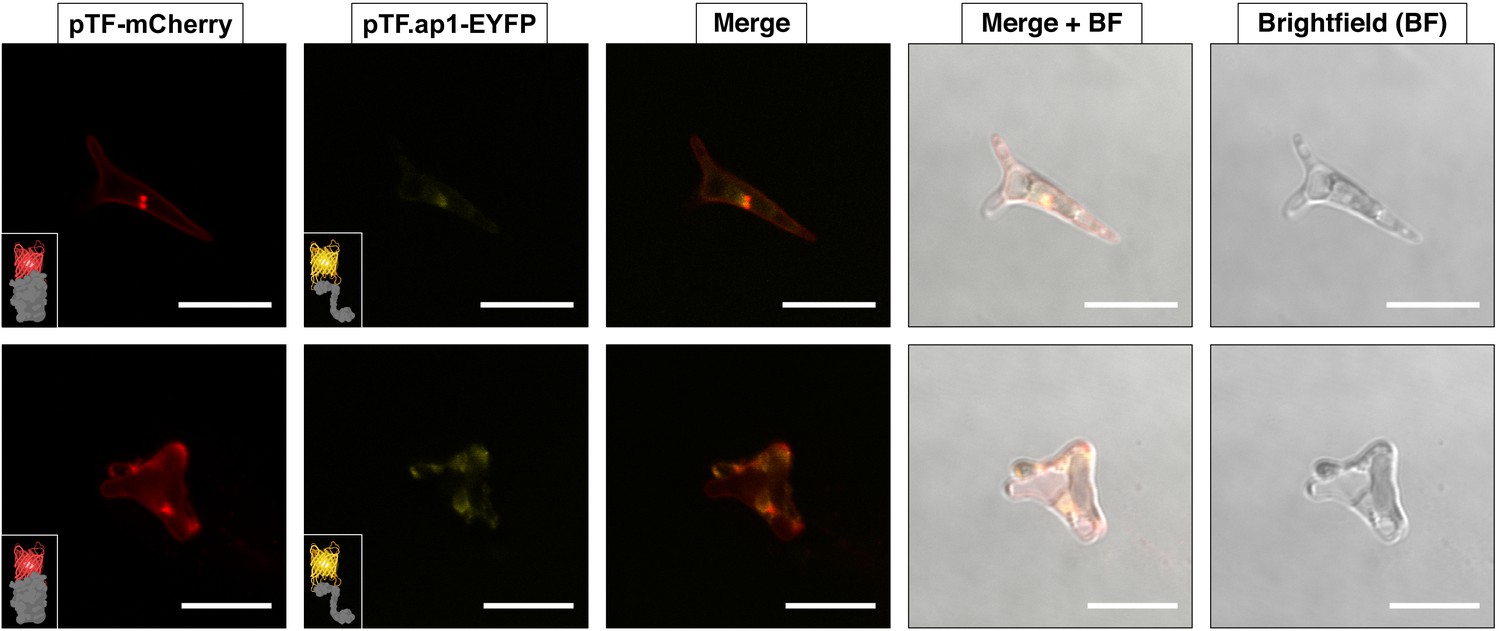
pTF.ap1 colocalizes with pTF.
pTF.ap1-EYFP was co-expressed with pTF-mCherry and colocalization of the two fusion proteins—although not as obvious as in the case of pTF.CREG1 and pTF.CatCh1—was observed. These cells are representative of a pooled non-clonal P. tricornutum culture. Scale bar is 10 μm. Fusion protein schematics created with BioRender.com.
Figure 6 with 4 supplements
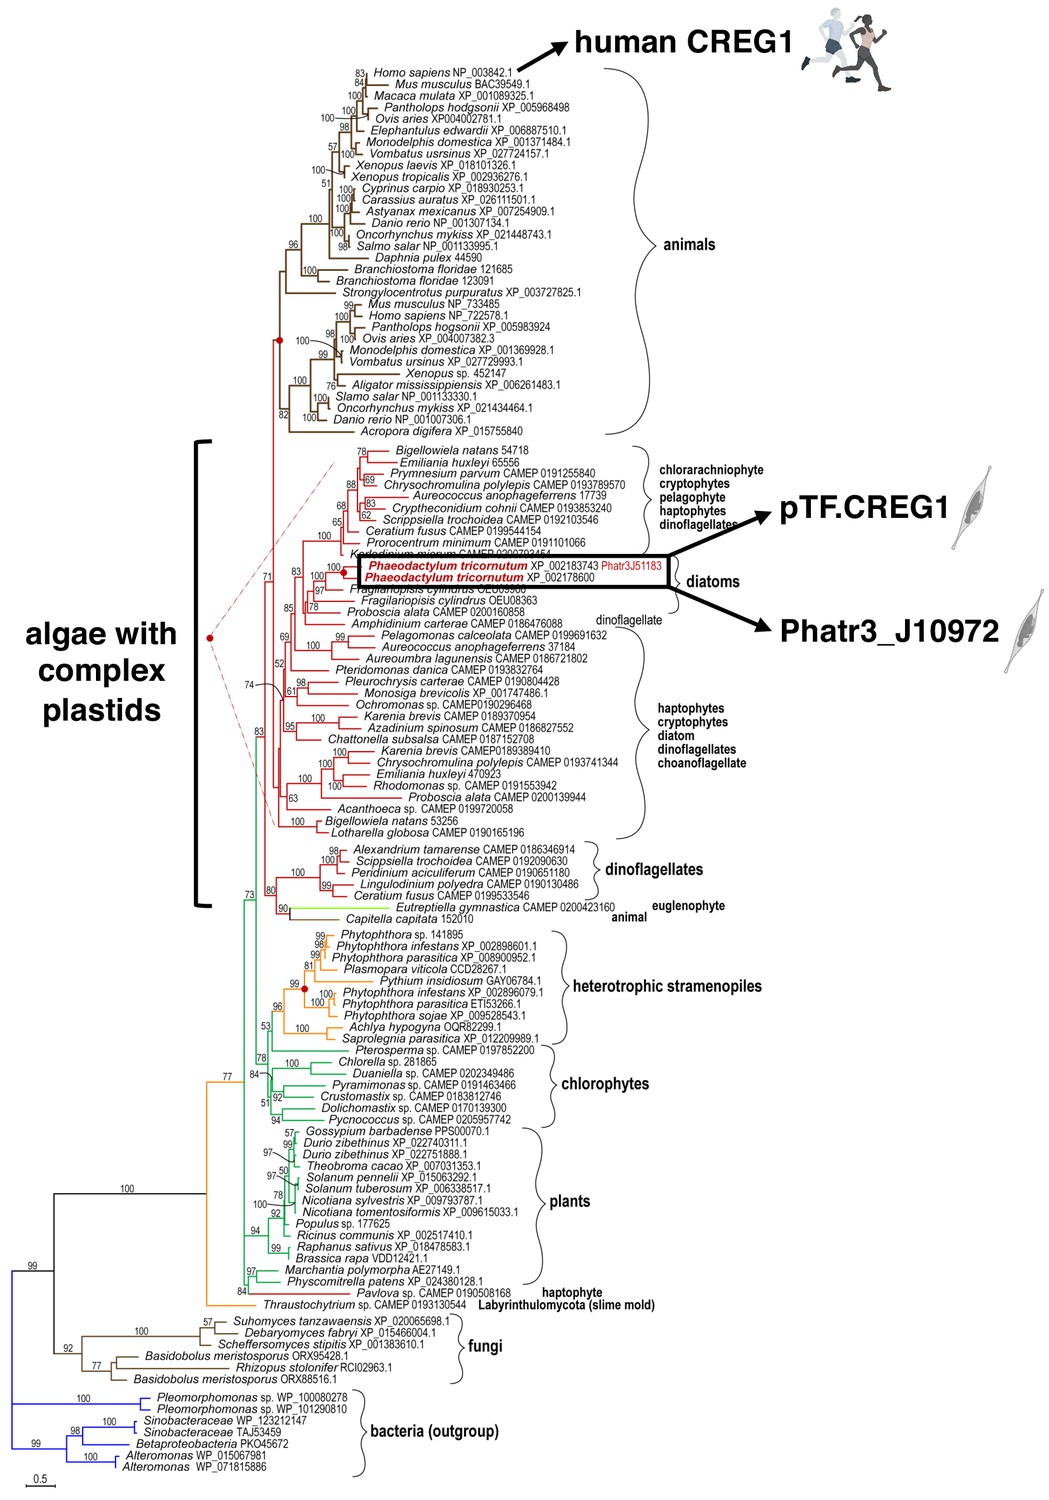
pTF.CREG1 homologs are present across the tree of life.
pTF.CREG1 homolog search was performed with the National Center for Biotechnology Information (NCBI) and the Marine Microbial Eukaryote Transcriptome Sequencing Project (MMETSP) databases (Caron et al., 2017; Keeling et al., 2014; O'Leary et al., 2016). Homologs from algae with complex plastids (including diatoms) form a crown group away from animal proteins. pTF.CREG1 clusters with its paralog Phatr3_J10972 (black rectangle). Red dots indicate predicted gene duplication events. Scale bar: 0.5 substitutions per position.
-
Figure 6—source data 1
Amino acid sequence alignment underpinning the phylogenetic tree in Figure 6.
- https://cdn.elifesciences.org/articles/52770/elife-52770-fig6-data1-v3.txt
Figure 6—figure supplement 1
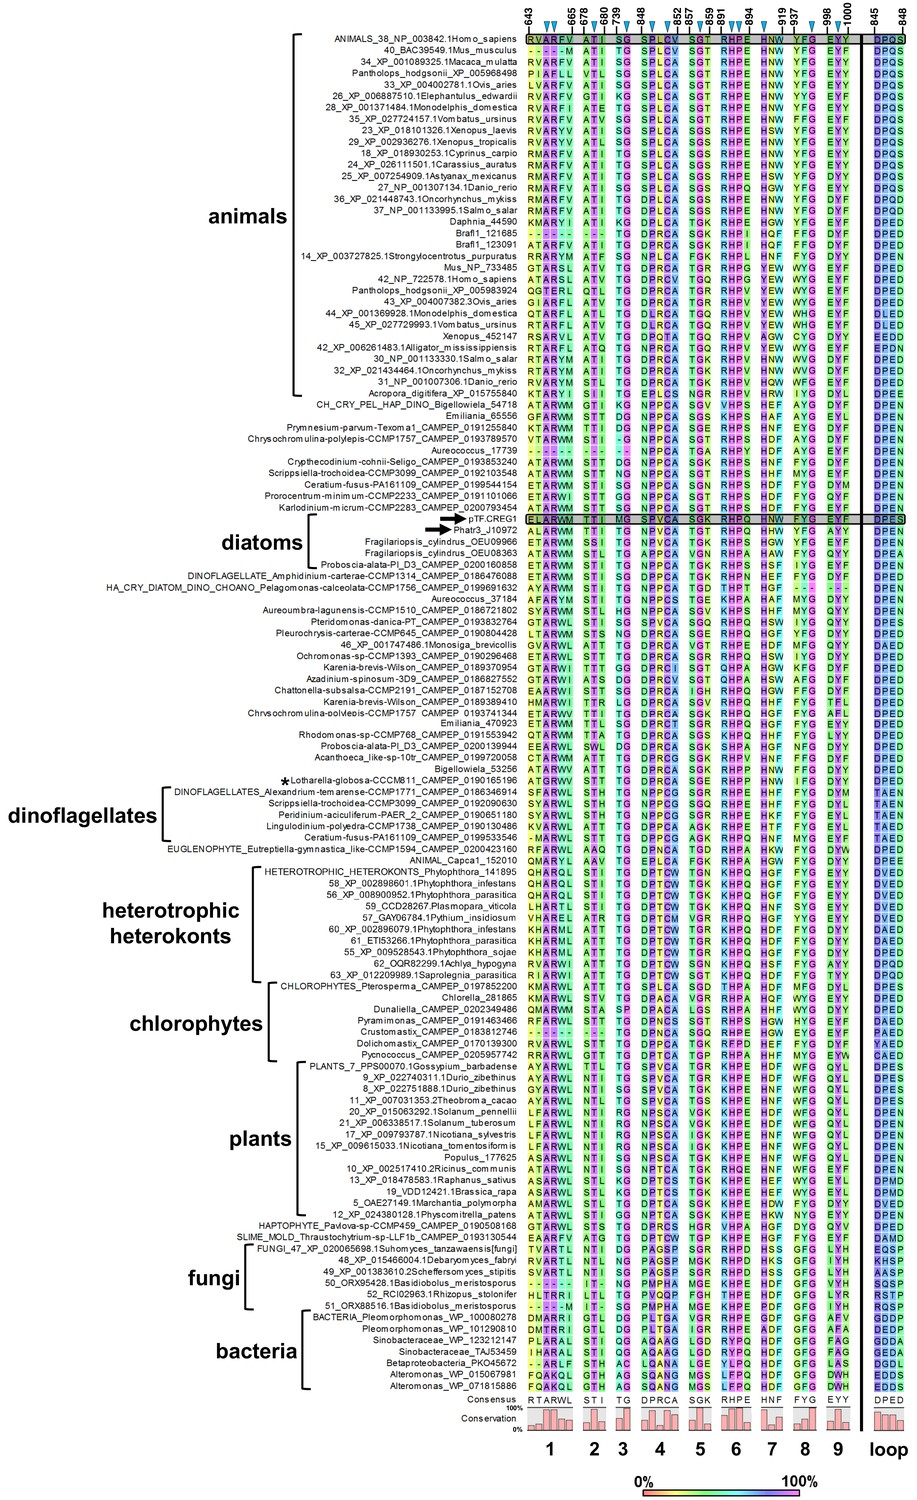
Conserved amino acid residues across pTF.CREG1 homologs.
Protein sequence alignment (Figure 6—source data 1) leading to the phylogenetic tree shown in Figure 6 was examined for amino acid residues that are at least 90% conserved across all homologs. Twelve such amino acid residues (blue triangles) in nine examined regions were identified. Additional few amino acid residues surrounding each conserved site are shown. Putative loop tetrapeptide motifs (see the main text for details) shown to the far right directly precede the conserved proline and cysteine amino acid residues in region 4. The DPES tetrapeptide motif in pTF.CREG1 is also found in Pteridomonas danica (single-celled heterotrophic heterokont), a Pterosperma species (single-celled green alga), Gossypium barbadense, Durio zibethinus, and Theobroma cacao (all three are plants). Black arrows point to pTF.CREG1 and its paralog Phatr3_J10972. Human CREG1 and pTF.CREG1 sequences are shaded. Numbers above amino acid sequences indicate alignment position. *17 AAs between glycine (G) and arginine (R) in the conserved region 1 were omitted.
Figure 6—figure supplement 2
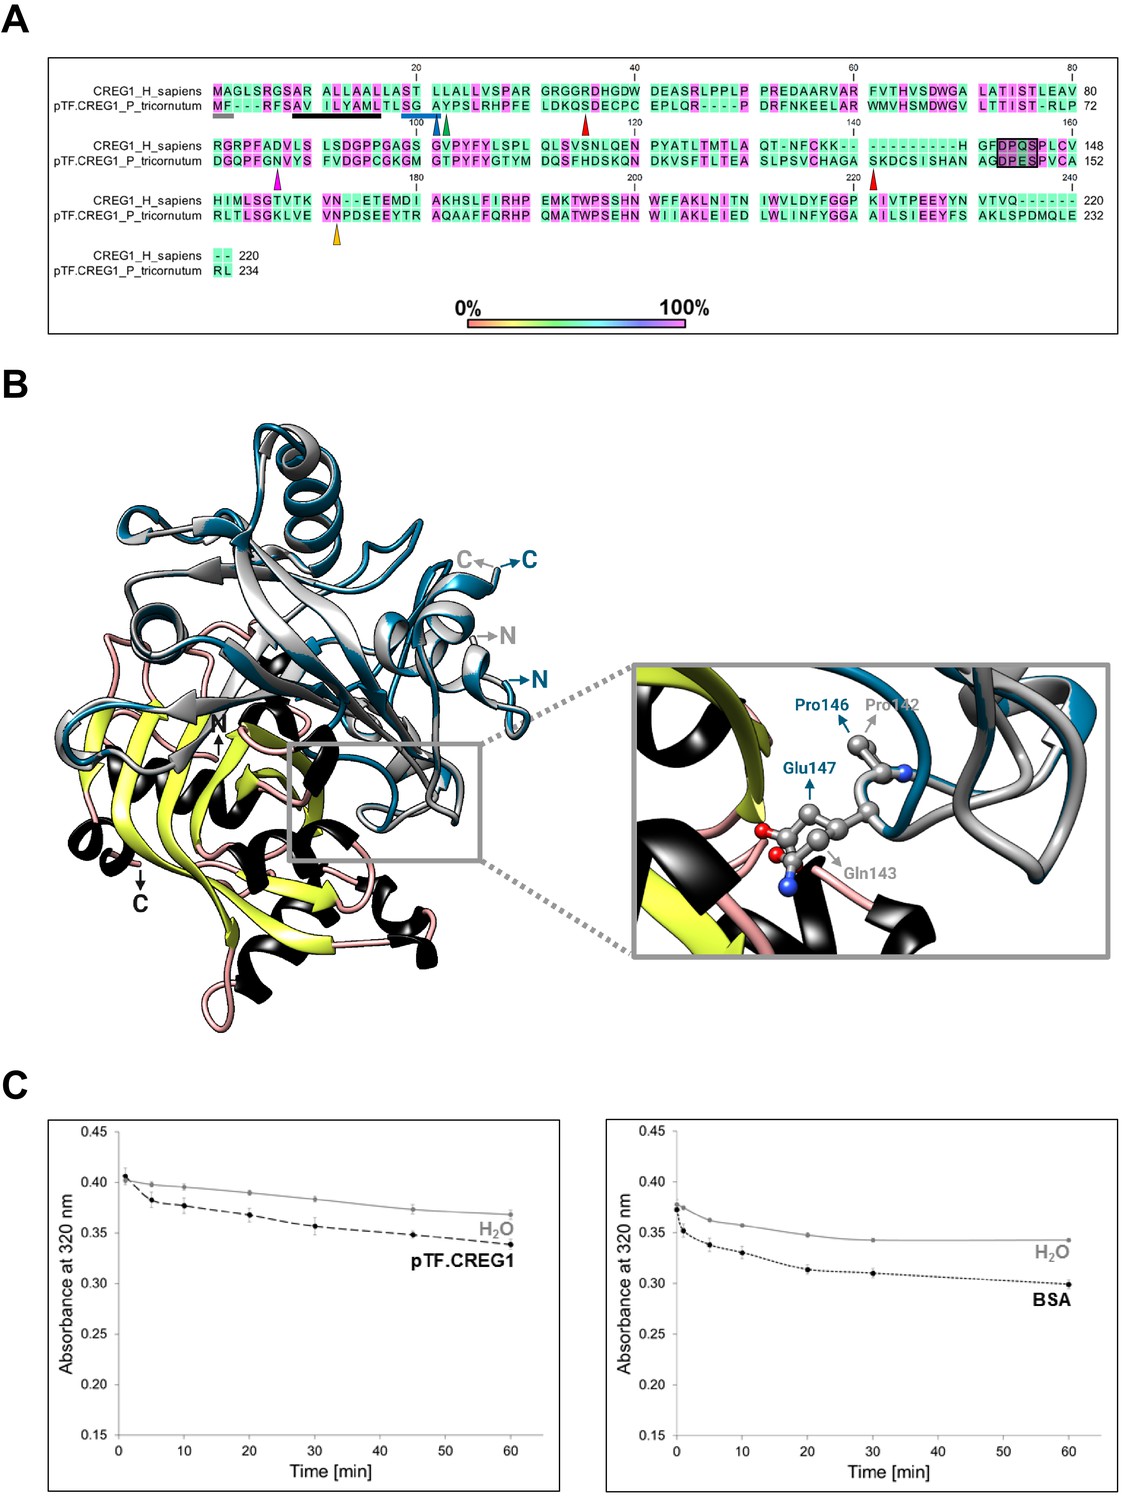
Bioinformatic, structural, and enzymatic insights suggest pTF.CREG1 has a non-catalytic function similar to human CREG1.
(A) pTF.CREG1 (UniProt ID: B7G9B3) features and its amino acid sequence alignment with human CREG1 (UniProt ID: O75629). pTF.CREG1 has a signal peptide that ends in SGA (blue underline; predicted with SignalP 4.1). This motif is closely related to Type I signal peptidase recognition site AXA indicating that pTF.CREG1 may enter the secretory pathway (Tuteja, 2005). Blue triangle points to a putative peptidase cut site. The core signal peptide sequence is enriched in hydrophobic amino acid residues, a common signal peptide feature (black underline). N-terminal methionine in Met-Phe (gray underline) may be acetylated by an N-terminal acetyltransferase (NAT), perhaps NatC or NatE which use Met-Phe sequence as their substrate (Ree et al., 2018). Tyrosine immediately succeeding SGA (green triangle) was used by ASAFind version 1.1.7 to classify pTF.CREG1 as a low confidence chloroplast-directed protein. Ser32 and Ser133 (red triangles) are predicted to undergo mucin-type O-glycosylation. Yellow triangle indicates an asparagine amino acid residue (Asn132) that is predicted to be N-glycosylated in human CREG1 (Sacher et al., 2005). These putative glycosylation sites further support the notion that the protein trafficks along the secretory pathway. Amino acid residues 141–144 in human CREG1 (DPQS)—which are located on the FMN binding pocket-occluding loop (Sacher et al., 2005)—are largely conserved (DPES) in pTF.CREG1 (shaded black rectangle). Finally, magenta triangle points to the arginine mutation site, Asn79, which may—like the corresponding Asp87 in human CREG1—prevent coordination of the terminal FMN phosphate (Figure 6—figure supplement 3A; Sacher et al., 2005). (B) Structural comparison between human CREG1 (PDB ID: 1XHN) and pTF.CREG1 homology model (created with Phyre2 web portal) suggests pTF.CREG1 is unable to coordinate FMN at the possible dimer interface (Figure 6—figure supplement 3B). Human CREG1 does not bind FMN in vitro (Sacher et al., 2005) due to the FMN binding pocket-occluding loop (gray rectangle). Pro146 and Glu147 in pTF.CREG1 are predicted to protrude into this pocket similarly to their human CREG1 counterparts Pro142 and Gln143. Gray: human CREG1 chain A (i.e. monomer 1), colored by secondary structure: human CREG1 chain B (i.e. monomer 2), blue: pTF.CREG1 homology model. N- and C-termini in protein structures are depicted. Created with UCSF Chimera version 1.11.1 and BioRender.com. (C) pTF.CREG1 does not reduce physiologically relevant flavins. Left: Comparison of NADPH oxidation (measured by decrease in absorbance at 320 nm) by recombinant pTF.CREG1 (long dashed black line) supplemented with flavins (flavin mononucleotide (FMN) and riboflavin) versus a no enzyme, water control (solid gray line). Right: The same assay, but here comparing a negative control protein without known NADPH oxidation activity (bovine serum albumin, BSA; short dashed black line) versus a no enzyme, water control (solid gray line). Experiments were started by the addition of protein or water blank and carried out in triplicate for each treatment. Background 320 nm absorbance of water blanks was subtracted from each replicate. Standard deviation is shown.
-
Figure 6—figure supplement 2—source data 1
Flavin reduction enzymatic assay data underpinning charts in Figure 6—figure supplement 2C.
- https://cdn.elifesciences.org/articles/52770/elife-52770-fig6-figsupp2-data1-v3.xlsx
Figure 6—figure supplement 3
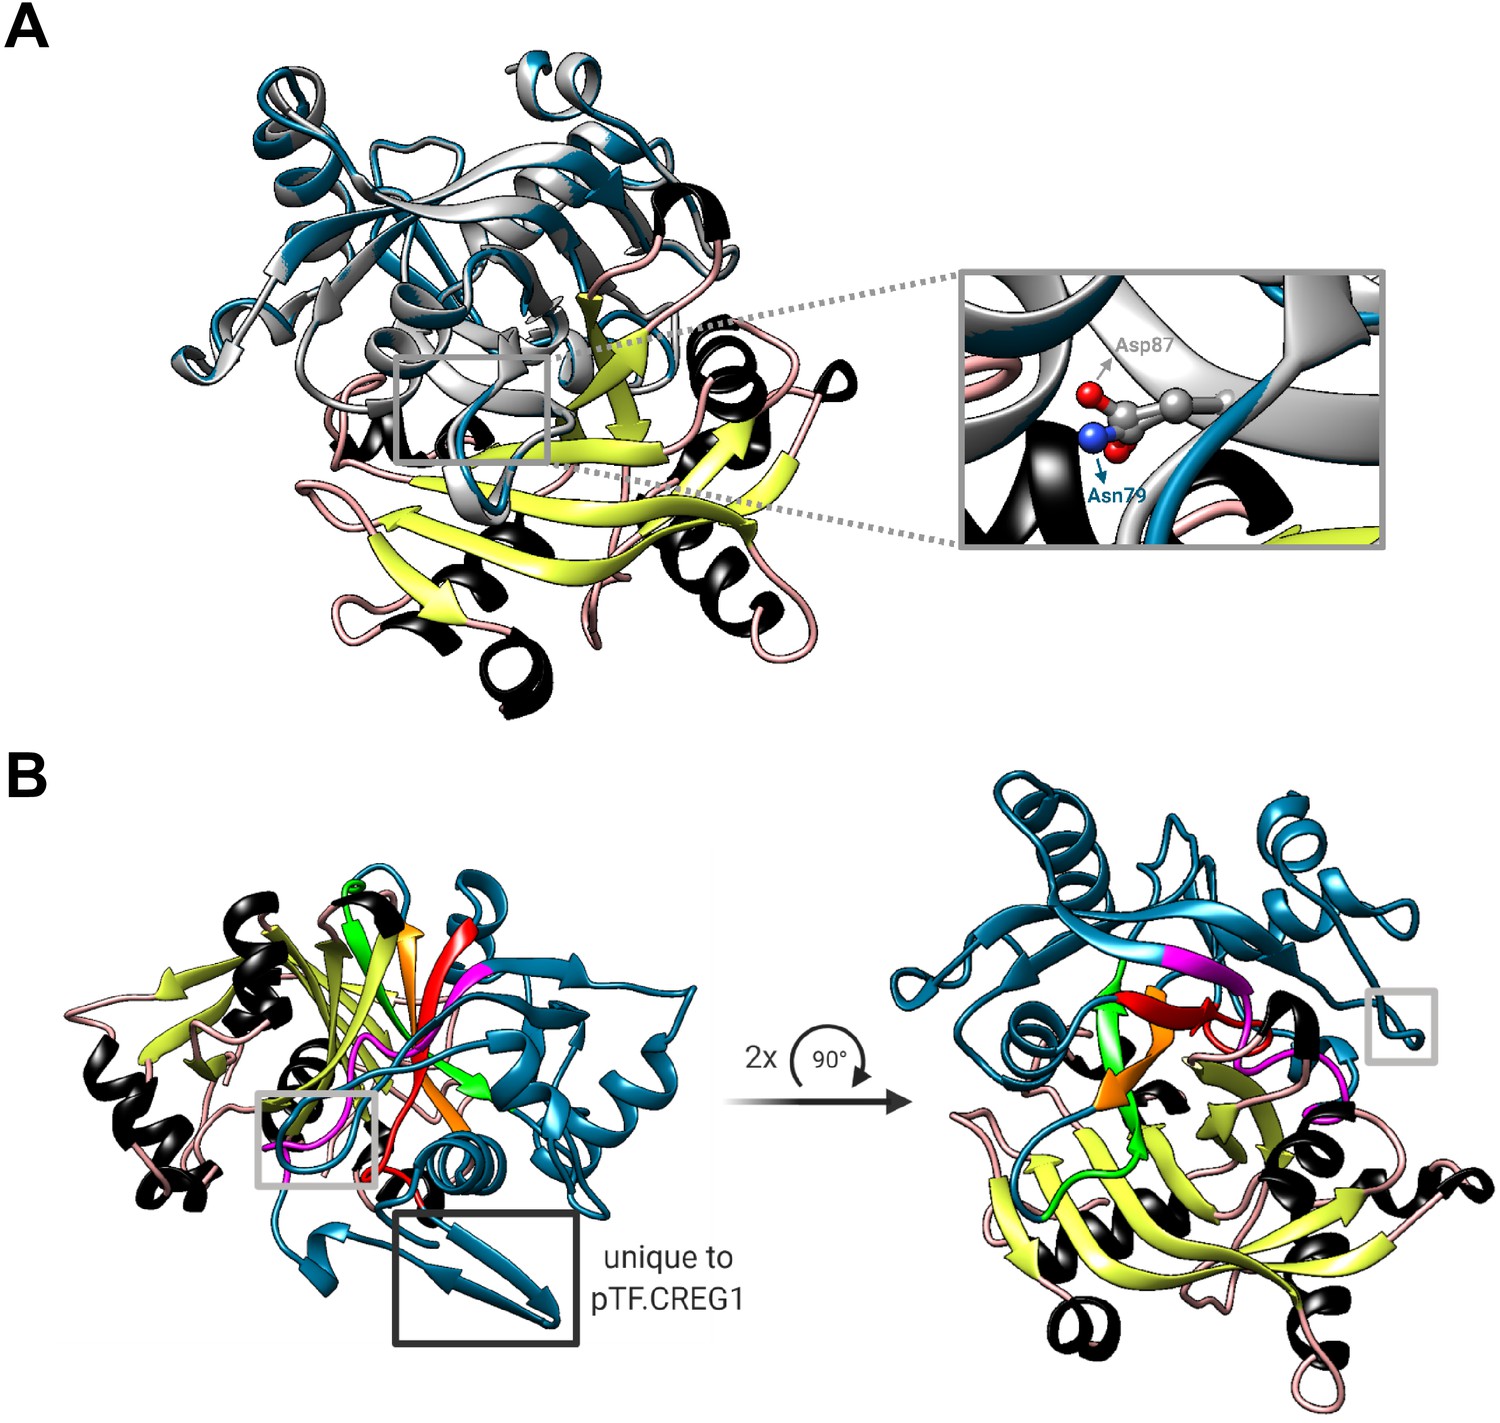
pTF.CREG1 is unlikely able to coordinate the terminal FMN phosphate and may act as a dimer in vivo.
(A) Two mutated arginine amino acid residues in human CREG1—one (Asp87) can be inferred from Sacher et al., 2005—are believed to prevent the protein from coordinating the terminal FMN phosphate. Asn79 in pTF.CREG1 is a corresponding amino acid residue to the human Asp87 (inset). The steric similarity between their side chains sugests that pTF.CREG1 would also be unable to coordindate the terminal FMN phosphate even in the absence of the FMN binding pocket-occluding loop. Gray: human CREG1 chain A (i.e. monomer 1 from PDB ID: 1XHN), colored by secondary structure: human CREG1 chain B (i.e. monomer 2 from PDB ID: 1XHN), blue: pTF.CREG1 homology model. Created with UCSF Chimera version 1.11.1 and BioRender.com. (B) Putative homodimerization region in the pTF.CREG1 homology model exhibits features of the human CREG1 dimer one. Human CREG1 chain A (i.e. monomer 1 from PDB ID: 1XHN) from the visualization presented in Figure 6—figure supplement 2B was hidden which left us with a chimeric human-diatom dimer. Colored by secondary structure: human CREG1 chain B (i.e. monomer 2 from PDB ID: 1XHN), blue: pTF.CREG1 homology model. Gray rectangles indicate the FMN binding pocket-occluding loop (see the main text). Black rectangle depicts a modeled β-sheet region in pTF.CREG1 that is absent from human CREG1. Colored in magenta, red, orange, and green is a possible homodimerization interface in pTF.CREG1. Amino acid residue composition (written in N-terminal→C-terminal direction) corresponding to each color is as follows: magenta: PESPVCARLTLSG, red: KVSFTLTEASL, orange: WGVLTTI, green: PDGQPFGNVYSF. Bold: hydrophobic, underlined: hydrophobic and/or following Sacher et al., 2005. Created with UCSF Chimera version 1.11.1 and BioRender.com.
Figure 6—figure supplement 4
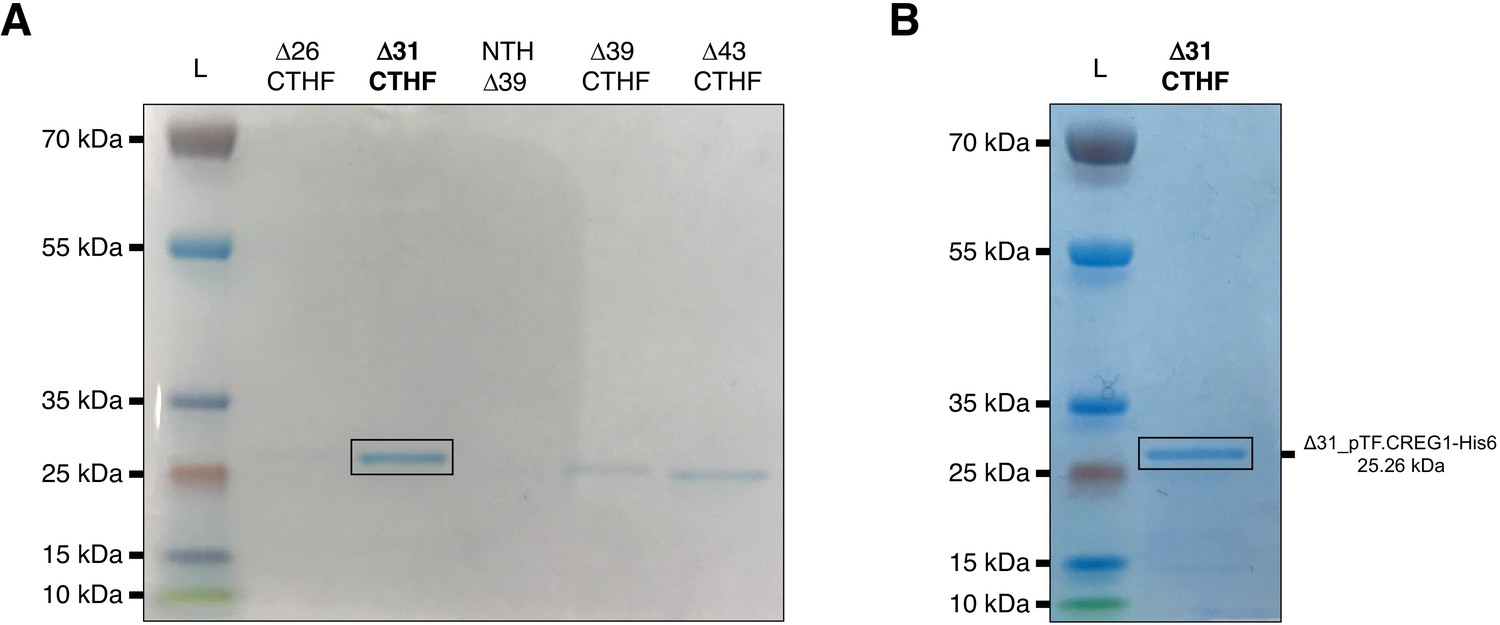
pTF.CREG1 expression and purification.
Briefly, genes encoding various pTF.CREG1 truncations were placed under arabinose-inducible promoter, expressed in BL21 E. coli cells, and purified using cobalt, Co2+, resin-based gravity flow columns. CTHF: C-terminal His6 and FLAG tag. NTH: N-terminal His6 tag. L: PageRuler Plus Prestained Protein Ladder. (A) Final elutions of various pTF.CREG1 truncations from small scale (50 mL) protein expression experiments. Δ31_pTF.CREG1-His6 (bolded and black rectangle) was selected for scale-up. (B) The final Δ31_pTF.CREG1-His6 elution from a large-scale (2 L) protein expression experiment. NuPage 4–12% Bis-Tris gels were used to resolve protein samples.
Figure 7 with 2 supplements
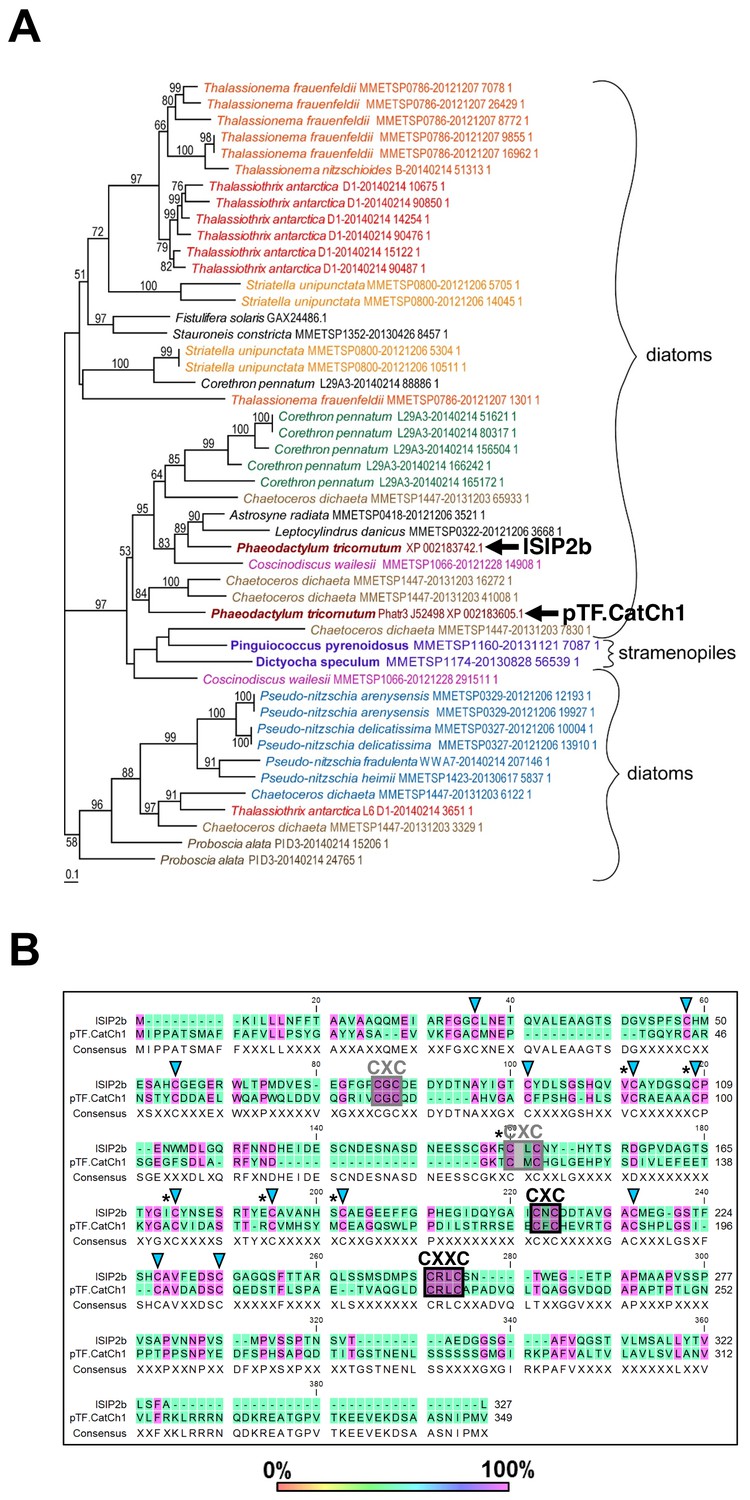
pTF.CatCh1 is a cysteine-rich heterokont-specific protein.
(A) pTF.CatCh1 homolog search was performed with NCBI and marine microbial eukaryote (MMETSP) databases. Numerous, almost exclusively diatom, proteins were identified. Interestingly, pTF.CatCh1 is paralogous to ISIP2b (black arrows). Scale bar: 0.1 substitutions per position. (B) pTF.CatCh1 and ISIP2b share three CXC and one CXXC motifs (boxed) commonly found in redox-active proteins and proteins involved in cellular metal homeostasis. Black boxes indicate the two CX(X)C motifs conserved across the majority of pTF.CatCh1 homologs. Blue triangles: additional conserved cysteine amino acid residues between pTF.CatCh1 and ISIP2b for a total of 20. Asterisks: cysteine amino acid residues that are 100% conserved across all homologs.
-
Figure 7—source data 1
Amino acid sequence alignment underpinning the phylogenetic tree in Figure 7A.
- https://cdn.elifesciences.org/articles/52770/elife-52770-fig7-data1-v3.zip
Figure 7—figure supplement 1
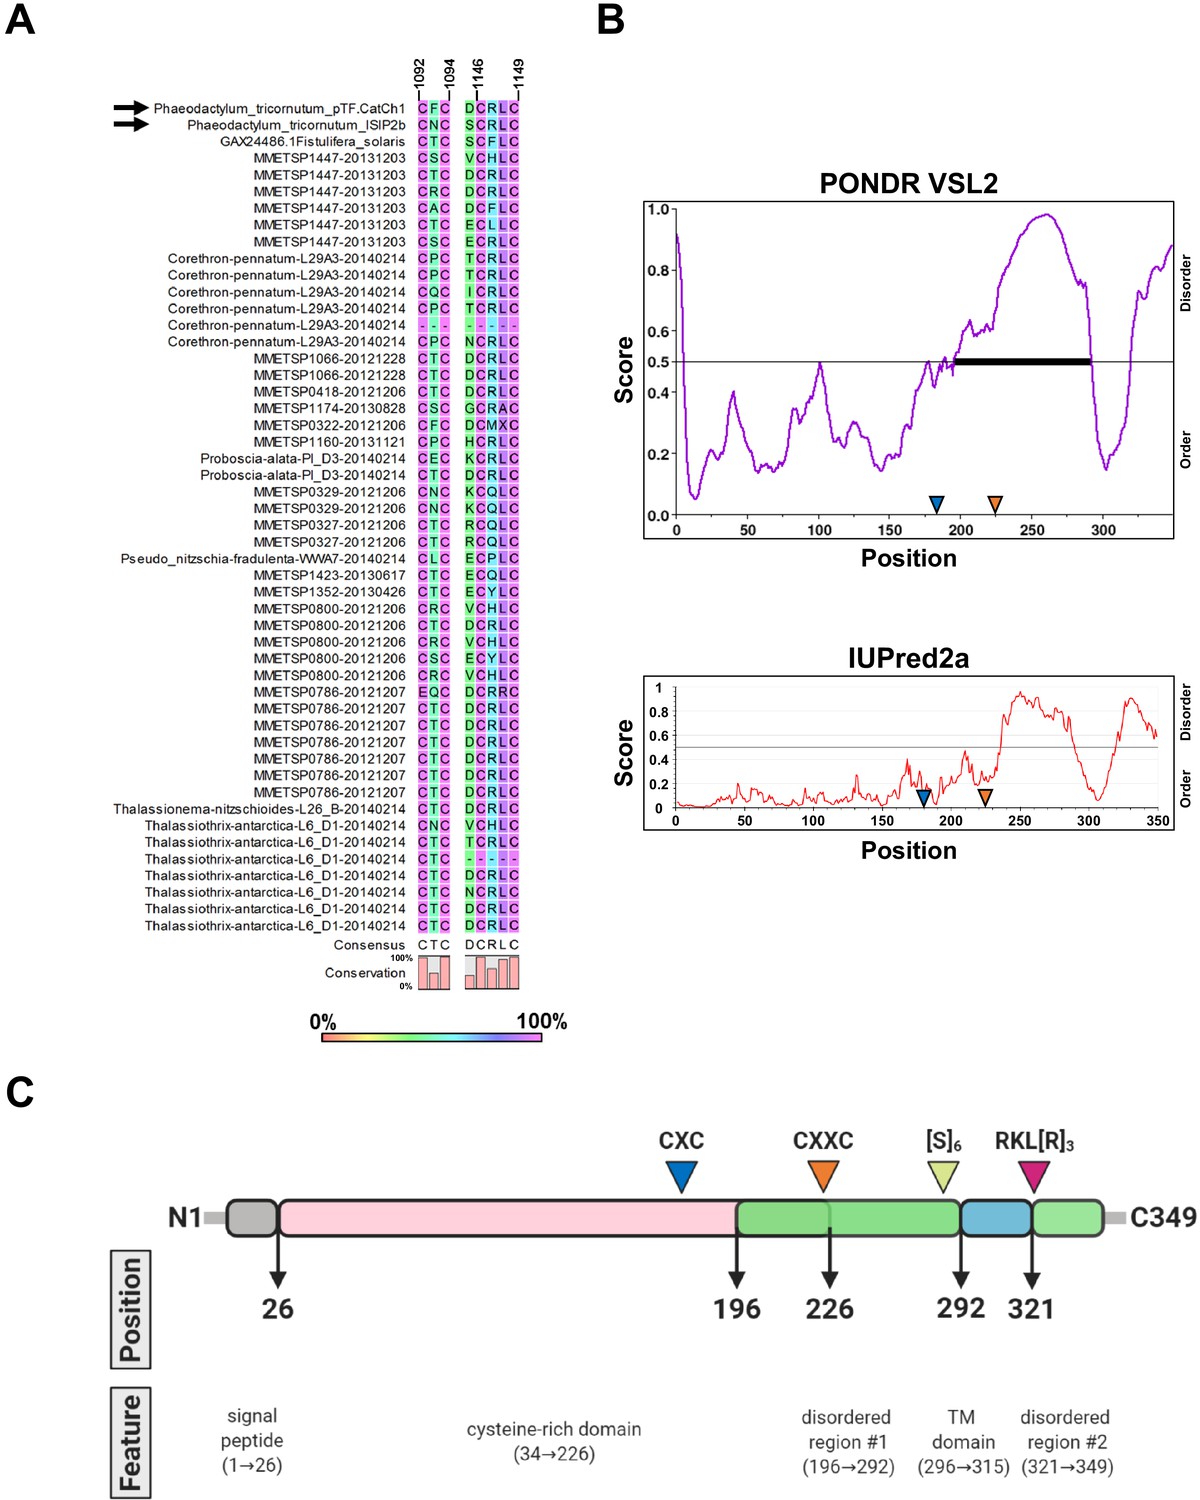
Conservation of CX(X)C motifs in pTF.CatCh1 homologs and pTF.CatCh1 features.
(A) CXXC and the adjacent CXC motifs are present in all but two identified pTF.CatCh1 homologs. Six additional cysteines are 100% conserved (Figure 7—source data 1). pTF.CatCh1 and ISIP2b (paralogs) are marked with black arrows. Amino acid residues immediately preceding the CXXC motif are also shown as aspartic acid residue (D) at this position is known to promote divalent metal ion binding (Banci et al., 2002; Banci et al., 2006). Numbers above amino acid sequences indicate alignment position. (B) pTF.CatCh1 contains two disordered C-terminal regions flanking the transmembrane domain. CXXC is predicted to be in one of them by PONDR VSL2 (top). No cysteines are predicted to be in this disordered region by IUPred2a (bottom). Approximate locations of the conserved CXC and CXXC motifs are depicted with blue and orange triangles, respectively. (C) pTF.CatCh1 features assuming disorder prediction with PONDR VSL2. Signal peptide (AAs 1–26; gray) is followed by a cysteine-rich domain (20 cysteines between amino acid residue 34 and 226; pink), and two disordered regions (green). The transmembrane (TM) domain (AAs 296–315; blue) nested between the predicted disordered regions is flanked by a polyserine ([S]6) and an arginine-rich (RKL[R]3) amino acid residue stretch. N- and C-terminus are shown. Created with BioRender.com.
Figure 7—figure supplement 2
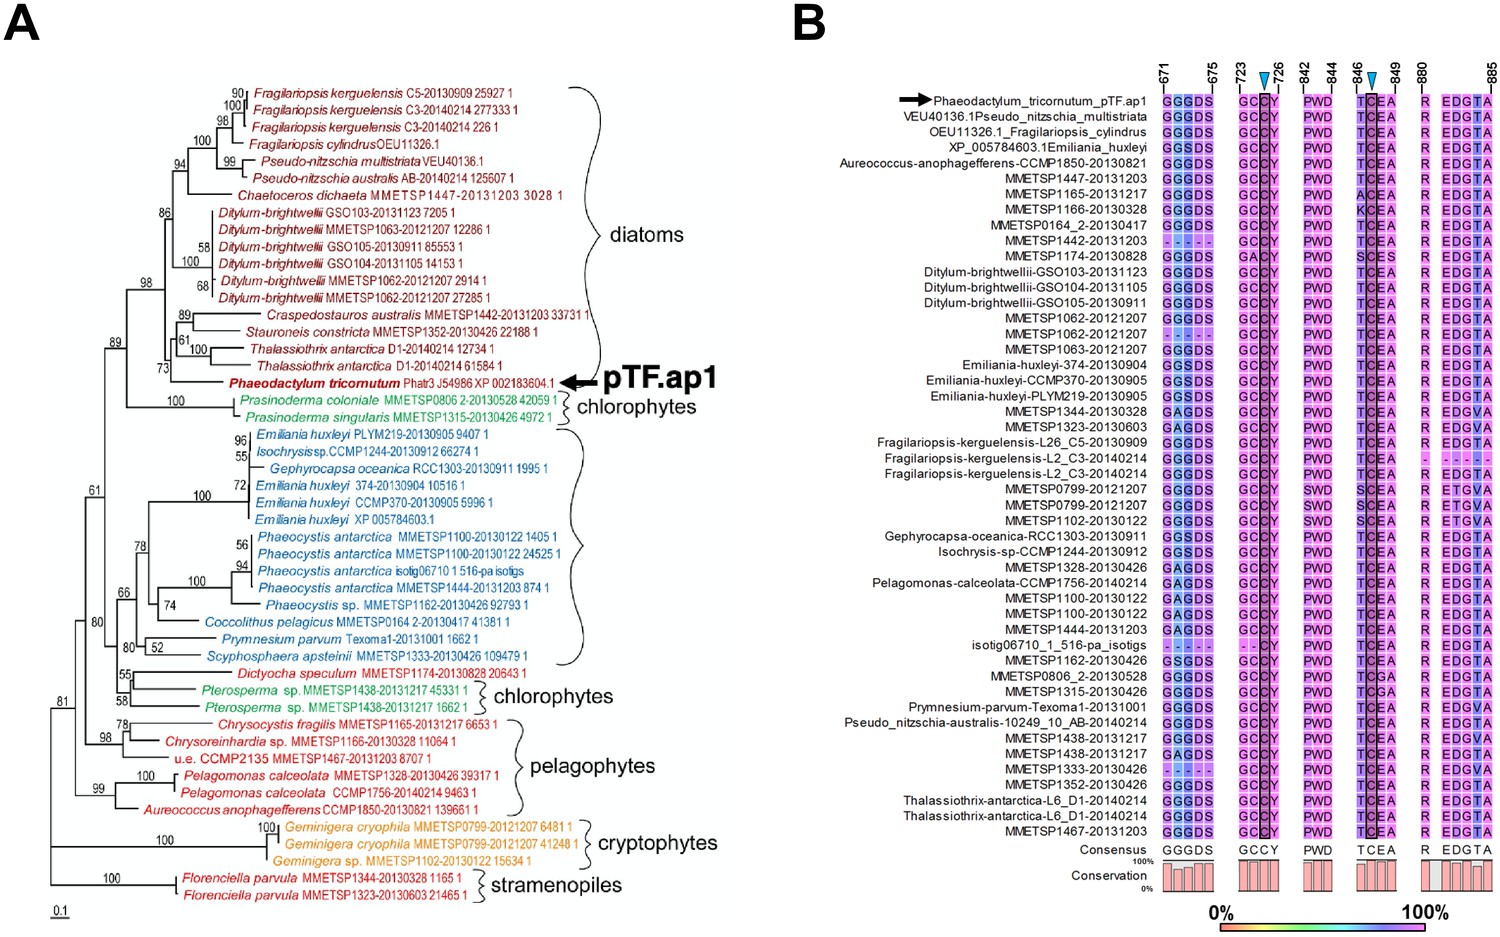
pTF.ap1 phylogeny and conserved motifs.
(A) pTF.ap1 (black arrow) homologs are present in diatoms and other marine microeukaryotes. Homolog search was performed with NCBI and marine microbial eukaryote (MMETSP) databases. Some notable species include common polar diatoms Fragilariopsis kergulensis and Fragilariopsis cylindrus, toxin-producing microeukaryotes (diatoms from the genus Pseudo-nitzschia, haptophyte Prymnesium parvum, and pelagophyte Aureococcus anophagefferens), cosmopolitan diatom Ditylum brightwelli, haptophyte Emiliana huxleyi, ultraplanktonic species Pelagomonas calceolate, colonial species Prasinoderma coloniale and Phaeocystis antarctica. Scale bar: 0.1 substitutions per position. (B) pTF.ap1 (black arrow) contains highly conserved motifs (five shown here). There are three 100% conserved cysteine amino acid residues across pTF.ap1 homologs (Figure 7—figure supplement 2—source data 1) in addition to the two here (blue triangles and gray shade). Numbers above amino acid sequences indicate alignment position.
-
Figure 7—figure supplement 2—source data 1
Amino acid sequence alignment underpinning the phylogenetic tree in Figure 7—figure supplement 2A.
- https://cdn.elifesciences.org/articles/52770/elife-52770-fig7-figsupp2-data1-v3.zip
Figure 8 with 1 supplement
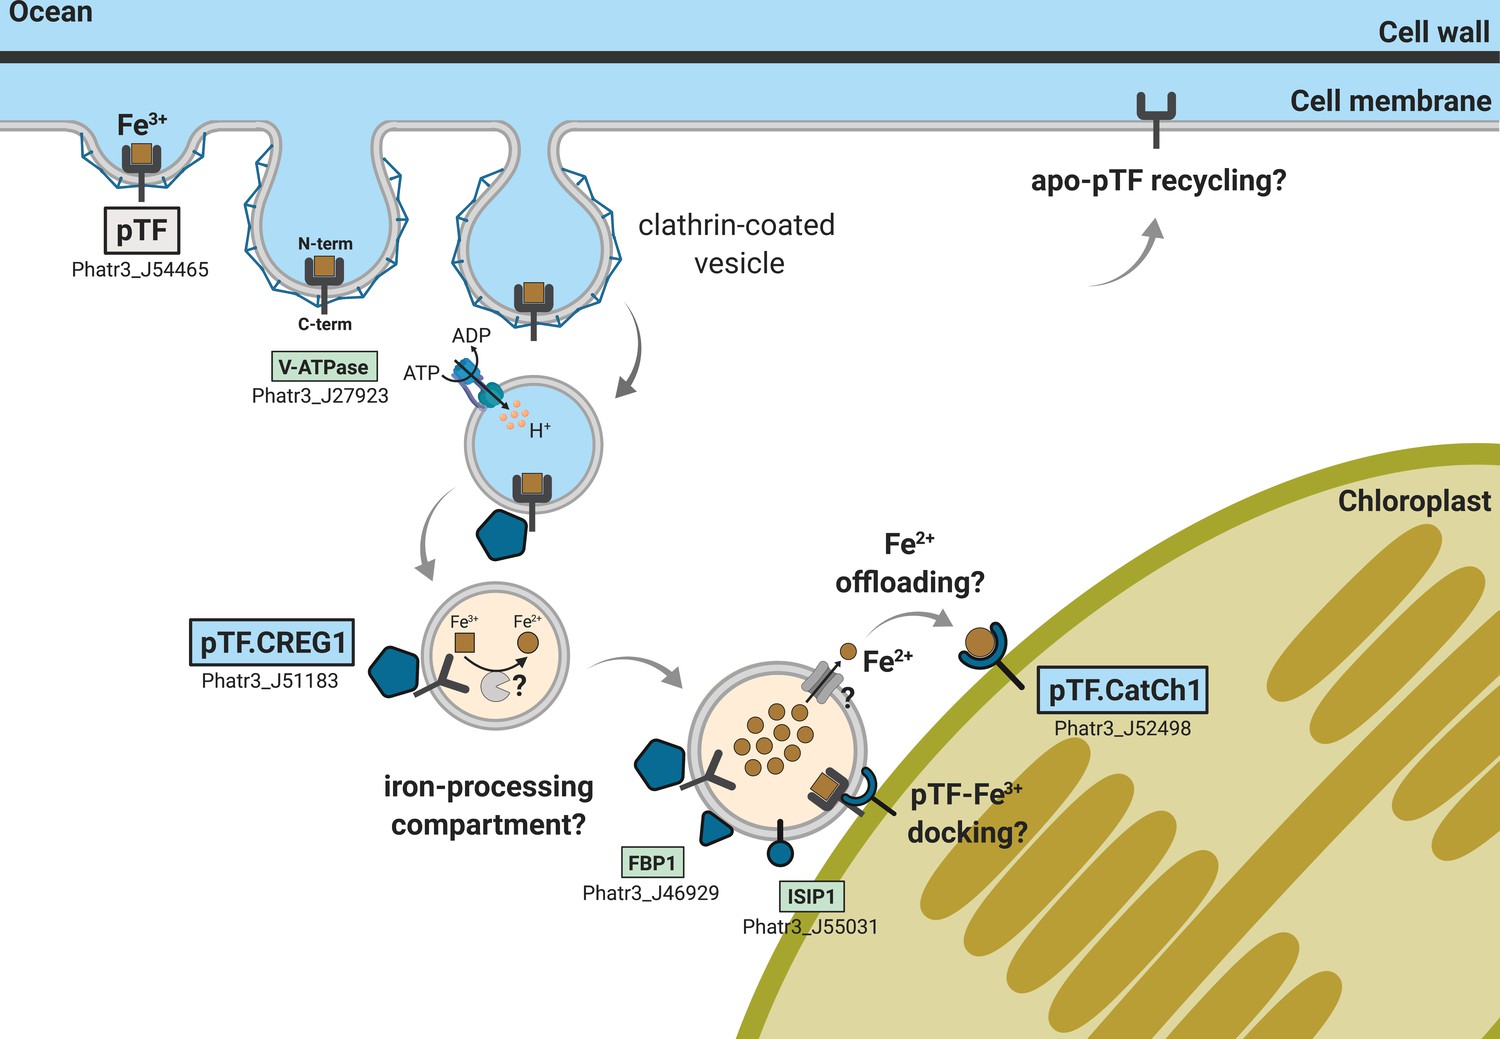
Emerging view of intracellular inorganic iron allocation pathway in Phaeodactylum tricornutum.
We propose a model for clathrin-mediated internalization of phytotransferrin (pTF)-bound ferric, Fe3+, iron, and its trafficking to the chloroplast periphery. In this model, pTF releases Fe3+ after undergoing a structural change upon endosome acidification driven by a vacuolar-type H+-ATPase. pTF.CREG1 may regulate this process at the endosome periphery and perhaps also in earlier endocytosis stages closer to the cell surface. It is unclear how intravesicular reduction of ferric iron is achieved and how the resulting ferrous iron gets exported. Given that no DMT1/NRAMP2 homologs are present in P. tricornutum, Zrt- and Irt-like proteins (ZIPs)—known to export Fe2+ from intracellular compartments—may mediate the latter (Blaby-Haas and Merchant, 2012; Kustka et al., 2007; Lampe et al., 2018). Ferrous iron could be offloaded to pTF.CatCh1 on the outer chloroplast membrane and ultimately transported further into the chloroplast interior for cellular assimilation and use (e.g. iron–sulfur cluster biosynthesis for incorporation into photosystems I and II). pTF.CatCh1 may alternatively (or additionally) be responsible for pTF recruitment to the chloroplast margin. The enrichment of FBP1 and ISIP1—both previously shown to localize to intracellular vesicles in P. tricornutum (Coale et al., 2019; Kazamia et al., 2019)—in our proximity proteomics experiment suggests the whole pathway intersects with that for internalizing organic, siderophore-bound, iron. Gray panel: pytotransferrin (pTF). Blue panels: proteins colocalized with pTF. Green panels: additional proteins enriched in our APEX2 experiment. One phytotransferrin-Fe3+ complex is shown for clarity. Orange vesicle interior indicates pH drop due to ATPase activity. Detailed chloroplast membrane layers are omitted (diatom chloroplasts contain four membranes). Created with BioRender.com.
Figure 8—figure supplement 1
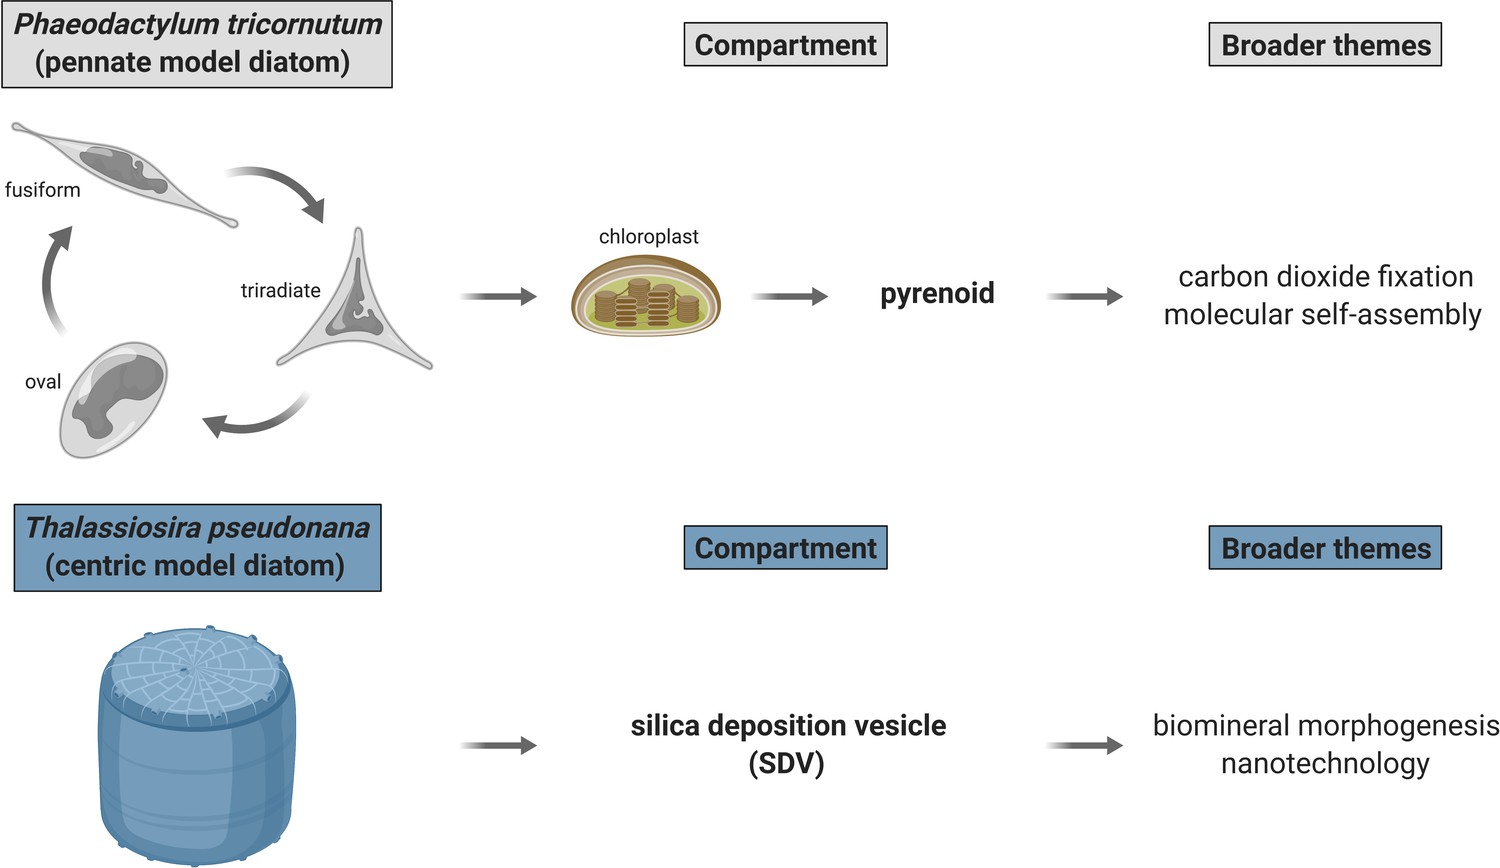
Outstanding biological problems in established model marine diatoms poised to be advanced with proximity-dependent proteomic mapping approaches.
Two diatom compartments of immediate interest are pyrenoid—proteinaceous RuBisCO-containing subchloroplastic organelle—and silica deposition vesicle (SDV)—diatom cell wall biosynthesis site. P. tricornutum and T. pseudonana—genetically tractable model marine diatoms—are appropriate for immediate dissection of pyrenoid and SDV proteomic composition, respectively. Created with BioRender.com.
Tables
Key resources table
| Reagent type (species) or resource | Designation | Source or reference | Identifiers | Additional information |
|---|---|---|---|---|
| Gene (Phaeodactylum tricornutum) | pTF; ISIP2a | PMID:29539640 | Ensembl-Protists:Phatr3_J54465 | Jeffrey B. McQuaid |
| Gene (Phaeodactylum tricornutum) | pTF.CREG1 | This paper | Ensembl-Protists:Phatr3_J51183 | The first subcellular localization and enzymatic activity reports for this P. tricornutum protein |
| Gene (Phaeodactylum tricornutum) | pTF.CatCh1 | This paper | Ensembl-Protists:Phatr3_J52498 | The first subcellular localization report for this P. tricornutum protein |
| Gene (Phaeodactylum tricornutum) | pTF.ap1 | This paper | Ensembl-Protists:Phatr3_J54986 | The first subcellular localization report for this P. tricornutum protein |
| Gene (Glycine max) | APEX2 | PMID:25419960 | NCBI-Gene:553156 | APEX2 mutations relative to wild-type APX (encoded by NCBI-Gene:553156): K14D, W41F, E112K, A134P |
| Strain, strain background (Phaeodactylum tricornutum) | Phaeodactylum tricornutum; P. tricornutum; WT P. tricornutum | NCMA | Catalog #:CCMP632 Starter Culture 2 × 15 ml | CCMP632 is synonymous with CCMP2561 and CCAP 1055/1 |
| Strain, strain background (Escherichia coli) | EPI300 | Lucigen | Catalog #:EC300110 | Electrocompetent; recommended for bacterial conjugation of diatoms |
| Strain, strain background (Escherichia coli) | BL21 | NEB | Catalog #:C2530H | Chemically competent |
| Genetic reagent (Phaeodactylum tricornutum) | ΔpTF P. tricornutum | PMID:29539640 | Jeffrey B. McQuaid; TALEN-generated pTF knockout P. tricornutum strain; available from the Allen Lab | |
| Transfected construct (Phaeodactylum tricornutum) | pJT_NR_pTF-AP2 | This paper | See Figure 2B, Materials and methods, and Supplementary file 1—Table S4; available from the Allen Lab | |
| Transfected construct (ΔpTF Phaeodactylum tricornutum) | pJT_native_pTF-mCherry | This paper | See Materials and methods and Supplementary file 1—Table S4; available from the Allen Lab | |
| Transfected construct (Phaeodactylum tricornutum) | pJT_pTF-mCherry _pTF.CREG1-EYFP | This paper | See Materials and methods and Supplementary file 1—Table S4; available from the Allen Lab | |
| Transfected construct (Phaeodactylum tricornutum) | pJT_pTF-mCherry _pTF.CatCh1-EYFP | This paper | See Materials and methods and Supplementary file 1—Table S4; available from the Allen Lab | |
| Transfected construct (Phaeodactylum tricornutum) | pJT_pTF-mCherry _pTF.ap1-EYFP | This paper | See Materials and methods and Supplementary file 1—Table S4; available from the Allen Lab | |
| Transfected construct (Escherichia coli BL21) | pJT_Δ31_pTF.CREG1-His6 | This paper | See Materials and methods and Supplementary file 1—Table S4; available from the Allen Lab | |
| Antibody | Anti-pTF (rabbit monoclonal) | PMID:29539640 | WB (1:10,000 of 1.14 mg/mL stock); custom-made at OriGene; available from the Allen Lab | |
| Recombinant DNA reagent | pPtPBR1 | Addgene | Catalog #:80388 | Episomal vector for bacterial conjugation of P. tricornutum; available from the Allen Lab |
| Recombinant DNA reagent | pTA-Mob | PMID:24595202 | Mobilization plasmid for bacterial conjugation of diatoms; available from the Allen Lab | |
| Recombinant DNA reagent | PtpBAD-CTHF | PMID:30262498 | Escherichia coli protein expression vector; available from the Allen Lab | |
| Sequence-based reagent | JT01 | This paper | PCR primer | CGAATCAGGATCTAAAATGAACGCACGTCTGCGACCTGAGCAA; see Materials and methods and Supplementary file 1—Table S3 |
| Sequence-based reagent | JT02 | This paper | PCR primer | GTCGCTTCACGTTCGCTC; see Materials and methods and Supplementary file 1—Table S3 |
| Sequence-based reagent | JT03 | This paper | PCR primer | GATACGCGAGCGAACGTGAAGCGACTCACGTAGTGAAGTGATGTTG; see Materials and methods and Supplementary file 1—Table S3 |
| Sequence-based reagent | JT04 | This paper | PCR primer | TTCCAGACGTAGAACCACTCCCTTTGATAGGAGTGCTGCCAGTG; see Materials and methods and Supplementary file 1—Table S3 |
| Peptide, recombinant protein | PrimeSTAR GXL DNA Polymerase | Takara Bio | Catalog #:R050B | Recommended for amplifying (parts of) diatom episomal vectors |
| Peptide, recombinant protein | Bovine Serum Albumin, Biotinylated | Thermo Fisher Scientific | Catalog #:29130 | |
| Peptide, recombinant protein | Streptavidin, horseradish peroxidase (HRP) conjugate | Thermo Fisher Scientific | Catalog #:S911 | WB (1:15,000) |
| Peptide, recombinant protein | WesternSure Pre-stained Chemiluminescent Protein Ladder | Li-COR | Catalog #:926–98000 | Recommended for streptavidin blotting |
| Commercial assay or kit | Phire Plant Direct PCR Master Mix | Thermo Fisher Scientific | Catalog #:F160L | Recommended for diatom genotyping |
| Commercial assay or kit | Phire Plant Direct PCR Kit | Thermo Fisher Scientific | Catalog #:F130WH | Recommended for diatom genotyping |
| Commercial assay or kit | WesternBreeze Chemiluminescent Kit, anti-rabbit | Thermo Fisher Scientific | Catalog #:WB7106 | |
| Commercial assay or kit | TMT10plex Isobaric Label Reagent Set | Thermo Fisher Scientific | Catalog #:90406 | |
| Chemical compound, drug | Amplex UltraRed Reagent | Thermo Fisher Scientific | Catalog #:A36006 | |
| Chemical compound, drug | 3,3’-Diaminobenzidine (DAB) | Sigma-Aldrich | Catalog #:D8001 | |
| Chemical compound, drug | D-(+)-Biotin-tyramine amide (biotin-phenol) | Berry and Associates | Catalog #:BT 1015 | |
| Software, algorithm | SEQUEST (v. 28, rev. 12) algorithm | PMID:24226387 | Algorithm for matching tandem mass spectra with peptide sequences | |
| Software, algorithm | JMP | SAS Institute | Interactive statistical discovery software | |
| Software, algorithm | R | R Core Team | Free software environment for statistical computing and graphics | |
| Software, algorithm | ASAFind | PMID:25438865 | Plastidial protein localization prediction tool for algae with red secondary plastids; available at https://rocaplab.ocean.washington.edu/tools/asafind/ | |
| Software, algorithm | BLASTP | PMID:2231712 | Algorithm for identifying homologous proteins | |
| Software, algorithm | HMMER | PMID:9918945 | Software for identifying homologous proteins (or nucleotide sequences) using profile hidden Markov models | |
| Software, algorithm | MAFFT | PMID:12136088 | Multiple amino acid sequence alignment algorithm based on fast Fourier transform | |
| Software, algorithm | SeaView 4 | PMID:19854763 | Graphical User Interface (GUI)-based molecular phylogeny software | |
| Software, algorithm | IQ-TREE | PMID:25371430 | Algorithm for inferring phylogenetic trees by maximum likelihood | |
| Software, algorithm | Phyre2 | PMID:25950237 | Web server to predict and analyze protein structure, function and mutations; available at http://www.sbg.bio.ic.ac.uk/~phyre2/html/page.cgi?id=index | |
| Software, algorithm | UCSF Chimera version 1.11.1 | PMID:15264254 | Software for interactive visualization and analysis of molecular structures and related data | |
| Other | Yeast Vacuole Membrane Marker MDY-64 | Thermo Fisher Scientific | Catalog #:Y7536 | Membrane stain |
| Other | Pierce Streptavidin Magnetic Beads | Thermo Fisher Scientific | Catalog #:88816 | Protein-coated iron oxide microparticles |
| Other | Phaeodactylum tricornutum proteome | UniProt | Proteome-ID:UP000000759 | Reference proteomic database |
| Other | Phatr3 P. tricornutum genomic database | Ensembl Protists | Genome-Assembly:ASM15095v2 | Reference genomic database |
| Other | Transcriptomic data | PMID:27973599 | S1 Dataset. Active transcriptome and assignment of genes to WGCNA modules and response types. | P. tricornutum transcriptomic dataset; see Figure 5—figure supplement 1—source data 1 |
| Other | Marine Microbial Eukaryote Transcriptome Sequencing Project (MMETSP) database | PMID:24959919 | NCBI-BioProject:PRJNA231566 | Transcriptomic database |
Additional files
-
Supplementary file 1
Supplementary tables.
Table S1. Predicted endogenous biotinylated proteins are present at similar levels in WT and pTF-APEX2 proteomic samples. Table S2: Features of the three proteins co-expressed from a gene cluster on chromosome 20. Table S3: Molecular cloning primers. Table S4: Constructed Phaeodactylum tricornutum episomes and Escherichia coli vectors with expression cassette details and fusion protein amino acid sequences.
- https://cdn.elifesciences.org/articles/52770/elife-52770-supp1-v3.docx
-
Transparent reporting form
- https://cdn.elifesciences.org/articles/52770/elife-52770-transrepform-v3.docx
Download links
A two-part list of links to download the article, or parts of the article, in various formats.
Downloads (link to download the article as PDF)
Open citations (links to open the citations from this article in various online reference manager services)
Cite this article (links to download the citations from this article in formats compatible with various reference manager tools)
Proximity proteomics in a marine diatom reveals a putative cell surface-to-chloroplast iron trafficking pathway
eLife 10:e52770.
https://doi.org/10.7554/eLife.52770


