C-mannosylation supports folding and enhances stability of thrombospondin repeats
- Hannover Medical School, Germany
- Universitat Autònoma de Barcelona, Spain
Figures
Figure 1

C-mannosylation of thrombospondin type 1 repeats.
(A) C-mannose (green) linked to the indole C2 atom of a tryptophan (light-blue) by a C-C bond. (B) Modeled structure of C. elegans UNC-5 TSR2 with tryptophans (blue) and arginines (red) arranged in a Trp-Arg ladder. C-mannoses (green) are displayed on the first two tryptophans of the WXXWXXW motif, according to previous findings (Buettner et al., 2013), (Figure 3—figure supplement 1). Oxygen atoms are indicated in red, nitrogen atoms in dark-blue and disulfide bonds in yellow. (C) Natural C. elegans UNC-5 and soluble TSR constructs applied in this study. Ig: immunoglobulin-like domain; TSR: thrombospondin type 1 repeat; TM: transmembrane domain; signal: cleavable secretion signal; V5 and His6: tags for detection and purification.
Figure 2 with 1 supplement
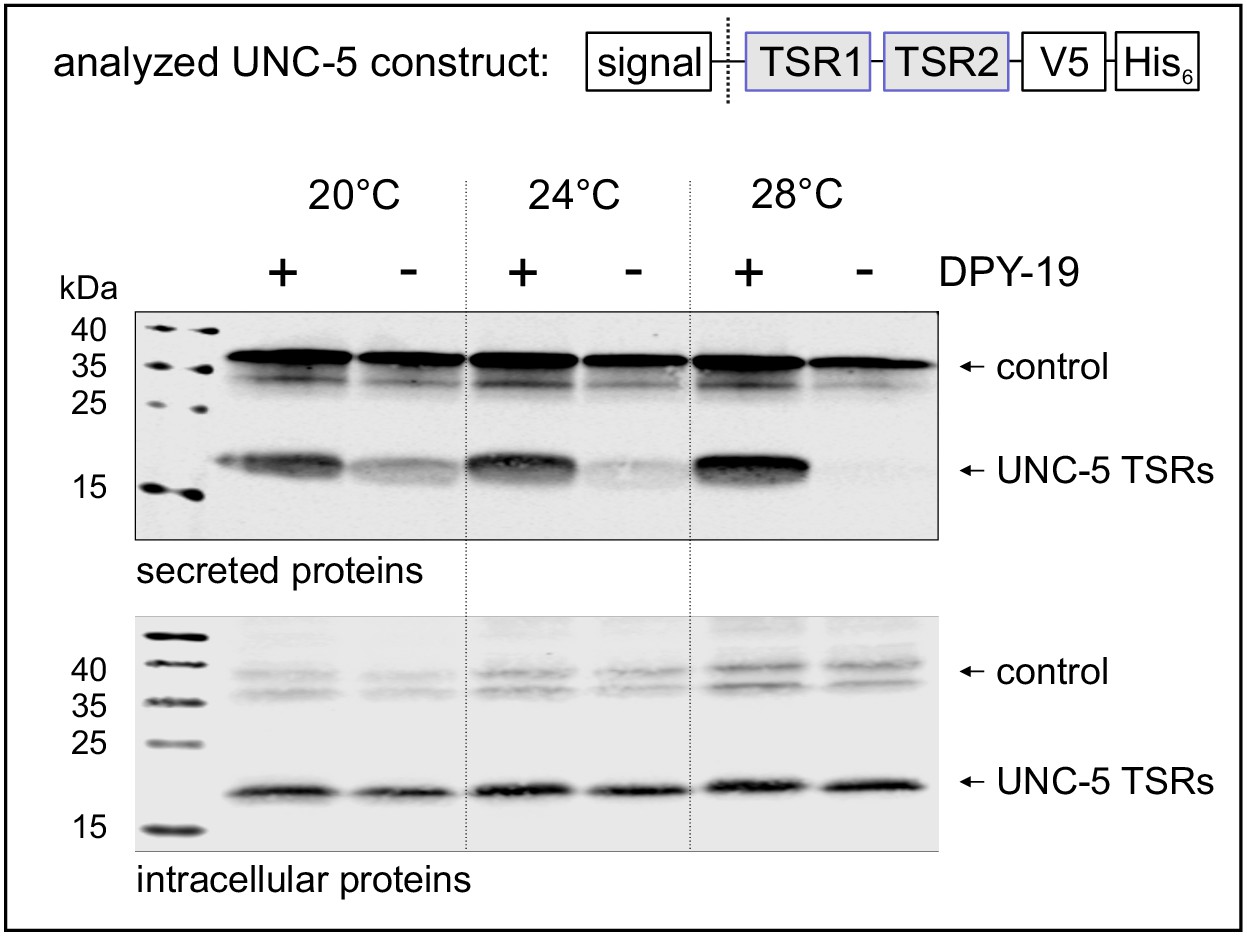
Effects of C-mannosylation on TSR secretion.
Western blot analysis of secreted (upper panel) and intracellular (lower panel) UNC-5 TSRs 1+2 expressed in Drosophila S2 cells, co-transfected with C. elegans DPY-19 (+) or an empty vector (-) and incubated at 20, 24°C and 28°C as indicated. V5-tagged EGF repeats 16–20 from Drosophila Notch were used as transfection and secretion control. Both proteins were detected by anti-V5 antibody. An analog temperature-sensitivity can be observed in C. elegans dpy-19 mutants (Figure 2—figure supplement 1).
Figure 2—figure supplement 1
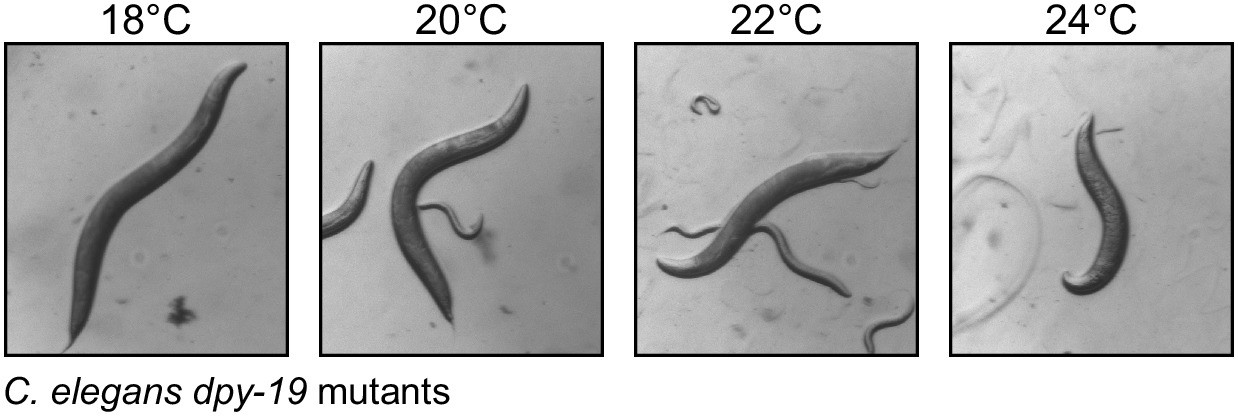
The temperature-sensitive dumpy phenotype of C. elegans dpy-19 mutants.
C. elegans dpy-19(e1259)III worms (strain CB1259 from the Caenorhabditis Genetics Center) were grown on E. coli OP50 cells as described in WormBook (www.wormbook.org) at 18, 20, 22 and 24°C.
Figure 3 with 2 supplements
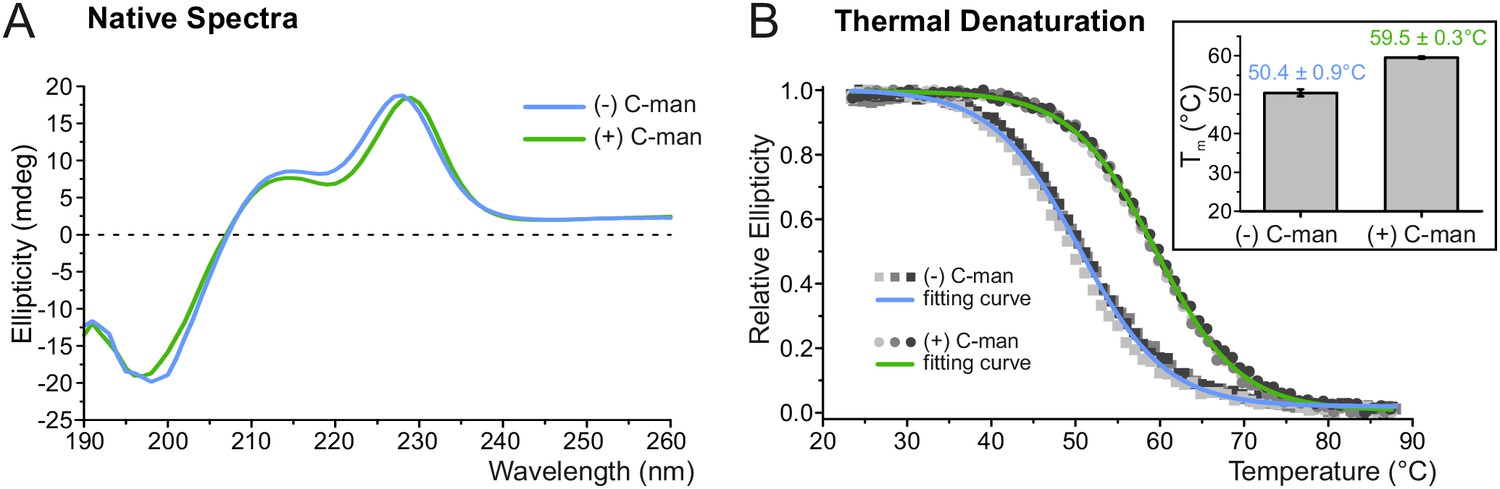
C-mannosylation increases resistance of UNC-5 TSR2 to thermal denaturation.
(A) Native CD spectra of non-mannosylated (blue) and C-mannosylated (green) UNC-5 TSR2 at 24°C. Average spectra of three measurements are displayed for each TSR form (Figure 3—source data 1). (B) Thermal denaturation of non- and C-mannosylated UNC-5 TSR2 monitored by CD spectroscopy at a wavelength of 229 and 228 nm, respectively. Measurements of three non-mannosylated (gray-shaded squares) and C-mannosylated (gray-shaded circles) UNC-5 TSR2 samples were averaged and fitted (blue and green, respectively) (Figure 3—source data 2). Average Tm values are depicted in the right plot (error bars show standard deviation). Thermal denaturation of both, non- and C-mannosylated TSRs, was reversible to a high extent (Figure 3—figure supplement 2).
-
Figure 3—source data 1
Native CD spectra of C- and non-mannosylated UNC-5 TSR2.
- https://cdn.elifesciences.org/articles/52978/elife-52978-fig3-data1-v2.xlsx
-
Figure 3—source data 2
Thermal denaturation of C- and non-mannosylated UNC-5 TSR2.
- https://cdn.elifesciences.org/articles/52978/elife-52978-fig3-data2-v2.xlsx
Figure 3—figure supplement 1
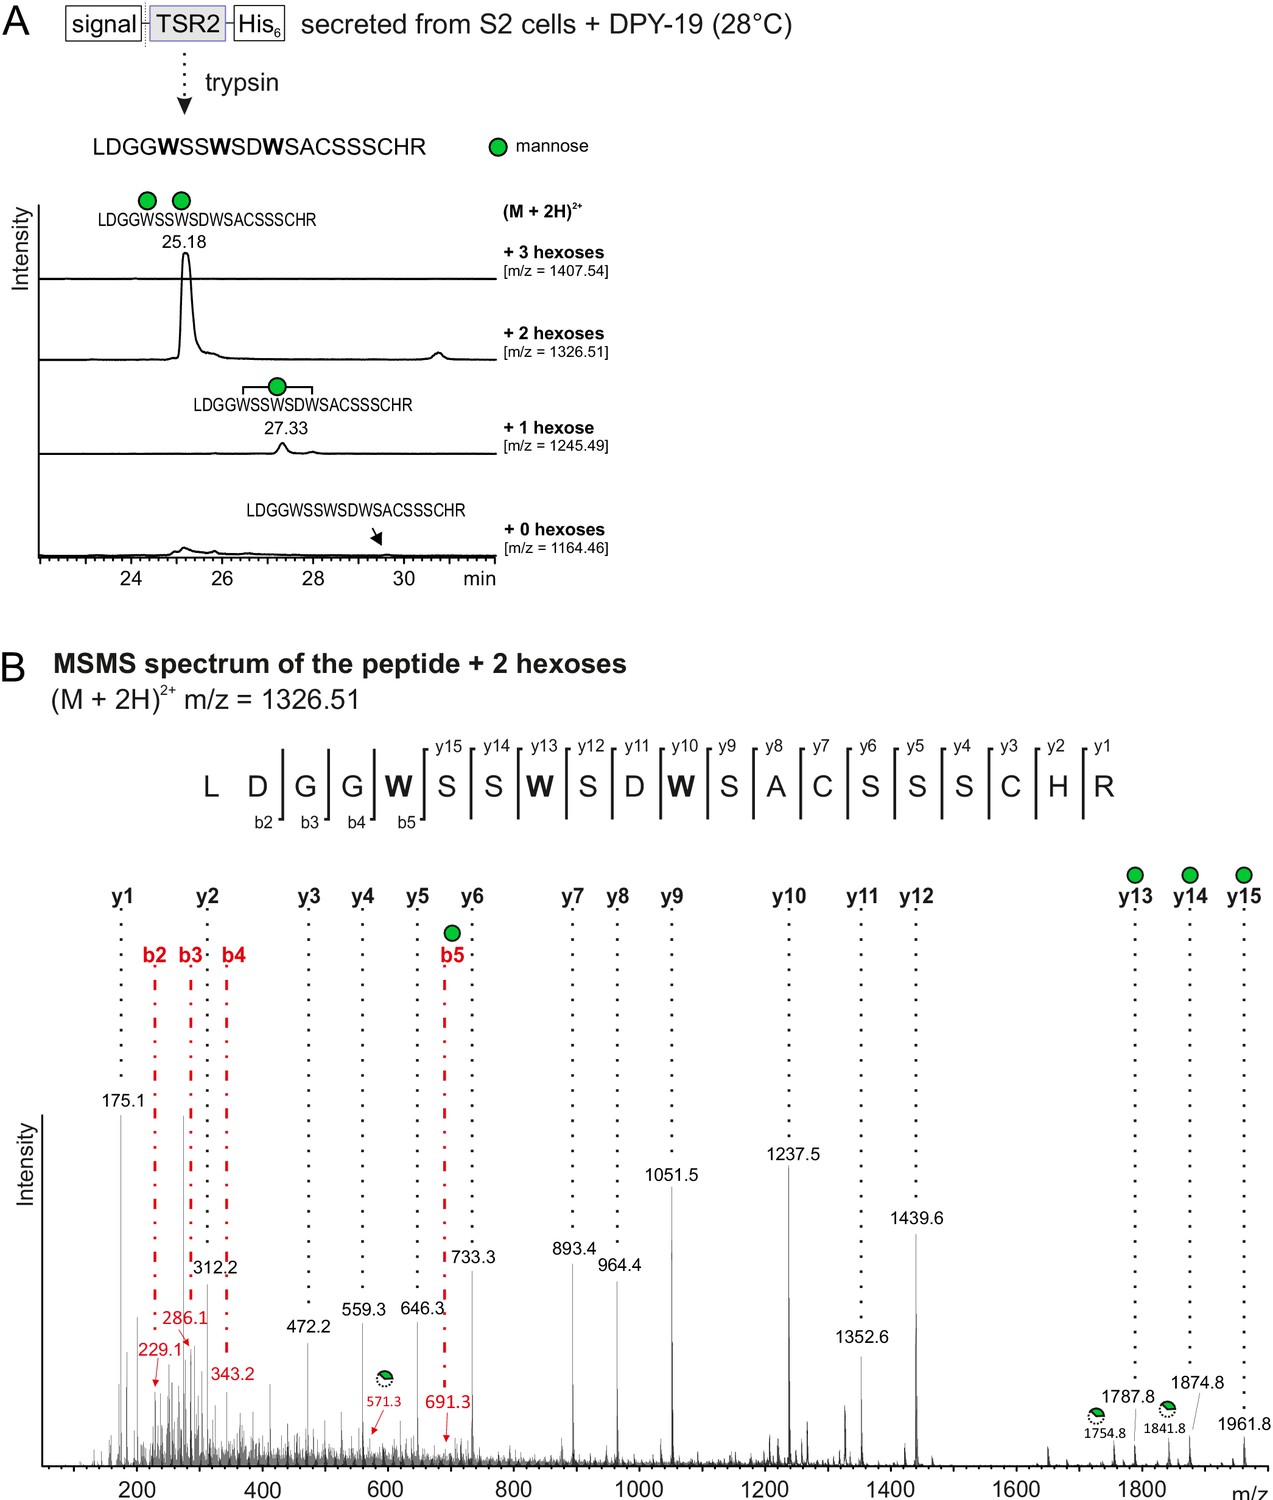
Mass spectrometry analysis of UNC-5 TSR2 co-expressed with DPY-19.
(A) Extracted ion chromatograms of (M + 2H)2+ ions of the UNC-5 TSR2 tryptic peptide containing the WXXWXXW motif with no, one, two and three hexoses are displayed revealing that the di-mannosylated form is most abundant. (B) MSMS spectrum of the di-mannosylated UNC-5 TSR2 (m/z = 1326.51) showing that the two C-mannoses are located on the first two tryptophans of the WXXWXXW motif. b- and y- series ions with additional hexose masses are marked either by a green circle displaying a full mannose or by a broken circle displaying a cross-ring cleaved C-mannose (loss of 120 Da).
Figure 3—figure supplement 2
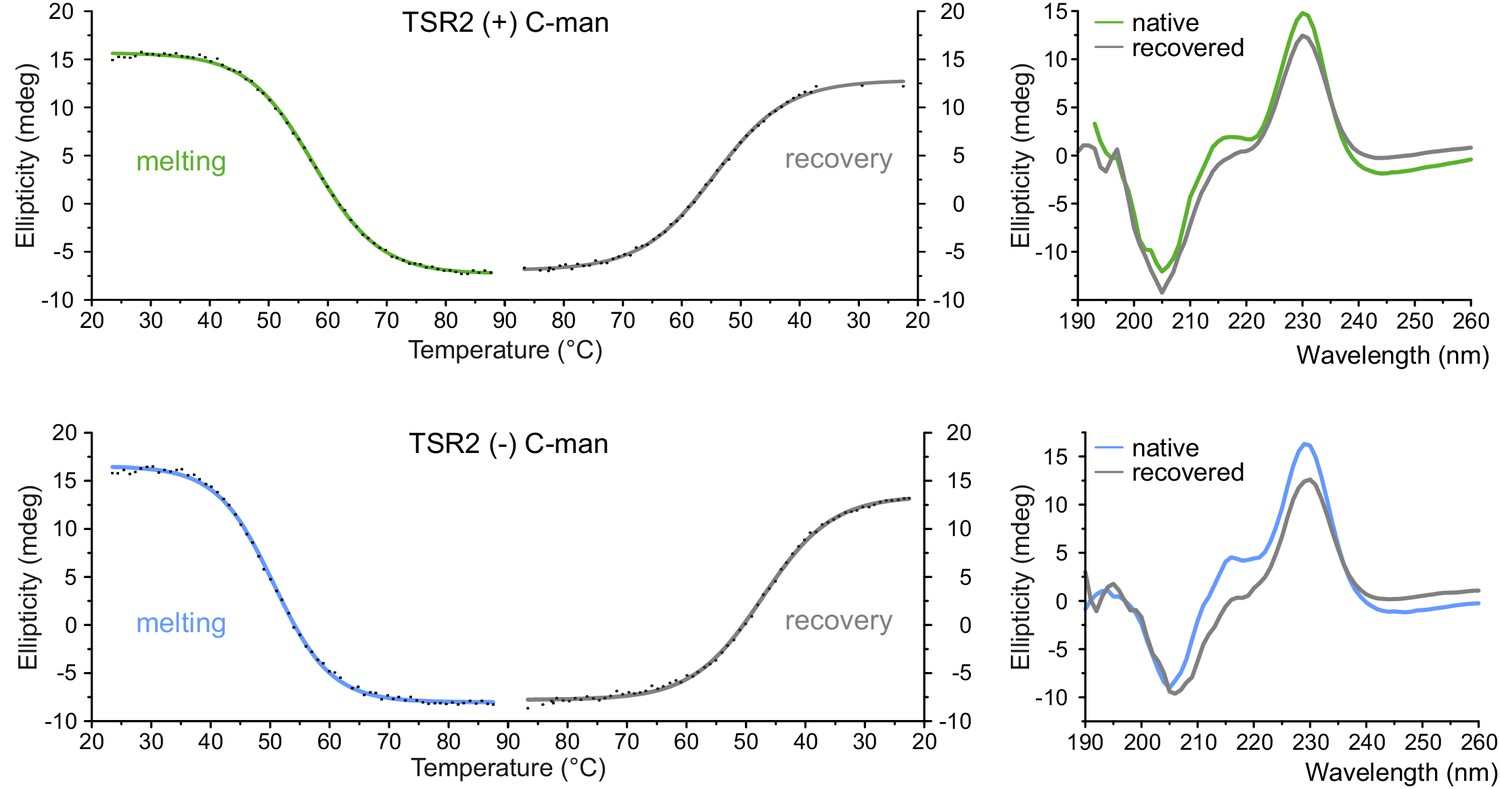
Recovery of thermally denatured UNC-5 TSR2 with and without C-mannosylation.
Thermal denaturation and recovery upon temperature decrease of C-mannosylated (green) and non-mannosylated (blue) UNC-5 TSR2 were monitored by CD spectroscopy at a wavelength of 228 and 229 nm, respectively. Collected data points were fitted by Boltzmann function (OriginLab). 260–190 nm spectra of native and recovered TSRs display refolding of the proteins to a high extent.
Figure 4 with 7 supplements
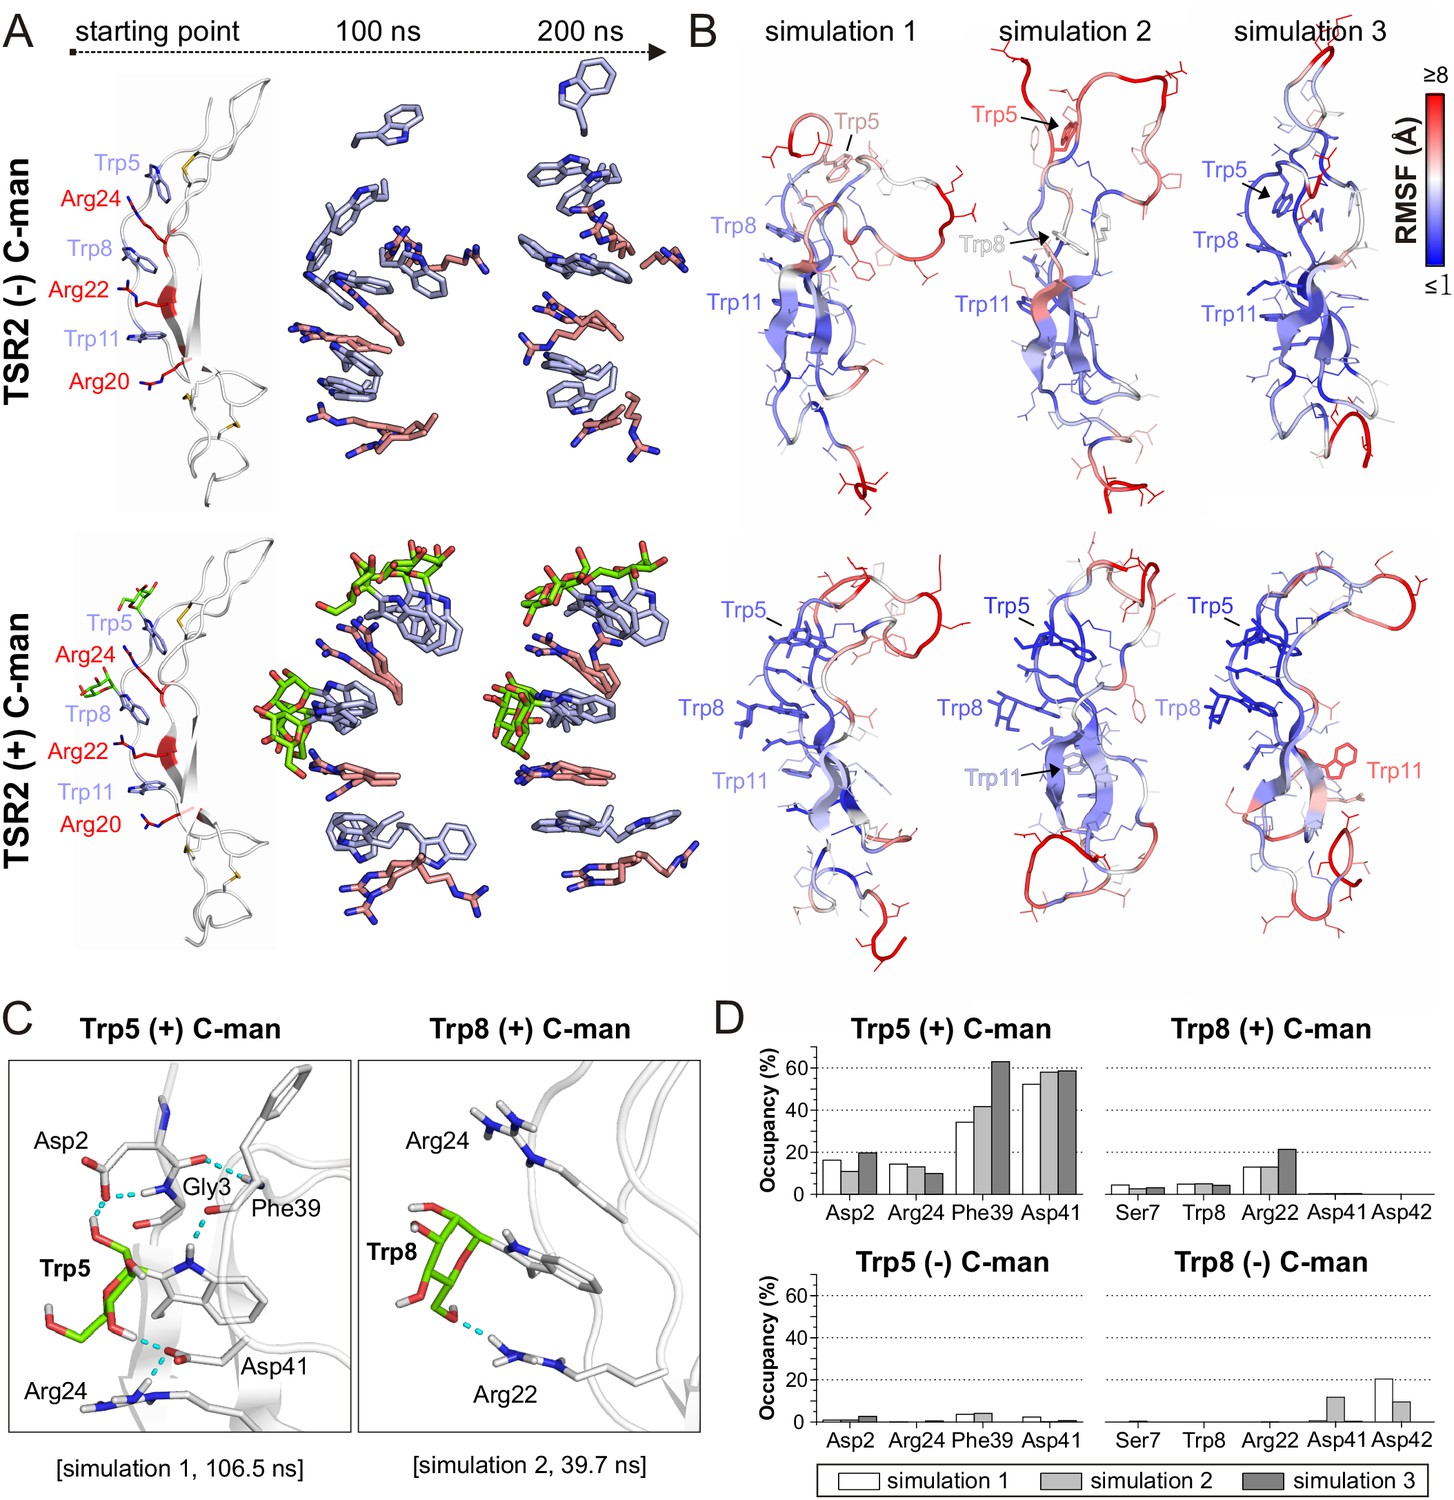
Molecular dynamics simulations at elevated temperature.
(A) Modeled structures of UNC-5 TSR2 without C-mannosylation (top) and with two C-mannoses on Trp5 and Trp8 (bottom) at the starting point of each simulation followed by aligned Trp-Arg ladder structures from three simulation replicates after 100 and 200 ns simulation time. Tryptophans are depicted in light-blue, mannoses in green and arginines in salmon. (B) Representative most-abundant structures of non- and C-mannosylated UNC-5 TSR2 from each simulation, colored using a blue-white-red gradient according to the calculated root-mean-square fluctuation (RMSF) values (blue ≤1 Å; red ≥8 Å) (Figure 4—figure supplement 1, Figure 4—source data 1). (C) Hydrogen bonds (cyan) formed by C-mannosylated Trp5 and Trp8 with adjacent residues, calculated using the VMD Hydrogen Bonds plugin. Oxygen atoms are depicted in red and nitrogen atoms in dark-blue. (D) Most abundant hydrogen bonds formed during each simulation either by C-mannoses together with corresponding tryptophan residues or by non-mannosylated tryptophans alone are displayed as occupancies (%). A more detailed representation is depicted in Figure 4—figure supplement 4.
-
Figure 4—source data 1
RMSF values from MD simulations at elevated temperatures.
- https://cdn.elifesciences.org/articles/52978/elife-52978-fig4-data1-v2.xlsx
Figure 4—figure supplement 1

Side chain Root-Mean-Square Fluctuations (RMSF) of all residues from molecular dynamics simulations at elevated temperature.
Mean RMSF values from simulation triplicates are shown in black for the C-mannosylated and in gray for the non-mannosylated TSR. Error bars depict calculated standard error. The three TSR beta-strands are displayed as gray boxes above the protein sequence. Tryptophan and arginine residues forming the Trp-Arg ladder are highlighted in red.
Figure 4—figure supplement 2
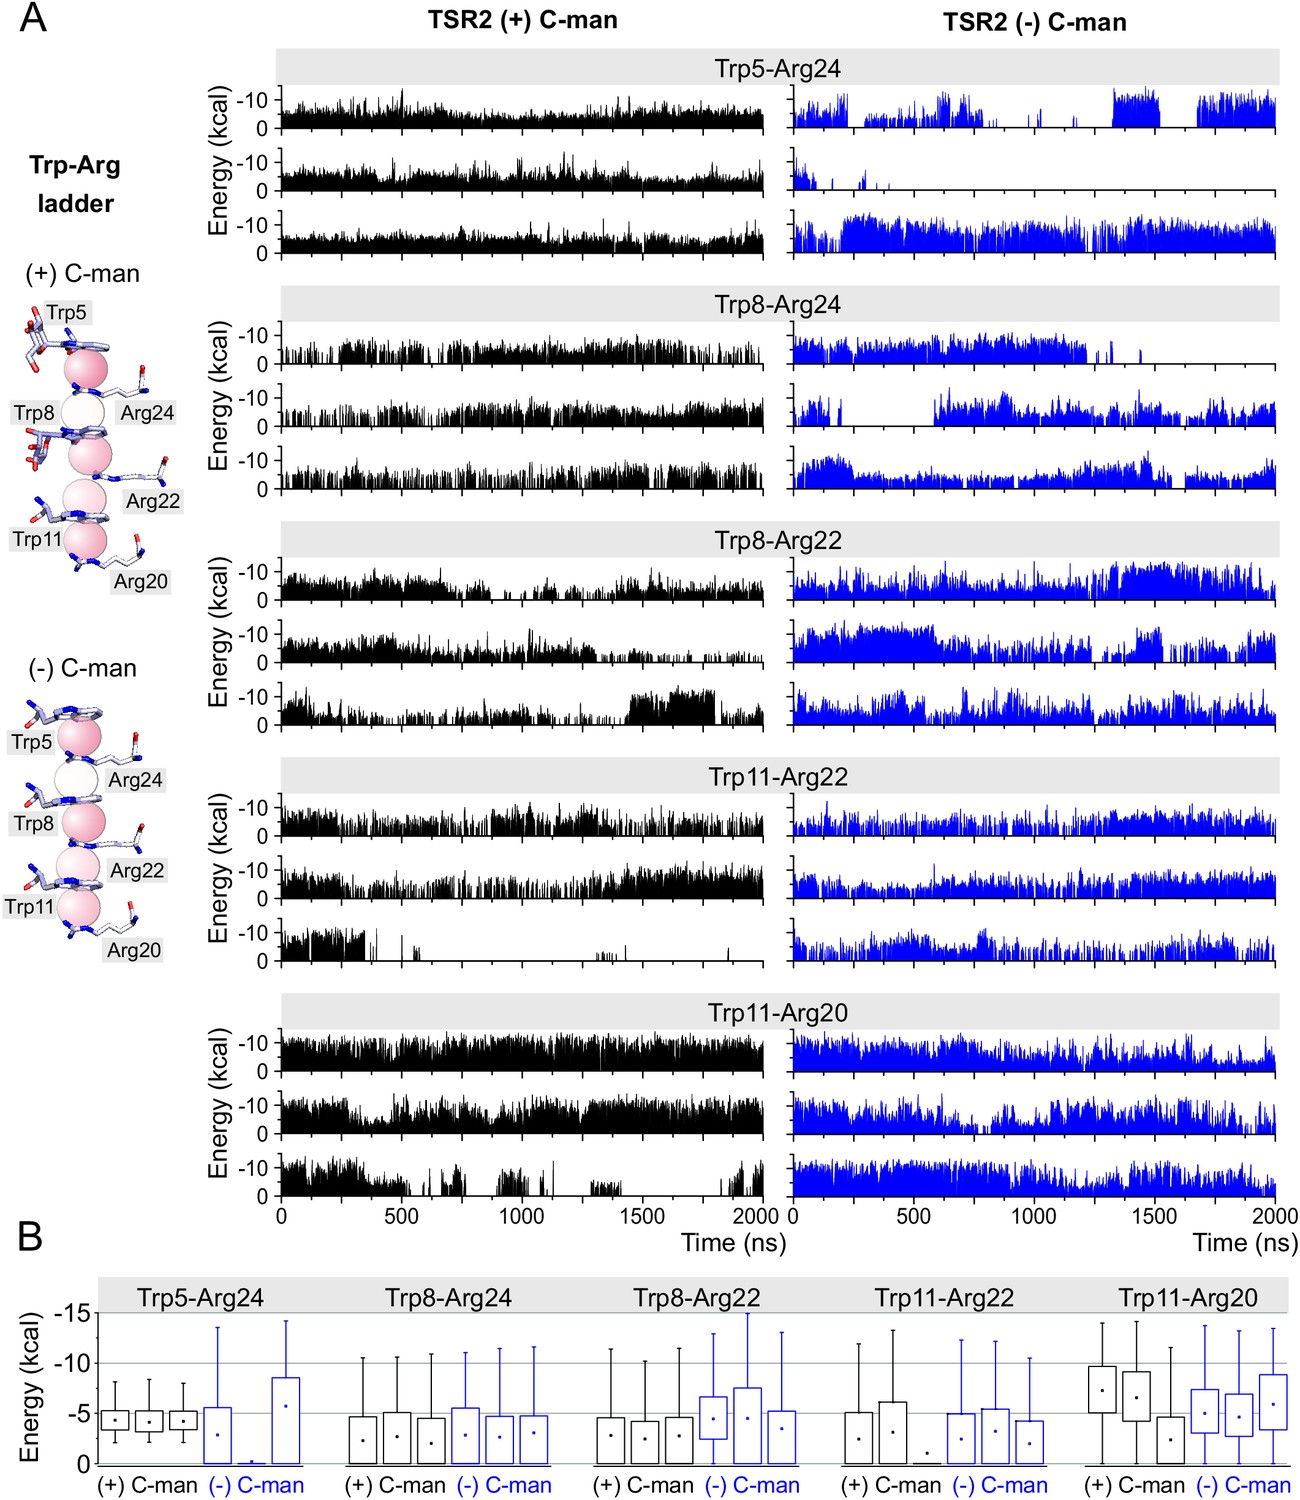
Cation-π interactions between Trp and Arg residues in the Trp-Arg ladder of the C-mannosylated (black) and non-mannosylated (blue) UNC-5 TSR2 during molecular dynamics simulation at elevated temperature.
(A) The energies were calculated using the CaPTURE program (Gallivan and Dougherty, 1999) and are displayed for each interacting Trp and Arg residue pair in each simulation triplicate. (B) Representation of the energy values as mean values for each residue pair with corresponding interquartile (boxes) and 5th/95th percentile (whiskers) ranges.
Figure 4—figure supplement 3
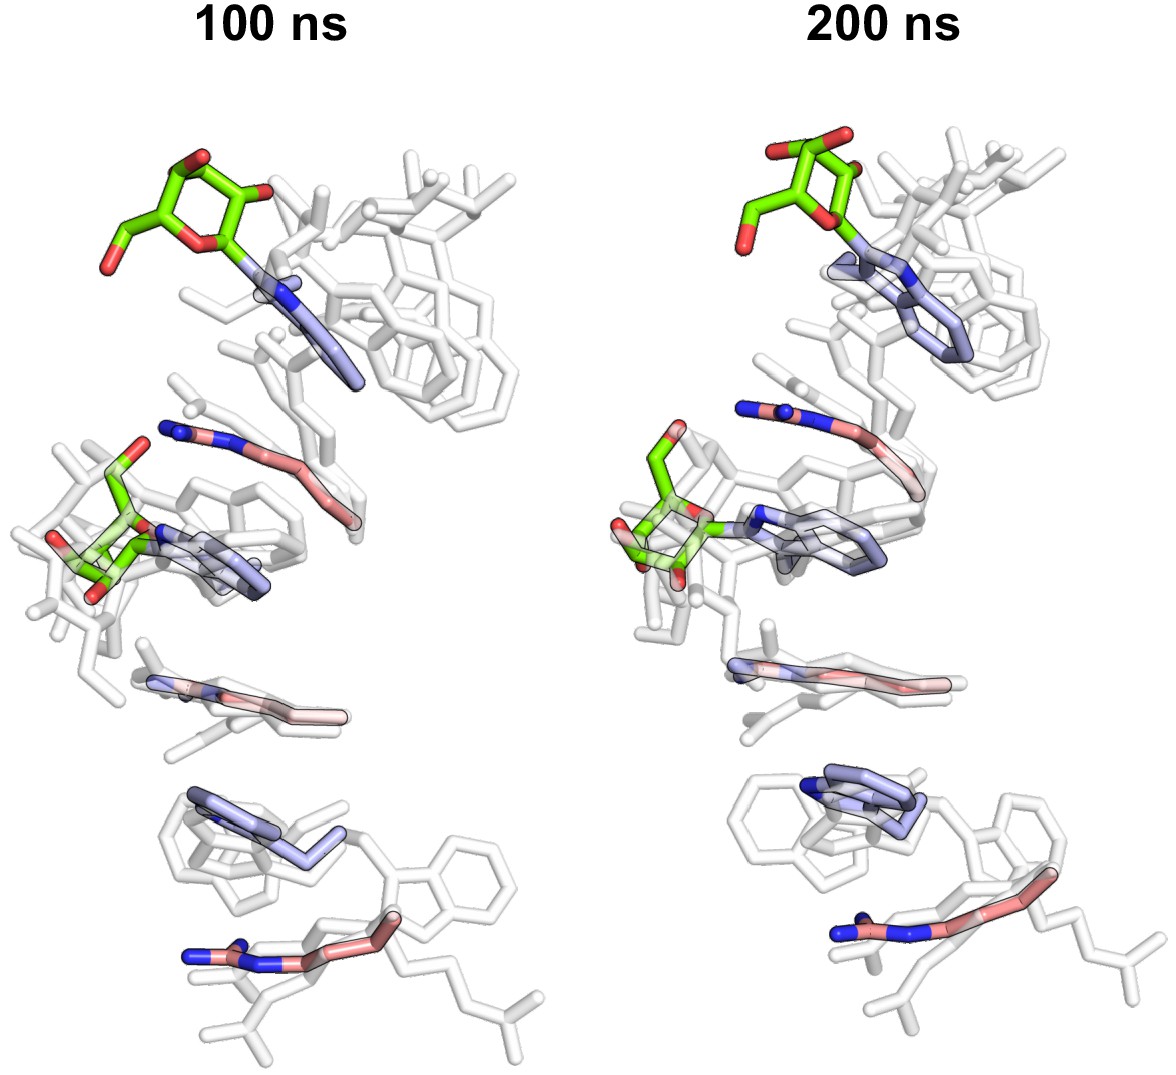
Molecular dynamics simulations of C-mannosylated UNC-5 TSR2 at elevated temperature with C-mannoses in the 1C4 conformation.
Trp-Arg ladder after 100 and 200 ns simulation time is displayed aligned with corresponding Trp-Arg ladder structures from UNC-5 TSR2 with 4C1 C-mannoses (transparent). Tryptophans are depicted in light-blue, C-mannoses in green, arginines in salmon, oxygen atoms in red and nitrogen atoms in blue.
Figure 4—figure supplement 4

Total hydrogen bonds formed by C- and non-mannosylated Trp5 (A) and Trp8 (B) during molecular dynamics simulations at elevated temperature.
Gray bars display hydrogen bonds from three independent simulations formed either by tryptophans with 4C1-C-mannoses or by non-mannosylated tryptophans. Blue bars correspond to C-mannoses in 1C4 conformation. In case of C-mannosylated tryptophans, both tryptophan and mannose residues were included into calculations.
Figure 4—video 1
Exemplary, second simulation replicate of non-mannosylated TSR2 at 75°C.
Tryptophans are depicted in cyan, arginines in red and cysteines in yellow.
Figure 4—video 2
Exemplary, first simulation replicate of C-mannosylated TSR2 at 75°C, with C-mannoses in the 4C1 conformation.
Tryptophans are depicted in green, arginines in red and cysteines in yellow.
Figure 4—video 3
Simulation of C-mannosylated TSR2 at 75°C with C-mannoses in the 1C4 conformation.
Tryptophans are depicted in green, arginines in red and cysteines in yellow.
Figure 5 with 1 supplement
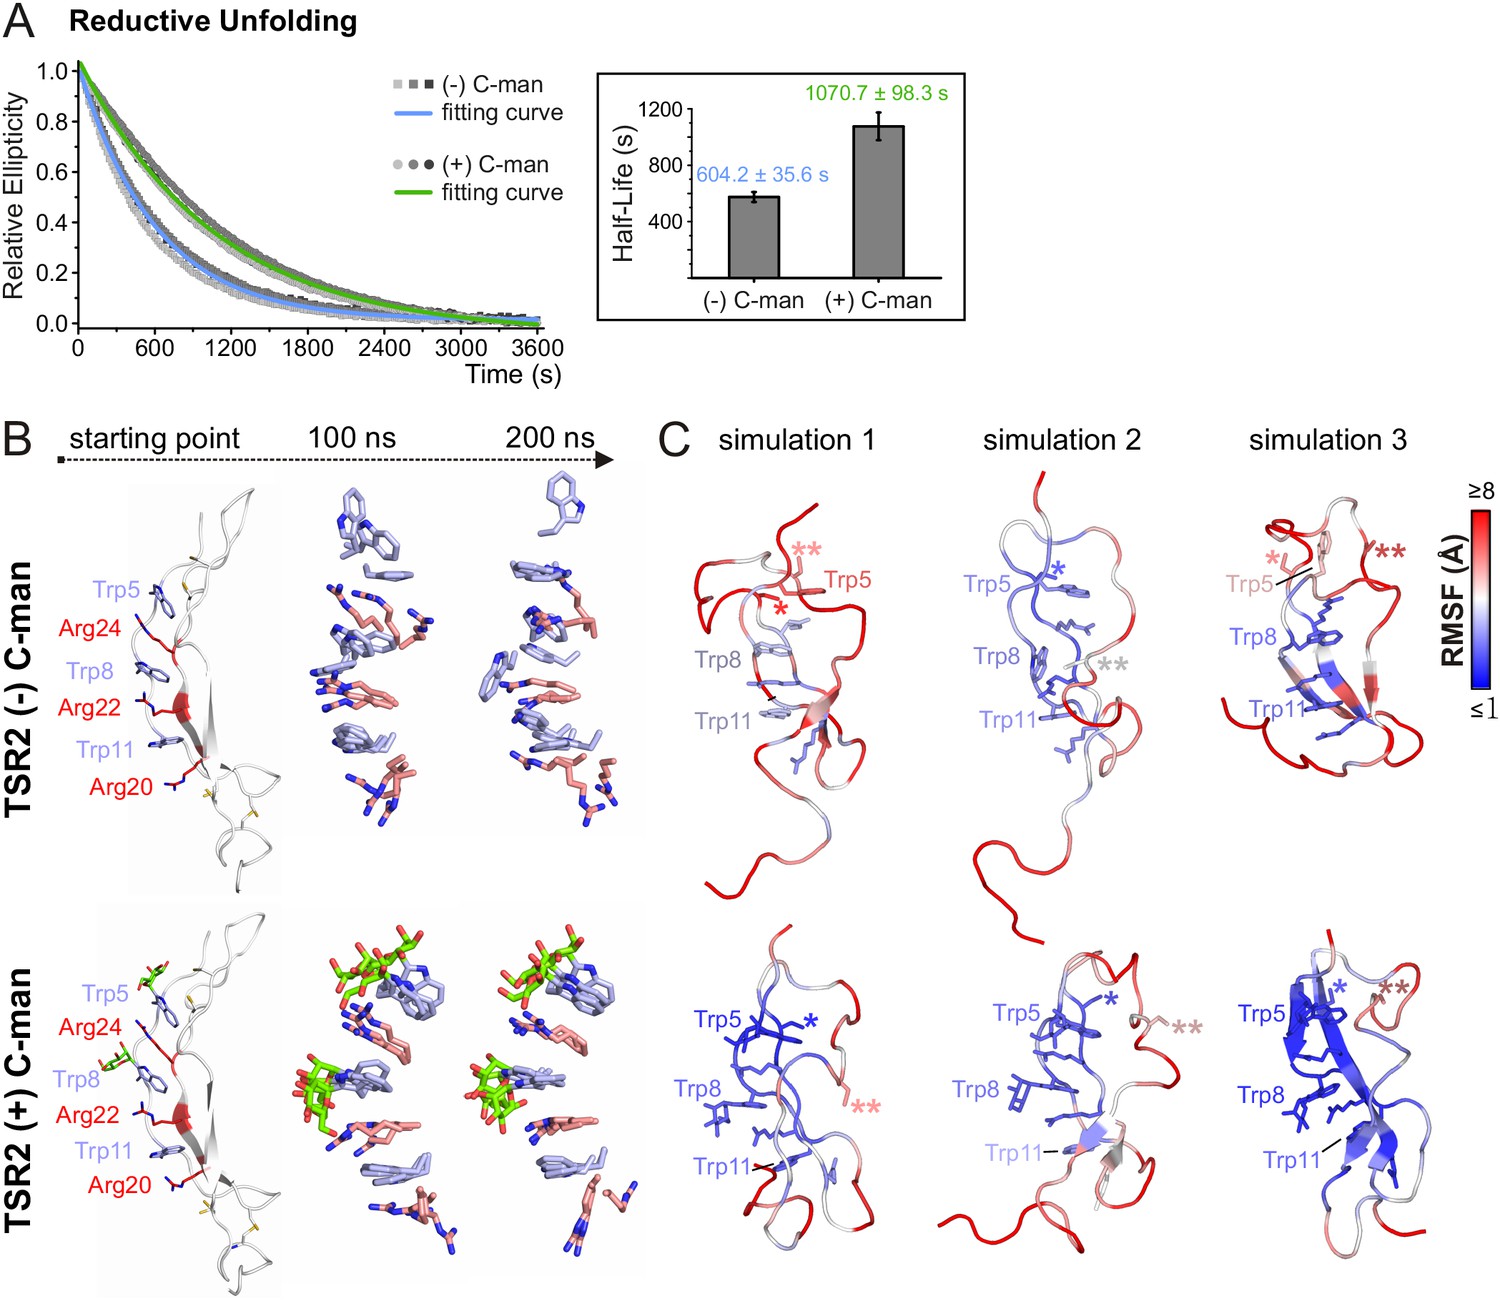
C-mannosylation decreases the unfolding rate of UNC-5 TSR2 during reductive denaturation.
(A) Reductive denaturation of non-mannosylated (blue) and C-mannosylated (green) UNC-5 TSR2 monitored using CD spectroscopy at a wavelength of 229 and 228 nm, respectively. Measurements of three non-mannosylated (gray-shaded squares) and C-mannosylated (gray-shaded circles) UNC-5 TSR2 samples were averaged and fitted (Figure 5—source data 1). Average half-life values are depicted in the right plot (error bars show standard deviation). (B) Modeled structures of UNC-5 TSR2 lacking disulfide bridges without C-mannosylation (top) and with two C-mannoses on Trp5 and Trp8 (bottom) at the starting point of each simulation followed by aligned Trp-Arg ladder structures from three simulation replicates after 100 and 200 ns simulation time. Tryptophans are depicted in light-blue, mannoses in green and arginines in salmon. (C) Final structures of non- and C-mannosylated UNC-5 TSR2 after each 200 ns simulation, colored using a blue-white-red gradient according to the calculated root-mean-square fluctuation (RMSF) values (blue ≤1 Å; red ≥5 Å) (Figure 5—figure supplement 1, Figure 5—source data 2). Cys26 and Cys38 residues, that are involved in the upper disulfide bridge of the TSR, are labeled with one or two asterisks, respectively.
-
Figure 5—source data 1
Reductive denaturation of C- and non-mannosylated UNC-5 TSR2.
- https://cdn.elifesciences.org/articles/52978/elife-52978-fig5-data1-v2.xlsx
-
Figure 5—source data 2
RMSF values from MD simulations of TSR2 lacking disulfide bridges.
- https://cdn.elifesciences.org/articles/52978/elife-52978-fig5-data2-v2.xlsx
Figure 5—figure supplement 1
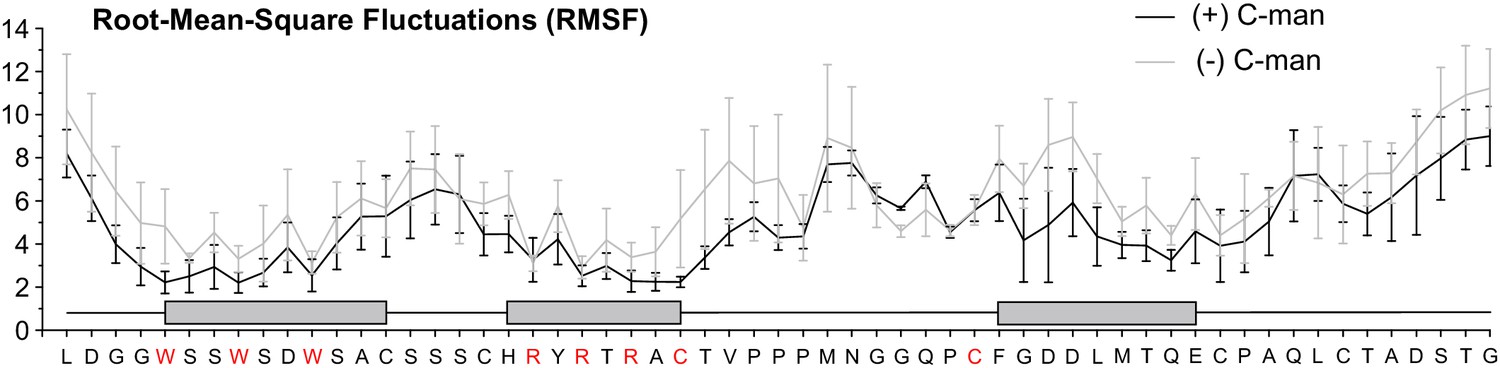
Side chain Root-Mean-Square Fluctuations (RMSF) of all residues from molecular dynamics simulations of the TSRs lacking disulfide bonds.
Mean RMSF values from simulation triplicates are shown in black for the C-mannosylated and in gray for the non-mannosylated TSR. Error bars depict calculated standard error. The three TSR beta-strands are displayed as gray boxes above the protein sequence. Tryptophan and arginine residues forming the Trp-Arg ladder, as well as Cys26 and Cys38, are highlighted in red.
Figure 6 with 3 supplements
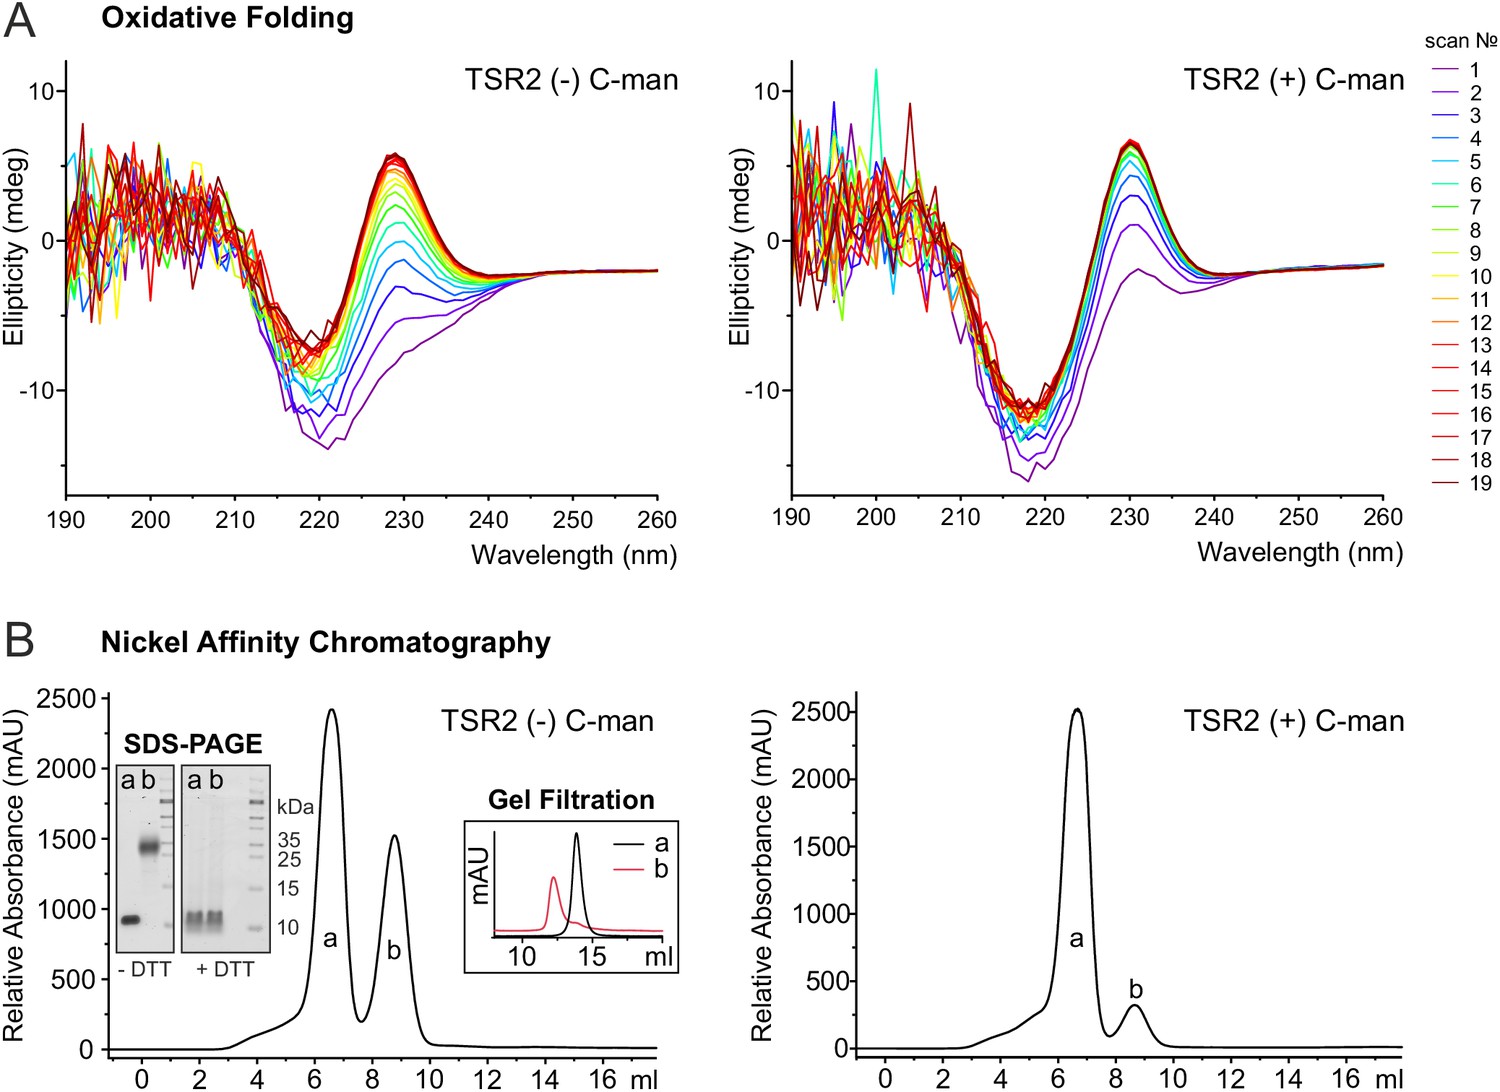
C-mannosylation impacts the folding of UNC-5 TSR2.
(A) Oxidative refolding of previously reduced and unfolded non- and di-mannosylated UNC-5 TSR2 monitored by CD spectroscopy in presence of 0.5 mM GSSG and 1 mM GSH at 24°C. The first spectrum was recorded 9 min after removal of denaturating agents and addition of GSSG/GSH. Subsequent spectra were recorded every 10 min. (B) Nickel affinity purification chromatograms of secreted non- and C-mannosylated His-tagged TSR2 from Drosophila S2 cells. Whereas C-mannosylated TSR2 appeared primary as monomer (a), non-mannosylated TSR revealed a high amount of dimeric structures (b), which bound stronger to the nickel affinity column and were confirmed by gel filtration chromatography and non-reducing SDS-PAGE. Highly increased formation of dimers was consistently observed in over ten independent purifications.
Figure 6—figure supplement 1
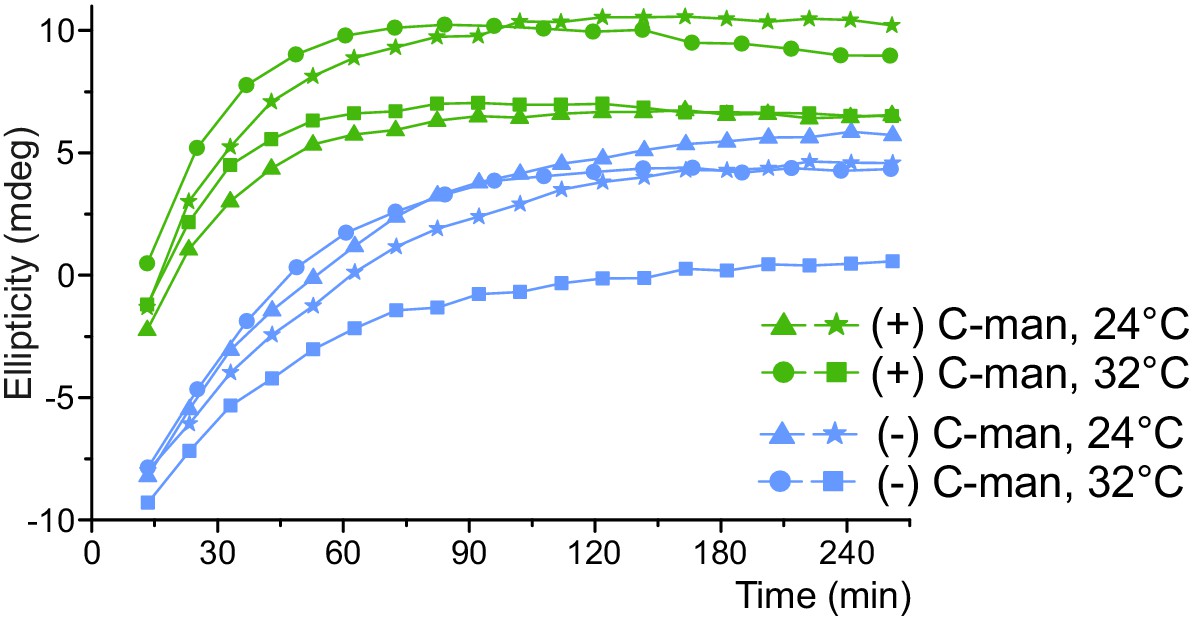
Time plot of the oxidative refolding presented in Figure 6A.
Four independent folding reactions of proteins with and without C-mannose were followed at a wavelength of 229 and 228 nm, respectively, at 24 or 32°C.
Figure 6—figure supplement 2
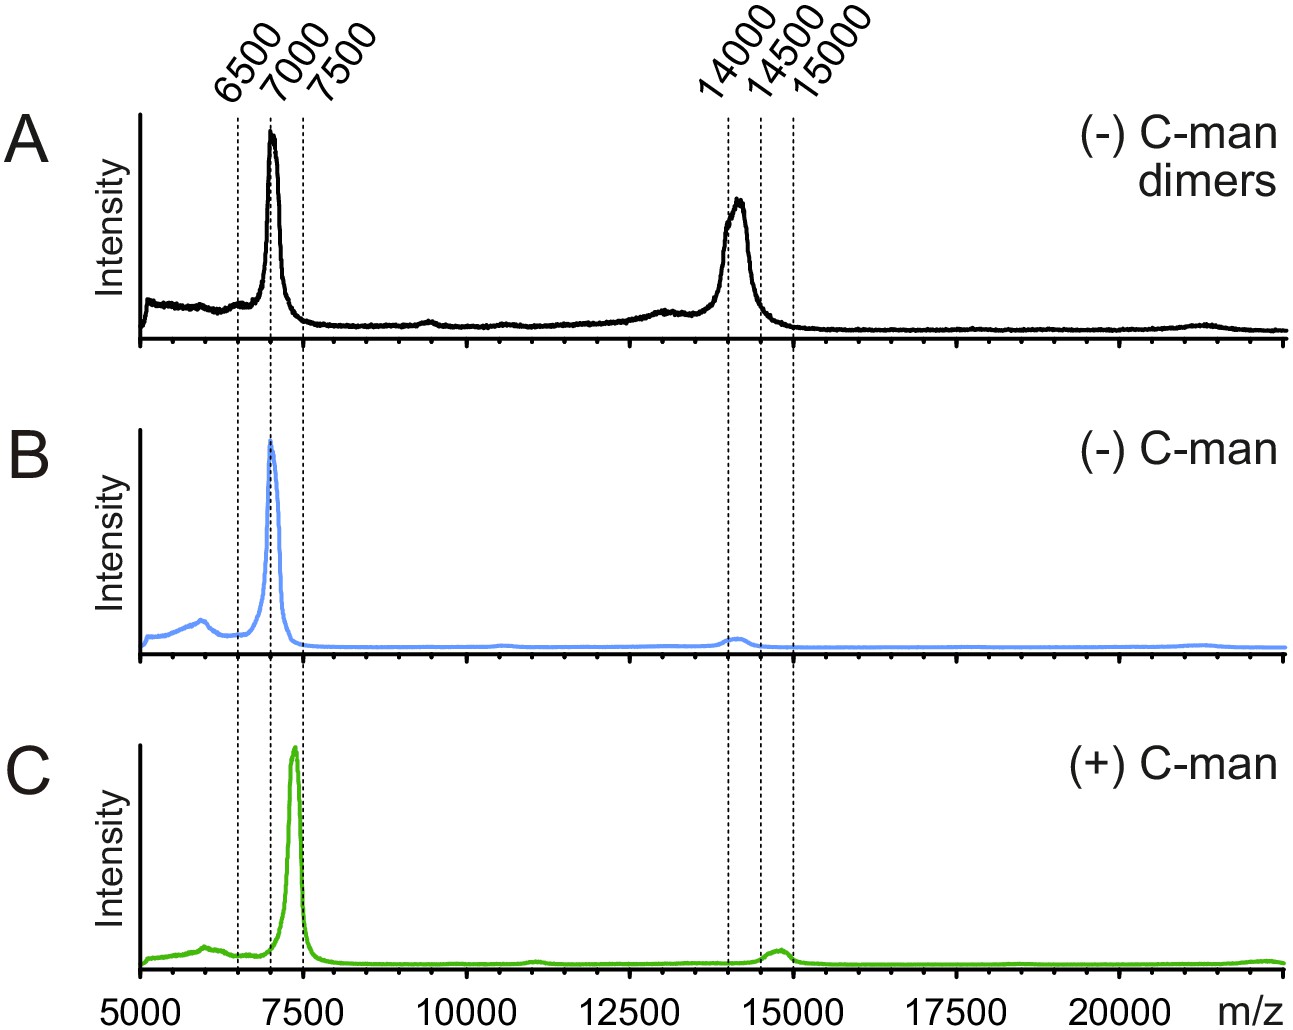
MALDI-TOF MS analysis of monomeric and dimeric UNC-5 TSR2 structures.
Secreted non- and C-mannosylated TSR2 from Drosophila S2 cells were purified by nickel affinity (Figure 6B) and gel filtration and analyzed by MALDI-TOF MS with 5 mg/ml α-cyano-4-hydroxycinnamic acid as matrix, using a 5800 MALDI TOF/TOF (ABSciex). (A) The nickel affinity chromatography fraction b (Figure 6B, left panel) was detected at two m/z values. One peak corresponds to the expected mass of a singly charged dimer of TSR2 (monoisotopic m/z: 14284.88). A second peak likely represents the doubly charged dimer of TSR2 (calculated m/z: 7142.94). (B) The nickel affinity chromatography fraction a (Figure 6B, left panel) was mainly detected at a size corresponding to the calculated monomer (m/z: 7142.94). (C) The nickel affinity chromatography fraction a (Figure 6B, right panel) likely represents the expected singly charged monomer with two mannoses attached (calculated m/z: 7467.04).
Figure 6—figure supplement 3

Separation of di-, mono- and non-mannosylated UNC-5 TSR2 by C18 chromatography.
UNC-5 TSR2 from stably transfected S2 cells + DPY-19 after purification by nickel affinity chromatography was applied to the Xbridge Prep C185 µm, 10 × 50 mm column (Waters), equilibrated in 10% acetonitrile, 0.05% trifluoroacetic acid at 1 ml/min. Di-, mono- and non-mannosylated TSR2 were eluted with a linear gradient of 10–40% acetonitrile over 30 ml and detected at 280 nm.
Tables
Key resources table
| Reagent type (species) or resource | Designation | Source or reference | Identifiers | Additional information |
|---|---|---|---|---|
| Cell line (D. melanogaster) | S2 | Thermo Fisher | S2 (Schneider 2), R69007 | |
| Strain, strain background (C. elegans) | C. elegans dpy-19 mutants | Caenorhabditis Genetics Center | dpy-19 (e1259) III, strain CB1259 | |
| Recombinant DNA reagent | pIB-DPY-19 | (Buettner et al., 2013) | ||
| Recombinant DNA reagent | pMT- UNC-5-TSR1+2 | this paper | Supplementary file 1 | |
| Recombinant DNA reagent | pMT- UNC-5-TSR2 | this paper | Supplementary file 1 | |
| Recombinant DNA reagent | pMT- Notch-EGF16–20 | this paper | Supplementary file 1 | |
| Antibody | anti-V5 (mouse monoclonal) | Acris | SM1691 | WB (1:5000) |
| Software, algorithm | MODELLER | (Sali and Blundell, 1993) | RRID:SCR_008395 | |
| Software, algorithm | Schrödinger MacroModel | Schrodinger Suite, available online (Watts et al., 2014) | RRID:SCR_016747 | |
| Software, algorithm | NAMD 2.11 | (Phillips et al., 2005) | RRID:SCR_014894 | |
| Software, algorithm | CHARMM27 force field | (MacKerell et al., 1998) | ||
| Software, algorithm | Particle mesh Ewald method | (Darden et al., 1993) | ||
| Software, algorithm | data2bfactor, color_b scripts | The PyMOL Molecular Graphics System, Version 1.2r3pre, Schrödinger, LLC | RRID:SCR_000305 | |
| Software, algorithm | hierarchical clustering | (Kelley et al., 1996) | RRID:SCR_004097 | |
| Software, algorithm | CaPTURE | (Gallivan and Dougherty, 1999) | ||
| Other | PiStar-180 | Applied Photophysics |
Additional files
-
Supplementary file 1
Sequences of used C. elegans UNC-5 and Drosophila Notch constructs.
- https://cdn.elifesciences.org/articles/52978/elife-52978-supp1-v2.docx
-
Transparent reporting form
- https://cdn.elifesciences.org/articles/52978/elife-52978-transrepform-v2.pdf
Download links
A two-part list of links to download the article, or parts of the article, in various formats.
Downloads (link to download the article as PDF)
Open citations (links to open the citations from this article in various online reference manager services)
Cite this article (links to download the citations from this article in formats compatible with various reference manager tools)
C-mannosylation supports folding and enhances stability of thrombospondin repeats
eLife 8:e52978.
https://doi.org/10.7554/eLife.52978


