Aire-dependent genes undergo Clp1-mediated 3’UTR shortening associated with higher transcript stability in the thymus
- Institut Cochin, INSERM U1016, Université Paris Descartes, Sorbonne Paris Cité, France
- Université de Nantes, Inserm, Centre de Recherche en Transplantation et Immunologie, UMR 1064, ITUN, F-44000, France
- Division of Developmental Immunology, German Cancer Research Center, Germany
- Division of Immunology, Department of Microbiology and Immunobiology, Harvard Medical School, United States
- Ecole Normale Supérieure, PSL Research University, CNRS, INSERM, Institut de Biologie de l'Ecole Normale Supérieure (IBENS), Plateforme Génomique, France
- Institut Français de Bioinformatique, IFB-Core, CNRS UMS 3601, France
- The Broad Institute of MIT and Harvard, United States
Figures
Figure 1 with 3 supplements
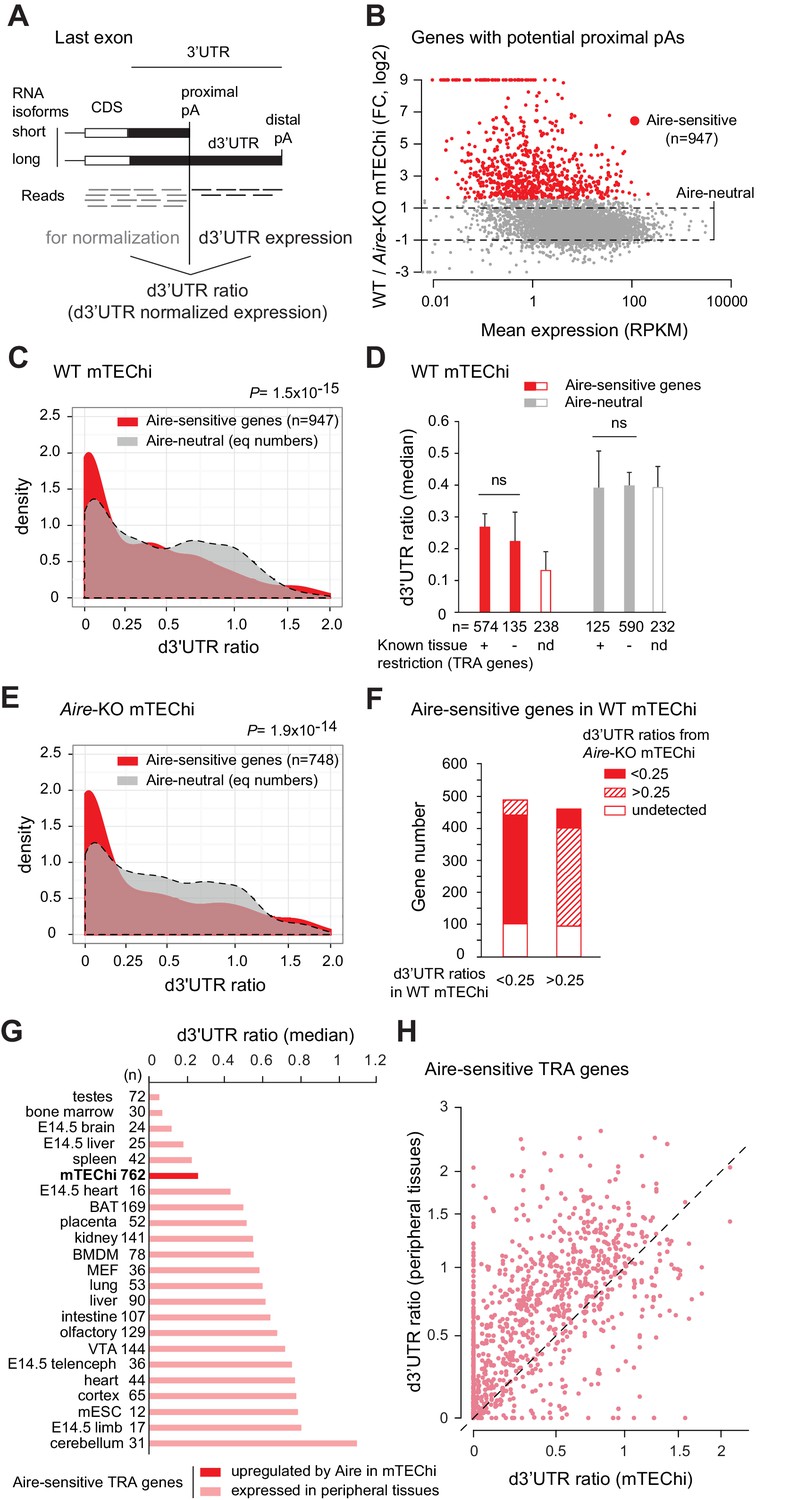
Preference of Aire-sensitive genes for short-3’UTR transcript isoforms in mTEChi.
(A) Schematic of pA usage and 3’UTR isoform expression. 3’ ends of RNA isoforms of a hypothetical gene are shown. Usage of the proximal pA results in a reduced proportion of the long 3’UTR isoform, estimated by the d3’UTR ratio. (B) RNA-seq differential expression (fold-change) between WT and Aire-KO mTEChi sorted from a pool of 4 thymi. Red dots show genes upregulated by threefold or more (Z-score criterion of p<0.01) (Aire-sensitive). Genes between the dashed lines have a change in expression less than twofold (Aire-neutral). (C) Densities of d3’UTR ratios of Aire-sensitive genes upregulated by Aire in mTEChi and of Aire-neutral genes; equal number (n = 947) of neutral genes included, asinh scale. (D) Median of d3’UTR ratios of Aire-sensitive and neutral genes depending on whether their peripheral expression is tissue-restricted, or not. Genes whose classification is not established are called ‘not determined’ (nd) and represented by an open box. (E) Densities of d3’UTR ratios of Aire-sensitive and neutral genes in Aire-KO mTEChi; equal number (n = 748) of neutral genes included, asinh scale. (F) Proportion of Aire-sensitive genes with d3’UTR ratios < 0.25 or>0.25 in Aire-KO mTEChi among those with d3’UTR ratios < 0.25 or>0.25 in WT mTEChi. (G) Median of d3’UTR ratios calculated from RNA-seq data for Aire-sensitive genes with tissue-restricted expression in mTEChi and 22 mouse tissues. Duplicate reads were discarded to allow more accurate dataset comparison. Cell types were arranged in ascending order based on the median of the d3’UTR ratios of their Aire-sensitive TRA genes. (H) Scatterplot of d3'UTR ratios of 762 TRA genes in mTEChi and their respective tissue of expression.
-
Figure 1—source data 1
d3’UTR annotation files in mice and humans for RNA-seq and microarray analyses.
A proximal pA was validated when its genomic location from the PolyA_DB 2 database differs from 20 bp at least to the genomic location of the UCSC annotated 3’UTR distal boundary or distal pA. In case of multiple proximal pAs, the most proximal one was considered. The two annotation files (GFF2_features_hg19_UTR_d.gtf and GFF2_features_mm9_UTR_d.gtf) are GTF files to be used with intersectBed and coverageBed for RNA-seq-based d3’UTR ratio calculation. The two annotation files (features_hg19_UTR_d.csv and features_mm9_UTR_d.csv) are to be used with our R-implementation of PLATA (Giraud et al., 2012) for individual probe-level microarray analyses and microarray-based d3’UTR ratio calculation.
- https://cdn.elifesciences.org/articles/52985/elife-52985-fig1-data1-v3.zip
-
Figure 1—source data 2
Annotation files in mice and humans for RNA-seq differential gene expression.
The two annotation files (UCSCmm9.gtf and UCSChg19.gtf) are GTF files to be used with intersectBed and coverageBed for RNA-seq differential gene expression analyses.
- https://cdn.elifesciences.org/articles/52985/elife-52985-fig1-data2-v3.zip
-
Figure 1—source data 3
d3’UTR ratio calculation in WT and Aire-KO mTEChi.
RNAseq_d3UTR_ratio_density.R: R-script used for d3’UTR ratio calculation and d3’UTR ratio density plot from RNA-seq data. The script needs the WT_AireKO_counts_UCSCmm9_DESEQ.csv file (DESeq differential expression file of WT vs Aire-KO mTEChi), the WT_AireKO_counts_UTRd.csv file (count of reads mapping the annotated features including d3’UTRs: GFF2_features_mm9_UTR_d.gtf provided in Figure 1—source data 1) and the number of reads of the WT and Aire-KO samples that map to the mm9 genome (114828554 for WT mTEChi and 179098324 for Aire-KO mTEChi).
- https://cdn.elifesciences.org/articles/52985/elife-52985-fig1-data3-v3.zip
-
Figure 1—source data 4
List of Aire-sensitive genes with proximal pAs in mTEChi.
na is for genes for which d3'UTR ratios could not be calculated due to the absence of reads mapping to regions upstream of proximal pAs in last exons.
- https://cdn.elifesciences.org/articles/52985/elife-52985-fig1-data4-v3.xlsx
Figure 1—figure supplement 1
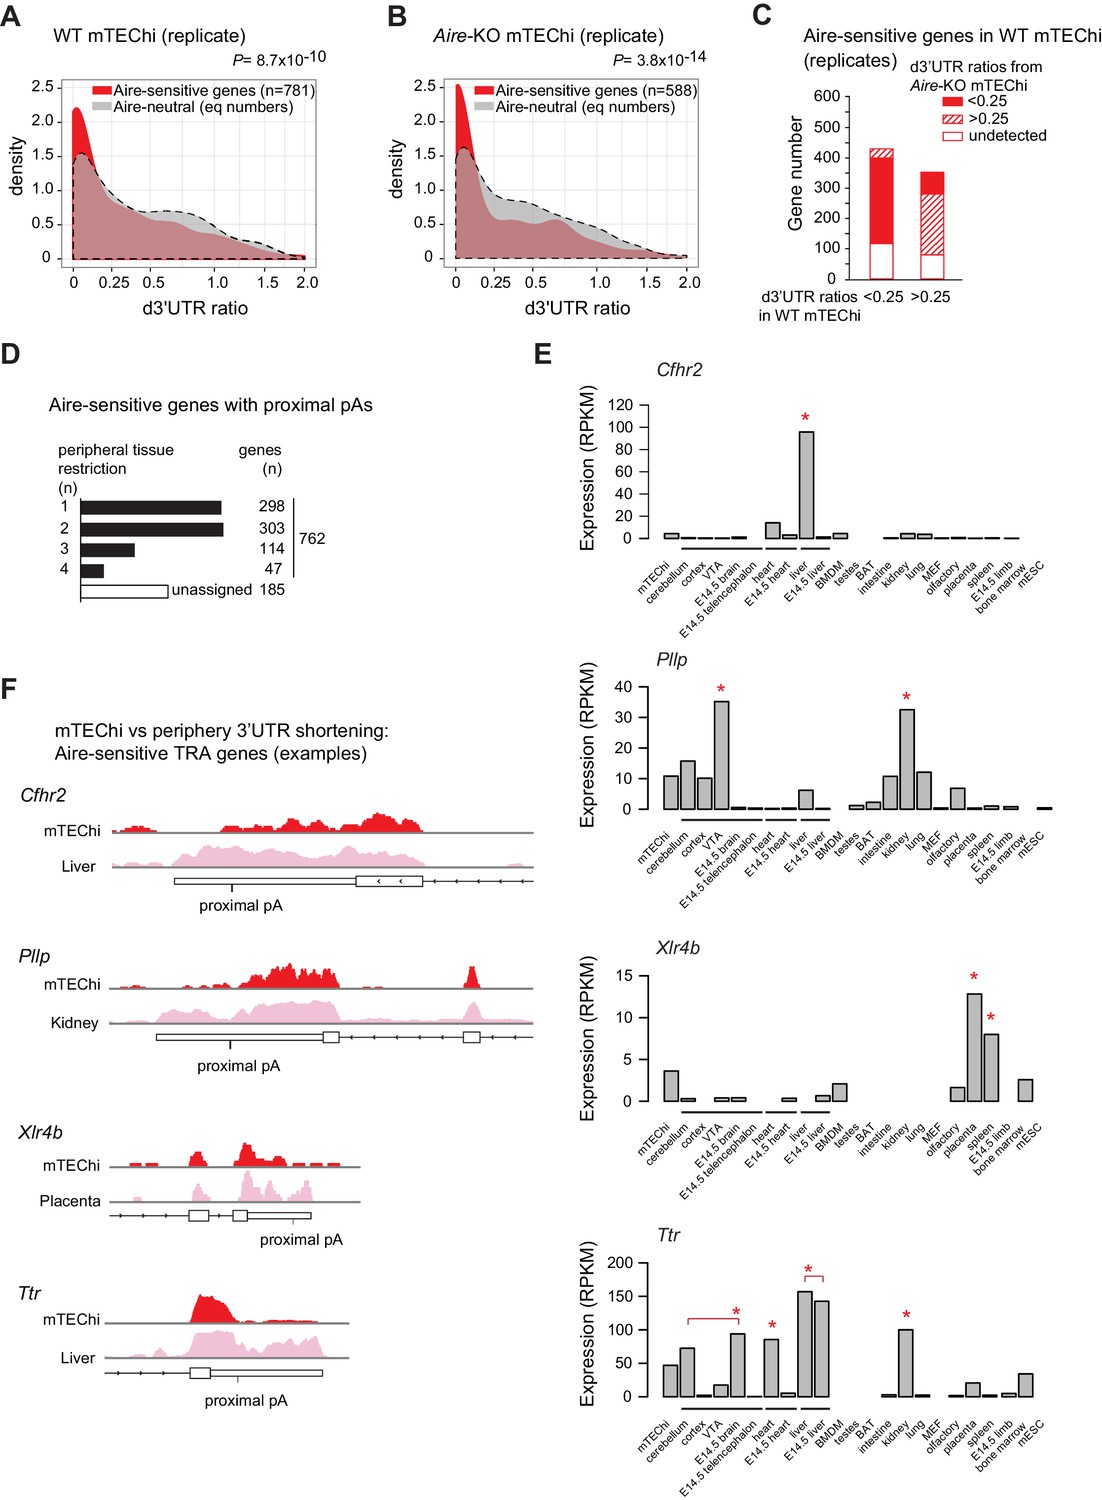
Validation and examples of the preferred short-3’UTR isoform expression of Aire-sensitive genes in mTEChi.
(A) Densities of d3’UTR ratios of Aire-sensitive genes upregulated by Aire in mTEChi and of Aire-neutral genes from a replicate RNA-seq experiment in WT and Aire-KO mTEChi sorted from a pool of 4 thymi; equal number (n = 781) of selected neutral genes, asinh scale. (B) Densities of d3’UTR ratios of Aire-sensitive and neutral genes in Aire-KO mTEChi; replicate experiment, equal number (n = 588) of selected neutral genes, asinh scale. (C) Proportion of Aire-sensitive genes with d3’UTR ratios <0.25 or >0.25 in Aire-KO mTEChi among those with d3’UTR ratios <0.25 or >0.25 in WT mTEChi; replicate experiment. (D) Number of Aire-sensitive TRA genes, that is specific or selective of two to four tissue types across 16 groups of tissues of similar type from 22 collected mouse-tissue RNA-seq datasets. (E) Level of expression of Cfhr2, Pllp, Xlr4b and Ttr (taken as examples of Aire-sensitive TRA genes) from RNA-seq data of mTEChi and 22 mouse tissues. BAT stands for brown adipocytes tissue, BMDM for bone marrow derived macrophage, MEF for mouse embryonic fibroblast, mESC for mouse embryonic stem cells and VTA for ventral tegmental area. Tissues of similar types are binned together (black line). Cfhr2 is specific to the liver; Pllp is selective to the brain and kidney; Xlr4b to the placenta and spleen and Ttr to the brain, heart, liver and kidney. (F) Examples of Aire-sensitive TRA genes with 3’UTR shortening in mTEChi. Annotated 3’UTRs are represented by thin boxes. For each gene, the mapped RNA-seq reads are shown in mTEChi (red) and in its tissue of normal expression (pink).
Figure 1—figure supplement 2
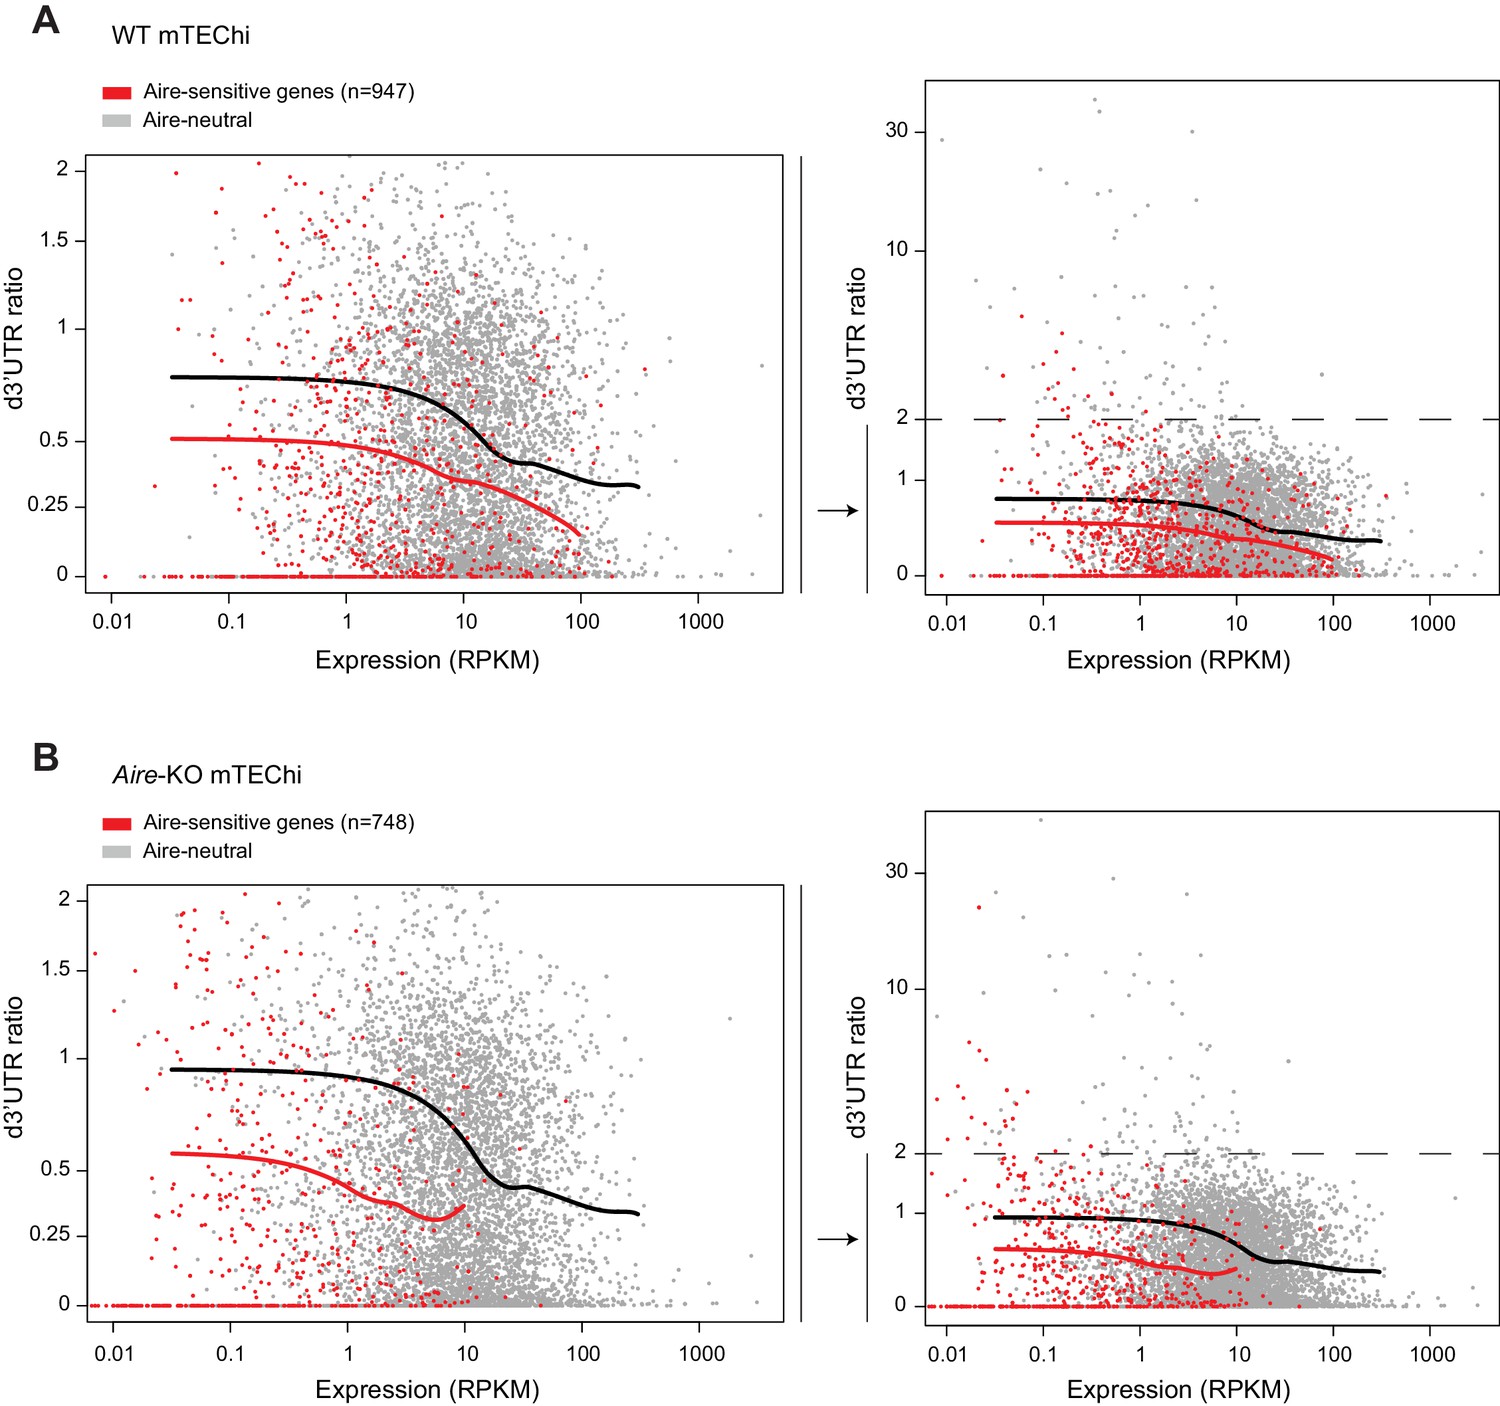
Scatterplot of d3’UTR ratio versus gene expression.
d3’UTR ratios in WT (A) and Aire-KO mTEChi (B) of Aire-sensitive genes and of all Aire-neutral genes, restricted to values between 0 and 2 (Left) or including all values (Right), asinh scale. Loess-fitted curves are represented for the Aire-sensitive (red) and the Aire-neutral genes (black).
Figure 1—figure supplement 3
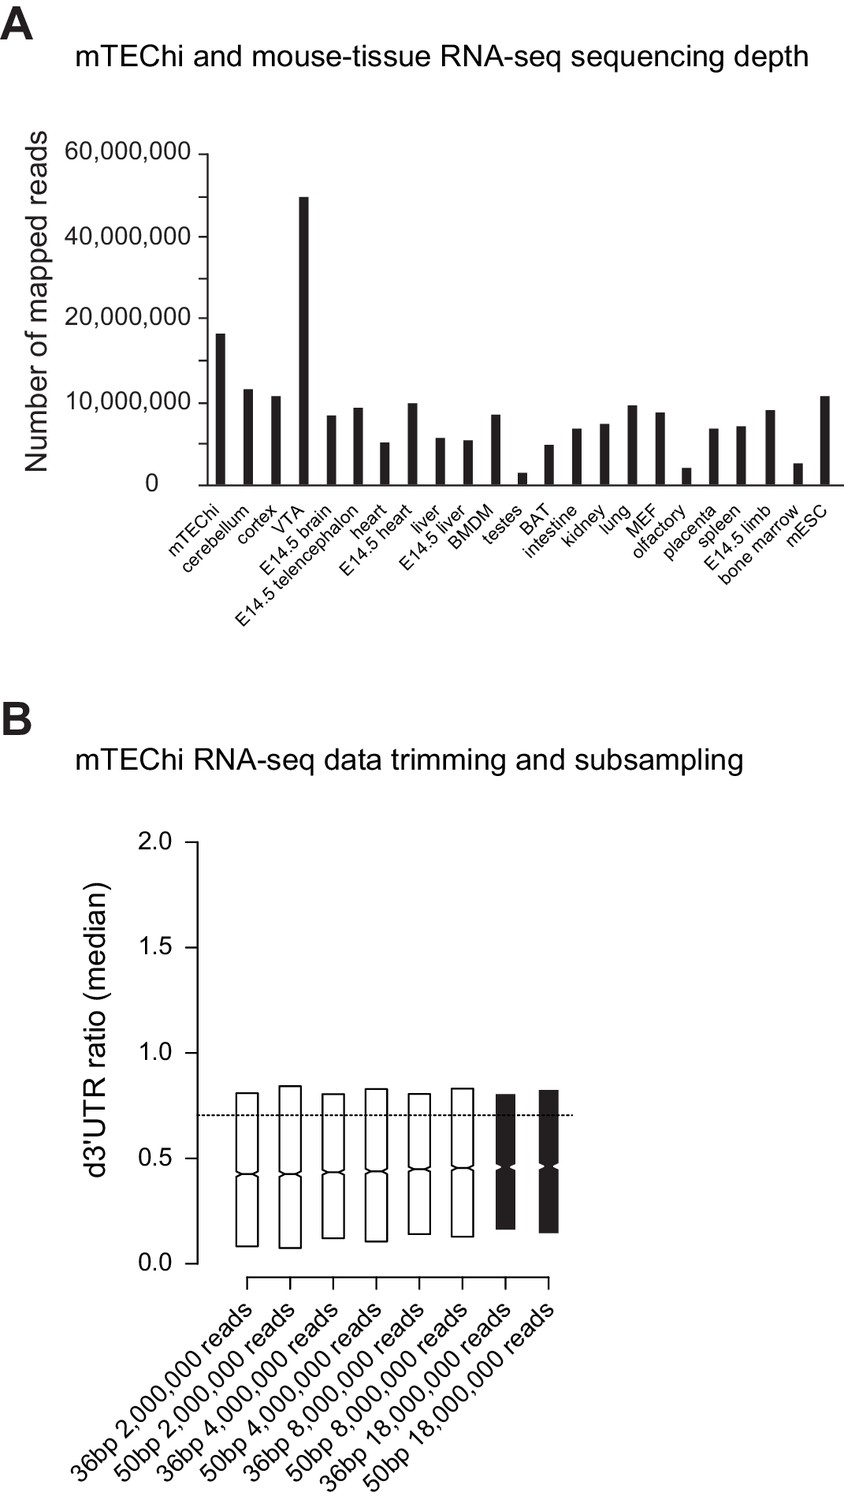
Impact of sequencing depth and read length on d3’UTR ratios.
(A) Number of reads of the RNA-seq mTEChi and mouse-tissue datasets mapped to the mm9 reference genome. (B) d3’UTR ratio in mTEChi (black boxes) after trimming to 36 bp and subsampling to 8,000,000, 4,000,000 and 2,000,000 mapped reads (open boxes). The horizontal dashed line shows the mean of the medians of d3’UTR ratios for the 22 collected tissues. Notches represent the 95% confidence interval of the medians, and the limits of the upper and lower boxes the 75th and 25th percentile of the distribution of the d3’UTR ratios, respectively.
Figure 2 with 1 supplement
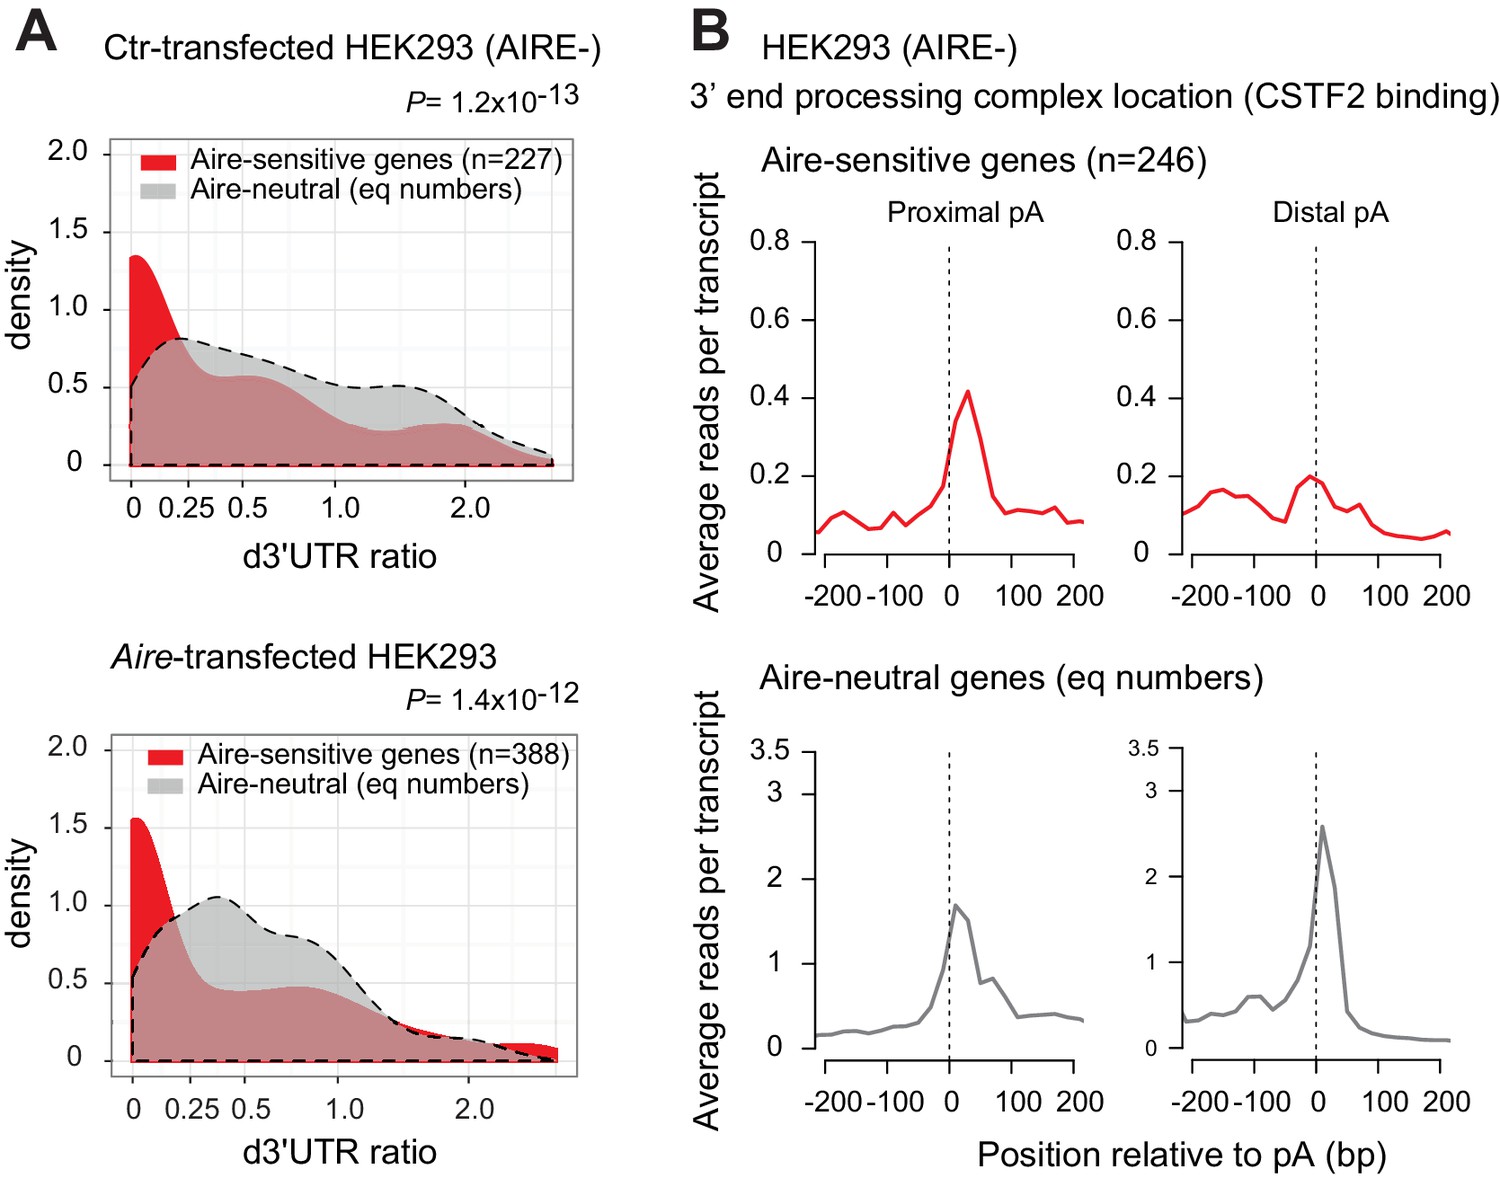
Increased binding of the 3’end processing complex at proximal pAs of Aire-sensitive genes in HEK293 cells.
(A) Densities in Ctr-transfected HEK293 cells (AIRE-) (Top) and Aire-transfected HEK293 cells (Bottom) of d3’UTR ratios from RNA-seq data of Aire-sensitive and neutral genes identified after Aire transfection; equal numbers of neutral genes included (n = 227 and n = 388, respectively), asinh scale. (B) Average density of reads from PAR-CLIP analyses in HEK293 cells (AIRE-) of CSTF2 protein as a marker of the 3’ end processing complex, in the vicinity of proximal and distal pAs of Aire-sensitive and neutral genes. Equal number (n = 246) of neutral genes included.
-
Figure 2—source data 1
Genomic location of pAs on hg19 extracted from the PolyA_DB 2 database for CLIP-seq analysis.
The four files (3UTRd+_const.xlsx, 3UTRd+_alt.xlsx, 3UTRd-_const.xlsx and 3UTRd-_alt.xlsx) were generated parsing the PolyA_DB 2 database for alternative (proximal) pAs and constitutive (distal) pAs. Alternative pAs with their genomic location are listed in two files according to the orientation of the genes (3UTRd+_alt.xlsx and 3UTRd-_alt.xlsx). Constitutive pAs with their genomic location are also listed in two different files (3UTRd+_const.xlsx and 3UTRd-_const.xlsx). These files are used to generate bed files of proximal and distal pA location at Aire-sensitive and neutral-genes for CLIP-seq analysis using the sitepro program (CEAS distribution).
- https://cdn.elifesciences.org/articles/52985/elife-52985-fig2-data1-v3.zip
Figure 2—figure supplement 1
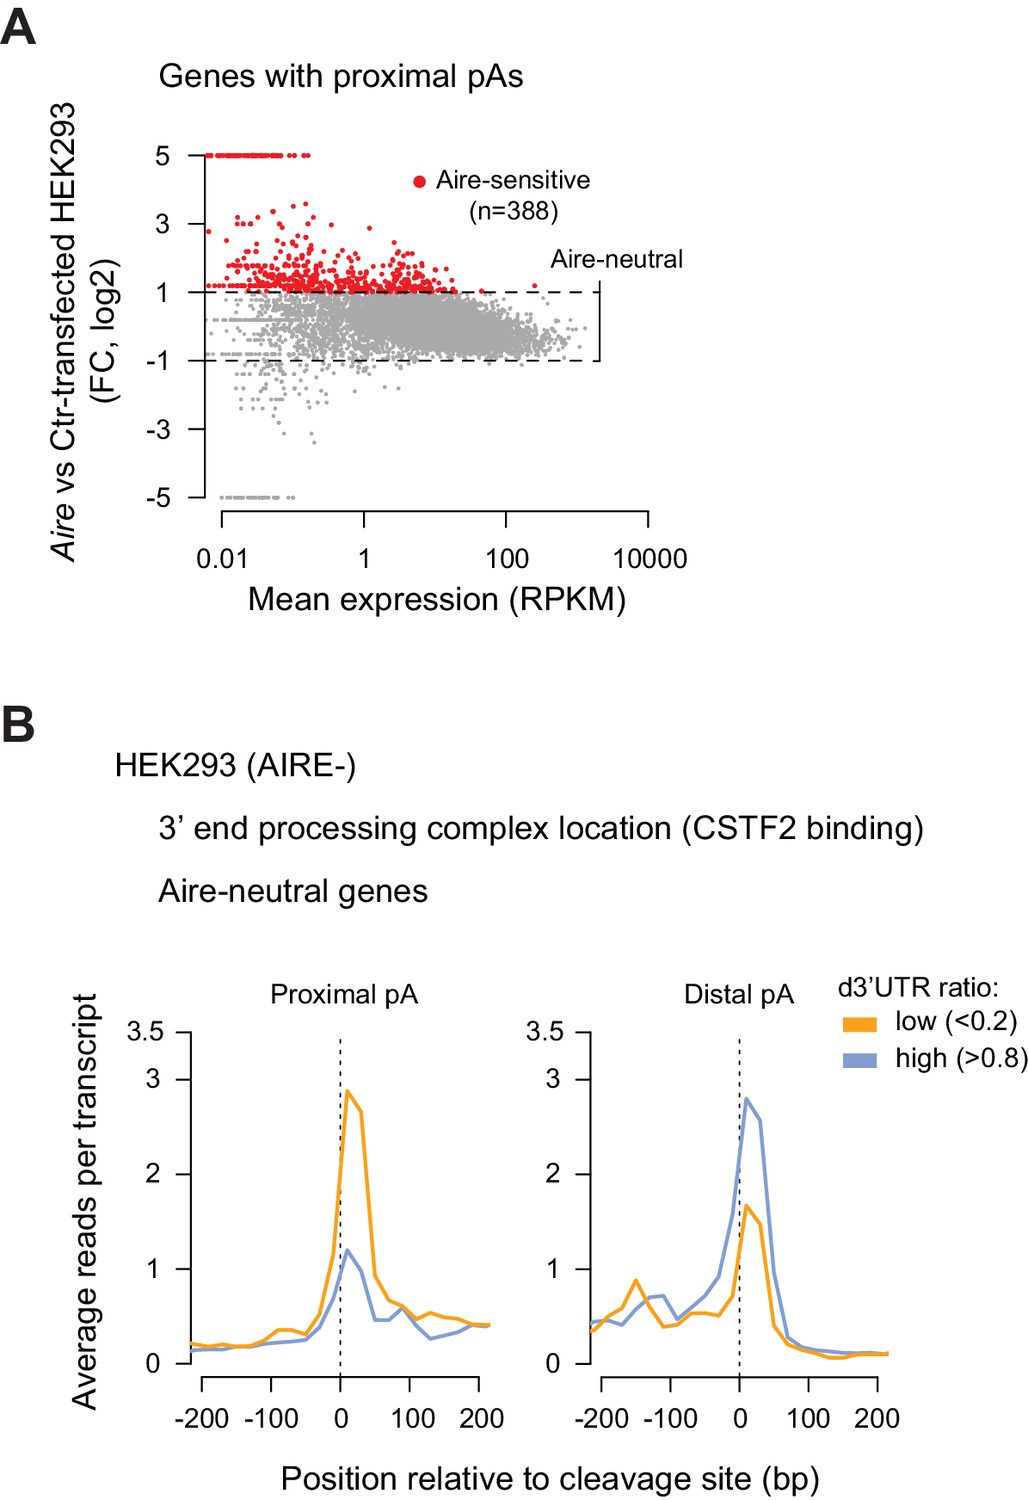
Correlation of the binding of the 3’ end processing complex with proximal pA location.
(A) RNA-seq differential expression (fold-change) of genes with proximal pAs between Aire-transfected and Ctr-transfected HEK293 cells. Red dots show genes upregulated by twofold or more (Z-score criterion of p<0.01) (Aire-sensitive). Genes between the dashed lines have a change in expression less than twofold (Aire-neutral). (B) Average density of reads from PAR-CLIP analyses in HEK293 cells (AIRE-) of CSTF2 protein as a marker of the 3’ end processing complex, in the vicinity of proximal and distal pAs of Aire-neutral genes with high d3’UTR ratios > 0.8 or low d3’UTR ratios < 0.2.
Figure 3 with 4 supplements
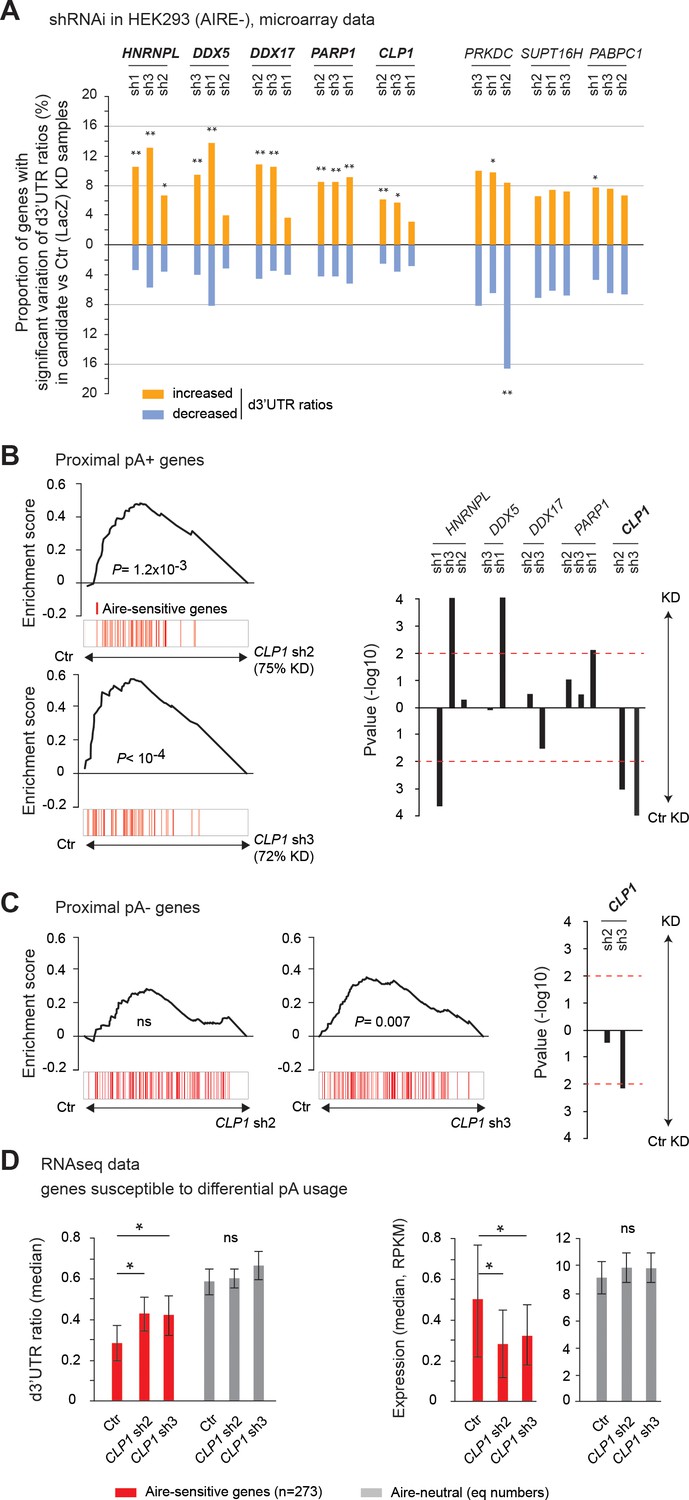
CLP1 controls the expression of Aire-sensitive genes with proximal pAs and their shortening in HEK293 cells.
(A) Individual probe-level analysis of microarray data from knockdown and control HEK293 cells. Vertical bars represent the proportion of genes with a significant increase or decrease of d3’UTR ratios in the candidate vs. Ctr (LacZ) knockdown samples. *p<10−4, **p<10−9 (Chi-squared test). (B), (C) Gene Set Enrichment Analysis of Aire-sensitive genes among Ctr (LacZ) vs CLP1 KD ranked expression datasets of all genes susceptible to differential pA usage (with potential proximal pAs: proximal pA+) (B) and without potential proximal pAs (proximal pA-) (C) in their 3’UTRs as identified in the PolyA_DB 2 database. Significance and direction of the enrichment is shown for each hit shRNA, as well as P value thresholds of 0.01 by horizontal red dashed lines (Right). (D) Median of d3’UTR ratios (Left) and expression values (Right) from RNA-seq data of Aire-sensitive and neutral genes in HEK293 cells infected by lentiviruses containing CLP1 hit shRNAs or the Ctr (LacZ) shRNA; equal number (n = 273) of neutral genes included, error bars show the 95% confidence interval of the medians. *p<0.05.
-
Figure 3—source data 1
Human Gene ST1.0 microarray probeset and individual probe expression extraction.
We use the aroma.affymetrix R-package and the commands listed in the aroma.affymetrix.commands.docx file for ‘probeset expression extraction’ and ‘individual probe expression extraction’. A mandatory folder organization associated with this package is needed for the analysis. The sample CEL files must be added in a dedicated folder. (HuGene-1_0 st-v1,r3.cdf) is the Chip Description File. (probeset.csv) is the list of probeset IDs corresponding to the genes on the array. (HuGeneST1features.csv) is the list of probeset IDs and their individual probe IDs.
- https://cdn.elifesciences.org/articles/52985/elife-52985-fig3-data1-v3.zip
-
Figure 3—source data 2
Microarray individual probe d3’UTR mapping and d3’UTR ratio calculation.
Microarray_d3UTR_hg19.R: R-script to perform individual probe d3’UTR mapping and d3’UTR ratio calculation. Dependent files: - annotation file including 3d’UTR features for microarray analysis (Figure 1—source data 1): features_hg19_UTR_d.csv - Individual probe location on hg19: HuGene-1_0 st-v1.hg19.probe.csv - Individual probe expression obtained from the comparison: CTR versus CLP1 sh2 KD samples (Figure 3—source data 1): ST1features_CTR_v_CLP1_SH2.csv Result file: global_HuGene_CTR_v_CLP1_SH2.csv In the result file, the feat_WTnorm and feat_KOnorm columns correspond, for the 3UTRd features, to the d3’UTR ratios in WT and KO samples, respectively.
- https://cdn.elifesciences.org/articles/52985/elife-52985-fig3-data2-v3.zip
-
Figure 3—source data 3
d3’UTR ratio imbalance obtained from microarray data.
Microarray_d3UTR_significance.R: R-script used to perform the analysis. (global_HuGene_CTR_v_CLP1_SH2_3dUTR.csv) corresponds to global_HuGene_CTR_v_CLP1_SH2.csv that was obtained from Figure 3—source data 2 and restricted to the d3’UTR features.
- https://cdn.elifesciences.org/articles/52985/elife-52985-fig3-data3-v3.zip
Figure 3—figure supplement 1
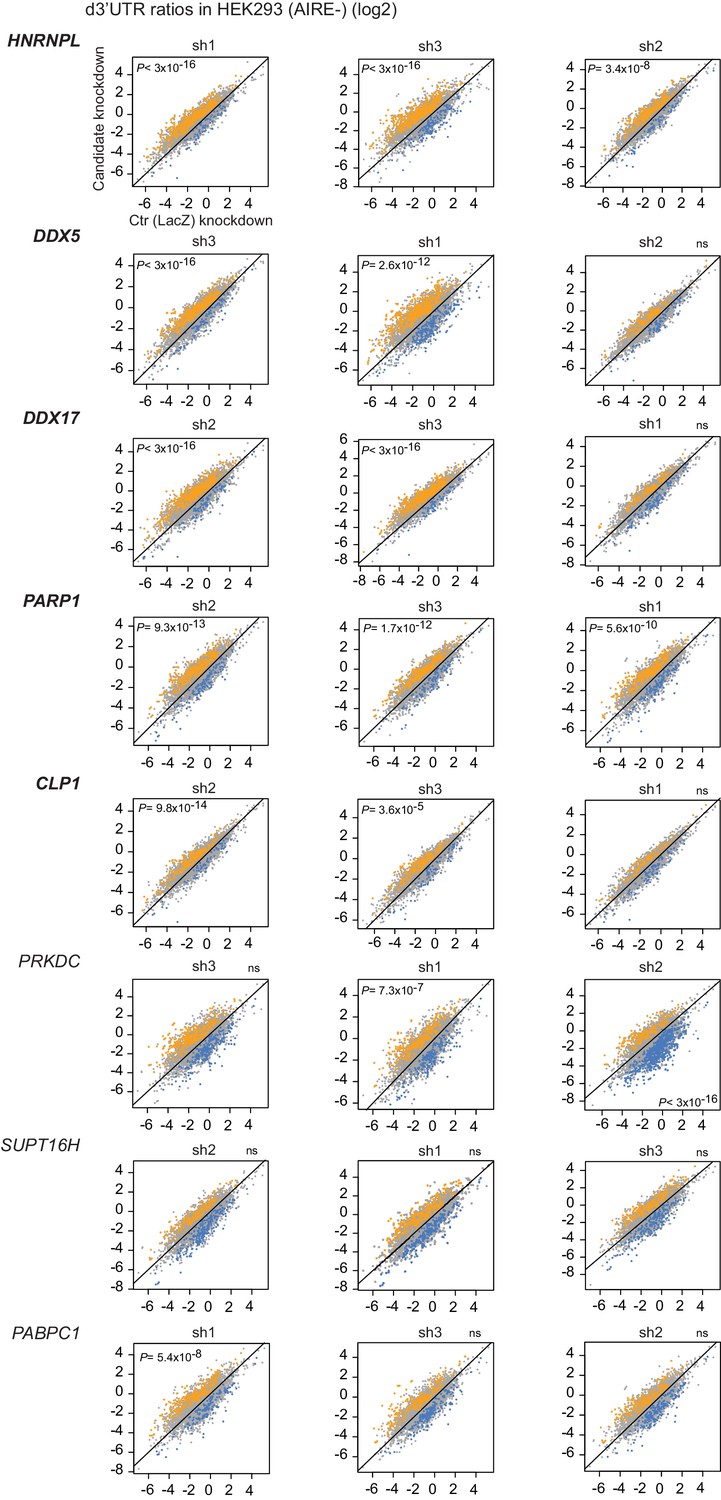
Effect of shRNA-mediated interference of candidate factors on d3’UTR ratios.
Individual probe-level analysis of microarray data from HEK293 cells infected by lentiviruses containing one of the three hit shRNAs of each candidate gene or the Ctr (LacZ) shRNA. Genes whose d3’UTR ratios show significant increase or decrease in the candidate vs. Ctr (LacZ) knockdown sample are represented in orange or blue respectively, otherwise in gray. P values comparing the proportion of genes with a significant increase or decrease of d3’UTR ratios to the proportion of genes whose variation is not significant, are assessed by a Chi-squared test and labeled in the quadrant toward which the d3’UTR ratios significantly increase.
Figure 3—figure supplement 2
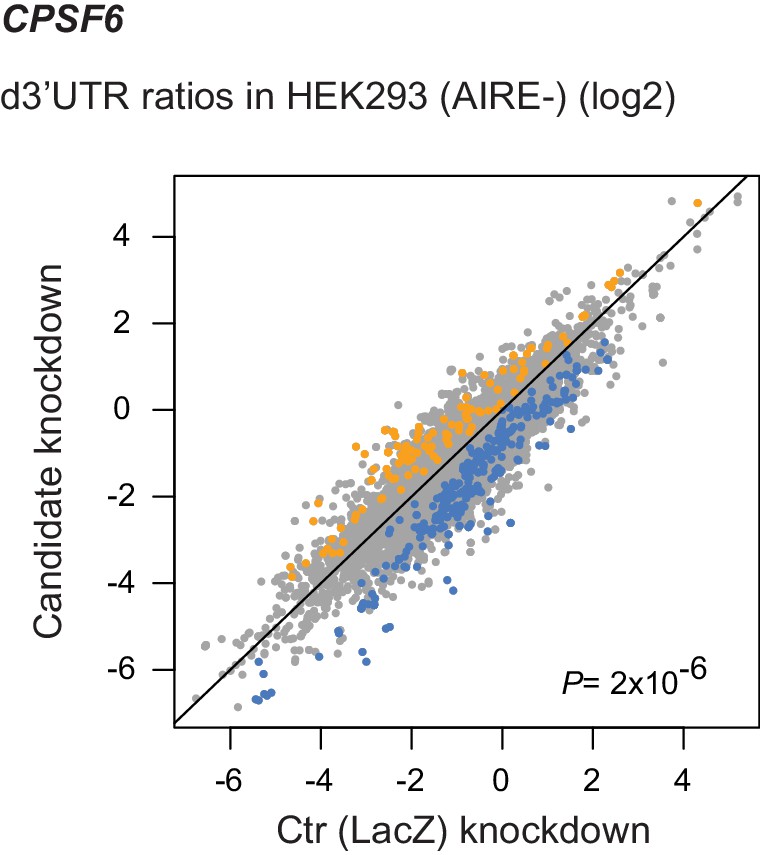
CPSF6 promotes 3’UTR lengthening.
Individual probe-level analysis of microarray data in HEK293 cells infected by a lentivirus targeting CPSF6. Genes whose d3’UTR ratios show significant increase or decrease in the CPSF6 vs. Ctr (LacZ) knockdown sample are represented in orange or blue respectively, otherwise in gray.
Figure 3—figure supplement 3
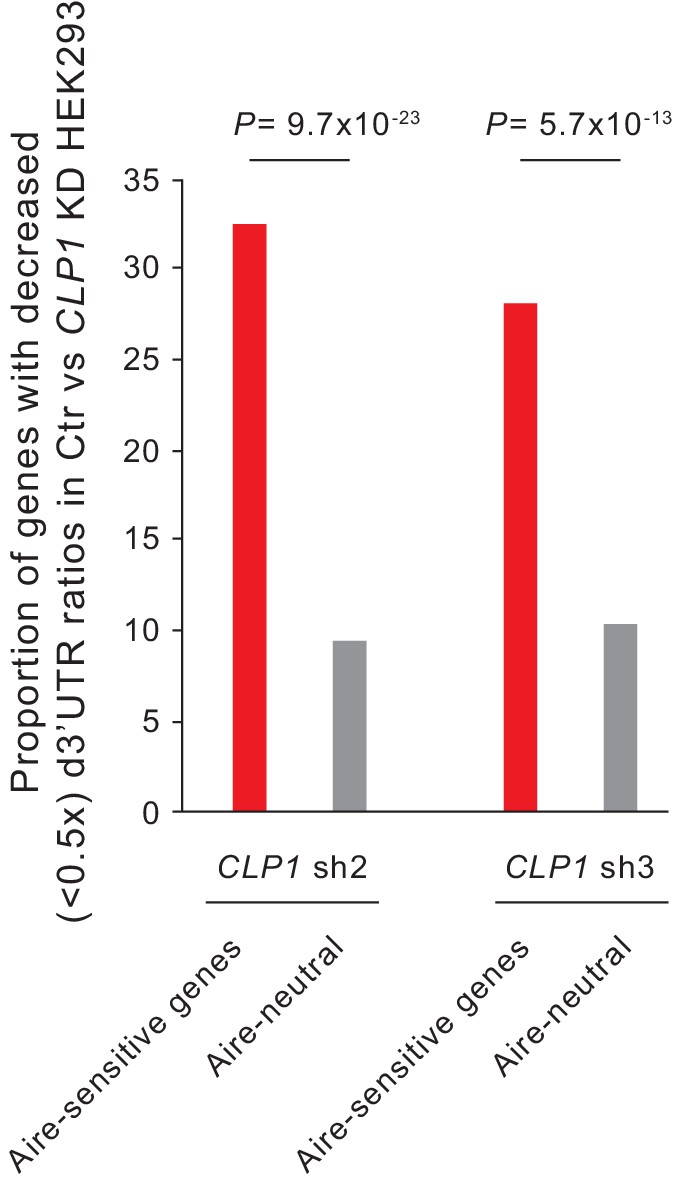
Proportion of genes subject to CLP1-mediated 3’UTR shortening in Aire-sensitive and neutral genes in HEK293 cells.
Genes with decreased (<0.5 x) d3’UTR ratios in Ctr versus CLP1 sh2 or sh3 knockdown HEK293 cells are compared to the number of genes for which the level of 3'UTR length variation can be measured. Statistical significance was assessed by a Chi-squared test.
Figure 3—figure supplement 4
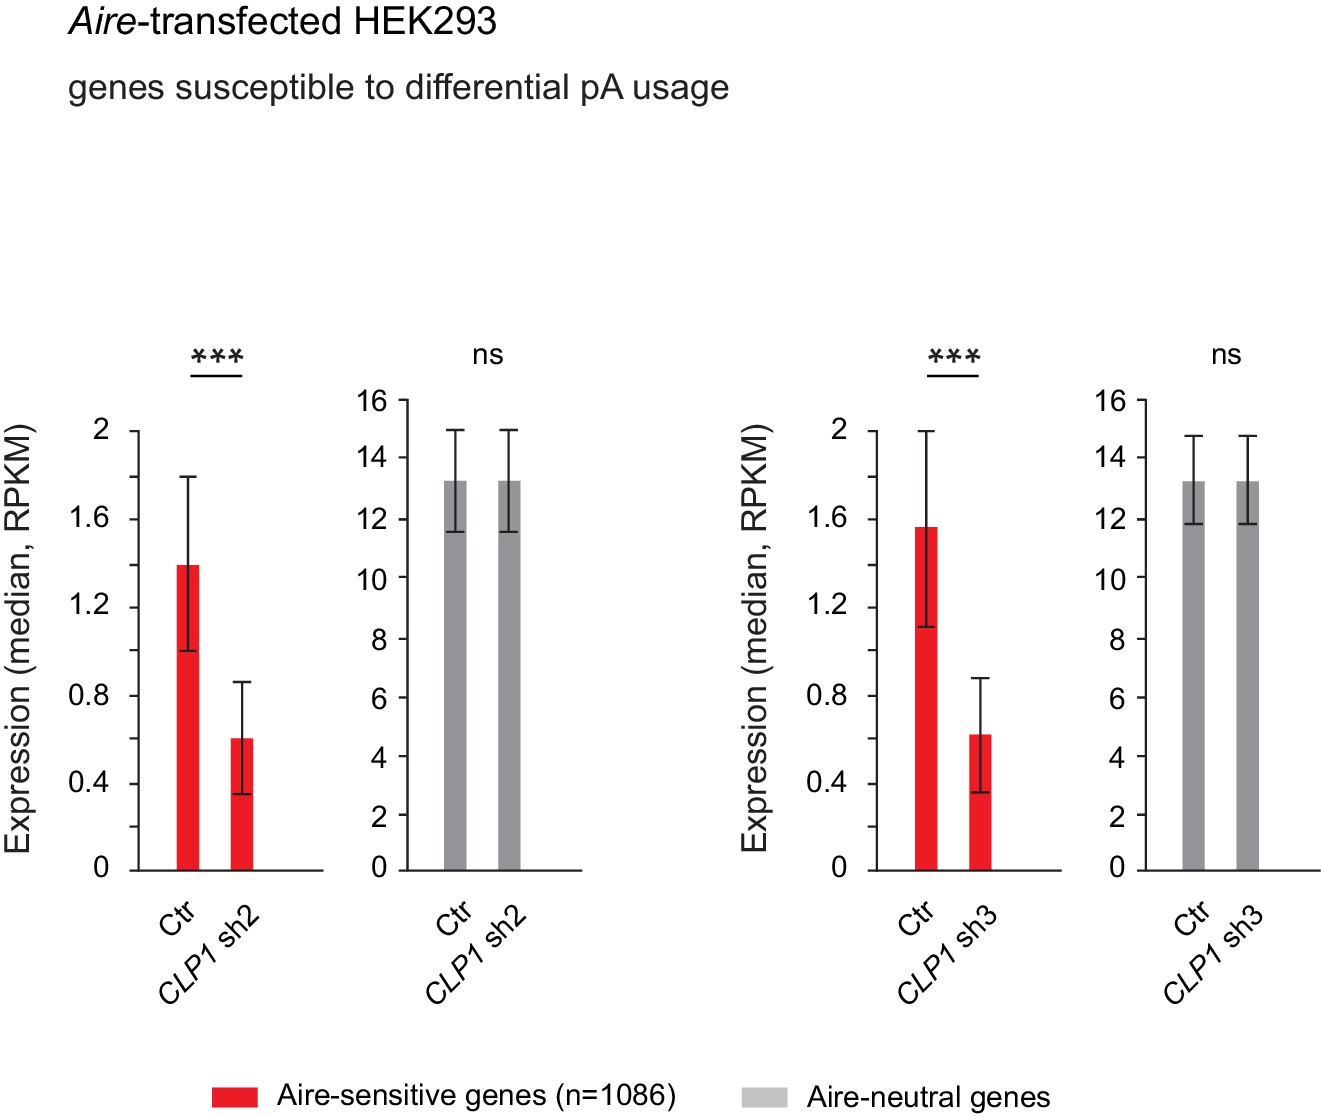
Impact of CLP1 knockdown on the expression levels of Aire-sensitive genes in Aire-transfected HEK293 cells.
Median of expression values from RNA-seq data of Aire-sensitive and neutral genes in Aire-transfected HEK293 cells infected by lentiviruses containing CLP1 hit shRNAs (sh2 Left, sh3 Right) or the Ctr (LacZ) shRNA. The Aire signature was defined through differential expression (FC >2.2, Z-score criterion of p<0.01) with AIRE-negative HEK293 cells transfected with the Ctr plasmid; same neutral genes than in Figure 3D Right, error bars show the 95% confidence interval of the medians. ***p<0.0005.
Figure 4 with 6 supplements
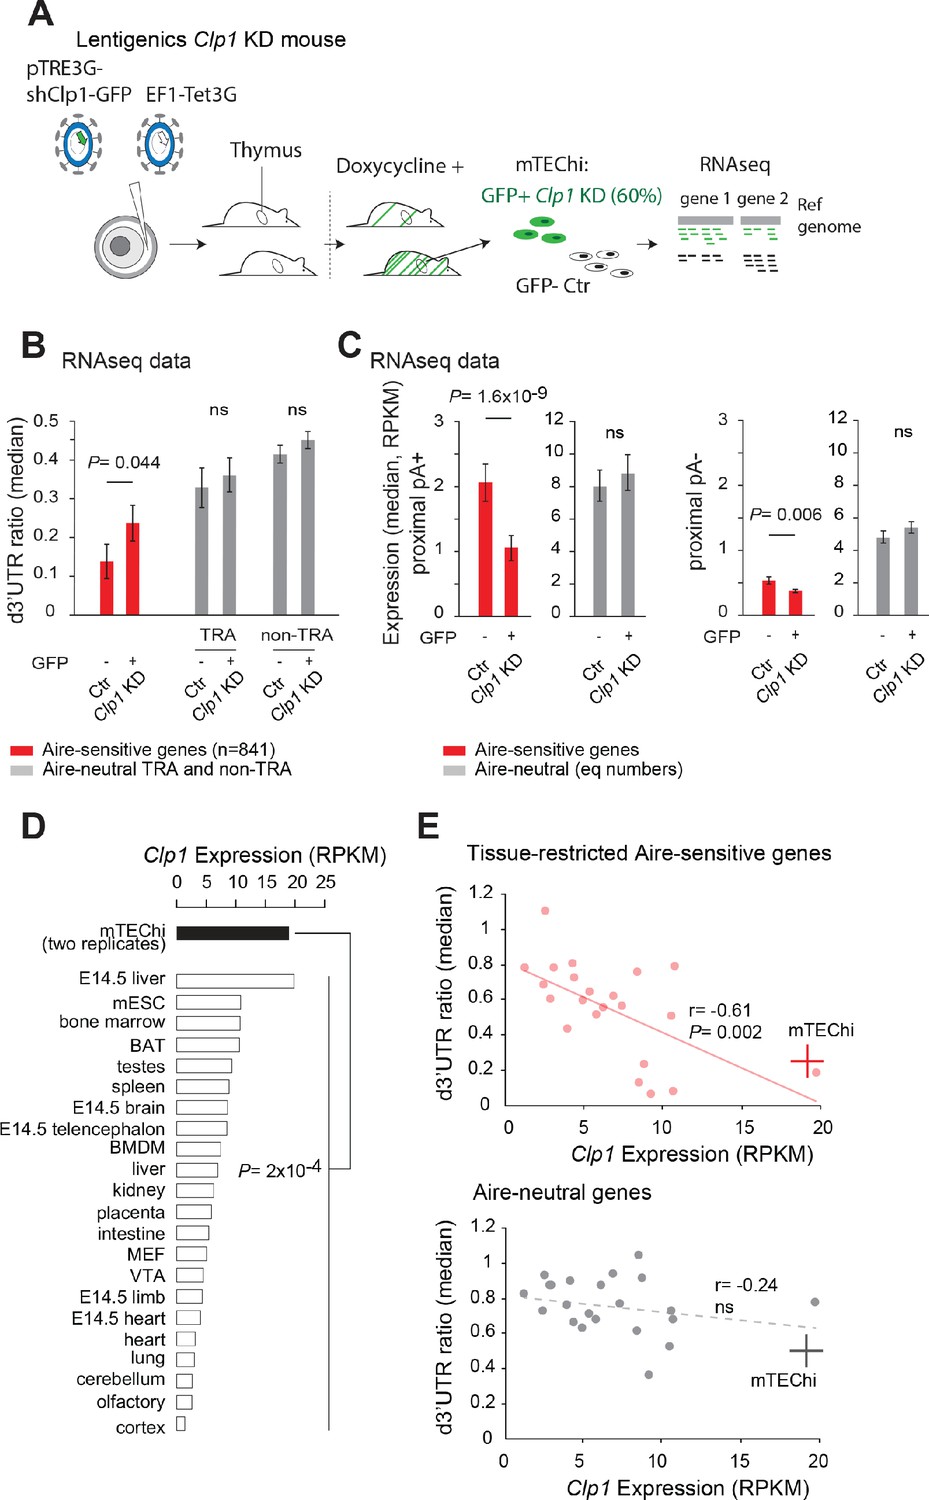
Clp1 controls the expression of Aire-upregulated genes with proximal pAs and their shortening in mTEChi.
(A) Schematic of the lentigenic knockdown strategy. shRNAs against Clp1 were transferred to a doxycycline-inducible expression system for microinfection of fertilized oocytes under the zona pellucid. The resulting pups were screened for integration of the constructs and, after treatment by doxycycline, for GFP expression in mTEChi. GFP+ and GFP- mTEChi were sorted and their transcripts profiled by RNA-seq. (B) Median of d3’UTR ratios of Aire-sensitive genes and all Aire-neutral genes characterized by a tissue-restricted expression (TRA genes) or not (non TRA genes) in GFP+ and GFP- mTEChi from a lentigenic mouse with GFP as a marker of Clp1 knockdown activity; ns: non-significant sample-size adjusted P values. (C) Expression values of Aire-sensitive and neutral genes susceptible to differential pA usage (with potential proximal pAs: proximal pA+) (Left) and without potential proximal pAs (proximal pA-) in GFP+ and GFP- mTEChi (Right); equal numbers of neutral genes included. (D) Clp1 expression from RNA-seq data of two replicate mTEChi and of 22 mouse tissues; median, log10 scale. BAT stands for brown adipocytes tissue, BMDM for bone marrow derived macrophage, MEF for mouse embryonic fibroblast, mESC for mouse embryonic stem cells and VTA for ventral tegmental area. Duplicate reads were discarded for datasets comparison. (E) Median of d3’UTR ratios of Aire-sensitive genes whose expression in the periphery is tissue-restricted and of Aire-neutral genes, relative to the levels of Clp1 expression (log10 scale) in 22 mouse tissues. mTEChi are represented by a red and gray cross for the Aire-sensitive (Top) and neutral genes (Bottom), respectively; peripheral cells are represented by pink and gray circles. Significance is reached for the Aire-sensitive genes, p=0.002, Pearson correlation.
-
Figure 4—source data 1
List of Aire-sensitive genes with proximal pAs in Ctr and Clp1 KD mTEChi.
na is for genes for which d3'UTR ratios could not be calculated due to the absence of reads mapping to regions upstream of proximal pAs in last exons.
- https://cdn.elifesciences.org/articles/52985/elife-52985-fig4-data1-v3.xlsx
Figure 4—figure supplement 1
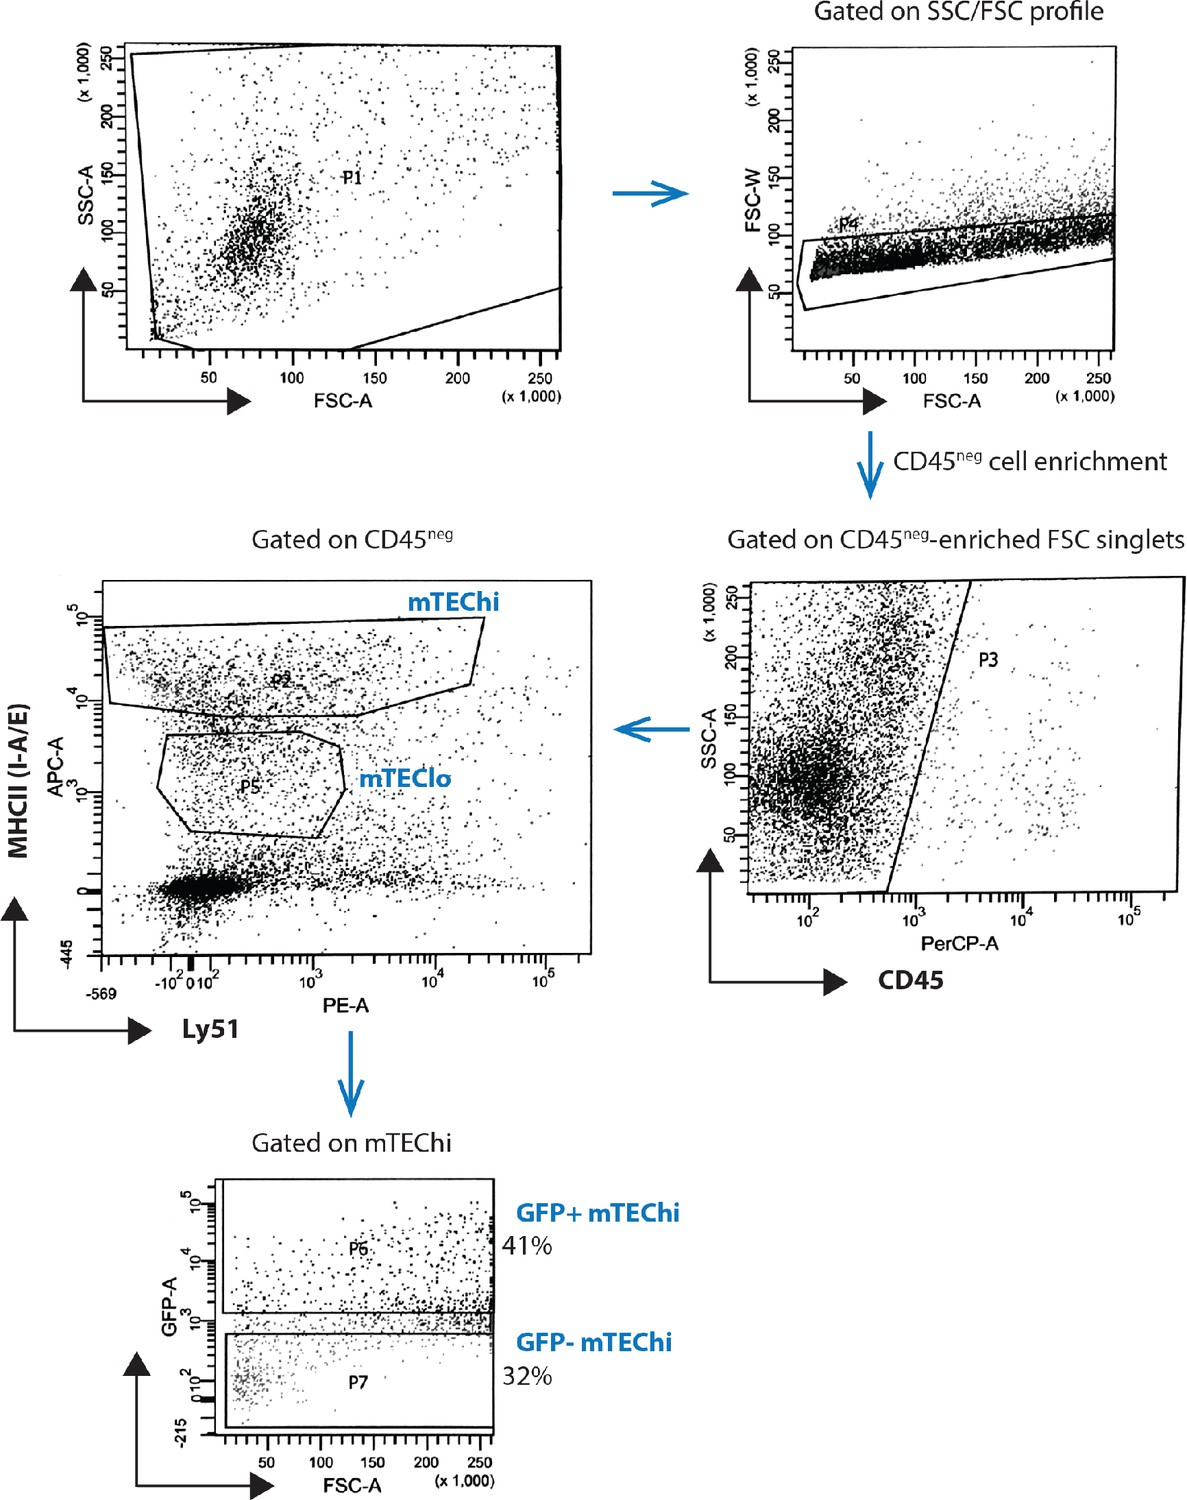
Gating strategy used to purify GFP+ (Clp1 knockdown) and GFP- (Ctr) mTEChi cells.
CD45neg thymic cells were separated based on the expression of MHCII (I-A/E) and Ly51. High levels of MHCII and low/intermediate levels of Ly51 marked mTEChi. mTEClo were shown on the figure as cells with low/intermediate levels of MHCII and low levels of Ly51. mTEClo were not sorted out in this experiment. mTEChi were divided into GFP+ and GFP- mTEChi based on the expression of GFP as a marker of Clp1 knockdown activity.
Figure 4—figure supplement 2
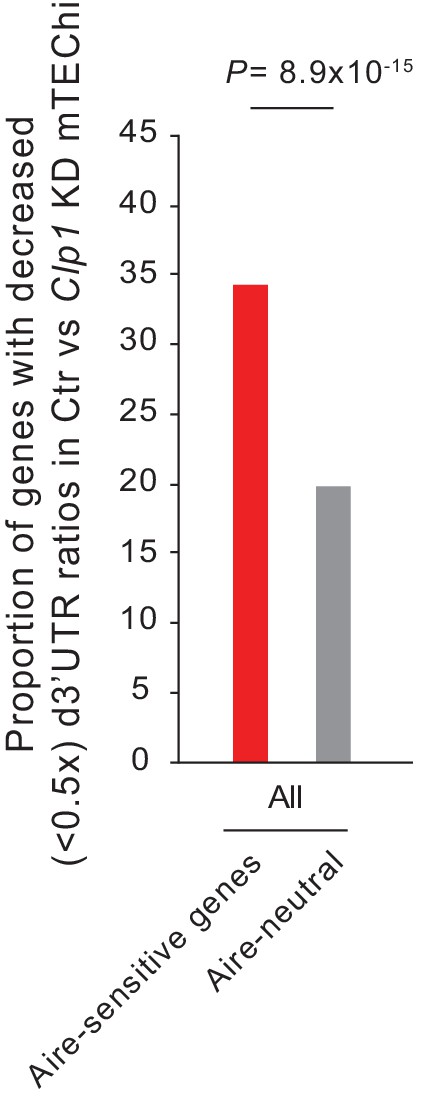
Proportion of genes subject to Clp1-mediated 3’UTR shortening in Aire-sensitive and neutral genes in mTEChi.
Genes with decreased (<0.5 x) d3’UTR ratios in Ctr versus Clp1 knockdown mTEChi were compared to the number of genes for which the level of 3'UTR length variation can be measured. Statistical significance was assessed by a Chi-squared test.
Figure 4—figure supplement 3
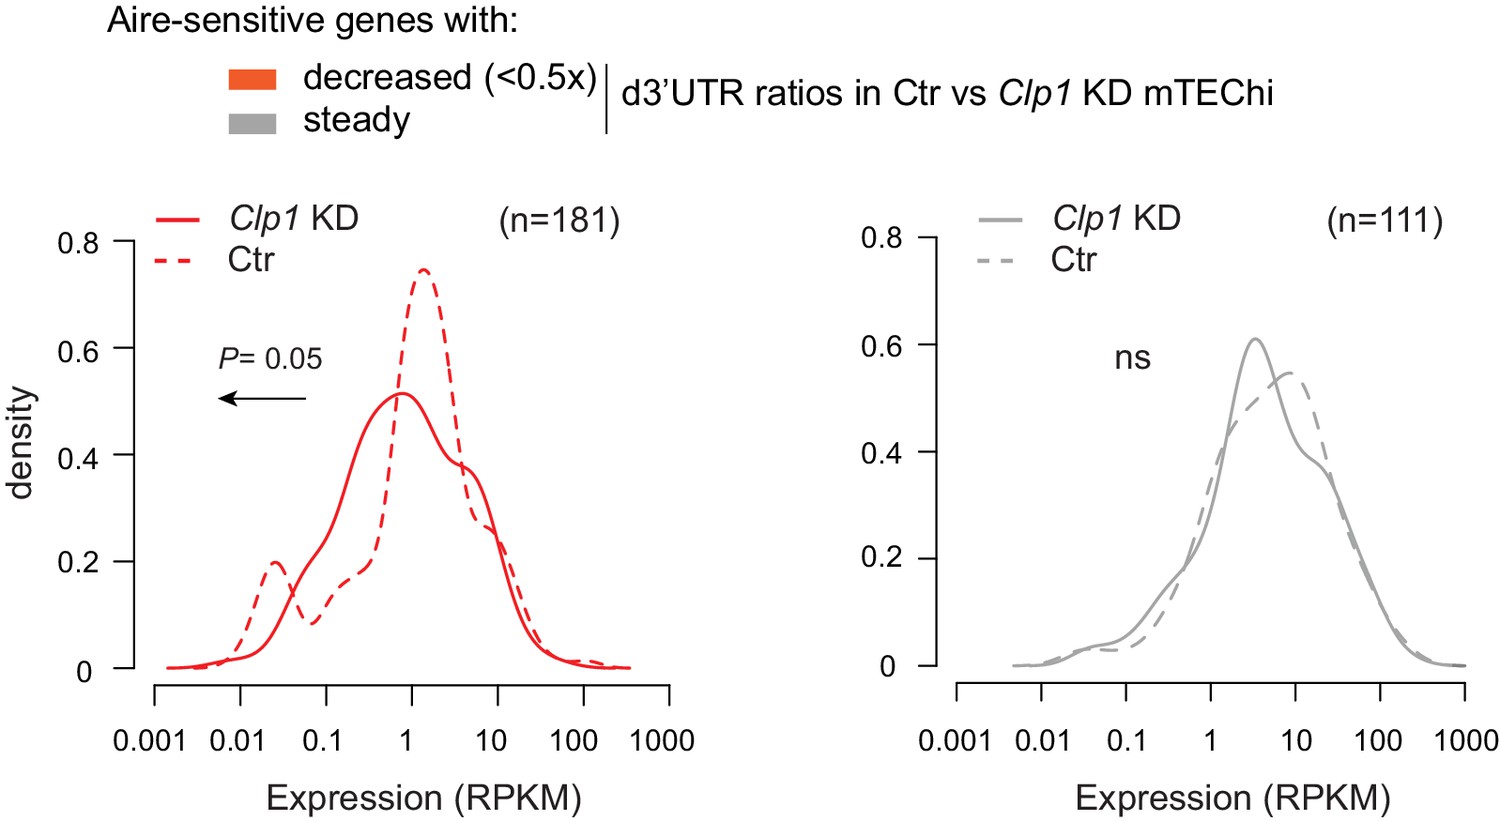
Aire-sensitive genes subject to Clp1-mediated 3’UTR shortening show higher expression in Ctr versus Clp1 KD mTEChi.
Densities of expression values of Aire-sensitive genes depending on whether they undergo Clp1-mediated 3’UTR shortening as identified in Clp1 lentigenics.
Figure 4—figure supplement 4
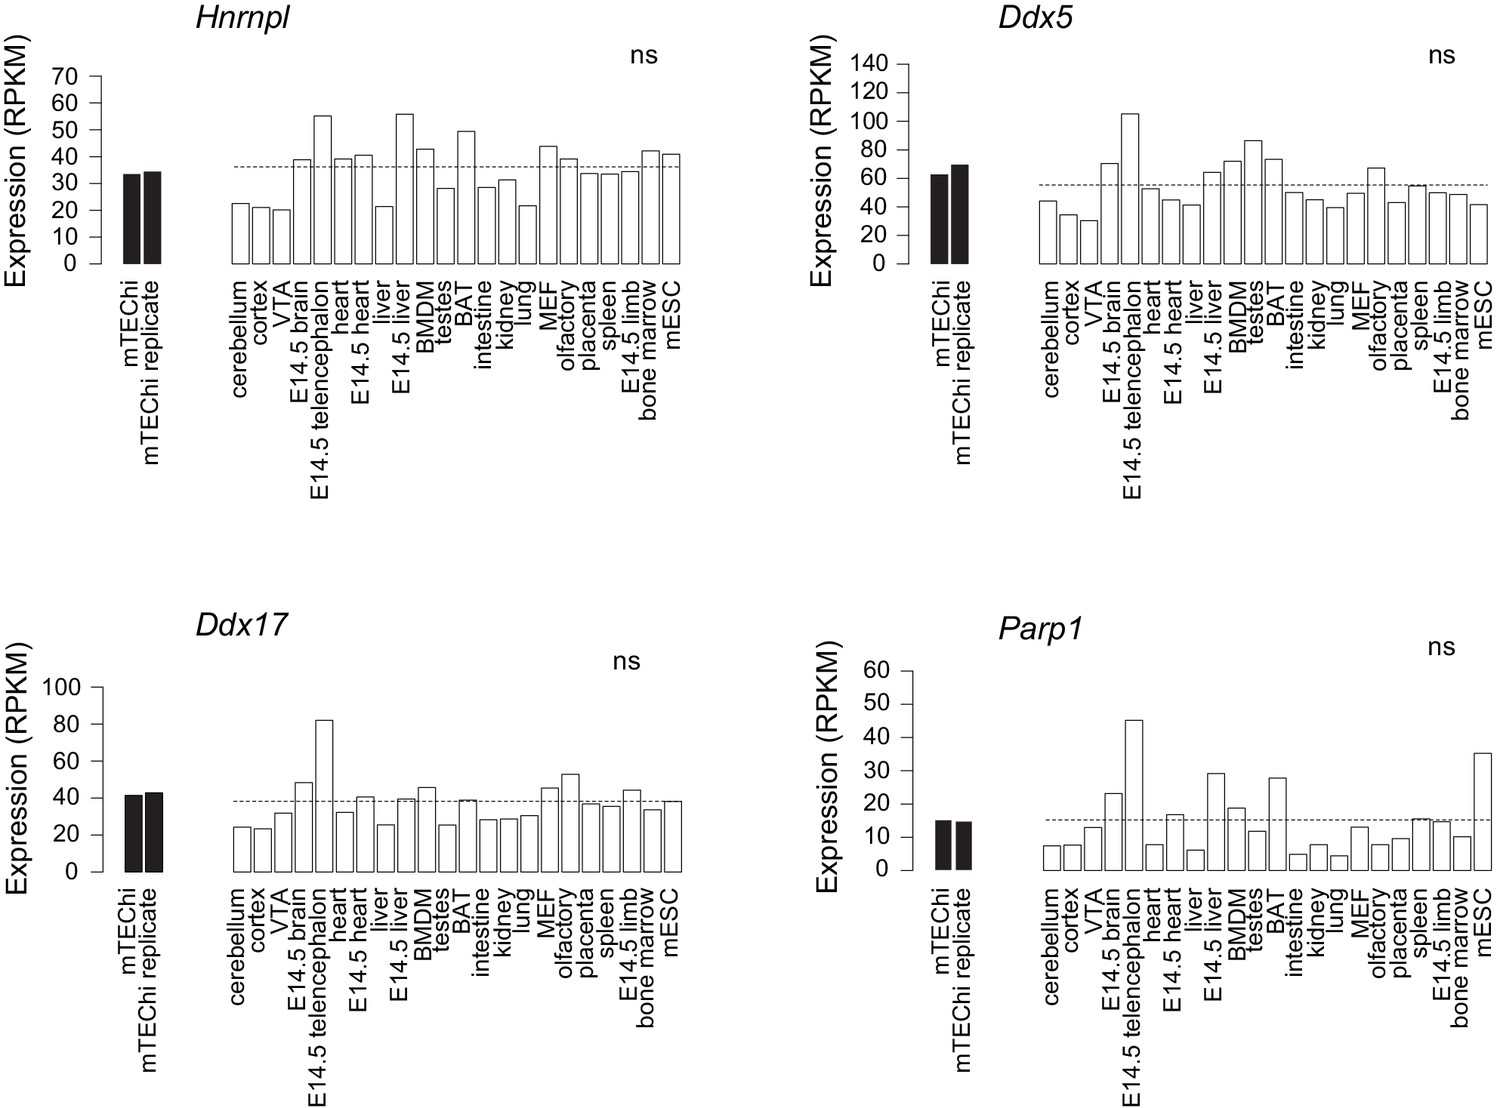
Comparison of gene expression in mTEChi and in mouse tissues.
Expression of the candidate factors having an effect on 3’UTR shortening in HEK293 cells from RNA-seq data of two replicate mTEChi samples, and 22 mouse tissues. The dashed lines show the median expression of the factors in the tissues.
Figure 4—figure supplement 5
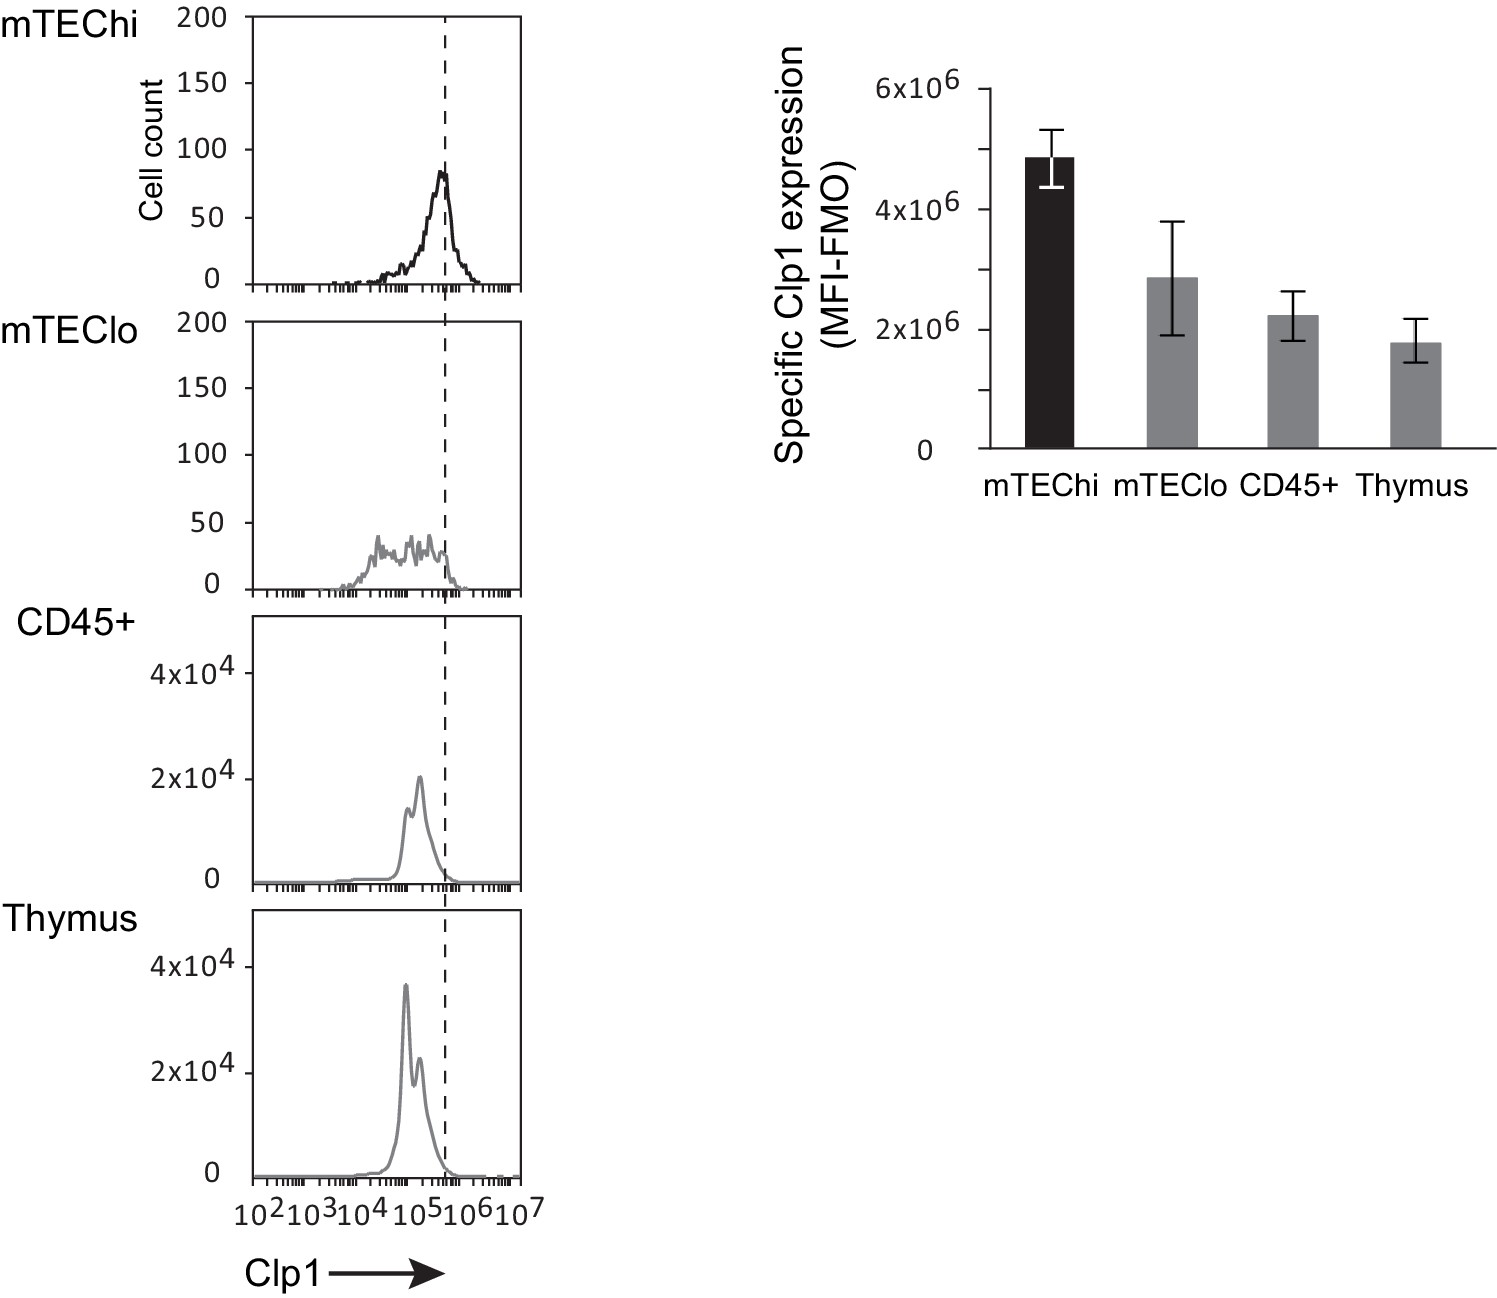
Clp1 expression in the thymus.
Clp1 expression is shown as Mean Fluoresence Intensity (MFI) in mTEChi, mTEClo, thymic-sorted CD45+ and the entire thymus (Left) and is subtracted of fluorescence minus one (FMO) control signals from two independent experiments (Right).
Figure 4—figure supplement 6
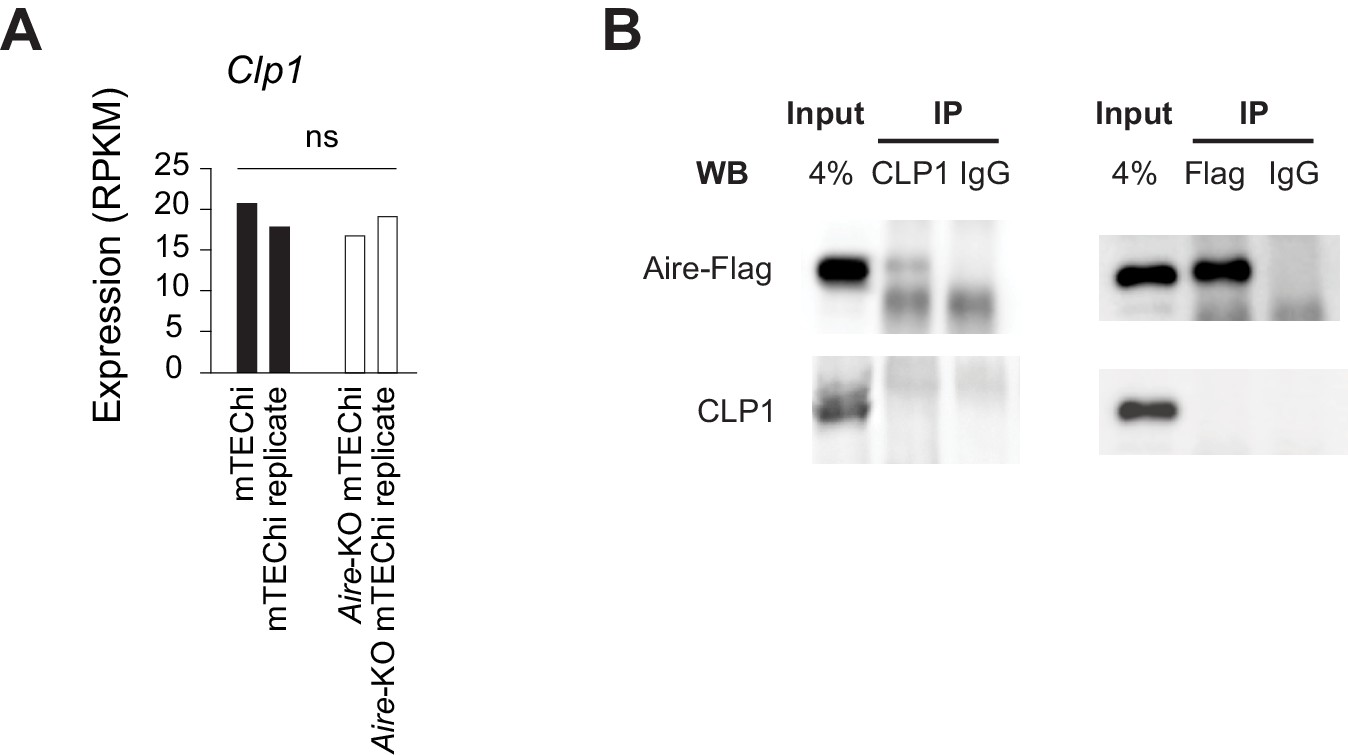
Clp1 is not linked to nor controlled by Aire.
(A) Clp1 expression levels are neutral to Aire deletion. (B) Coimmunoprecipitation of endogenous CLP1 with Flag-tagged Aire is not specific to CLP1, the latter been not detected in the anti-CLP1 immunoprecipitate. No interaction is detected in the reciprocal immunoprecipitation.
Figure 5 with 1 supplement
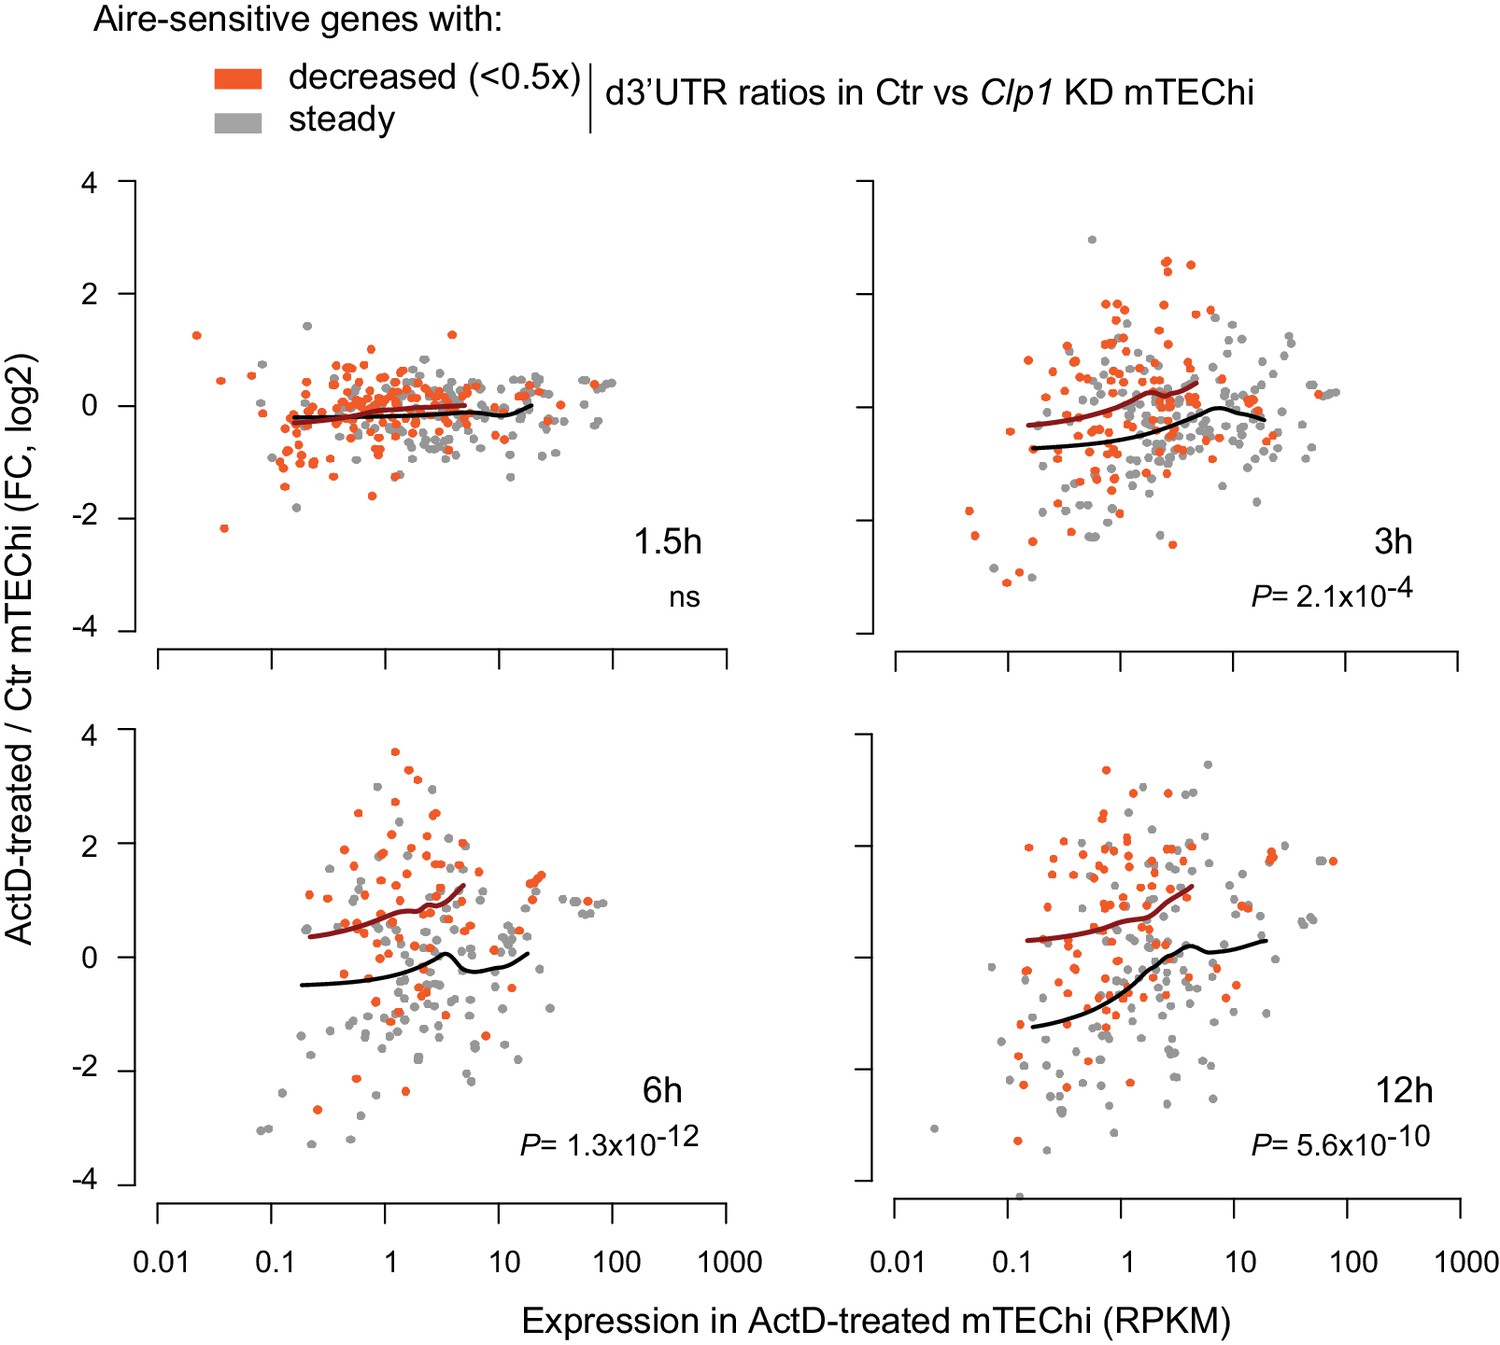
Clp1-driven 3’UTR shortening of the Aire-upregulated transcripts show higher stability in mTEChi.
Relative expression of Aire-sensitive genes in ActD-treated (for indicated time durations) vs. control mTEChi depending on whether they undergo Clp1-mediated 3’UTR shortening as identified in Clp1 lentigenics. Loess-fitted curves are shown in dark orange and black for the Aire-sensitive genes with decreased (<0.5 x) and steady d3’UTR ratios, respectively. P values are for comparison of expression ratios.
-
Figure 5—source data 1
Potential miRNA-specific target genes with conserved miRNA sites in their 3’UTRs or d3’UTRs, from the TargetScan 6.2 database.
In both files (miRNA_target_Refseq.gmt and miRNA_target_Refseq_d3UTR_filtered.csv), the first two columns show miRNA families and individual miRNA(s). (miRNA_target_Refseq.gmt) was used in GSEA to determine the miRNA-specific target gene sets showing significant enrichment in mTEChi or mTEClo. (miRNA_target_Refseq_d3UTR_filtered.csv) was used to determine the proportion of Aire-sensitive and neutral genes potentially targeted in their d3’UTRs by miRNAs. The file (Leading_edge_mTEChi_vs_lo_346_miRNAs.xlsx) summarizes the leading edge analysis of 346 miRNAs or miRNA families and lists the core targets that account for enrichment signals of gene sets significantly deviated (FDR < 0.05) in mTEChi versus mTEClo. Here all significant gene sets are reduced in mTEChi (enriched in mTEClo). Table values are rank metric scores. The last line of the table shows the number of miRNAs or miRNA families potentially recognizing specific leading edge targets.
- https://cdn.elifesciences.org/articles/52985/elife-52985-fig5-data1-v3.zip
Figure 5—figure supplement 1
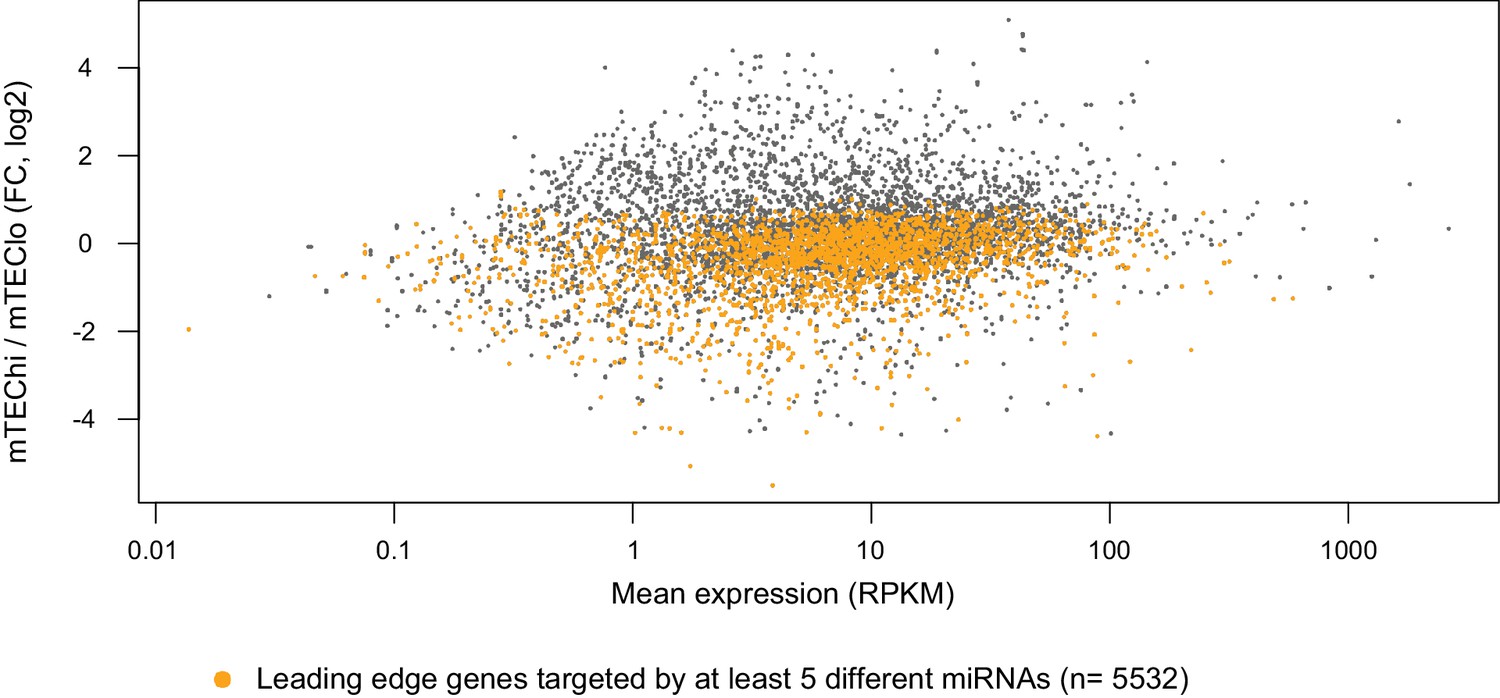
miRNA-mediated post-transcriptional regulation in mTEChi versus mTEClo.
RNA-seq differential expression (fold-change) between mTEChi and mTEClo sorted from a pool of 4 thymi. Orange dots show 5532 genes that contribute the most to the miRNA-specific gene set reduction identified by GSEA in mTEChi and that are targeted by a least five different miRNAs.
Tables
Key resources table
| Reagent type (species) or resource | Designation | Source or reference | Identifiers | Additional information |
|---|---|---|---|---|
| Genetic reagent (Mus-musculus) | B6.129S2-Airetm1.1Doi/J | Anderson et al., 2002 | RRID:IMSR_JAX:004743 | Provided by D. Mathis and C. Benoist (Harvard Medical School) |
| Cell line (Homo-sapiens) | HEK293 cells | Martin et al., 2012 | Cell line obtained from M. Zavolan lab | |
| Cell line (Mus-musculus) | 1C6 mouse thymic epithelial cells | Mizuochi et al., 1992 | ||
| Transfected construct (mouse) | pCMV-Aire-Flag plasmid | Abramson et al., 2010 | ||
| Antibody | anti-mouse CD45-PerCPCy5.5 (Clone: 30-F11; Rat IgG2b, k) | Biolegend | Cat# 103131 RRID:AB_893344 | FACS (1:50) |
| Antibody | anti-mouse Ly51-PE (Clone: 6C3; Rat IgG2a, k) | Biolegend | Cat# 108307 RRID:AB_313364 | FACS (1:800) |
| Antibody | anti-mouse I-A/E-APC (Clone: M5/114.15.2; Rat IgG2b, k) | eBioscience | Cat# 17–5321 RRID:AB_469455 | FACS (1:1200) |
| Antibody | anti-Clp1 (Clone: EPR7181; Rabbit monoclonal) | GeneTex | Cat# GTX63930 | FACS (1:100) |
| Antibody | anti-human CLP1 (Goat polyclonal) | Santa Cruz | Cat# sc-243005 | IP and WB |
| Antibody | Flag-tag M2 (Mouse monoclonal) | Sigma | Cat# F1804 RRID:AB_262044 | IP and WB |
| Antibody | mouse CD45 microbeads | Miltenyi Biotec | Cat# 130-052-301 | |
| Recombinant DNA reagent | PLKO.1-Puro shRNAs (plasmids-lentiviruses) | Broadinstitute (RNAi platform) | shRNA details: Supplementary file 1 | |
| Recombinant DNA reagent | EF1-Tet3G (plasmid-lentivirus) | Vectalys | ||
| Recombinant DNA reagent | pTRE3G-shClp1-GFP (plasmid-lentivirus) | Vectalys | Clp1 shRNAs: Supplementary file 1 | |
| Sequence-based reagent | qPCR primers | this paper | primer details: Supplementary file 2 | |
| Sequence-based reagent | oligo(dT)12–18 primers | ThermoFisher | Cat# 18418012 | |
| Commercial assay or kit | Trans-IT-293 transfection reagent | Mirus | Cat# MIR 2700 | |
| Commercial assay or kit | Universal Magnetic Co-IP Kit | Active Motif | Cat# 54002 | |
| Commercial assay or kit | Superscript II Reverse Transcriptase | ThermoFisher | Cat# 18064071 | |
| Chemical compound, drug | collagenase D | Roche | Cat# 11088866001 | (1 mg/mL final) |
| Chemical compound, drug | DNase I | Sigma | Cat# DN25 | (1 mg/mL final) |
| Chemical compound, drug | collagenase/dispase | Roche | Cat# 11097113001 | (2 mg/mL final) |
| Chemical compound, drug | actinomycin D | Sigma | Cat# A9415 | (1 µM) |
| Software, algorithm | Bowtie | Johns Hopkins University (http://bowtie-bio.sourceforge.net/index.shtml) | RRID:SCR_005476 | |
| Software, algorithm | Samtools | Samtools (http://samtools.sourceforge.net/) | RRID:SCR_002105 | |
| Software, algorithm | Bedtools | University of Utah (https://bedtools.readthedocs.io/en/latest/) | RRID:SCR_006646 | |
| Software, algorithm | DESeq | EMBL (http://bioconductor.org/packages/release/bioc/html/DESeq.html) | RRID:SCR_000154 | |
| Software, algorithm | RNAseq_d3UTR_ratio_density.R | this paper | provided: Figure 1—source data 3 | |
| Software, algorithm | CEAS | CEAS (http://ceas.cbi.pku.edu.cn/index.html) | RRID:SCR_010946 | |
| Software, algorithm | aroma.affymetrix R package | UCSF (prev. UC Berkeley) (https://www.aroma-project.org) | RRID:SCR_010919 | details: Figure 3—source data 1 |
| Software, algorithm | Microarray_d3UTR_hg19.R | this paper | provided: Figure 3—source data 2 | |
| Software, algorithm | Microarray_d3UTR_significance.R | this paper | provided: Figure 3—source data 3 | |
| Software, algorithm | GSEA | BroadInstitute (http://www.broadinstitute.org/gsea/) | RRID:SCR_003199 |
Additional files
-
Supplementary file 1
List of shRNAs.
- https://cdn.elifesciences.org/articles/52985/elife-52985-supp1-v3.docx
-
Supplementary file 2
List of primers.
- https://cdn.elifesciences.org/articles/52985/elife-52985-supp2-v3.docx
-
Transparent reporting form
- https://cdn.elifesciences.org/articles/52985/elife-52985-transrepform-v3.pdf
Download links
A two-part list of links to download the article, or parts of the article, in various formats.
Downloads (link to download the article as PDF)
Open citations (links to open the citations from this article in various online reference manager services)
Cite this article (links to download the citations from this article in formats compatible with various reference manager tools)
Aire-dependent genes undergo Clp1-mediated 3’UTR shortening associated with higher transcript stability in the thymus
eLife 9:e52985.
https://doi.org/10.7554/eLife.52985


