Pre-stimulus phase and amplitude regulation of phase-locked responses are maximized in the critical state
- Department of Integrative Neurophysiology, Center for Neurogenomics and Cognitive Research (CNCR), Amsterdam Neuroscience, Netherlands
- Neuroscience Institute, New York University School of Medicine, United States
- Technical University of Munich, Germany
- Czech Technical University in Prague, Czech Republic
Figures
Figure 1 with 3 supplements
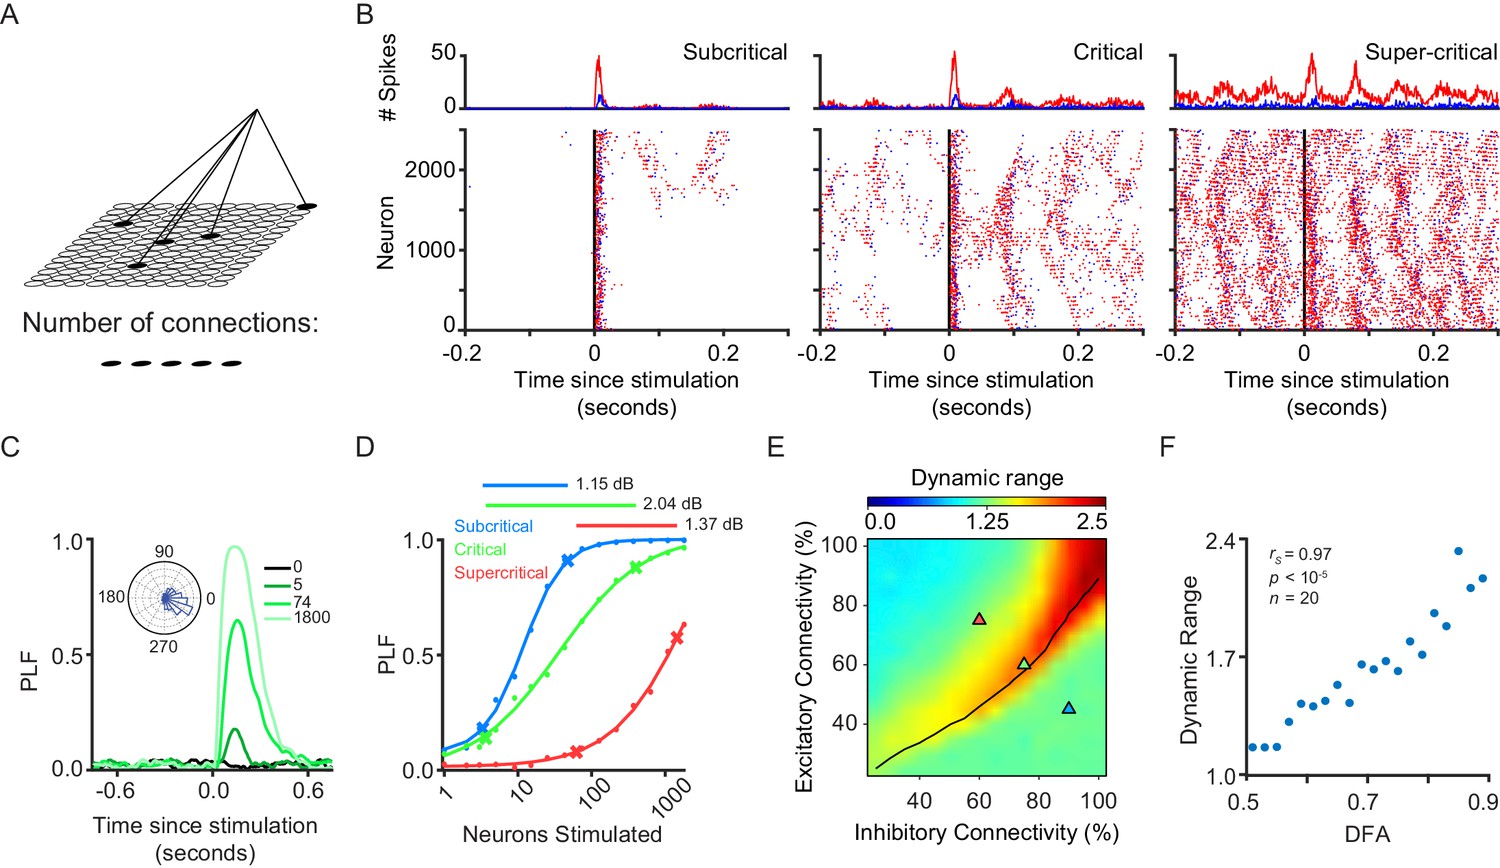
Dynamic range is maximized when network exhibits critical-state dynamics.
(A) A stimulus is connected to a random subset of excitatory neurons on the grid. (B) We stimulated 1800 excitatory neurons in three example subcritical, critical and supercritical networks. The top plots show the total number of excitatory (red) and inhibitory (blue) spikes with millisecond resolution. Plots below show individual spikes for all 2500 excitatory and inhibitory neurons in the networks. In all cases, the response to the stimulus is oscillatory with a periodicity characteristic of an alpha (8–16 Hz) rhythm. (C) The phase-locking factor at a time point post-stimulus is calculated as the normalized vector sum of phase angles across trials (inset left). A value of 1 corresponds to all trials having the same phase, a value of 0 corresponds to a uniform distribution of phases. Post-stimulus phase-locking response to a stimulus is dependent on the size of the stimulus. Shown for different stimulus sizes in a critical network. (D) Dynamic range was calculated as the orders of magnitude of neurons stimulated between the 10th and 90th percentile, of a sigmoid fit to the phase-locking response, at a time point where the network shows response to the stimulus (150 ms post-stimulus). Shown for example sub-critical (blue), critical (green) and super-critical (red) networks. (E) Dynamic range is dependent on E/I connectivity balance. The black line indicates critical neuronal avalanches, as measured when the networks were not stimulated. The networks used to illustrate the functionality of different criticality regimes are shown as triangles on the phase-space with the colors of sub-critical (blue), critical (green) and super-critical (red). (F) Dynamic range of phase-locking response increases with long-range temporal correlations (LRTC) at 150 ms post-stimulus (Spearman correlation). Networks binned based on average DFA for each of the 256 excitatory/inhibitory connectivity parameter combinations, and dynamic range calculated as the mean of networks in that bin.
Figure 1—figure supplement 1
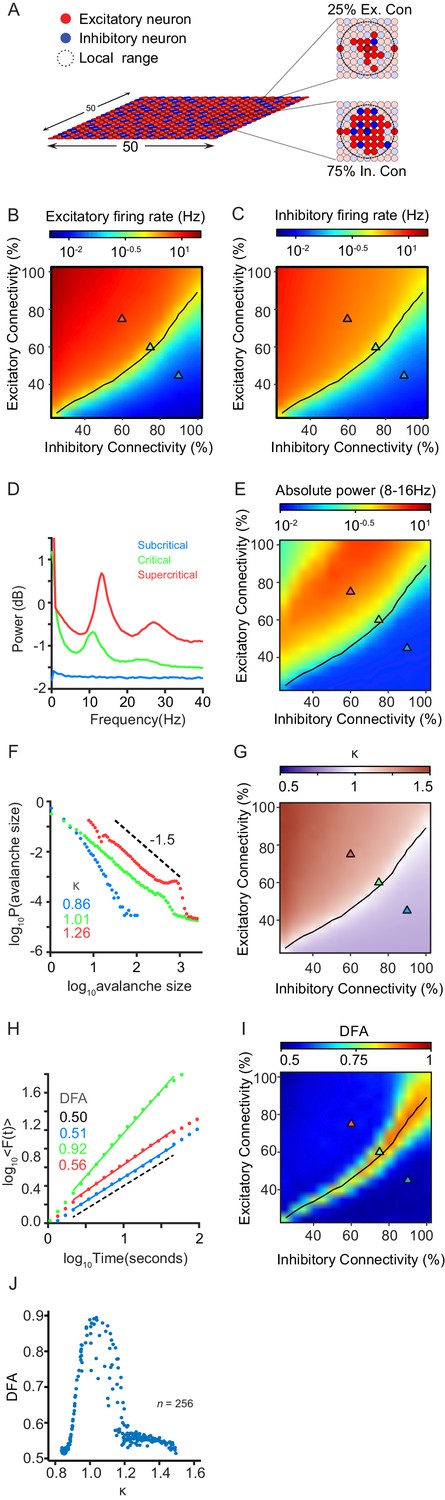
The CROS model produces critical state dynamics in the form of neuronal avalanches and long-range temporal correlations (LRTC) of oscillations, when excitation is balanced by inhibition.
(A) Network consists of excitatory and inhibitory neurons arranged on a grid. Connectivity is set separately for excitatory and inhibitory neurons, and is defined as the percentage of neurons within local range that each neuron connects to. (B,C) Firing rates of excitatory (B) and inhibitory (C) neurons increase as excitatory connectivity is increased. (D) Network activity shows oscillations between 8 and 16 Hz. Shown for three example networks: inhibition-dominated (blue), balanced E/I (green), and excitation-dominated (red). (E) Oscillation power is dependent on the balance between excitation and inhibition. The locations of the three example networks are highlighted on the phase space by triangles with corresponding colors. (F) Spiking activity can display sub-critical (blue), critical (green) or super-critical (red) neuronal avalanches. Shown for same networks as (D). (G) Criticality of neuronal avalanches is dependent on E/I balance. The black line indicates critical neuronal avalanches (). (H) Oscillations can exhibit LRTC in their amplitude modulation, as measured by detrended fluctuation analysis (DFA). DFA is ~0.5 for random signals, and > 0.5 for signals with temporal correlations. Shown for same networks as (D). (I) LRTC emerge when excitation balances inhibition in terms of connectivity. The black line indicates critical neuronal avalanches (). (J) LRTC peak with at Kappa ~ 1, corresponding to critical neuronal avalanches.
Figure 1—figure supplement 2
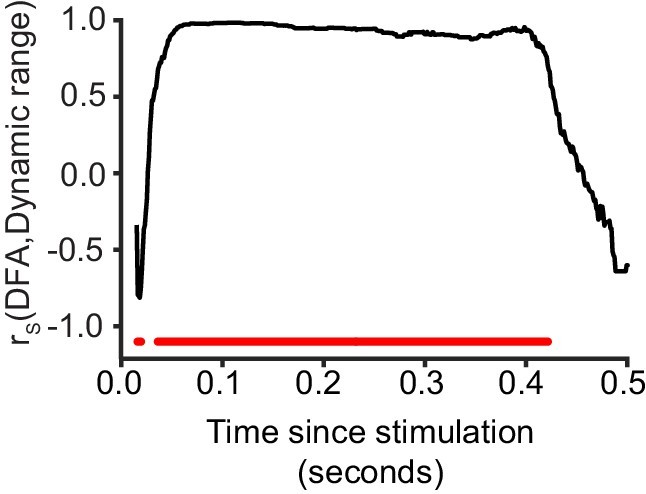
Critical networks exhibit maximum dynamic range of phase-locking factor at multiple post-stimulus latencies.
Dynamic range of phase-locking factor is significantly correlated with LRTC (DFA) in the latency ranges highlighted with red (Spearman correlation, red = p < 0.001, with cluster-based correction for multiple comparisons). Each data point represents the Spearman correlation between the 20 bins of DFA computed for un-stimulated networks, and the mean dynamic range for the respective bins.
Figure 1—figure supplement 3

Critical networks show maximal dynamic range of phase-locking factor.
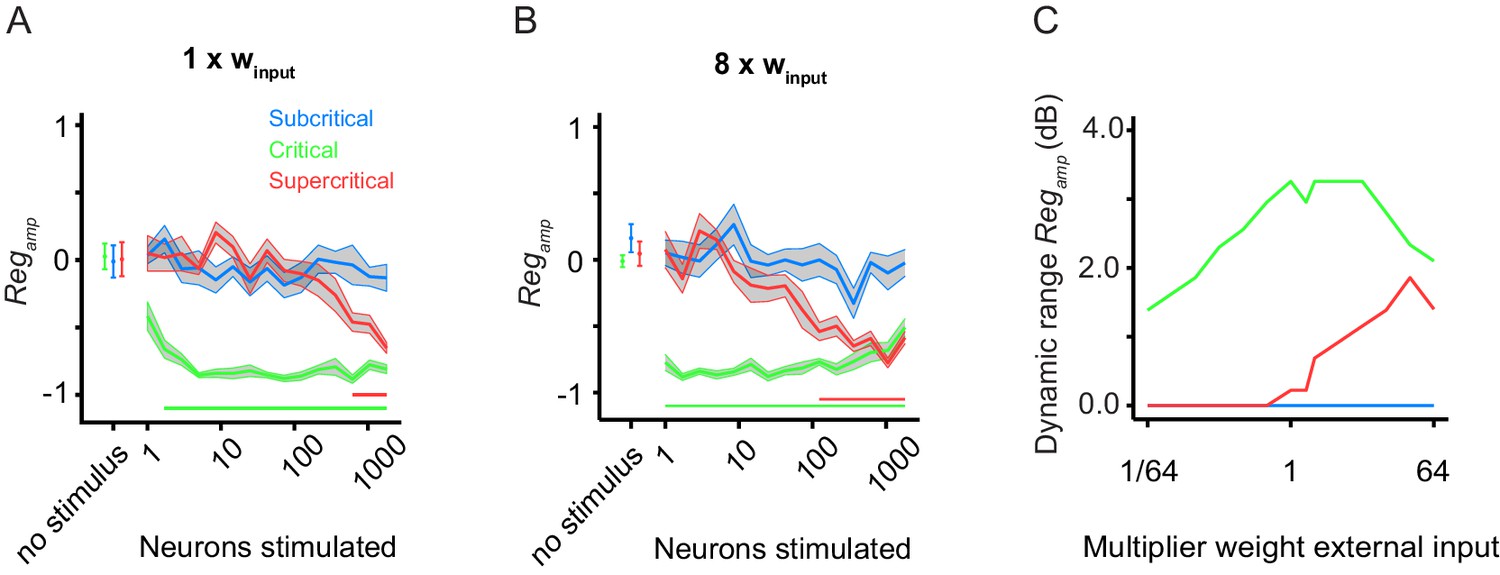
(A) Replication of Figure 1D for comparison purposes. (B) Multiplying stimulus weight by 8, allows the response of super-critical networks to saturate. (C) Dynamic range of PLF for 10 network initializations of the example critical (green), subcritical (blue), and supercritical (red) networks, for different levels of the external input strength (ranging between 1/64 and 64 times the baseline value, winput = 0.0085). Lines denote mean dynamic range, and the gray ribbon represents standard error.
Figure 2 with 3 supplements
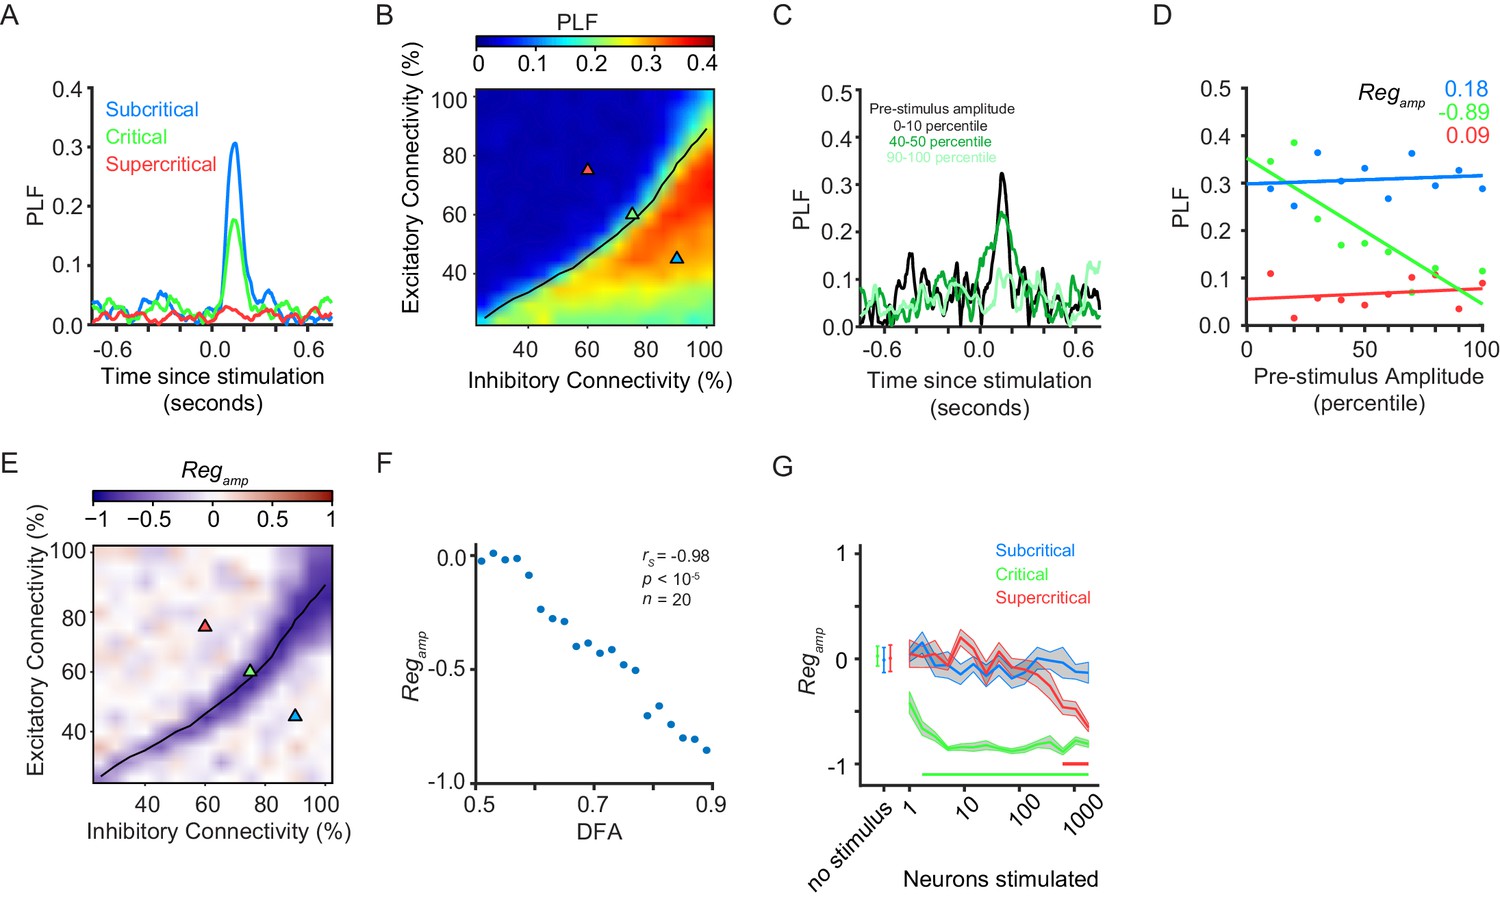
Pre-stimulus amplitude regulation of response requires critical-state dynamics.
(A) Ongoing oscillations phase-lock to stimulus. Example shown for five neurons stimulated, for sub-critical (blue), critical (green), and super-critical networks (red). (B) Phase-locking response at 150 ms post-stimulus depends on the balance between excitation and inhibition, being highest for sub-critical networks, lowest for super-critical networks, and with intermediate values in the critical regime. The locations of the three example networks are highlighted on the phase space by triangles with corresponding colors. black line indicates critical neuronal avalanches. (C) To calculate the PLF response across trials with similar pre-stimulus amplitude, we split trials in 10 bins based on the pre-stimulus amplitude in the −150 to −50 ms time range, for the 8–16 Hz frequency band. Trials belonging to different pre-stimulus amplitude bins show different phase-locking response post-stimulus. Color indicates the percentile interval of the pre-stimulus amplitude bin. (D) Power of pre-stimulus oscillation can alter the phase-locking response of a network to the stimulus, in the presence of critical oscillations. Shown for example sub-critical (blue), critical (green), and super-critical (red) networks. Pre-stimulus amplitude regulation, Regamp, was computed as the Spearman correlation coefficient between the pre-stimulus amplitude percentile bins, and the PLF of the trials in each bin. (E) The strength of pre-stimulus amplitude regulation is dependent on a balance between excitation and inhibition in terms of connectivity. The black line indicates critical neuronal avalanches, as measured when the networks were not stimulated. Here shown for a stimulus size of 5 neurons. (F) Pre-stimulus amplitude regulation (Regamp) is more prominent for stronger LRTC (DFA) at 150 ms post-stimulus (Spearman correlation). DFA was measured for the non-stimulated networks, and Regamp was measured for the same networks, but with a five neuron stimulus. Networks binned based on DFA as in Figure 1F. (G) Critical networks exhibit pre-stimulus amplitude regulation for the widest range of stimuli. Supercritical networks also show regulation, but only at very high stimulus sizes. mean ± sem corresponding to 10 individual networks with the same excitatory/inhibitory connectivity as the selected sub-critical (blue), critical (green), super-critical (red) networks. Horizontal lines at the bottom of the plot show the range of stimuli for which the networks show significant pre-stimulus regulation (two-sided t-test, null hypothesis mu = 0, Bonferroni corrected for 3 × 16 comparisons).
Figure 2—figure supplement 1
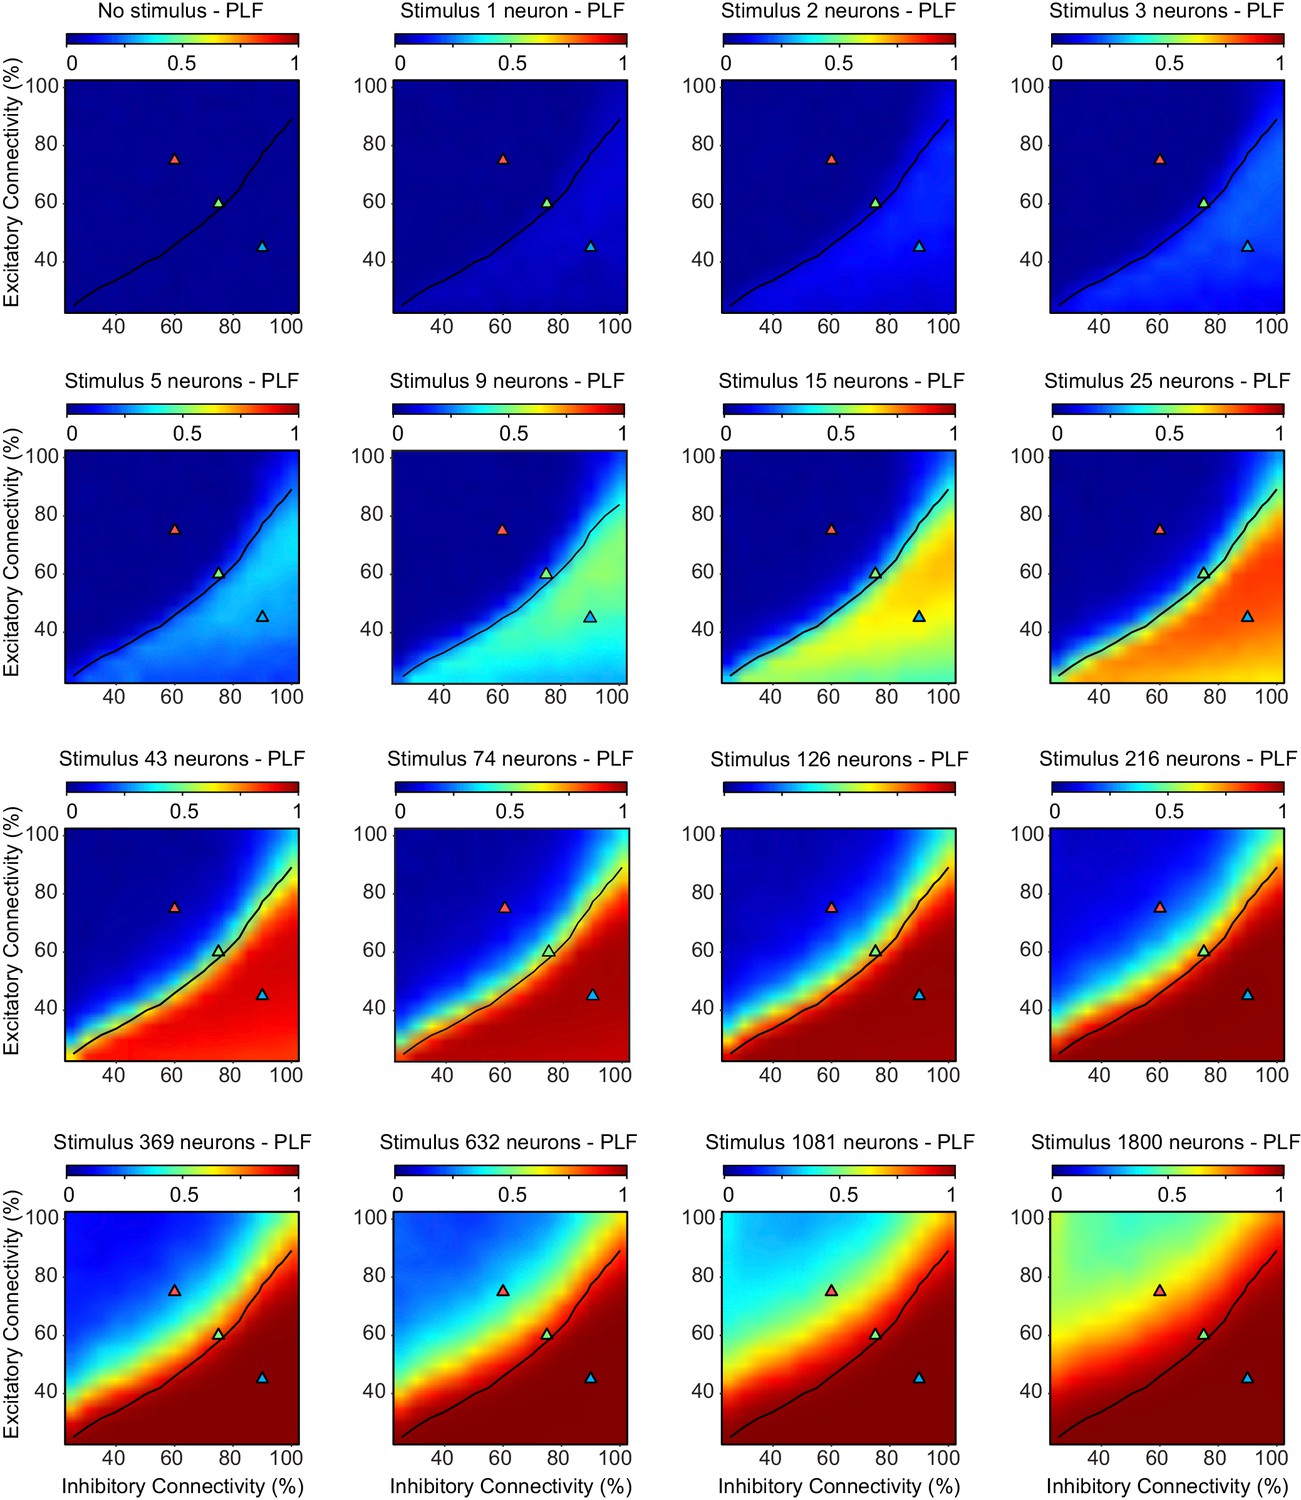
The phase-locking factor depends on excitatory-inhibitory connectivity, and increases with the stimulus size.
We ran 10 network initializations for each excitatory/inhibitory connectivity parameter combination, as well as for the entire range of stimulus sizes. The black line indicates critical neuronal avalanches (), as measured when the networks were not stimulated. The phase-locking factor shows higher values for inhibition-dominated, sub-critical networks, and also for larger stimulus sizes. Note, that for the super-critical regime, even the largest stimulus sizes fail to saturate the phase-locking factor.
Figure 2—figure supplement 2
Critical networks exhibit maximum amplitude regulation at multiple post-stimulus latencies.
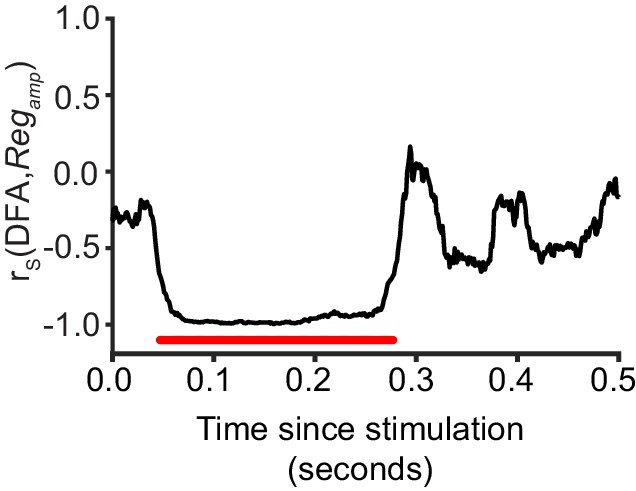
Pre-stimulus amplitude regulation shows a significant correlation with LRTC (DFA) in the latency ranges highlighted with red (Spearman correlation, red = p < 0.001, with cluster-based correction for multiple comparisons). Each data point represents the Spearman correlation between the 20 bins of DFA computed for un-stimulated networks, and the mean Regamp for a five neuron stimulus, aggregated over each bin.
Figure 2—figure supplement 3
Critical networks exhibit robust pre-stimulus amplitude regulation for a wide range of input stimulus strengths.
(A) Replicates Figure 2G for comparison purposes. (B) The dynamic range of pre-stimulus amplitude regulation changes if we increase the input weight by a factor of 8. (C) Subsequently, we ran 10 network initializations for each of the three example networks (sub-critical, critical, super-critical), at different levels of external input weight, ranging from 1/64 to 64 times the baseline value (winput = 0.0085). The dynamic range of pre-stimulus amplitude regulation was calculated as the orders of magnitude over which it shows significant effects. In critical networks, pre-stimulus amplitude regulation occurs over a wider range of stimulus sizes than sub/supercritical networks, regardless of the input weight.
Figure 3 with 3 supplements
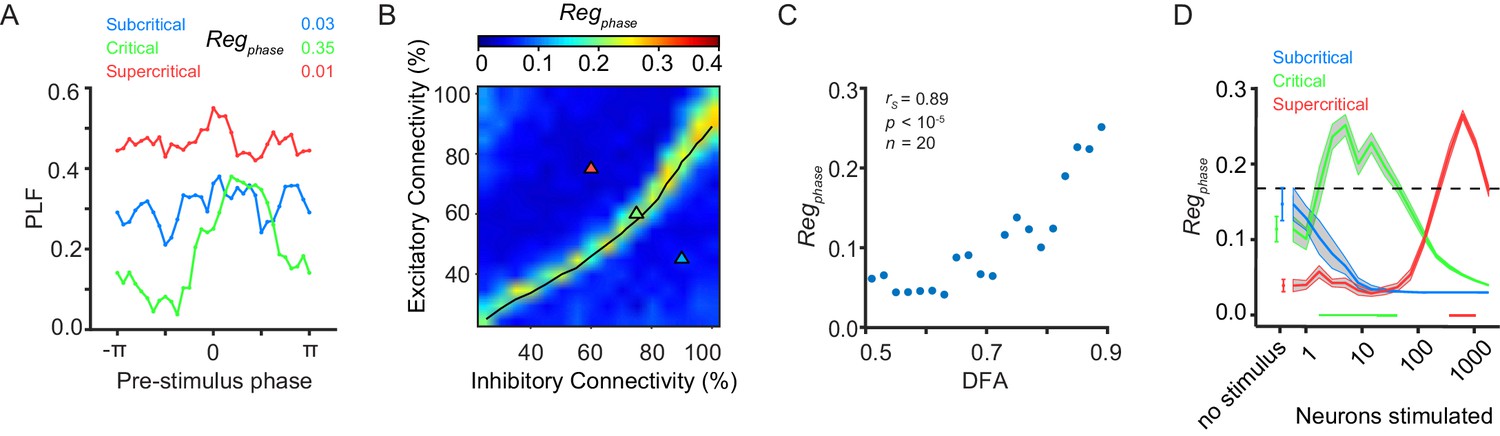
Pre-stimulus phase regulation of response requires critical-state dynamics.
(A) The phase of pre-stimulus oscillations can alter the phase-locking response of a network to a stimulus in the presence of critical oscillations. Trials are split into 32 evenly spaced bins based on pre-stimulus phase (−5 ms) with an equal number of trials in each bin. Phase-locking at 150 ms post-stimulus was calculated for each bin. Pre-stimulus phase regulation of response, Regphase, was calculated based on the post-stimulus PLF distribution of the bins and examples are shown for sub-critical (blue), critical (green) and super-critical (red) networks. Super-critical networks show higher PLF per bin than sub-critical networks because the former have stronger alpha oscillations which carry the phase of alpha oscillations for a longer time into the post-stimulus period without adjusting the phase due to the stimulus. (B) Pre-stimulus phase regulation is dependent on E/I connectivity balance. The black line indicates critical neuronal avalanches, as measured when the networks were not stimulated. Here, shown for a stimulus size of 5 neurons. (C) Pre-stimulus phase regulation is more prominent for stronger LRTC at 150 ms post-stimulus (Spearman correlation). DFA was computed for the unstimulated networks, and Regphase for the same networks, but with five neurons stimulated. Networks binned based on DFA exponent, as in Figure 1F. (D) Critical networks exhibit pre-stimulus phase regulation over the widest range of stimulus sizes. Supercritical networks also show regulation, but only at very high stimulus sizes. mean ± sem corresponding to 10 individual networks with the same excitatory/inhibitory connectivity as the selected sub-critical (blue), critical (green), super-critical (red) networks. Black shaded line is the significance threshold calculated as the 95% percentile of pre-stimulus phase regulation based on bootstrapping of pre-stimulus and post-stimulus phases (see Supplementary information - Materials and methods).
Figure 3—figure supplement 1

Critical networks show maximal phase-locking response on the rising side of the alpha oscillation, and minimal phase-locking response on the falling side of the alpha oscillation.
We ran 10 network initializations for the same 3 parameter combinations used throughout the paper (subcritical A,B, critical C,D, supercritical E,F). For each run we binned the trials in 32 bins based on the pre-stimulus phase at -5 ms, and computed the PLF at 150 ms for each bin. (A,C,E). Each individual colored line corresponds to the PLF distribution across phases for one of the 10 simulations. The black line represents the average across all 10 simulations. As shown before, the pre-stimulus phase regulates the post-stimulus response only for critical networks. For each simulation run, we highlighted the phase bin showing the highest PLF with a red rectangle, and the phase bin showing the lowest PLF with a blue rectangle. The bins with highest/lowest PLF are roughly the same across trials for critical networks (C), but highly spread out for sub/supercritical networks (A,E). (B,D,F) The pre-stimulus phase is calculated on the signal filtered using a one-way filter, which induces a phase shift of 125 ms. To resolve the phase of the oscillation right before the stimulation, we computed, for each of the 10 simulations, the average of the network signal (unfiltered), across trials belonging to the phase bin with the highest PLF (red) and the phase bin with the lowest PLF (blue). We included in our analysis stimulation trials from all 10 simulations. To isolate variation in pre-stimulus phase from the baseline level of activity, which differs between sub/super/critical networks, we standardized the data. We subtracted from the average across simulation runs, the mean of activity calculated between -50 and 0 ms, and then we divided by the standard deviation of the activity from the same time interval. For critical networks (D), there is a clear differentiation: on trials where the phase-locking response is strongest (red), the stimulus arrives half-way through the rising side of the alpha oscillation (where the phase is approximately 0). On trials where the phase-locking is weakest (blue), on the other hand, the stimulus arrives half-way through the falling side of the alpha oscillation (where the phase is approximately ). Subcritical and supercritical networks do not show such a clear differentiation, thereby illustrating that pre-stimulus phase regulation of stimulus response requires critical-state dynamics.
Figure 3—figure supplement 2
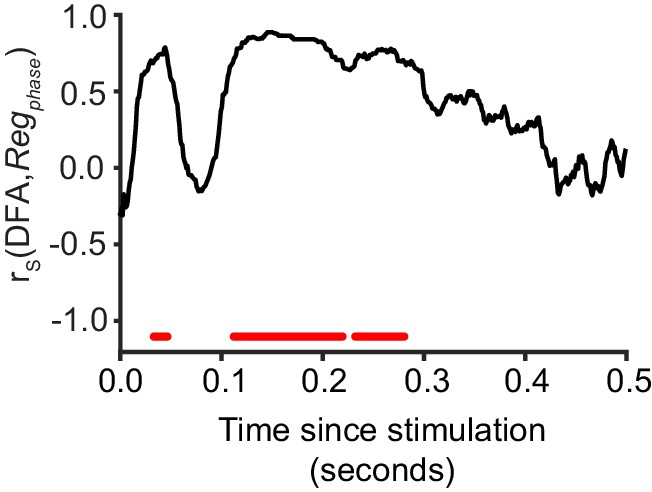
Critical networks exhibit maximum phase regulation at multiple post-stimulus latencies.
Pre-stimulus phase regulation shows a significant correlation with LRTC (DFA) in the latency ranges highlighted with red (Spearman correlation, red = p < 0.001, with cluster-based correction for multiple comparisons). Each data point represents the Spearman correlation between the 20 bins of DFA computed for un-stimulated networks, and the mean Regphase for a five neuron stimulus, aggregated for each bin.
Figure 3—figure supplement 3
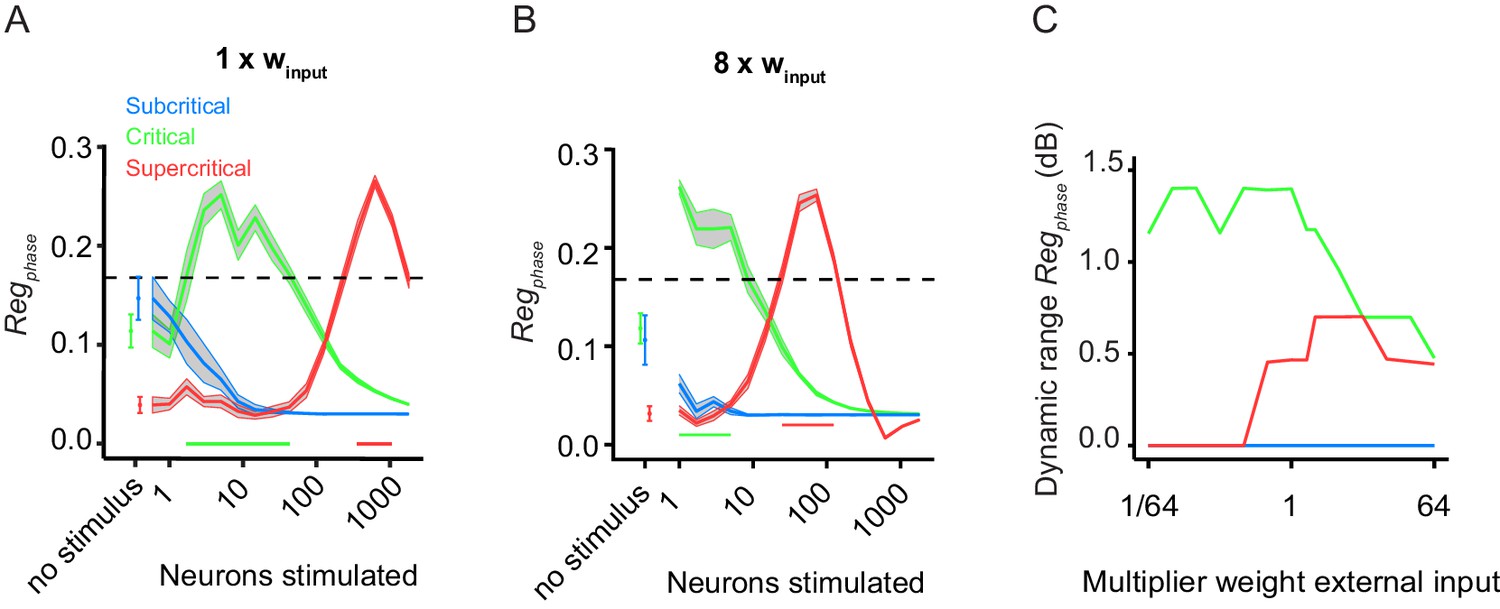
Critical networks exhibit maximum phase regulation for a wide range of input-stimulus strengths.
(A) Replicates Figure 3D for comparison purposes. (B) The dynamic range of pre-stimulus amplitude regulation changes if we increase the input weight by a factor of 8 (B). (C) Subsequently, we ran 10 network initializations for each of the three example networks (sub-critical, critical, super-critical), at different levels of external input weight, ranging from 1/64 to 64 times the baseline value (winput = 0.0085). The dynamic range of pre-stimulus phase regulation was calculated as the orders of magnitude over which it shows significant effects. In critical networks, pre-stimulus phase regulation occurs over a wider range of stimulus sizes than sub/supercritical networks, regardless of the input weight.
Figure 4
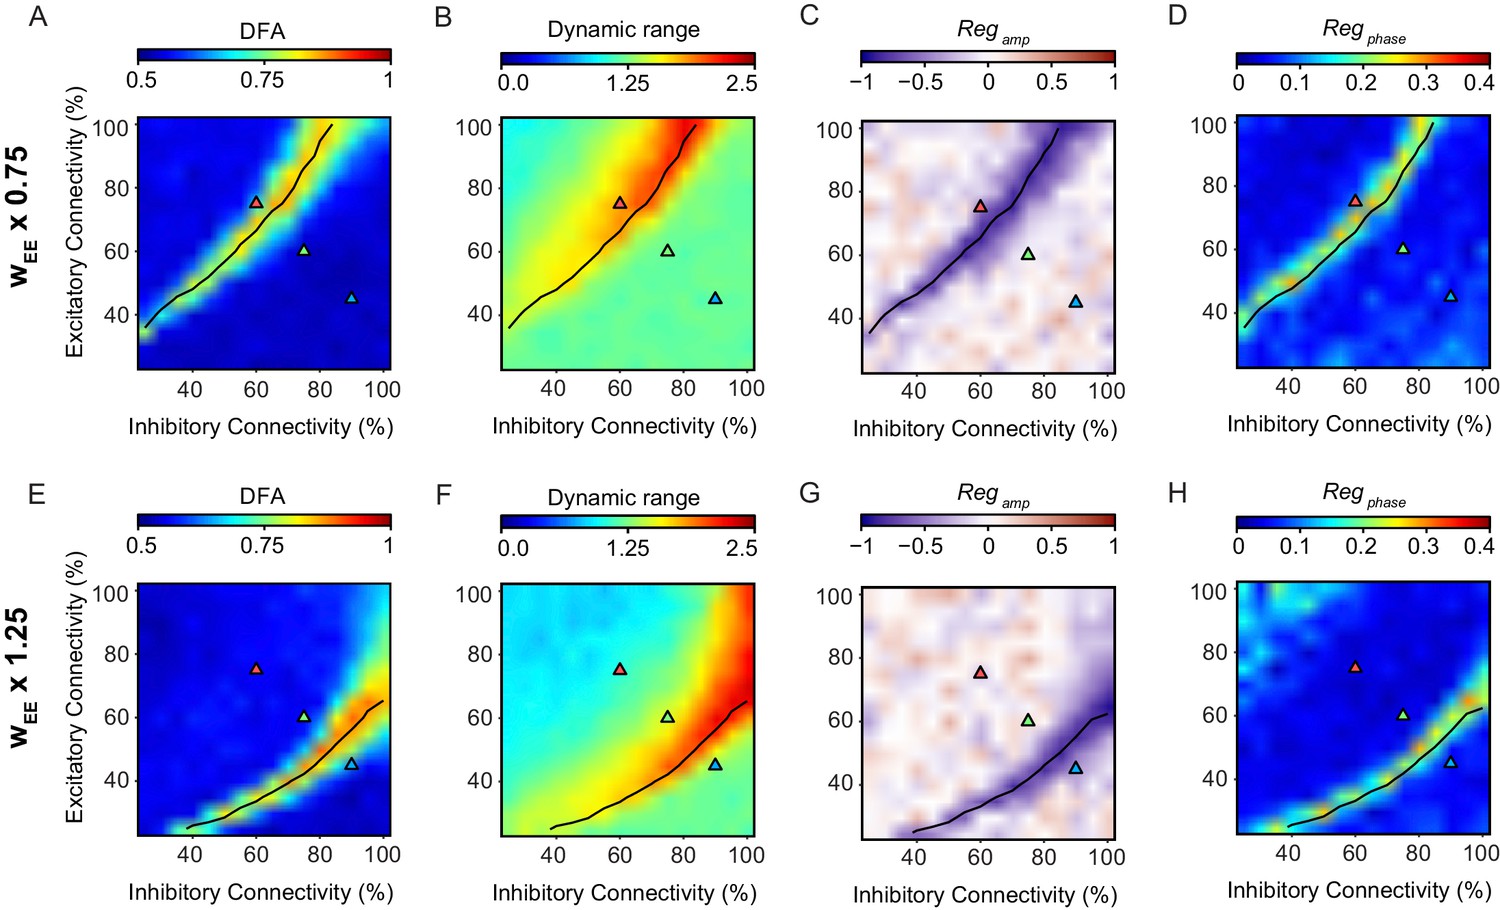
The relationship between criticality and network versatility is robust to changes in the strength of excitatory connections.
Phase-space plots of LRTC (A,E), Dynamic Range (B,F) Amplitude Dependence (C,G), and Phase Dependence (D,H), for networks with the weight of the excitatory to excitatory connections (wEE) multiplied by a factor of 0.75 (top row) or 1.25 (bottom row). black line indicates critical neuronal avalanches, as measured when the networks were not stimulated.
Author response image 1
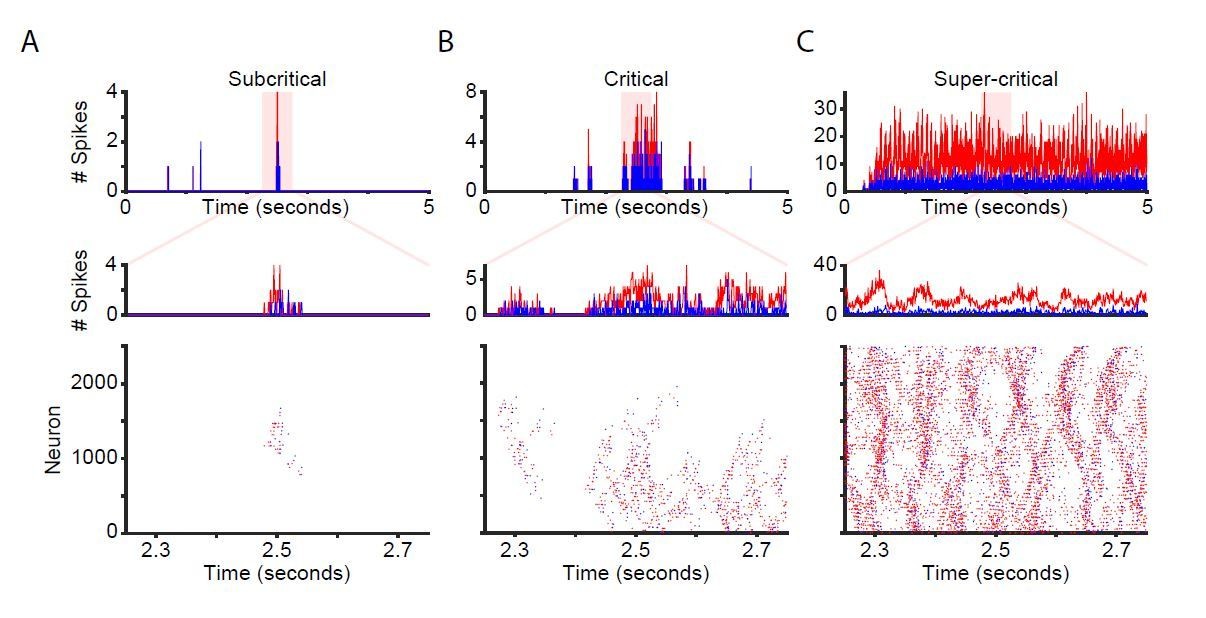
Network time-series and raster plots for unstimulated networks.
Time-series and raster plots for an example sub-critical (A), critical (B), and super-critical (C) network. (Top and middle rows) Network time-series for excitatory (red) and inhibitory (blue) neurons. (Bottom) Raster plot of activity from highlighted region in top row.
Author response image 2
Change in firing rate corresponds to the phase of the alpha oscillation for networks with strong alpha oscillations in the absence of stimulation.
(A) Trial-averaged baseline-corrected firing rates corresponding to the largest decrease (blue), no substantial change (green), and highest increases (red) in firing rate. Intervals for calculating pre-stimulus baseline and post-stimulus firing rate are shaded in grey. (B) PLF at 150 ms post-stimulus (red shaded line) is high for both the lower and the higher firing-rate percentile bin, in the absence of any stimulation. Horizontal dashed line represents PLF significance threshold (see Materials and methods).
Author response image 3
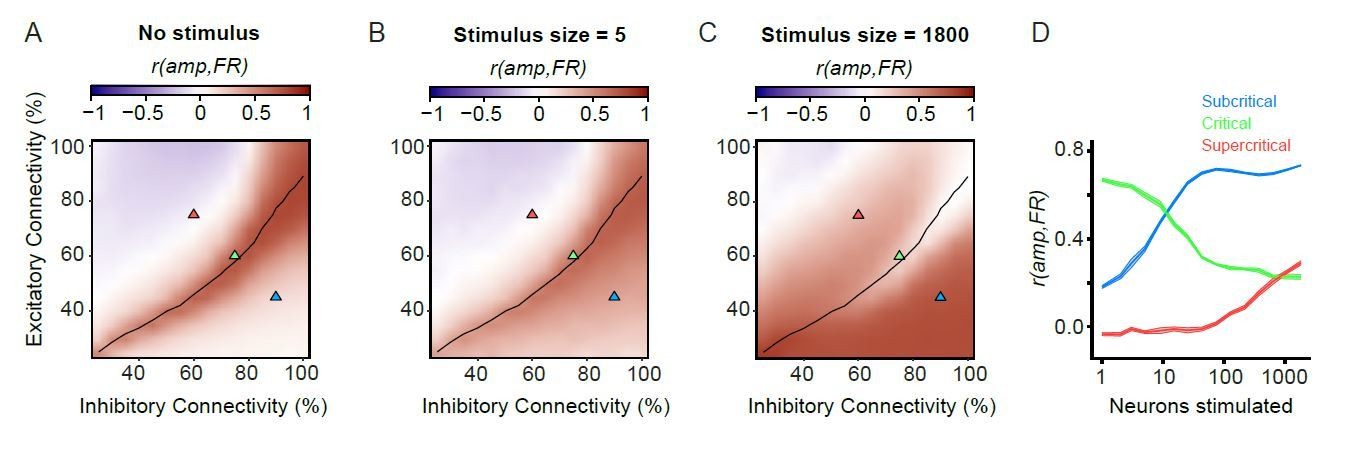
Firing rates and amplitude of alpha oscillations are not always coupled.
(A) For unstimulated networks, alpha-oscillation amplitude and firing rate are only strongly coupled in the critical regime. Pearson correlation of mean amplitude and firing rate calculated on 100 ms windows for unstimulated networks. (B,C) Coupling between post-stimulus oscillatory amplitude and firing rate is dependent on stimulus size. Pearson’s correlation coefficient between the firing rate (1–50 ms), and oscillation amplitude for the same time interval. For the weak stimulus (B, n = 5), the critical networks show stronger coupling between firing rate and amplitude compared to their sub/supercritical counterparts. However, for the strong stimulus (n = 1800) critical networks show weaker coupling between firing rate and amplitude, compared to their sub-/super-critical counterparts. (D) Coupling of post-stimulus amplitude and firing rate for the 3 example networks highlighted with triangles on the phase space (A-C), for the entire range of stimulus sizes.
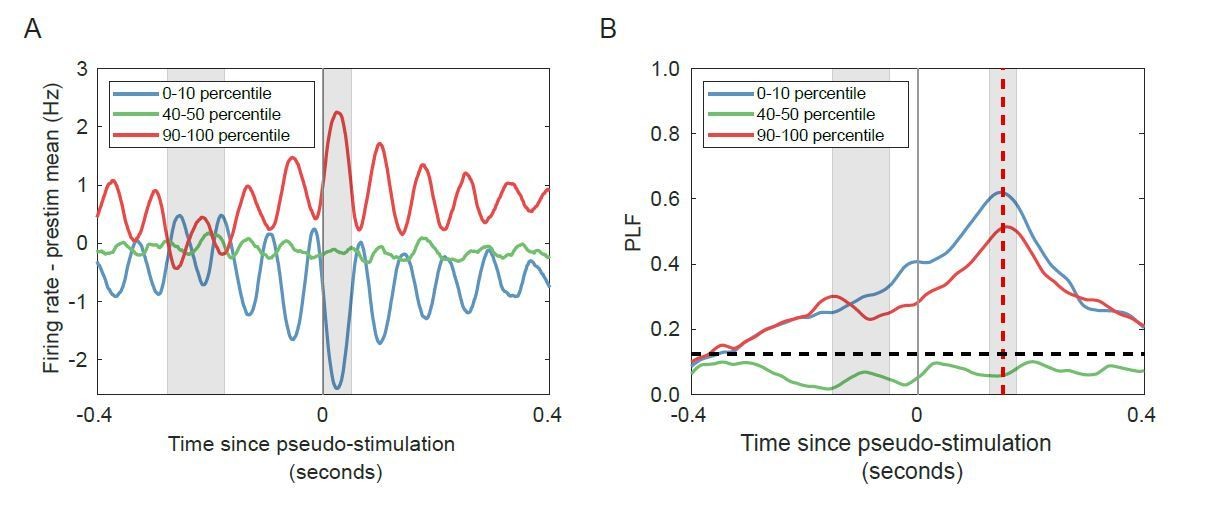
Author response image 4

Networks with strong oscillatory activity show regulation of phase-locking by pre-stimulus firing rate, even when the networks are not stimulated.
(A) Trial-averaged amplitude for unstimulated networks, with trials split into lowest (blue), medium (green) and highest (red) pre-stimulus (grey window) oscillation amplitude. (B) No significant phase-locking for trials used in (A) in the unstimulated condition. (C) Trial-averaged firing rate for unstimulated networks, with trials split into lowest (blue), medium (green) and highest (red) pre-stimulus (grey window) firing rate. (D) Significant phase-locking for trials used in (C) in the unstimulated condition. Red dashed lines indicate post-stimulus time (equivalent to 25 ms post-stimulus corrected for filter effect), horizontal black dashed lines indicate PLF significance threshold (see Materials and methods).
Tables
Key resources table
| Reagent type (species) or resource | Designation | Source or reference | Identifiers |
|---|---|---|---|
| Software, algorithm | Brian Simulator | https://briansimulator.org | RRID:SCR_002998 |
| Software, algorithm | MATLAB | https://www.mathworks.com/products/matlab | RRID:SCR_001622 |
| Software, algorithm | circular statistics | https://mathworks.com/matlabcentral/fileexchange/10676-circular-statistics-toolbox-directional-statistics | RRID:SCR_016651 |
| Software, algorithm | R Project for Statistical Computing | http://www.r-project.org/ | RRID:SCR_001905 |
Additional files
Download links
A two-part list of links to download the article, or parts of the article, in various formats.
Downloads (link to download the article as PDF)
Open citations (links to open the citations from this article in various online reference manager services)
Cite this article (links to download the citations from this article in formats compatible with various reference manager tools)
Pre-stimulus phase and amplitude regulation of phase-locked responses are maximized in the critical state
eLife 9:e53016.
https://doi.org/10.7554/eLife.53016


